Abstract
Despite the declining hunger in Central Asia, food insecurity remains an important issue due to the dry climate. Taking Kazakhstan, Uzbekistan, Kyrgyzstan, Turkmenistan, and Tajikistan as examples, this study assesses their land-water resources carrying capacity in 1999, 2009, and 2018, on the premise that agricultural water and farmland are spatially matched based on the “buckets effect”, using the ecological footprint and water footprint methods. Results show the following: (1) the total farmland area in Central Asia is sufficient to achieve food self-sufficiency; the available farmland area is 2.45 times that of the farmland required for self-sufficiency in 1999, which decreased to 1.71 times in 2009, but slightly increased to 1.92 times in 2018. Specifically, Kazakhstan maintains a surplus of more than 15 × 106 ha in farmland, while the other 4 countries could not achieve self-sufficiency. (2) The water resources pressure rises; the available agricultural water resource (AAWR) in Central Asia is 3.07 times that of the water demand for agricultural irrigation (WDAI), and 3.06 times that of the water demand for irrigation and environmental purification (WDIEP) in 1999, which decreased to 1.69 times of WDAI and to 1.60 times of WDIEP in 2018. Tajikistan has the highest level of water surplus, followed by Kyrgyzstan and Kazakhstan. Turkmenistan and Uzbekistan do not have enough water to sustain agricultural production. (3) The trend of land-water resources carrying capacity declines in Central Asia. In 1999, 2009, and 2018, the land-water resources could support the population’s food demand in this region when only considering farmland matched with WDAI. However, the population carrying capacity deficit would emerge if we considered the matching farmland with WDIEP.
1. Introduction
Food security, as a global issue, has plagued the survival and development of humankind. The United Nations has taken achieving food security (zero hunger) as an essential goal of the Sustainable Development Goals (SDGs) for the next 10 years. However, the world is at a juncture. On the one hand, the global hunger population has increased under the shadow of the COVID-19 pandemic. It was projected by FAO that about 768 million people in the world would face hunger in 2020, around 118 million more than in 2019 [1]. On the other hand, natural resources (e.g., land and water) are key inputs for food production, but they are increasingly scarce in many parts of the world. The effects of resources depletion can be clearly observed in the case of freshwater availability. It is expected that, by 2025, 1.8 billion people will experience absolute water scarcity, and two-thirds of the world’s population will be living in water-stressed conditions [2]. A similar situation applies to the land system. According to the Global Land Assessment of Degradation (GLASOD), nearly 2 billion hectares worldwide (22 percent of all croplands, pasture, forest, and woodland) have been degraded since the 1950s [3,4].
Land-water resources scarcity in all its forms is a threat to food security, especially in dryland areas of developing countries [5]. Worldwide, drylands cover about 40 percent of the earth’s land surface and are inhabited by more than 2 billion people, approximately one-third of the world’s population (about 90% live in developing countries) [3]. Cultivation in dryland areas has a relative disadvantage, such as lower soil moisture, greater reliance on irrigation systems, and greater vulnerability to climate change [6]. Thus, in line with the 2030 agenda (e.g., SDG-6, SDG-7, SDG-12, SDG-13), sustainable agriculture is encouraged in those vulnerable ecosystems (e.g., dryland). To be specific, it is imperative to sustainably use and manage land-water resources to deal with water scarcity and pollution, to strengthen cooperation on desertification, dust storms, land degradation, and drought, and to promote food production and food security [3,7]. In practice, the ecosystems carrying capacity (ECC) can reflect the sustainable development of a certain region and has been widely used as a decision-making tool for the appropriate use and management of nature resources [8,9,10].
Central Asia is a typical temperate arid region, located in the hinterland of Eurasia, including Kazakhstan, Kyrgyzstan, Tajikistan, Turkmenistan, and Uzbekistan [11]. Over the past 20 years, food security in this region has been improved through economic reforms and development. The number of undernourished people fell from 6.5 million in 2005 to 2 million in 2019, and the prevalence of undernourishment fell from 11% to 8.3% [12]. However, food insecurity remains a major challenge for this region due to insufficient agricultural water, farmland, and other productive resources. According to the Food and Agriculture Organization (FAO), the total amount of water resources in Central Asia is 221.3 × 10⁹ m3, mostly distributed in alpine glaciers and deep groundwater. Kyrgyzstan and Tajikistan, located in the upper reaches of Central Asia, have nearly 4/5 of Central Asia’s water resources. In contrast, Kazakhstan, Uzbekistan, and Turkmenistan, located in the middle and lower reaches of rivers, have less water than the other two countries. The land area of Central Asia is 392.679 × 10⁶ ha, 92% of which is pasture and unexploited land, and only 8% is arable land. Tajikistan and Kyrgyzstan are mountainous countries with few plains and lowlands, while Kazakhstan, Turkmenistan, and Uzbekistan have more plains and lowlands. With the economic development, population growth, and improvement of living standards in Central Asia, the quantity and structure of consumption of major agricultural products have changed. The demand for agricultural water and farmland resources has also changed accordingly. Therefore, it is crucial to study the self-sufficiency of major agricultural products in these five countries from the perspective of matching land-water resources. It contributes to the overall arrangement of agricultural production and international trade policies and is vital to coordinate the relationship between ecosystem sustainability and food security in Central Asian countries.
Recent studies have focused on Central Asia’s water resources, farmland resources, and food security from different perspectives. First, regarding water resources and agricultural production, the focus is on hydrology and water availability [13,14], aquatic and riparian ecosystems [15], and water use and management—including irrigation, reservoir management, and hydropower development [16,17,18]. Second, regarding farmland and agricultural production, the focus is on the land institutional reform [9,10], land degradation and human health [19,20], and arable land use and its influencing factors [21,22]. Third, regarding food security, the discussion focuses on food security policies, trends in the supply and demand of agricultural products, agricultural trade, and the potential for international agricultural cooperation for Central Asian countries [23,24]. However, most studies have only focused on environmental resources, lacking an integrated assessment of the carrying capacity based on food production and land-water resources. Moreover, other studies mostly evaluate the water demand for agricultural irrigation (WDAI), ignoring the water demand for environment purification (WDEP). Therefore, it is impossible to objectively assess the total water demand for irrigation and environment purification (WDIEP) in Central Asia. Lots of research on food security mainly focuses on grains (e.g., wheat), while ignoring other agricultural products, and thus fails to fully account for the overall agricultural consumption in Central Asia. As a result, it is of great importance to adequately measure the population carrying capacity based on the matching status between demand for farmland and agricultural water and the actual demand for main agricultural products in Central Asia.
By taking the sustainable agricultural development as the premise, this study aims to calculate the demand for main agricultural products of the resident population in each country under the average food consumption level in 1999, 2009, and 2018. Then, we evaluate the balance of supply and demand of agricultural products by matching the status of agricultural land-water resources in each country, followed by a discussion on the pathways to sustainable development of agriculture. This study can offer insight into the agricultural production potential of Central Asia and provide evidence for improving regional food security policies.
2. Data and Methodology
Ecological carrying capacity (ECC) is an ecological theory that assesses the maximum population with a certain standard of living and the intensity of social and economic activities maintained by the ecosystem in a specific country or region. In practice, it has been widely used to assess the potential and pressure of the agricultural self-sufficiency [6,7]. In this theory, different methods from multiple dimensions, such as the evaluation index system method, ecological footprint method, water footprint, and the system dynamics method, have been applied to approach the ECC [8,9]. However, the ecological footprint and water footprint can be simultaneously used to estimate the regional ECC, given the two methods can be integrated. The calculation methods are described in the following subsections.
2.1. Agricultural Products Consumption in Central Asia
In general, the consumption of agricultural products includes five aspects: direct human consumption, industrial use, feed, seeds, and losses [25,26]. Among them, a considerable proportion of agricultural products are used to manufacture industrial products and raise livestock and poultry. They are eventually converted into food that people can consume. Therefore, this study focuses on the consumption of food, seeds, and losses. The formula is expressed as Equation (1).
where is the total demand for food, j, in the country, i; is the human consumption of food, j, in the country, i, j = 1, 2, …n, n refers to the type of food; refers to the seed consumption of food, j, in the country, i, j = 1, 2, …m, m refers to the type of crops; is the amount of loss of food, j, in the country, i, j = 1, 2, …n. In this context, food losses include transportation, storage, and other kinds of losses. Specifically, we classified vegetable oil and sugar as manufactured products and thus we included the demand for raw materials of these products in . The conversion rates of rapeseed to vegetable oil (40%), cottonseed to vegetable oil (12%), and sugar beet to sugar (12%), as suggested by the statistical data, are used to calculate the demand for raw materials [27,28].
2.2. Demand of Land-Water Resources for Food Consumption in Central Asia
2.2.1. Agricultural Farmland Demand
Farmland is an important productive resource for agricultural production. The ecological footprint reflects the ecologically occupied space of the population in each area at a certain level of quality of life. It is usually expressed in terms of land area. In this study, the ecological footprint method is used to calculate the total farmland demand in each country based on per capita food consumption level in different periods and the average national yields (world yields) of various agricultural products. The formula is expressed as Equation (2).
where is the total farmland demand in the country, i; is the average yield of the Central Asia countries (or the world) of food category, j; is the type of food, including 13 kinds of crops and 5 kinds of livestock products. The production of livestock products requires a certain amount of both farmland and grassland, and this study refers to Xie et al. (2009) to calculate only the farmland area [29].
2.2.2. WDAI and WDEP
Water is another important factor for agricultural production in Central Asia. On the premise that ensures average agricultural production and environmental purification, water consumption for sustainable agricultural production mainly includes two components—WDAI and WDEP in farmland. WDAI can be calculated as Equations (3) and (4).
where is the total water demand for sustainable agricultural production in the country, i. is the WDAI for food production in the country, i, which can be calculated according to Equation (4). is the water consumption per unit of production in category j, with specific parameters referring to the relevant literature [18,28,30]. is the WDEP for food production in the country, i, which can be calculated as Equation (5), as follows:
Considering that the environmental concerns of farmland and water mainly come from the excessive discharge of nutrients such as nitrogen, phosphorus, and potassium, most existing studies use the combination of indicators for total nitrogen content, total phosphorus content, and chemical oxygen demand of water surplus or the load of individual indicators to characterize the carrying capacity of farmland water environment [31,32,33]. So, in this study, the maximum excess N load of water surplus is used as a proxy for the carrying capacity of the farmland water environment, since N is the most important nutrient of fertilizers.
In Equation (4), is the nitrogen content of livestock manure discharged in the country, i. It is calculated based on the information of the total livestock quantity and the corresponding total amount of manure produced. Then, the nitrogen content of livestock manure is calculated by multiplying the total amount of manure by the excretion coefficient of each type of the livestock. According to the literature, the excretion coefficients of cattle, sheep, and poultry are 0.351%, 1.014%, and 1.032%, respectively [34]. is the nitrogen content of chemical fertilizers used in the country, i, which is the sum of the amount that nitrogen fertilizers and compound fertilizers are discounted as pure nitrogen (it is usually 1/3 of the net amount of compound fertilizer). is the soil nitrogen accumulation amount in the country, i, which can be calculated by the product of the total sown area of various crops and the nitrogen accumulation amount per unit area. is the amount of nitrogen consumed in the crop production in the country, i, which is obtained by multiplying the annual output of a certain grain by the nitrogen consumption per 100 kg of the grain. is the threshold of the water demand for environmental purification. According to the European Union, the maximum threshold value is 50 mg/L, and the threshold parameter is set by 0.4 in this study. When the parameter of is above 0.4, it means the nitrogen content of water begins to pose a threat to the environment. Otherwise, the nitrogen content does not jeopardize the farmland environment [35]. When the parameter is negative, there is no excess water demand for diluting the nitrogen.
2.3. Supply–Demand Balance of Land-Water Resources in Central Asia
In terms of environmental sustainability, the carrying capacity of agricultural resources in each country can be estimated by the amount of available farmland or water resources. For the sustainable development of agriculture, it is necessary to ensure that both farmland and water resources are not overloaded. Therefore, the study evaluates the environmental carrying capacity of agricultural resources in each region from two dimensions: farmland surplus and deficit and water resource surplus and deficit.
(1) Surplus and deficit of farmland:
In Equation (6), is the surplus and deficit of farmland (×106 ha) in the country, i. There will be a surplus of farmland area if the value is positive. Otherwise, there will be a deficit. is the total amount of farmland (×106 ha) in the country, i. Total farmland resources are defined as the land area used for growing crops without taking pastures area into account [28].
(2) Surplus and deficit of water:
This study divides surplus and deficit of water resources carrying capacity into two dimensions. One is whether the WDAI can be met. The other is whether WDIEP can be met.
The status of WDAI can be reflected by Equation (7), as follows:
The status of WDIEP can be reflected by Equation (8), as follows:
In Equations (7) and (8), and refer to the surplus and deficit of agricultural water resources (×108 m3) in the country, i, respectively. When the value is positive, it indicates that the country has a surplus of agricultural water resources; otherwise, the country has a deficit of agricultural water resources. is the total available agricultural water resource (AAWR) in the country, i, which is calculated by subtracting industrial water consumption, domestic water consumption, and other water (e.g., artificial ecological replenishment) from total water resources in the country, i. Chen et al. (2015) defined the total water resources (also called manageable water resources or water development potential) as the sum of surface water and groundwater, and minus the repetitively calculated amount of water [11]. Li and Huang (2015) found that 56.9% of the water demand for growing crops is from soils (called green water) and 43.1% is from agricultural irrigations (called blue water). Hence, in this study, the actual blue water demand for growing crops is assumed to be 43.1% of the total water demand, i.e., the coefficient is taking a value of 0.431 [36].
2.4. The Population Carrying Capacity Based on Matching Land-Water Resources in Central Asia
The surplus and deficit of the agricultural water and farmland resources in Central Asia can be measured by the population size as a unified dimension. As water and farmland are necessities of agricultural production, the surplus or deficit of each country’s available land-water resources determines the number of people who can be fed, according to the “Buckets effect”.
The model for matching land-water resources can be defined as two scenarios: Scenario A and Scenario B. Scenario A is the population carrying capacity based on the combination of farmland demand and WDAI. The formula is expressed as Equation (9), as follows:
Scenario B is the population carrying capacity based on the combination of farmland demand and WDIEP. The formula is expressed as Equation (10), as follows:
When and are positive, these values mean the extra population (×106 people) that the agricultural water and farmland resources of country, i, can feed besides its current domestic population. Otherwise, they represent the excessive population (×106 people) that the agricultural water and farmland resources in the country, i, cannot feed. is the per capita demand for farmland (ha/person) in the country, i, which is calculated by dividing the total farmland demand for agricultural product consumption by the total population in the country, i, as the agricultural self-sufficiency at the national level is the central focus of this study. is the per capita demand for agricultural production water in the country, i (m3/person), which can be calculated by dividing the total demand of agricultural production water for agricultural product consumption by the total population in the country, i.
2.5. Data Source
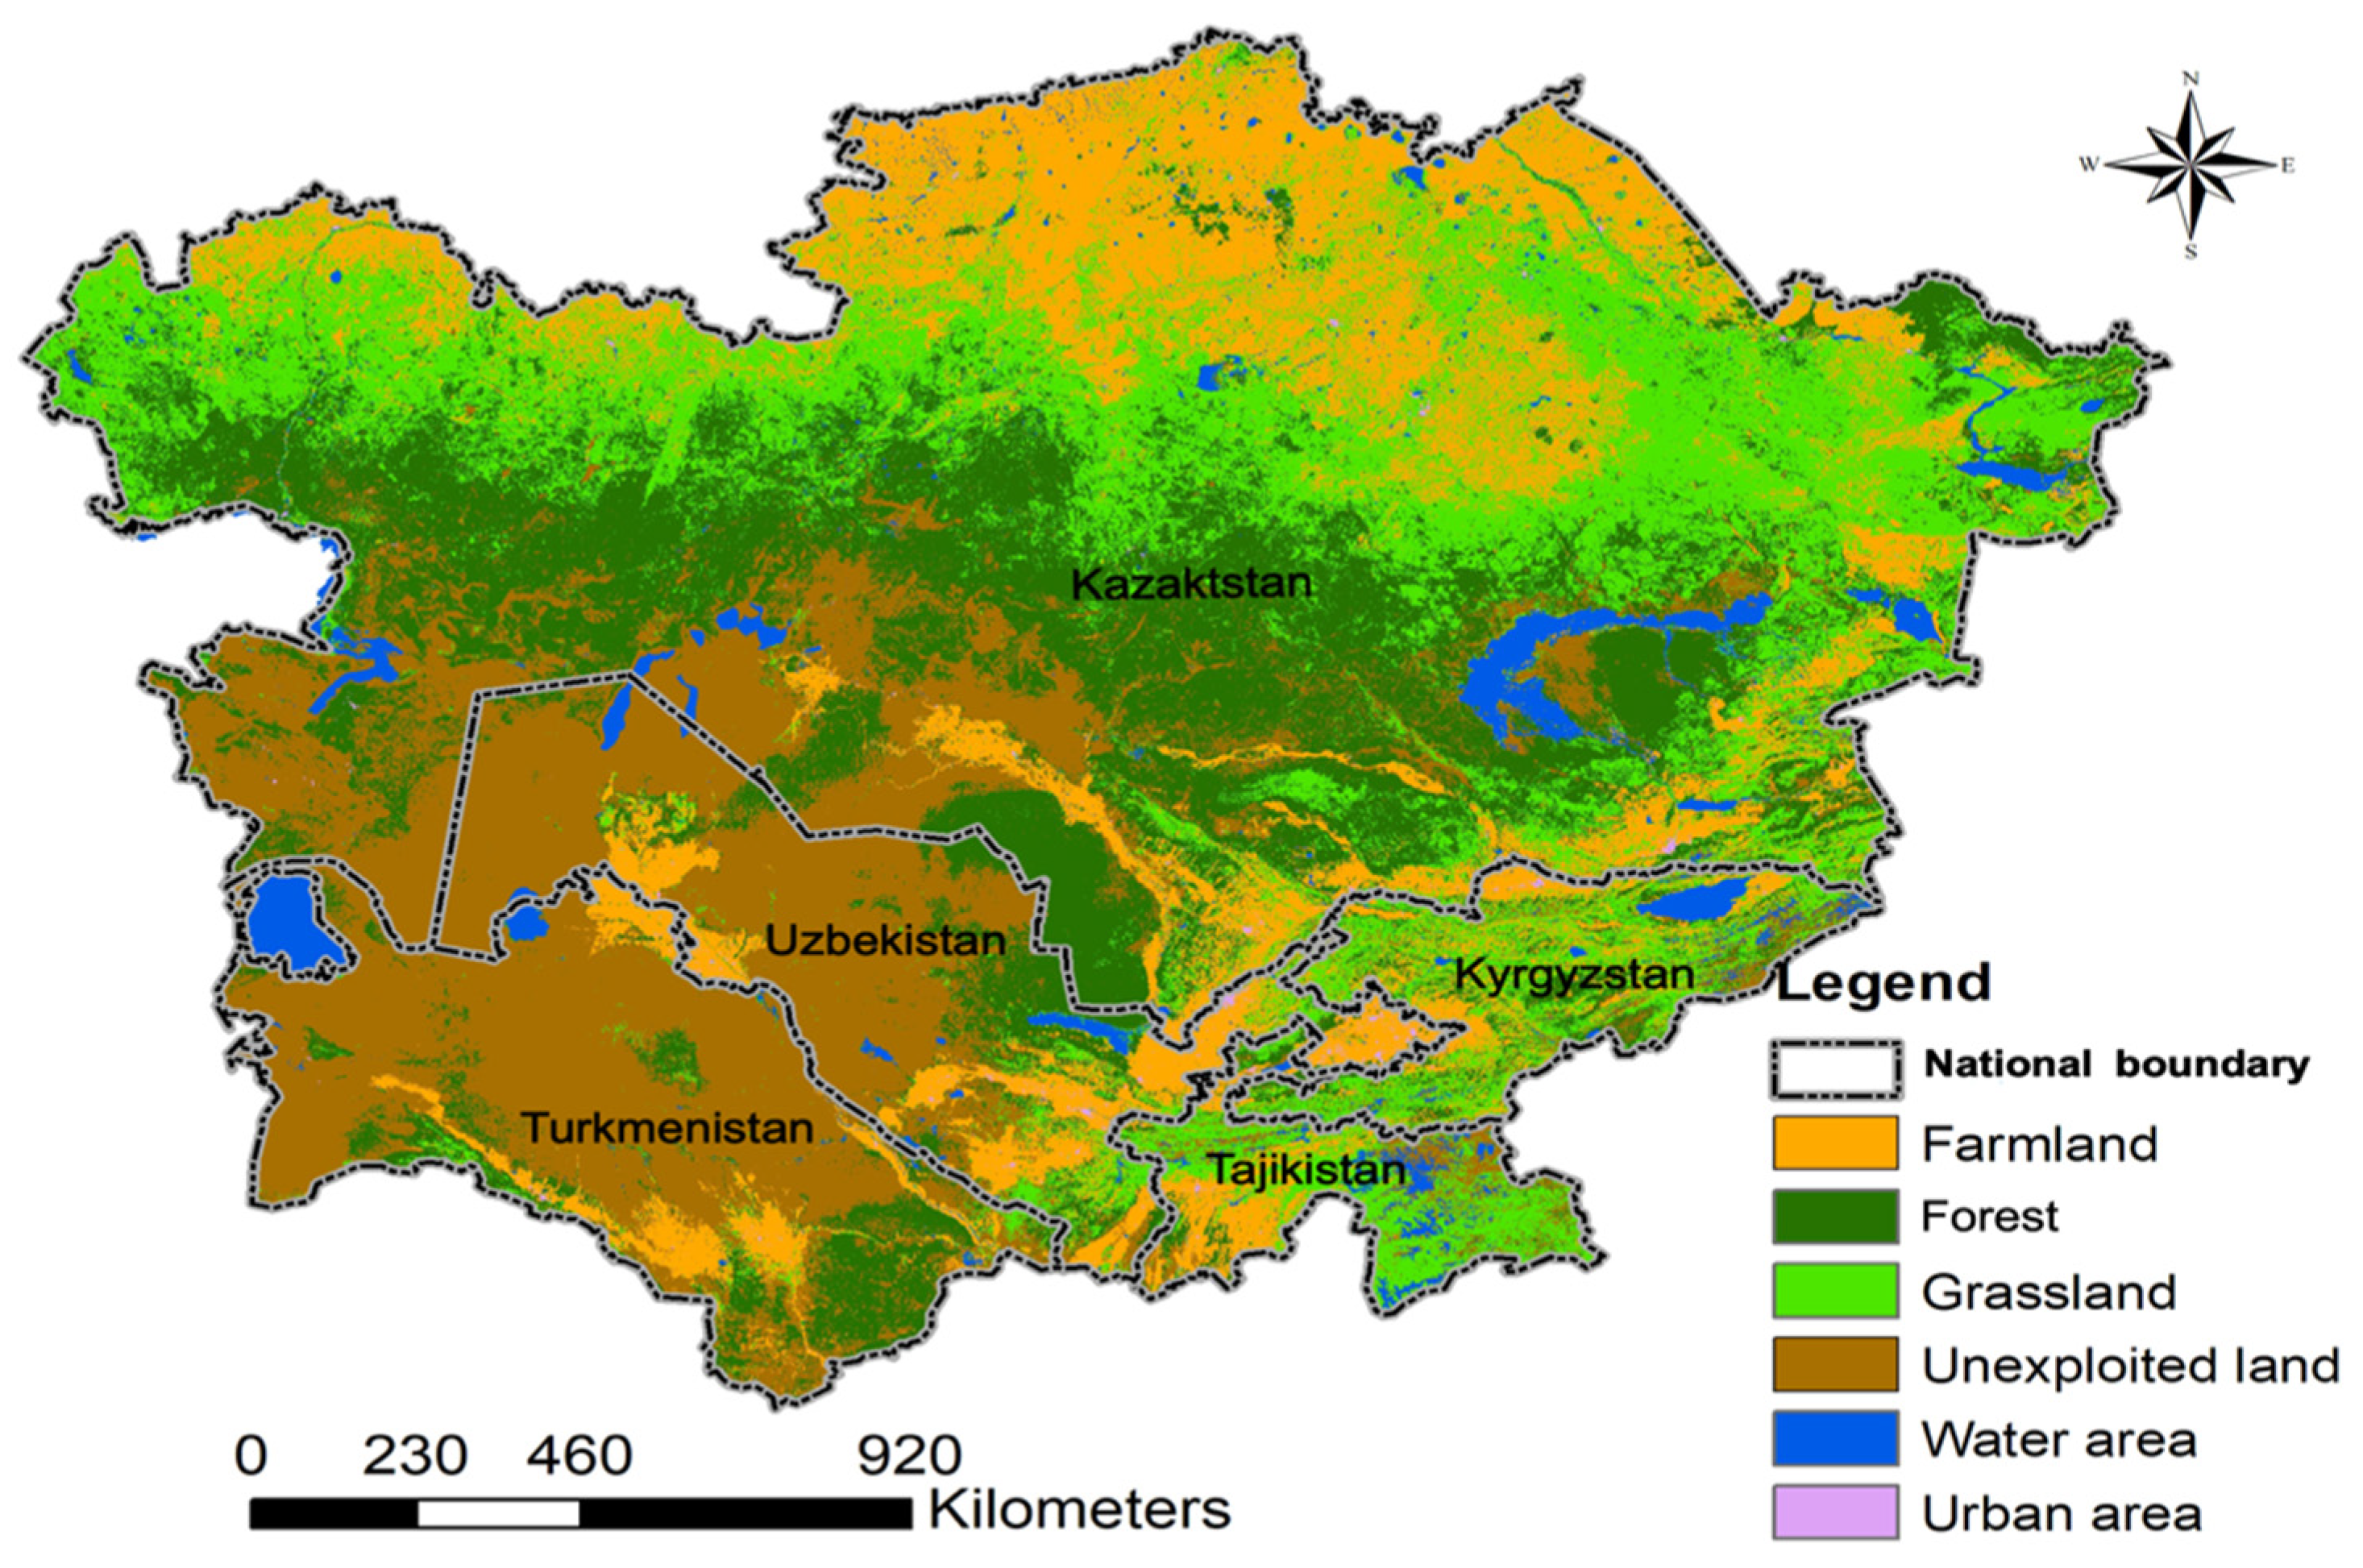
The five Central Asian countries became independent countries in 1991, when the former Soviet Union disintegrated. Since then, these countries experienced civil wars from 1992 to 1997 [12,19]. Considering the availability of data and the accuracy of the model estimation, this study uses data from the five countries and world averages in 1999, 2009, and 2018. Due to the arid climate, unexploited land accounts for a considerable proportion of the total land area. The agricultural land is basically comprised of farmland and grassland in Central Asia. Crops and animals are equally important foods for people in this region (Figure 1 and Figure 2). Therefore, thirteen kinds of crops and five kinds of livestock products mainly consumed by Central Asian residents were selected, including wheat, barley, maize, rice, potatoes, cottonseed, rapeseed, sugarcane, tomatoes, onions and other vegetables, apples and other fruits, beef, lamb, poultry, eggs, and milk. Although raising livestock requires hay from the grassland and other types of feed from farmland, we ignored the effect of grassland and only calculated the farmland demand, given the data availability.
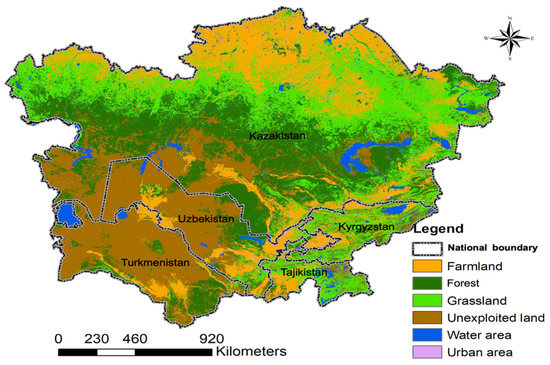
Figure 1.
Land use status of the five countries in Central Asia. Source: Esa, C. (2020). Data set of land use types of five Central Asian countries (2015). National Tibetan Plateau Data Center, 2020.
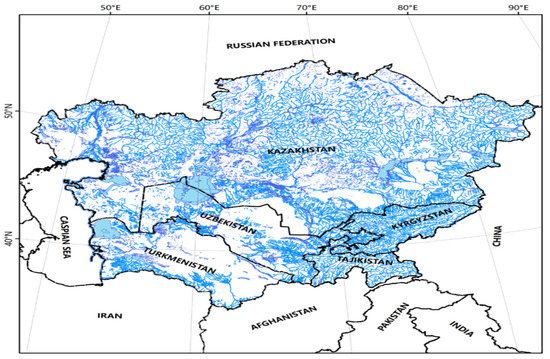
Figure 2.
River system distribution of the five countries in Central Asia. Source: Esa, C. (2020). Data set of land use types of five Central Asian countries (2015). National Tibetan Plateau Data Center, 2020.
The production and consumption data of major agricultural products in each country were obtained from the FAO database (http://www.fao.org/faostat/zh/#data, accessed on 18 June 2021), including the sown area of crops, total production of crops and animal products, the yield of crops and animal products per unit, seeds, stocks of main agricultural products, full stores of main livestock products, and per capita consumption of main crops and livestock products. Data of agricultural water, farmland, fertilizers, and population in each country (or world averages) were obtained from the World Bank (https://data.worldbank.org, accessed on 18 June 2021) and the FAO Global Water and Agriculture Information Database (http://www.fao.org/aquastat/statistics/query/index.html?lang=en, accessed on 18 June 2021). The parameters used to calculate farmland and water demand were collected from the aforementioned literature.
3. Results
3.1. Supply–Demand Balance Status of Farmland in Central Asia
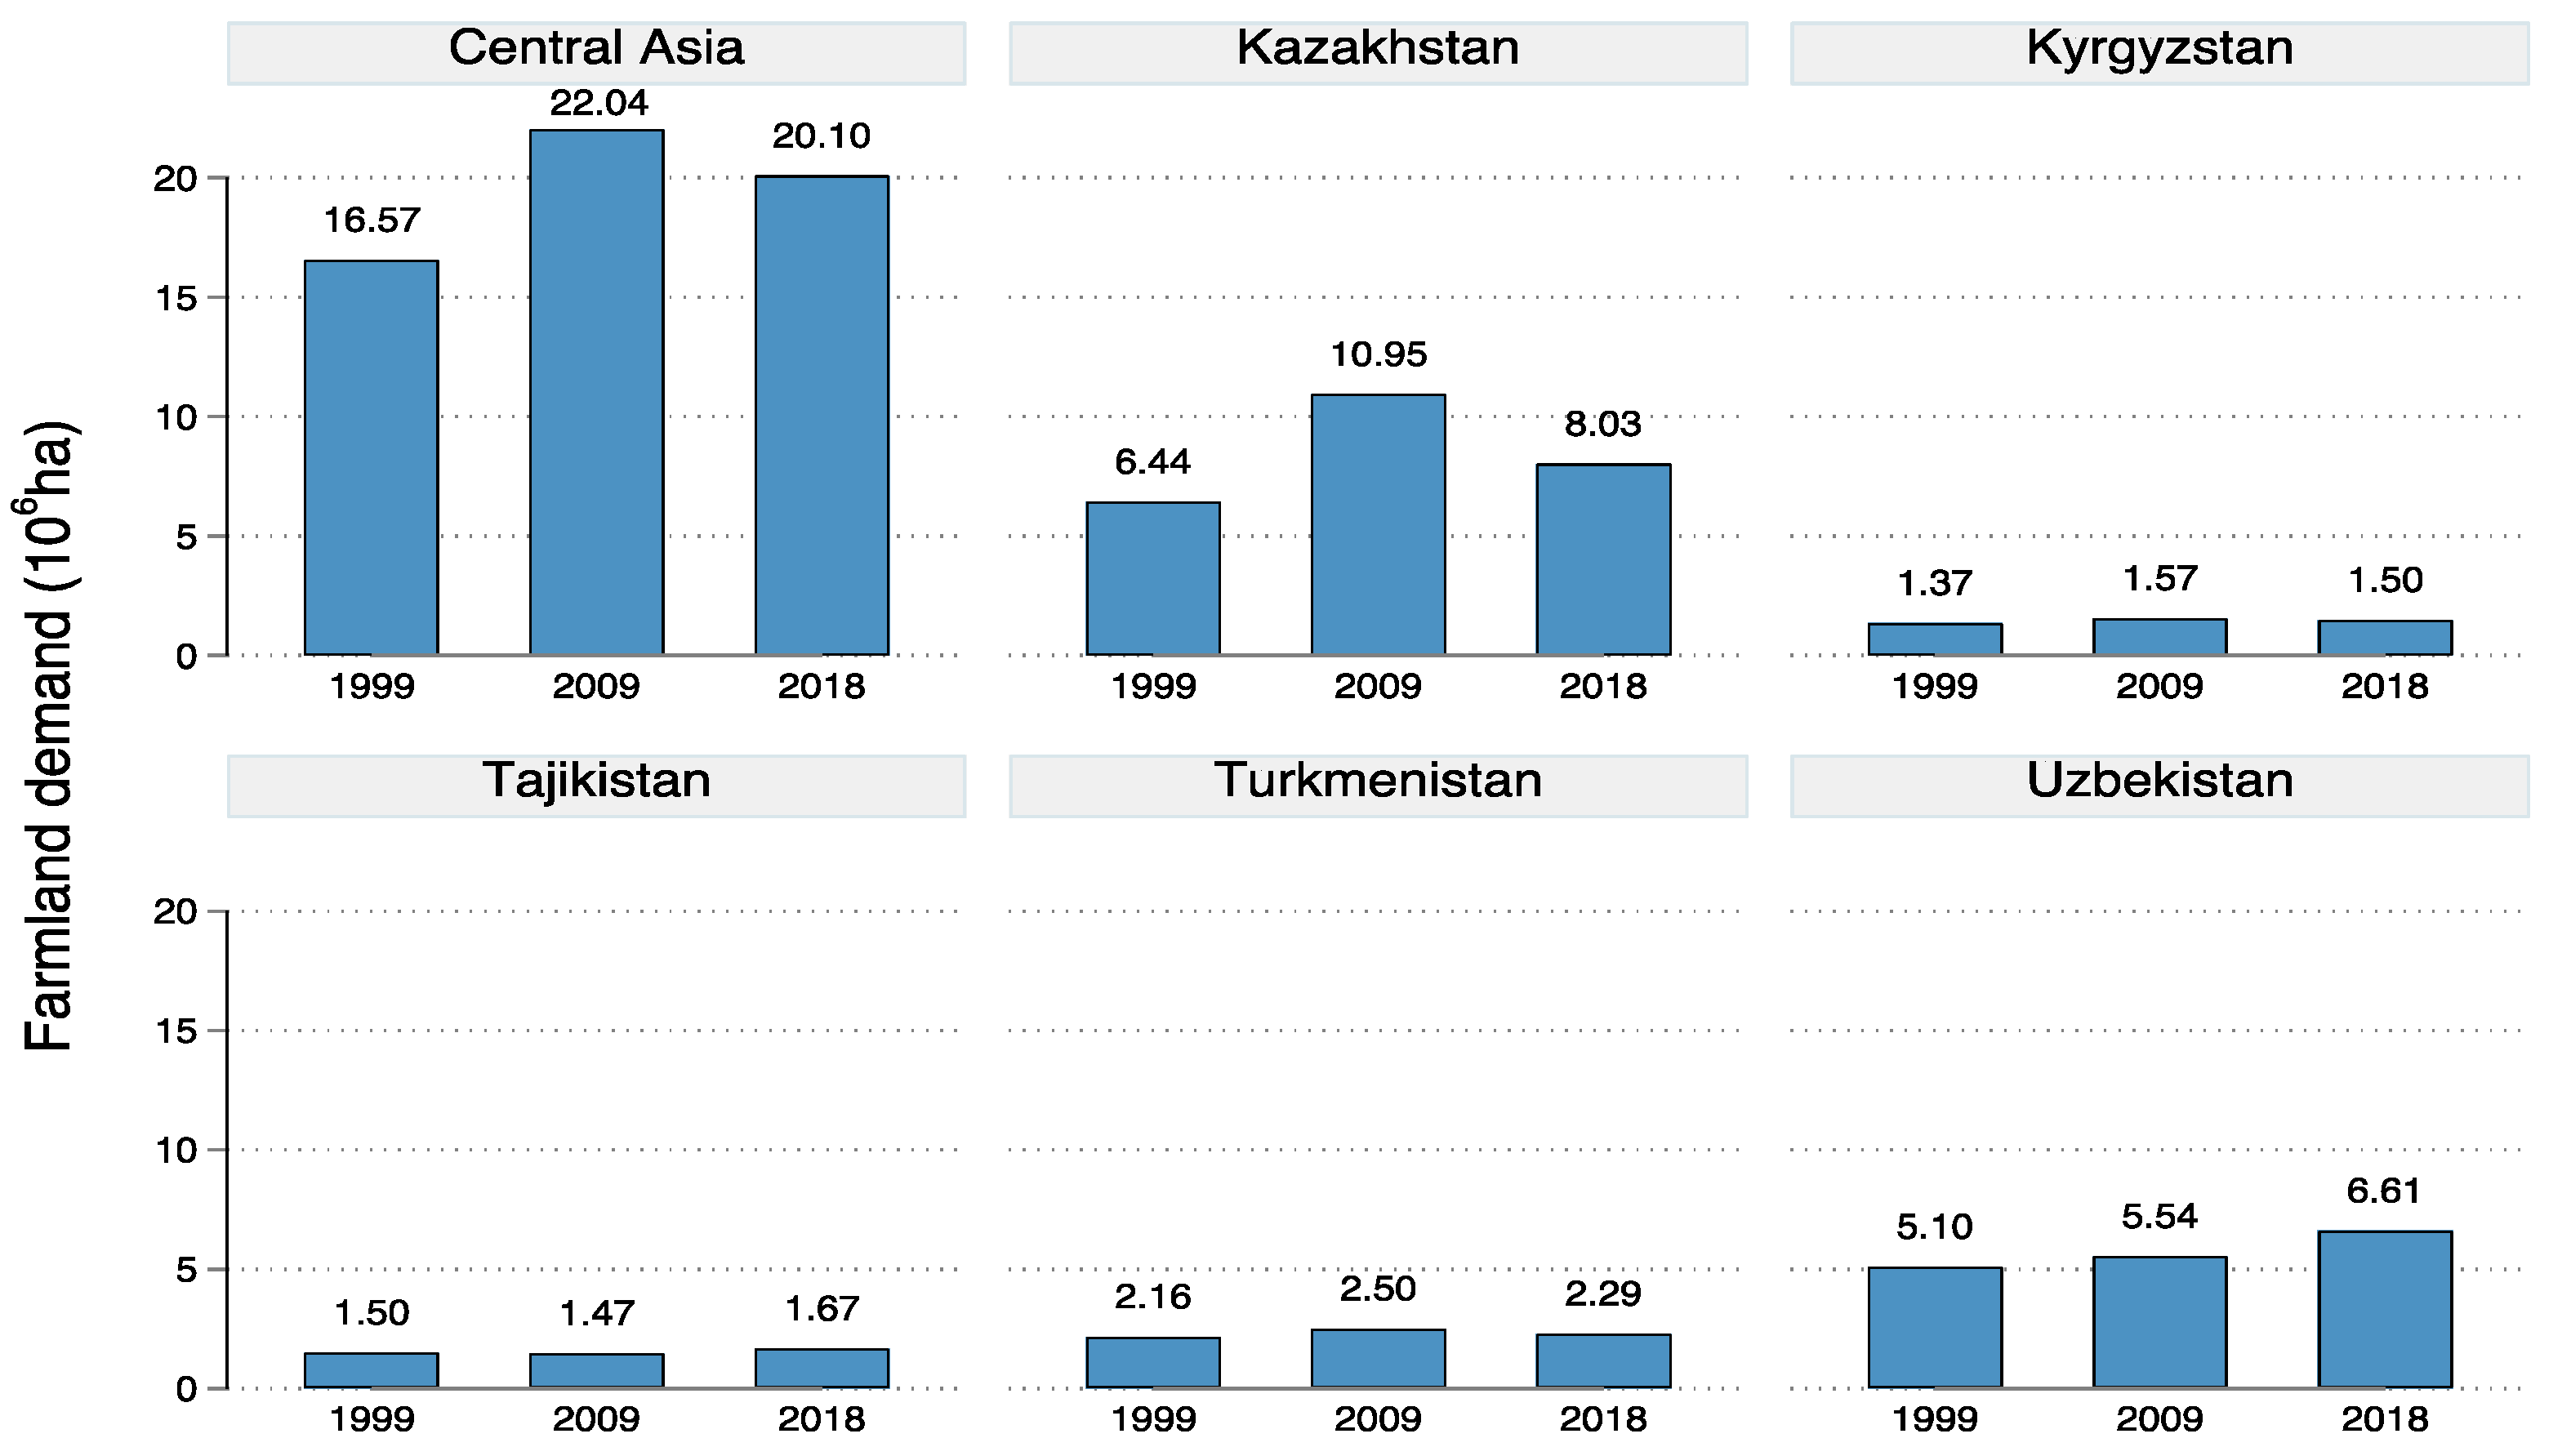
From the perspectives of consumption of food, seeds, and transportation and storage losses, the demand for major agricultural products in the five countries was calculated using Equation (1). Based on the total demand for agricultural products, each country’s demand for farmland was estimated according to Equation (2). The area of farmland that meets the demand of agricultural products for the total population of the five countries shows an overall trend of first increasing and then decreasing (Figure 3). It was 16.57 × 10⁶ ha in 1999, rose to 22.04 × 10⁶ ha in 2009, and then decreased to 20.10 × 10⁶ ha in 2018. The demand for farmland varies widely across these countries in the three selected years. Figure 3 also shows that Kazakhstan had the highest farmland demand, which was 6.44 × 10⁶ ha in 1999, 10.95 × 10⁶ ha in 2009, and 8.03 × 10⁶ ha in 2018. It was followed by Uzbekistan, which had a steadily increasing demand for farmland, from 5.10 × 10⁶ ha in 1999 to 6.61 × 10⁶ ha in 2018. Turkmenistan’s farmland demand was 2.16 × 10⁶ ha in 1999 and 2.29 × 10⁶ ha in 2018; Kyrgyzstan and Tajikistan had similar farmland demand, ranging from 1.37 × 10⁶ to 1.67 × 10⁶ ha in 1999 to 2018. Over time, Kazakhstan, Turkmenistan, and Kyrgyzstan all showed a trend of rising first and then falling. Among them, Kazakhstan saw the largest decline, with a 26.65% decrease in farmland in 2018 compared with 2009. On the other hand, the farmland demand of Uzbekistan and Tajikistan continued to rise. Among them, Uzbekistan has the fastest growth rate of farmland demand. Its demand for farmland in 2018 increased by 19.38% and 29.64% compared with 2009 and 1999, respectively.

Figure 3.
Farmland demand of Central Asia (Unit: ×106 ha).
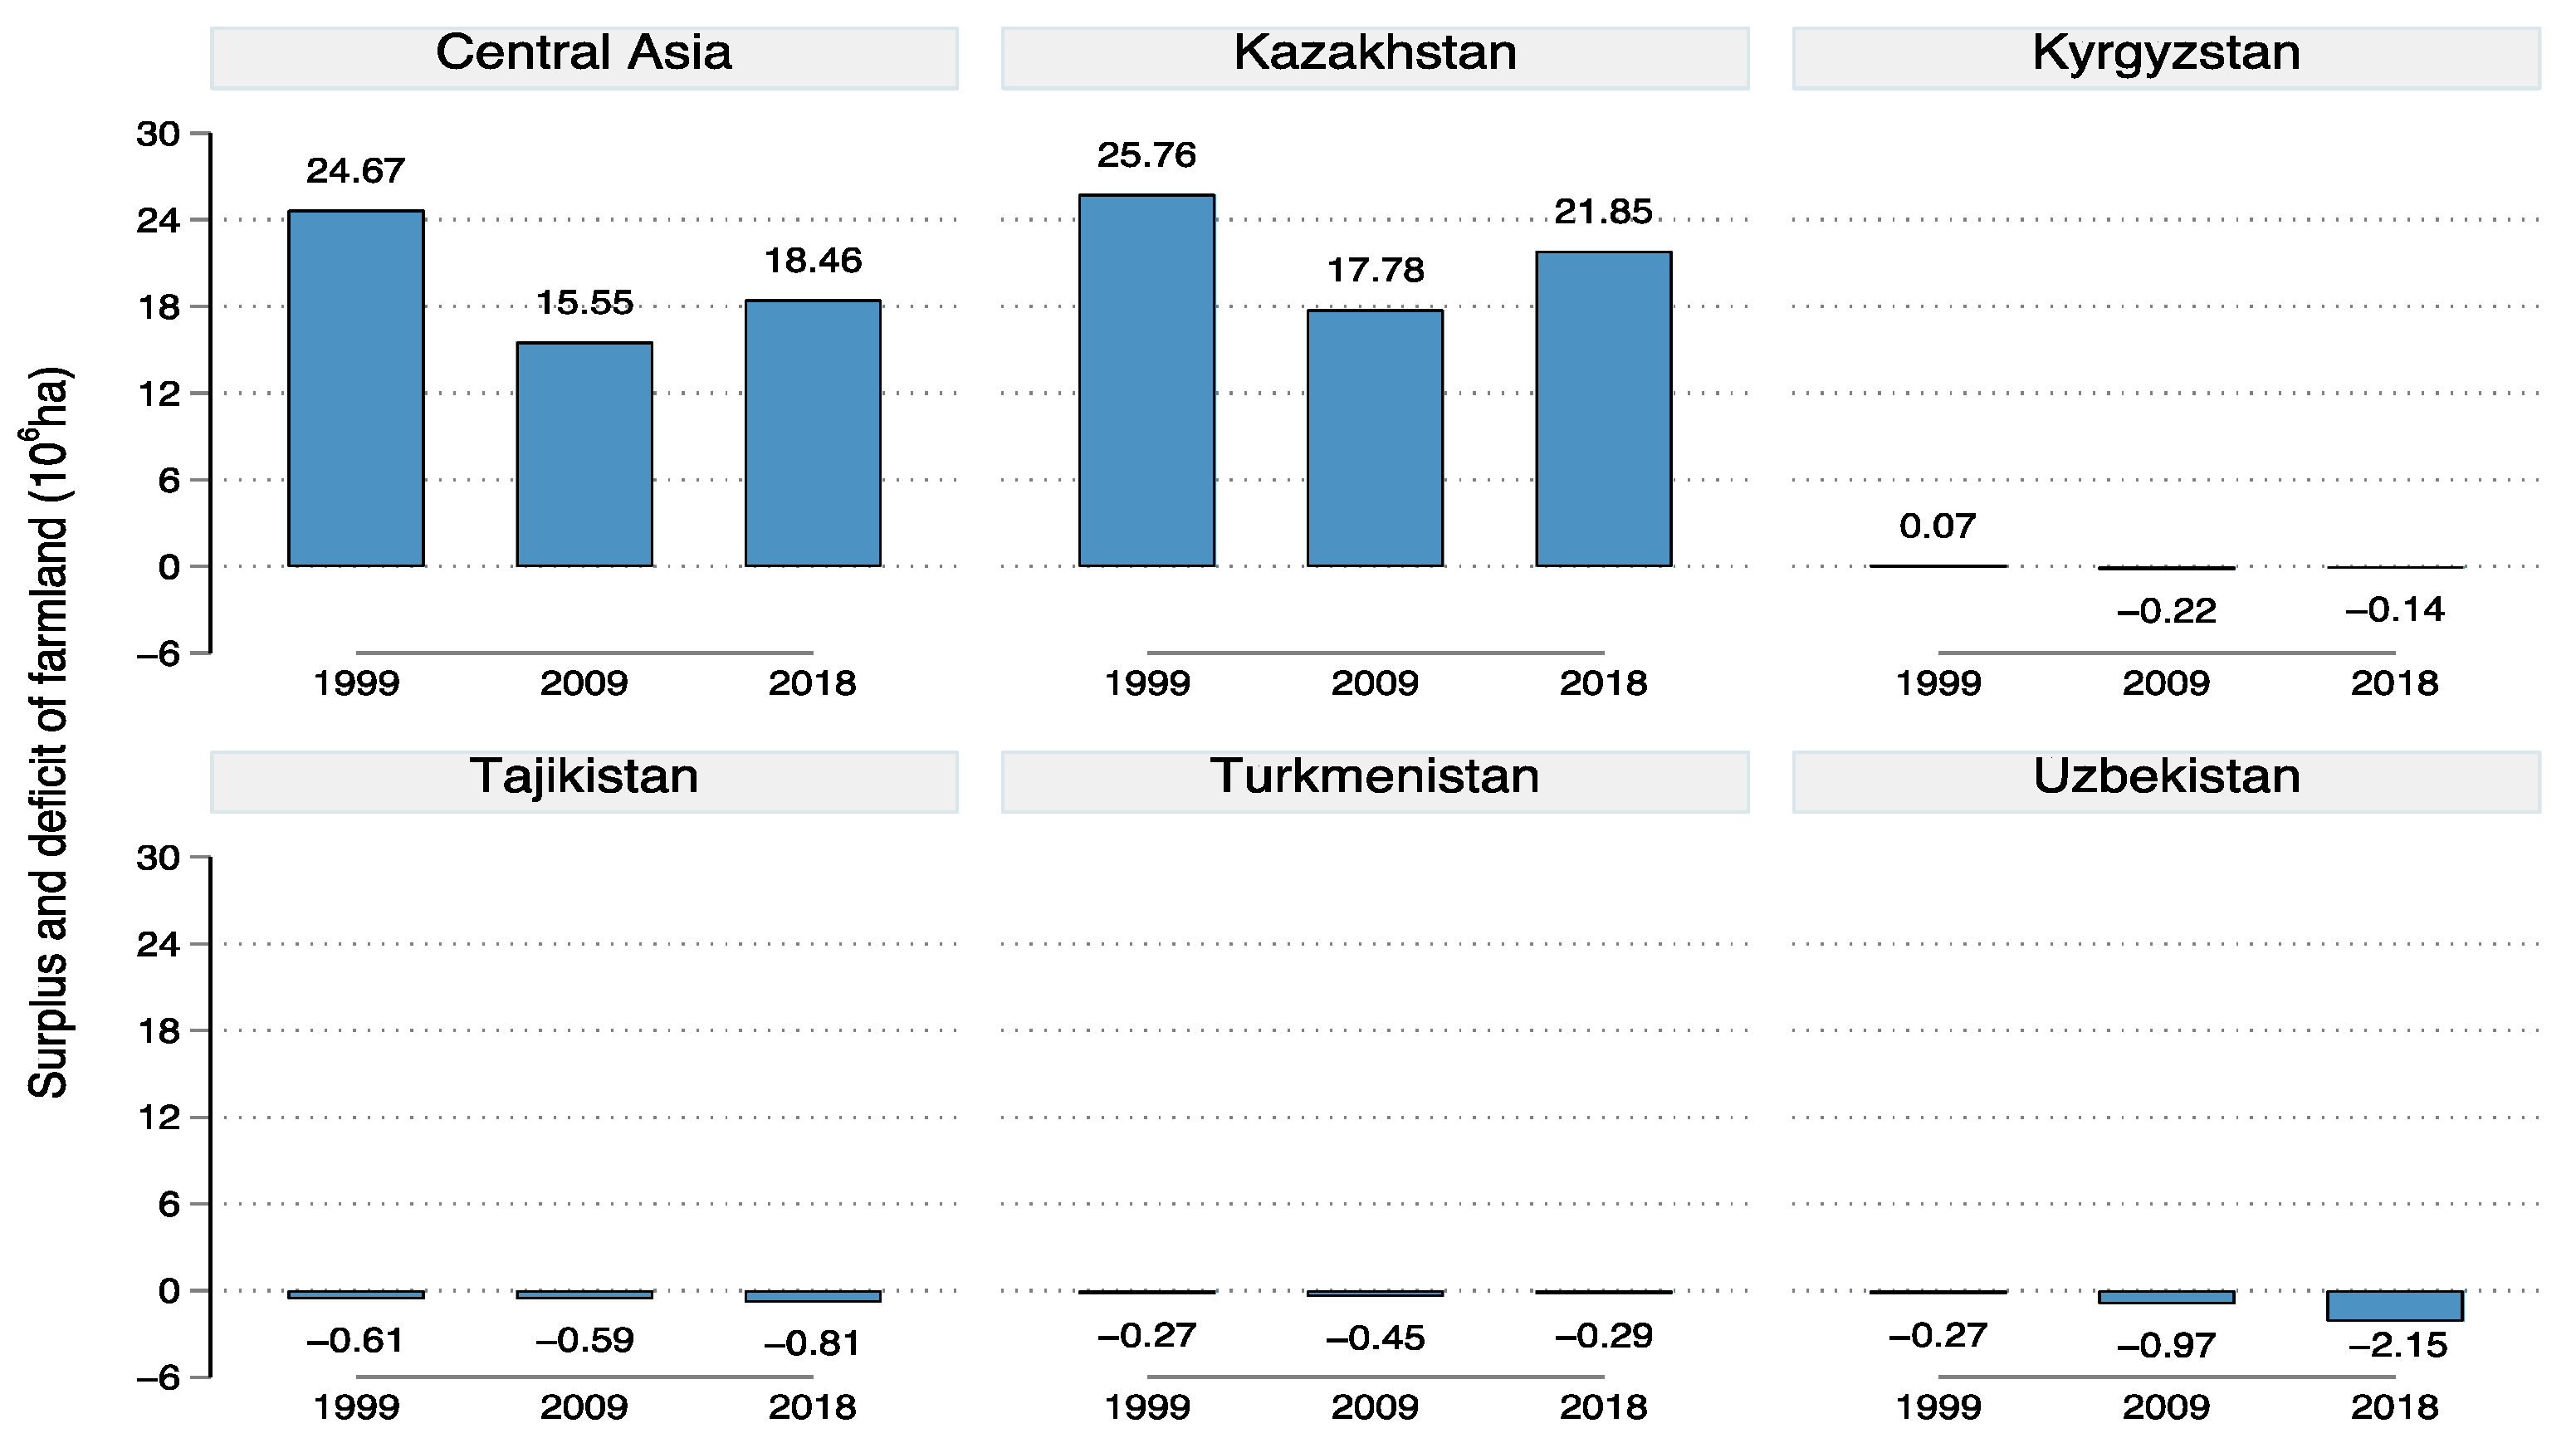
The supply–demand status of farmland in the five countries was calculated according to Equation (6). Figure 4 shows that contrary to the changes of the demand for farmland in the five countries, the available farmland area showed a trend of first decreasing and then increasing. In 1999, 2009, and 2018, the available farmland in Central Asia was 2.45, 1.71, and 1.92 times of its farmland demand, respectively. Evidently, the farmland area can meet the overall demand for food and agricultural products in Central Asia. At the national level, between 1999 and 2009, the unstable political situation and the disruption of pre-existing economic ties significantly influenced the agricultural sector in Kazakhstan, resulting in a marked decline in its farmland. However, it rebounded after 2010 as its economic situation improved and export demand picked up [37]. As a result, Kazakhstan’s farmland surplus decreased first and then increased to 21.85 × 10⁶ ha in 2018, which is 15% lower and 22.85% higher than the one in 1999 and 2009, respectively. Uzbekistan’s farmland deficit had expanded rapidly due to the rapid increase in total population and per capita food consumption. In 2018, the deficit was 2.15 × 10⁶ ha, which was 7.06 times and 1.22 times larger than that of 1999 and 2009, respectively. Tajikistan’s farmland deficit fluctuated relatively little between years, ranging between 0.59 and 0.81 × 10⁶ ha, equivalent to 70–80% of the country’s total farmland area. In contrast, Kyrgyzstan and Turkmenistan had smaller farmland deficits. Their farmland deficits were 0.14 × 10⁶ ha and 0.29 × 10⁶ ha in 2018, which decreased by 39.32% and 36.03% from 2009, respectively.

Figure 4.
Spatial distribution of farmland supply–demand balance status in Central Asia (Unit: ×106 ha).
3.2. Supply–Demand Balance Status of Agricultural Water Resources in Central Asia
3.2.1. Spatial Differences in Supply–Demand of WDAI in Central Asia
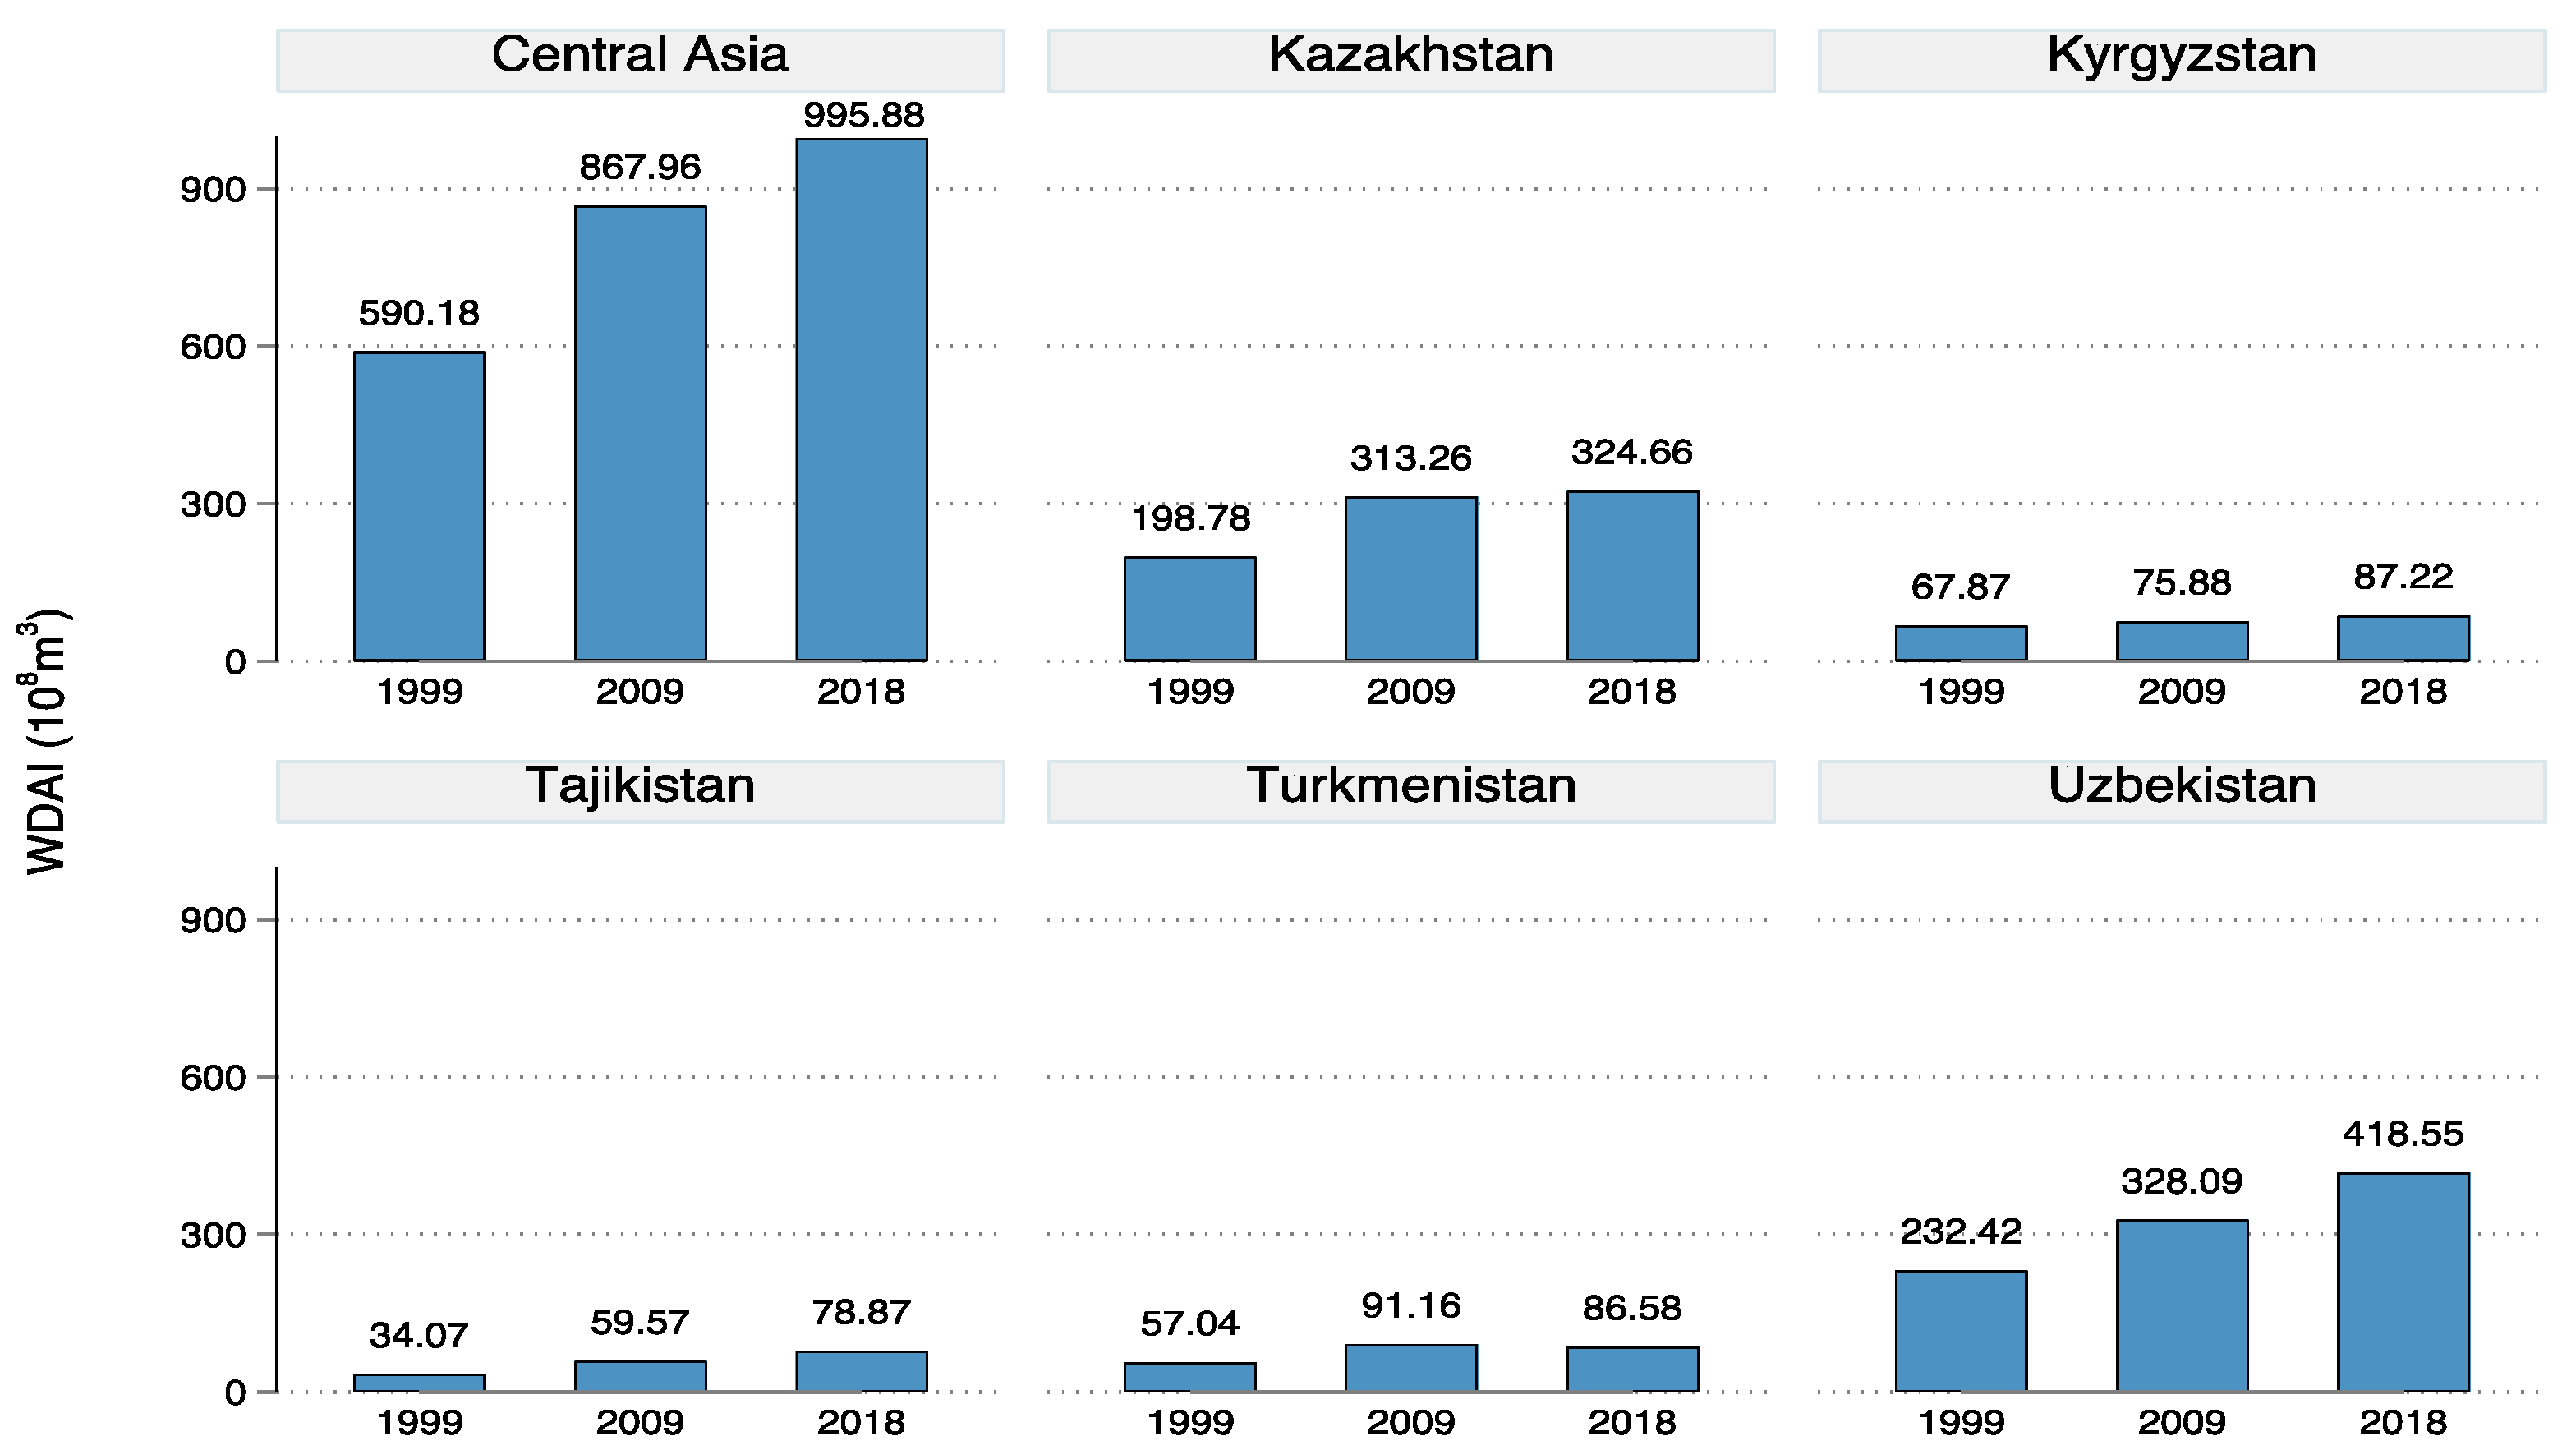
The WDAI in Central Asia showed an upward trend, according to Equation (4), which was 590.18 × 10⁸ m3 in 1999, 867.96 × 10⁸ m3 in 2009, and 995.88 × 10⁸ m3 in 2018 (Figure 5). At the national level, Turkmenistan was the only country where WDAI rose first and then fell. Its WDAI was 86.58 × 10⁸ m3 in 2018, which was 51.7% higher and 5% lower than that of 1999 and 2009, respectively. The WDAI of the other four countries all continued to rise. Tajikistan had the fastest growth in WDAI, which was 78.87 × 10⁸ m3 in 2018, an increase of 131% and 32.4% over 1999 and 2009, respectively. Uzbekistan followed with 415.56 × 10⁸ m3 in 2018, an increase of 80% and 27.6% over 1999 and 2009, respectively. Kazakhstan was 324.66 × 10⁸ m3 in 2018, an increase of 63.32% and 3.6% over 1999 and 2009, respectively. Kyrgyzstan was 87.22 × 10⁸ m3, an increase of 28.9% and 14.94% over 1999 and 2009, respectively.

Figure 5.
WDAI in Central Asia (Unit: ×108 m3).
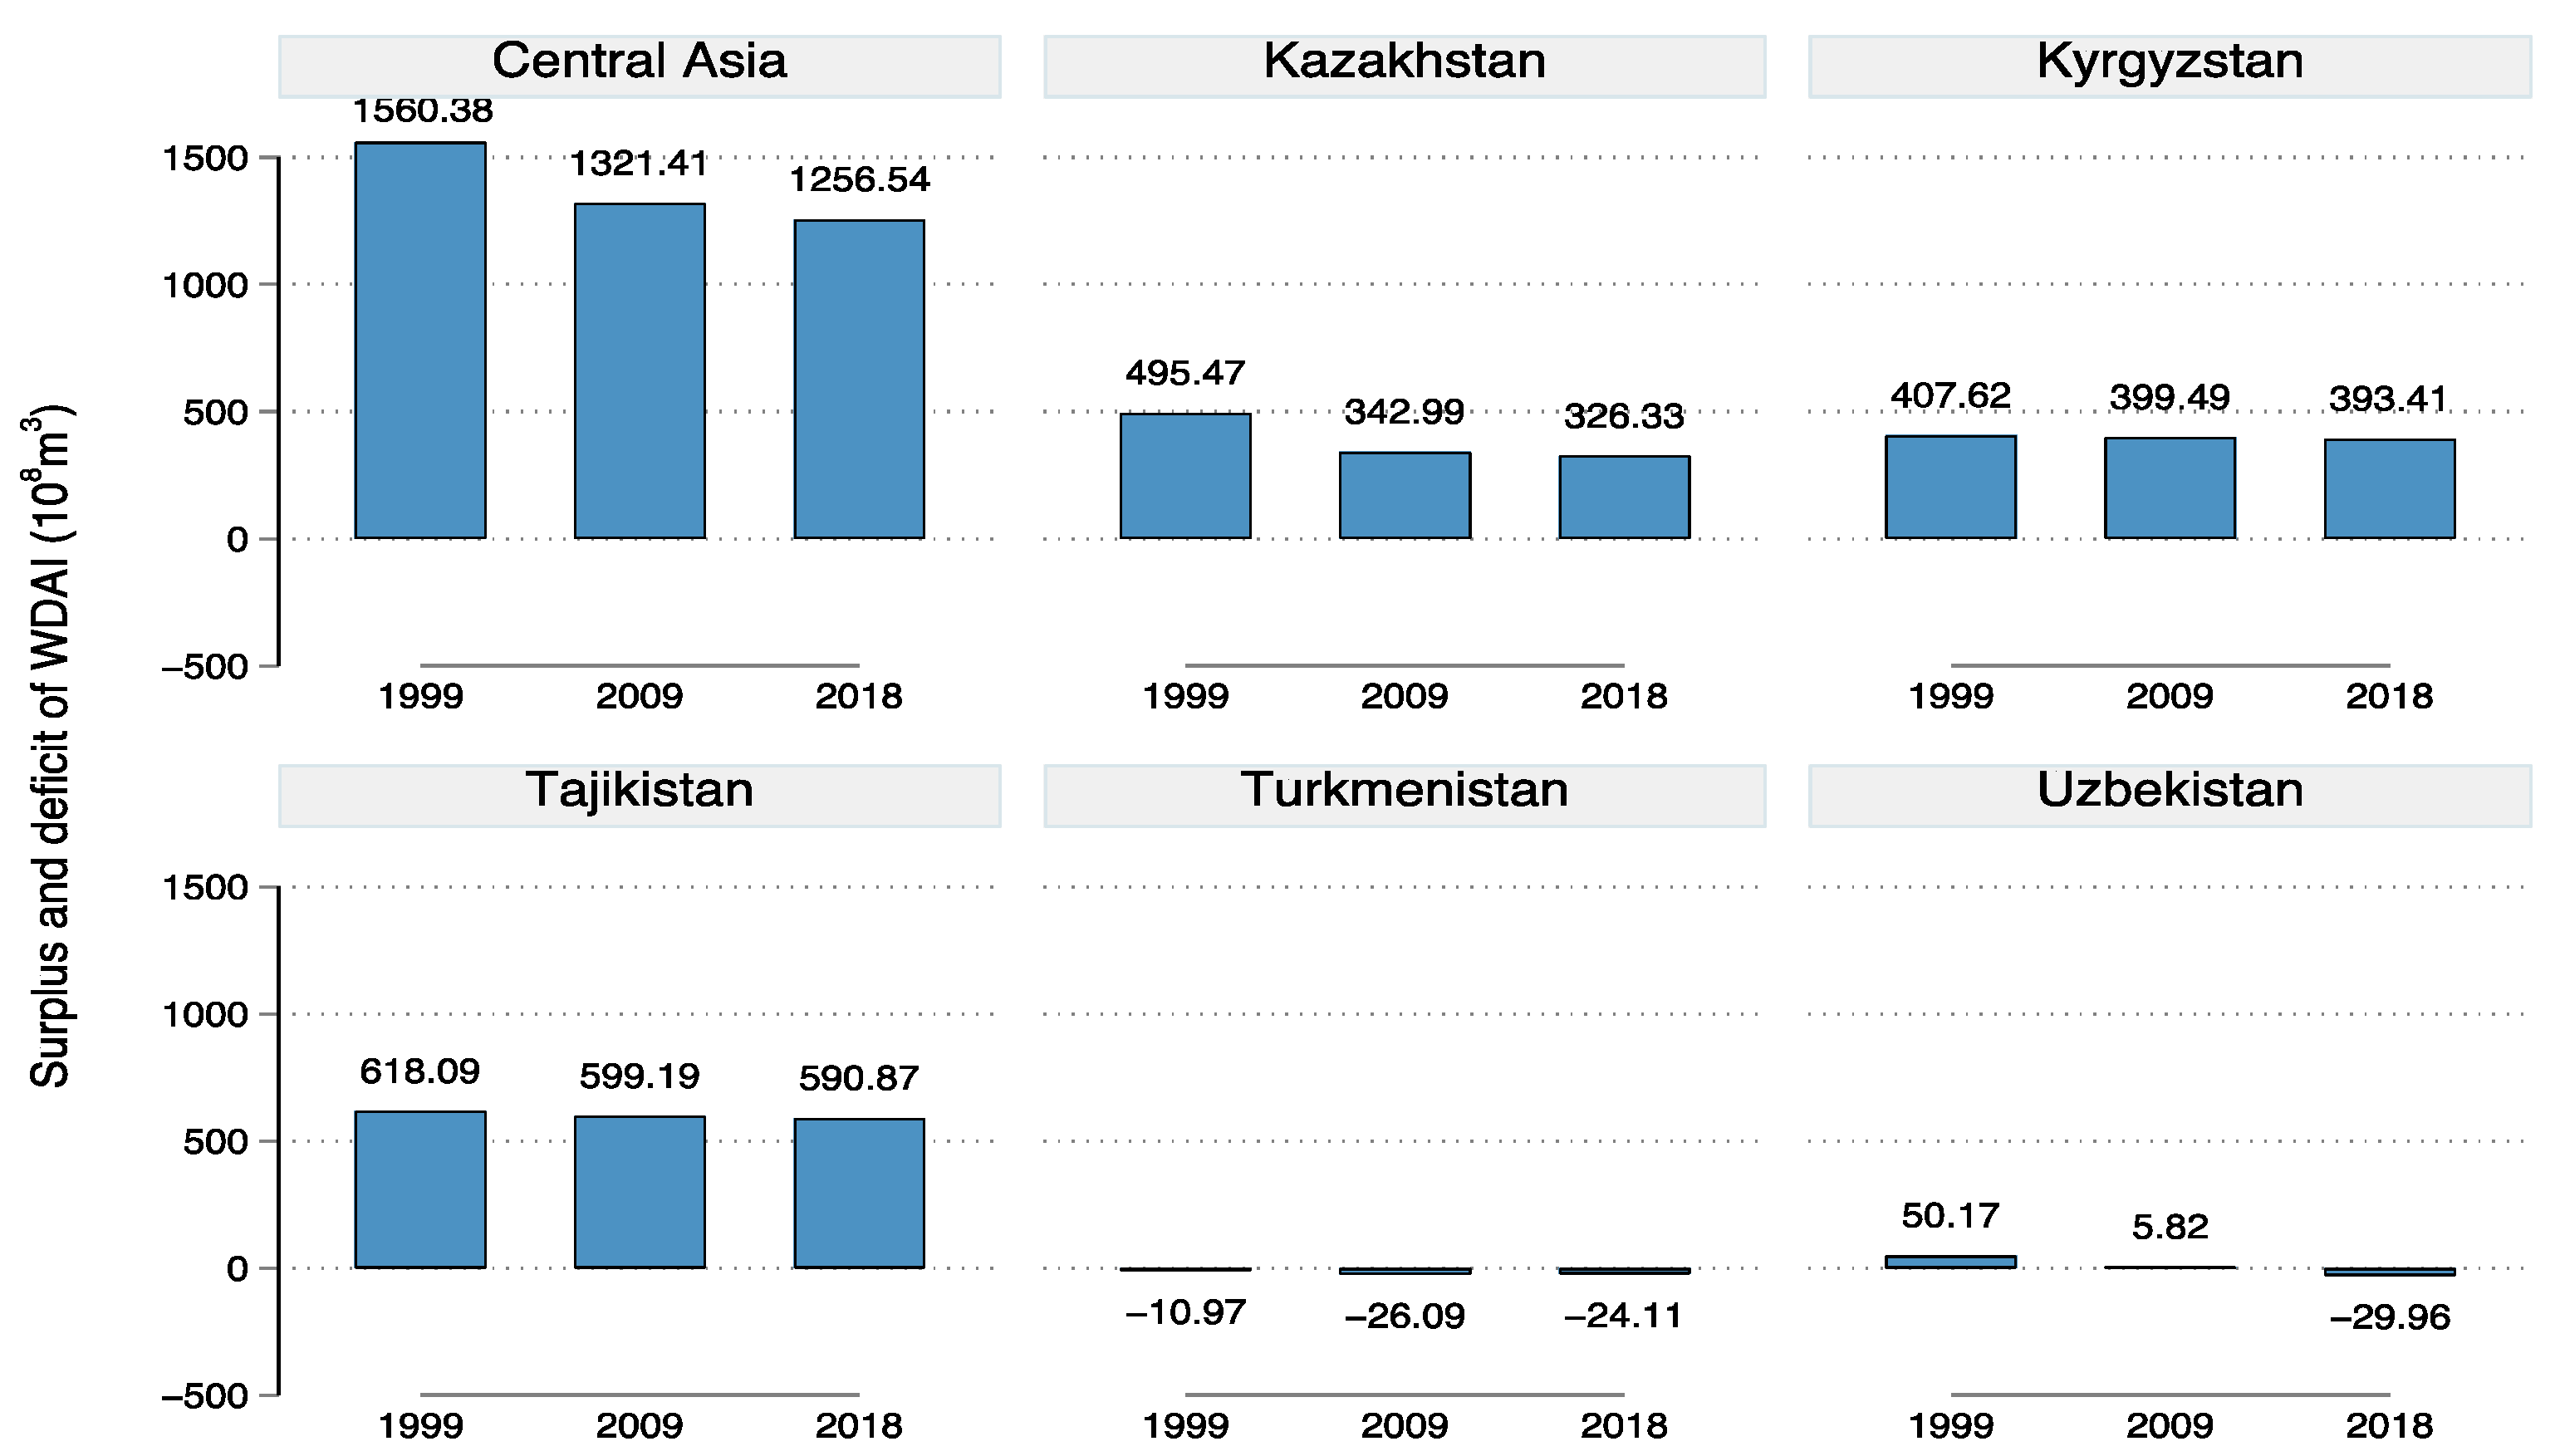
The differences between the WDAI and the AAWR in Central Asia were calculated according to Equation (7). The AAWR in Central Asia had continued to decline, but it can meet the needs of each country (Figure 6). In 1999, 2009, and 2018, The AAWR in Central Asia was 3.07, 1.95, and 1.69 times than the WDAI, respectively. Turkmenistan and Uzbekistan had different degrees of AAWR deficit for WDAI. Among them, Turkmenistan had the largest gap with an annual AAWR deficit of 20.39 × 10⁸ m3. The deficit was 1.53 times of its yearly AAWR. Tajikistan had the highest AAWR surplus for WDAI. Its AAWR surplus was 590.88 × 10⁸ m3 in 2018, which was 0.95 times that of AAWR in the year. Kazakhstan had the fastest decline in AAWR surplus for WDAI, with 326.33 × 10⁸ m3 in 2018, which decreased by 34.13% and 4.86% from 1999 and 2009, respectively. Uzbekistan was in a tight balance between AAWR and WDAI, with slight AAWR surplus in 1999 and 2009 and an AAWR deficit of 29.96 × 10⁸ m3 in 2018.

Figure 6.
Spatial distribution of balance status between AAWR and WDAI in Central Asia (Unit: ×108 m3).
3.2.2. Spatial Differences in Supply–Demand of WDIEP in Central Asia
According to Equation (5), the total WDEP that can meet the demand for agricultural production of the five countries was consistently negative (Figure 7). This means that no extra agricultural water resources were needed for environmental purification. Specifically, Kyrgyzstan, Tajikistan, and Uzbekistan had negative WDEPs, suggesting that no additional freshwater resources are needed for these countries to purify excess nutrients in the farmland due to the potential overuse of chemical fertilizers. In other words, they had a certain amount of environmental carrying capacity surplus that can allow a moderate increase in fertilizer use to improve the agricultural productivity. Kazakhstan and Turkmenistan showed positive and negative fluctuations in WDEP over the years. Kazakhstan had 2.83 × 10⁸ m3 of WDEP in 1999 and had negative WDEPs in 2009 and 2018, while Turkmenistan required 38.75 × 10⁸ m3 and 58.6 × 10⁸ m3 of WDEP in 2009 and 2018, respectively.
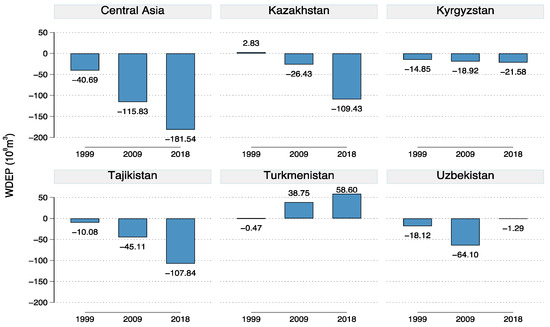
Figure 7.
WDEP in Central Asia (Unit: ×108 m3).
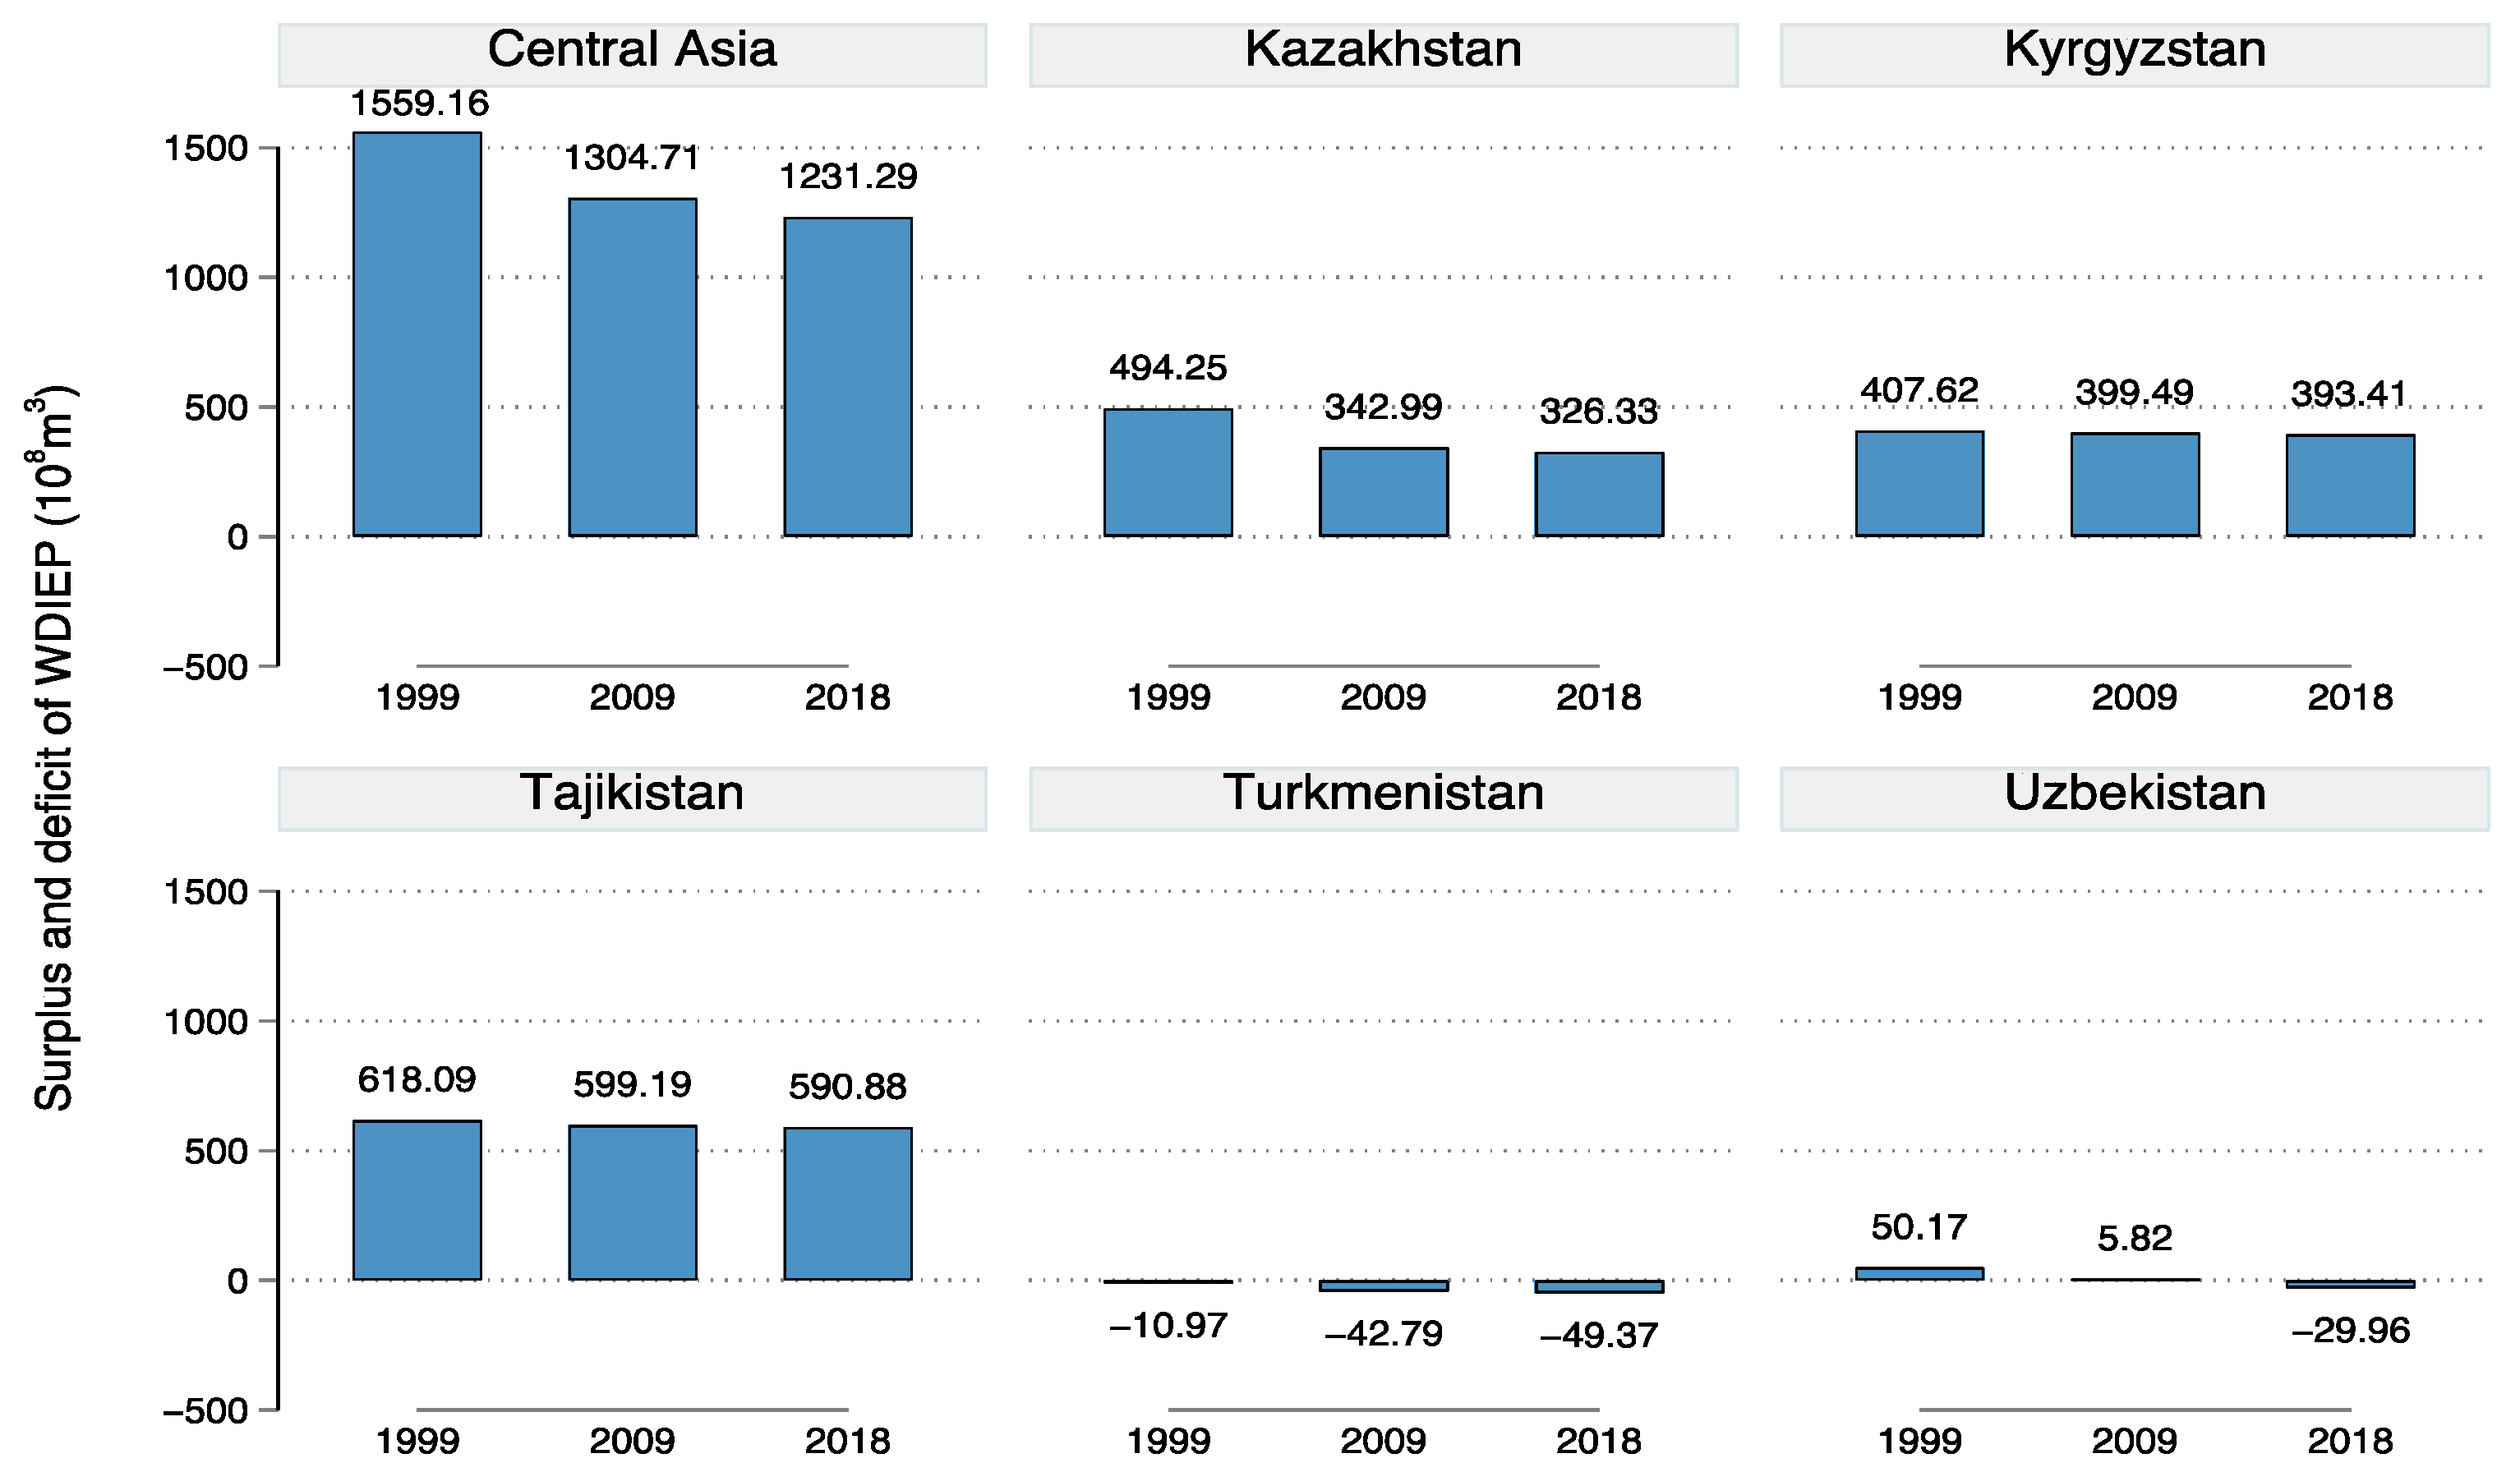
According to Equation (8), the difference values between AAWR and WDIEP in Central Asia were obtained (Figure 8). Overall, there is little difference between the WDAI and WDIEP in Central Asia because of their low WDIEP. Only Turkmenistan had an obvious change, with a WDIEP deficit of 42.79 × 10⁸ m3 in 2009 and 49.37 × 10⁸ m3 in 2018. They were 16.7 × 10⁸ m3 and 25.26 × 10⁸ m3 lower than the corresponding WDAI deficit.

Figure 8.
Spatial distribution of the balance status between AAWR and WDIEP in Central Asia (Unit: ×108 m3).
3.3. Population Carrying Capacity of Farmland and Agricultural Water Sources in Central Asia
According to Equations (9) and (10), the population carrying capacity of Central Asia was assessed under Scenario A and Scenario B, respectively (Table 1). Under Scenario A, land-water resources in Central Asia can support additional 1.22 × 10⁶ people in 2018, which decreased by 3.6% and 16.2% compared with 1999 and 2009, respectively. In Kazakhstan, its land-water resources can carry additional population, but presented a decreasing trend, from 37.44 × 10⁶ in 1999 to 17.54 × 10⁶ people in 2009 and 18.41 × 10⁶ people in 2018. Kyrgyzstan’s land-water resources could hold an additional 0.23 × 10⁶ people in 1999, but self-sufficiency was not achieved in 2009 and 2018. The long-term carrying capacity of land-water resources in the other three countries was insufficient and the deficit had a trend of further expansion. Uzbekistan experienced the fastest growth of carrying capacity deficit among the 5 countries, from 1.27 × 10⁶ in 1999 to 4.90 × 10⁶ in 2009, and then to 10.54 × 10⁶ in 2018, followed by Tajikistan, Turkmenistan, and Kyrgyzstan, whose deficits were trending upward in general but with lower growth rates than Uzbekistan.

Table 1.
Population carrying capacity of land-water resources under Scenario A and Scenario B in Central Asia (unit: ×106 people).
Under Scenario B (Equation 10), the population carrying capacity of land-water resources in Central Asia had decreased (Table 1). The whole region’s land-water resources could support 32.94 × 10⁶ and 6.62 × 10⁶ more people in 1999 and 2009, besides the existing population, respectively. However, there was a carrying capacity deficit of 0.48 × 10⁶ people in 2018. At the national level, Turkmenistan’s carrying capacity deficit decreased under Scenario B. It had a deficit of 3.34 × 10⁶ people in 2018, which was 3.88 and 1.42 times higher than in 1999 and 2009, respectively. The population carrying capacity of other countries’ land-water resources was quite similar compared to those under Scenario A.
4. Discussion
4.1. Carrying Capacity Changes of Agricultural Land-Water Resources in Central Asia and Analyses of Main Causes
The farmland resources in Central Asia could meet the overall food production demand of the people in this region, but there were great differences among these countries. Except for Kazakhstan, all the other four countries confronted a shortage of farmland to varying degrees due to natural conditions and land use changes. In terms of natural conditions, Kazakhstan has lots of plains and lowlands, accounting for more than 90% of its land area, which are the main distribution area of farmland. Therefore, its available farmland resources are the most abundant in Central Asian countries. Tajikistan and Kyrgyzstan are mountainous, with 1/2 and 1/3 of their territories above the altitude of 3000 m, respectively. The mountainous landform limits their farmland resources. Unlike natural conditions, land use is spatially and temporally associated with each country’s economic, technological, and agricultural development. Compared with 1999, the available farmland area decreased in most countries in Central Asia in 2009 and 2018 (Table 2). This may be because lots of wastelands were reclaimed in Central Asia under the Soviet era land reclamation movement, but most reclaimed farmland was dryland and did not keep unstable yields. By about 2000, in some countries, a great proportion of the reclaimed wasteland was abandoned [38]. Farmland salinization is also one of the factors affecting farmland use in Central Asia, and nearly 74 × 103 ha of farmland degraded in Uzbekistan because of years of irrigation using water from the Aral Sea [39].
Table 2.
Population, agricultural water, and farmland resources of Central Asia in 1999, 2009, and 2018 (unit: ×106 people; ×106 ha; ×108 m3).
According to equation 6, the AAWR in Central Asia can meet the demand for food production, but it also considerably varied among the five countries (Table 2). First, landform is an important factor to determine the AAWR. Tajikistan, Kyrgyzstan, and northeastern Kazakhstan have many alpine systems that receive more precipitation than plain and desert areas (e.g., Turkmenistan and Uzbekistan) through lifting and blocking effects on water evaporation. The precipitation is mainly stored in the form of glaciers and permanent snow, which developed many lakes and dense river networks. The water in the rivers and the drainage networks is rich and of good quality when countries are located upstream (e.g., Tajikistan). However, the countries located downstream (e.g., Turkmenistan) have relatively poor water, even containing high concentrations of salts and pesticides both from its own and from other upstream countries [11,40]. Second, the impact of climate change on AAWR is a key issue. Since the early 20th century, the temperature increase in Central Asia has caused glaciers to shrink by 15%–30% in the region, adding to the pressure on agricultural water systems [41]. Meanwhile, changes in rainfall patterns resulting from climate change will significantly disrupt the farmers’ cropping system, particularly in rainfed areas. It will become more difficult and riskier for farmers to rely on rainfall to grow crops. Extreme climate events will likely impinge the hydrological system in most river basins, meaning that water will become either “too much” or “too little” [42,43]. A similar study finds that climate change could significantly decrease crop yields and to challenge food security [44].
Land-water carrying capacity of Central Asia is also affected by local crop yields. For each country, the higher the local crop yield, the lower the demand for farmland. For example, Turkmenistan and Kyrgyzstan both account for about 8% of the total population in Central Asia. However, Turkmenistan’s farmland demand has increased by 52.48% because it has a 39% lower wheat yield than Kyrgyzstan [37]. The intensity of fertilizer use also affects the local demand for water. The average annual fertilizer use in Central Asia was only 48.19 kg/ha, 30% lower than the world average [45]. The WDEP was thus relatively small. Meat, egg, and milk products produced more nitrogen due to the defecation of poultry and livestock and required additional water for environmental purification. However, for oil crops, vegetable crops, and cereals, not only do they require no additional water, but they can offset the water used to purify excessive nitrogen generated by other crop production. In terms of countries, only Turkmenistan’s WDEP was increasing all the time. The main reason is that Turkmenistan consumed a high ratio of meat, eggs, and dairy products, accounting for 43.3% of the total in Central Asia. In this study, the surplus of WDIEP is generally more than that of WDAI, which means that appropriately increasing the use of fertilizers to improve crop yields will not hurt the environment in the future. Moreover, particular attention should be paid to the impact of irrigation systems on WDEP. Kazakhstan, Kyrgyzstan, Tajikistan, Turkmenistan, and Uzbekistan in the Aral Sea Basin have some of the largest irrigation schemes in the world [46,47]. However, large areas of land have been irrigated over the centuries using non-industrial techniques, and this is likely to continue [48]. According to AQUASTAT’s report, surface irrigation, accounting for 98.4% of irrigation techniques, greatly exceeds pressurized irrigation techniques, such as sprinkler irrigation (1.5%) and localized irrigation (0.1%) in Central Asia [49]. This will give rise to water waste, decrease the projective cover of valuable species in the plant cover of the basins, and decrease the productivity of herbs [50].
To allocate limited water resources fairly among the countries in the same river basin and balance the hydroelectricity needs of upstream countries with the irrigation needs of their downstream neighbors, Central Asia has built some water infrastructures since the Soviet Union period, for example, a network of irrigation canals crisscrosses between Uzbekistan, Tajikistan, and Kyrgyzstan in the Fergana Valley. Unfortunately, tensions arise due to neighboring countries sharing scarce resources under low-efficiency management. For example, in 2014, a fight broke out between villagers on the two sides of the Kyrgyz-Tajik border after irrigation water from Tajikistan, directed to a downstream area in Kyrgyzstan, was cut off [41].
With the economic development and improvement of living standards, the population and per capita food consumption in Central Asia are gradually increasing [12]. A contradiction is intensified from the limited land-water resources and the rapidly growing demand for agricultural products. Uzbekistan has been the most populous country in Central Asia, accounting for 45% of the total population. Tajikistan is the country with the fastest growth rate of population and per capita food consumption in Central Asia, increasing by 49% and 121% in 2018, respectively, compared with 1999. In the future, if the level and structure of food consumption in Central Asia continue to change, it may put new pressure on farmland and agricultural water resources.
In general, the population carrying capacity of farmland in Central Asia is lower than water resources. Uzbekistan and Turkmenistan lacked farmland and agricultural water, but Tajikistan and Kyrgyzstan were abundant in agricultural water resources. For example, Uzbekistan occupied 11% of the total arable land area and 8% of the total AAWR. However, it accounted for 45% of the total population, which could not ensure food security. Tajikistan accounted for 37% of the total water resource in Central Asia but only 2% of the total arable land. Hence, its land-water resources could not meet its demand for agricultural production. Kazakhstan had the best matching of land-water resources. Since agricultural production must depend on farmland and agricultural water, the imbalance of land-water resources can dramatically reduce the population carrying level.
In addition, in this study, the AAWR was calculated based on the total water resource quantity in Central Asian countries. We noted the difference between AAWR and actual water withdrawals in Central Asia. The existing water withdrawal for agriculture in Central Asia was 1129.6 × 108 m3 in 2018, accounting for 67% of AAWR. The largest water withdrawal was observed in Uzbekistan, with 45% of the total water consumption, followed by Turkmenistan, Kazakhstan, Tajikistan, and Kyrgyzstan, with 20.2%, 16.3%, 9.7%, and 8.4%, respectively. It shows that there is still considerable potential for the development and utilization of AAWR in Central Asia.
4.2. Simulating the Carrying Capacity of Land-Water Resources in Central Asia under the Assumption of World Average Yield and Agricultural Input Levels
Simulating the population carrying capacity of farmland and agricultural water in Central Asia at the world average yield and agricultural input levels can determine sustainable agricultural development. In 2018, the output of major agricultural products and the use of fertilizers in the five countries reached the world average level (Table 3). The total farmland surplus in Central Asia would be 21.28 × 10⁶ ha, which is 2.81 × 10⁶ ha higher than the actual level in 2018. The farmland surplus in Kazakhstan would be 24.3 × 10⁶ ha, which is 2.45 × 10⁶ ha higher than the actual level in 2018. Turkmenistan’s farmland would become a surplus of 0.34 × 10⁶ ha from the deficit of 0.29 × 10⁶ ha. The farmland deficit in Tajikistan and Kyrgyzstan would also reduce. However, in Uzbekistan, the farmland gap would increase by 0.45 × 10⁶ ha because the existed grain yield was higher than the world average.
Table 3.
The surplus and deficit of land-water in Central Asia after unit yield increased to the average world level in 2018 (unit: ×106 ha; ×108 m3).
In WDAI, the AAWR surplus in Central Asia would remain unchanged, while the AAWR surplus would decrease by 3.26 × 10⁸ m3 compared with the actual level in 2018 in WDIEP (Table 3). The WDIEP in Uzbekistan would decrease because the former’s fertilizer use was higher than the world average. The WDIEP in Kazakhstan, Kyrgyzstan, and Tajikistan would increase to different degrees. Kazakhstan would increase from −109.43 × 10⁸ m3 to −25.96 × 10⁸ m3, but this change would not result in demand for additional agricultural water because they were all negative values. In WDIEP, only Turkmenistan would increase by 3.26 × 10⁸ m3. The above factors would not change the WDIEP surplus for all countries except Turkmenistan.
Regarding Scenario A, the 5 countries would support an additional 0.51 × 10⁶ people in 2018, which would decrease by 0.71 × 10⁶ people compared with the baseline population carrying capacity of the land-water resources (Table 4). Kyrgyzstan and Tajikistan would be improved in the population carrying capacity of the land-water resources, supporting 0.48 × 10⁶ and 0.21 × 10⁶ more people than the original, respectively. Kazakhstan and Turkmenistan would maintain the same level as compared to the base period. Additionally supported population in Uzbekistan would fall by 1.4 × 10⁶ than baseline. Regarding Scenario B, the overloaded population in the five countries would be 1.42 × 10⁶ in 2018, which is only 0.94 × 10⁶ less than the baseline. Except for Turkmenistan, where the population carrying capacity would decrease by 0. 22 × 106 people, the other 4 countries would be consistent with Scenario A.
Table 4.
Balance status of the population carrying capacity of land-water resources under Scenario A and Scenario B in 2018 (unit: ×106 people).
This result suggests that increasing yields can help Tajikistan and Kyrgyzstan by using sufficient AAWR and increasing their population carrying capacity (Table 4). However, for the other three countries with relatively poor AAWR, relying solely on applying more fertilizers to raise yields may lead to an even more imbalanced matching between agricultural land-water resources and population. Under the condition of rising yields and saving farmland, minimizing WDAI and WDIEP as much as possible are critical to sustainable agricultural development and food security in Central Asia.
Worldwide, providing food and other products for a growing population, while safeguarding natural ecosystems and their services’ provision, is a significant challenge. For countries with land shortages, sustainably increasing production of current agricultural lands has been proposed as a solution to the conflict between expanding agricultural production and conserving natural ecosystems [51,52]. Many water-saving technologies (such as irrigation from desalination; alternate wetting and drying irrigation) are currently used in water shortage countries (such as Sudan, China, Israel, and Spain), among which, many studies find that drip irrigation plays an important role in affecting sustainable agricultural development [53]. Drip irrigation is the most effective way to supply water and nutrients to the plant. It not only does it save water but it also increases the yield of fruit and vegetable crops. Meanwhile, it also stabilizes the daily range of soil temperatures, which can benefit crop growth [54,55]. Moreover, the irrigation from desalination was proved to achieve sustainable aquifer management and water saving [56].
In the future, Central Asia should improve the use efficiency of farmland and agricultural water to raise grain yields by increasing investment in infrastructure, agricultural science, and technology, such as water-saving technologies, water extraction, and storage facilities. For example, the other four countries can learn about raising yields of agricultural products from Uzbekistan. Multilateral agricultural cooperation among Central Asian countries should also be promoted to optimize the use of agricultural land-water resources to enhance regional food security. For example, in Kyrgyzstan, Tajikistan, Turkmenistan, and Uzbekistan, the matching of land-water resources and population is unbalanced. Moderately increasing the import of major agricultural products can reduce the pressure on farmland and agricultural water. Kazakhstan can give full play to its resource advantages by establishing stable and all-round agricultural cooperation with other Central Asian countries through exploring win–win cooperation mechanisms. All the five countries could also cooperate with neighboring countries (e.g., China, Russia) or others in environmental sustainability to develop their unused land-water potential.
In addition, in this study, part of the parameters for assessment of land-water resources carrying capacity in Central Asia was derived from Chinese literature due to the lack of related data in Central Asia—for example, the water consumption coefficients per unit of food production. Therefore, the results in this study may deviated from real conditions in Central Asia to some extent, but the deviation is not much, as those parameters were chosen from literature on the area with similar climate and agricultural conditions to that of Central Asia. This study also suggests that more studies should be carried out in this area in the future to obtain more accurate parameters. We also acknowledge that this study has limitations, in that aggregation to the national and region level may neglect local differences within countries, which may be also important to the issue of food security in Central Asia. Despite these limitations, this study can provide timely and insightful implications in response to the land-water issues in Central Asia.
5. Conclusions
This research obtains the following important findings through comprehensively assessing the carrying capacity of land-water resources:
(1) The total farmland of Central Asia is relatively abundant but presents a fluctuation over the past 20 years due to farmland degradation and changes in the food consumption structure. The total available farmland area is 2.45, 1.71, and 1.92 times the farmland demand in 1999, 2009, and 2018, respectively. There are significant differences among the five countries. Kazakhstan consistently maintains farmland surplus, while Uzbekistan is experiencing a rapid expansion in farmland deficit. Tajikistan, Turkmenistan, and Kyrgyzstan are not self-sufficient in farmland.
(2) The pressure on AAWR in the five countries has been increasing. In 1999, AAWR was 3.07 times both WDAI and WDIEP, respectively. It decreased to 1.95 times WDAI and 1.87 times WDIEP, respectively, in 2009, and then lowered to 1.69 times the WDAI and 1.60 times the WDIEP in 2018. Tajikistan has the most water resources, followed by Kyrgyzstan and Kazakhstan. Turkmenistan and Uzbekistan do not have enough water to meet their agricultural production needs. It is worth noting that the AAWR in this study was higher than the amount of water withdrawn from FAO statistical data. It may suggest that Central Asia has a potential for the development of water resources in agriculture.
(3) The five countries face food insecurity challenges in common due to the imbalance of land-water resources and population growth. In 1999, 2009, and 2018, the population carrying capacity of land-water resources in Central Asia did not overload, but showed a decreasing tendency when only the matching between farmland and WDAI was considered. However, the population carrying capacity deficit would happen if matching farmland with WDIEP was considered. Tajikistan has a severe imbalance in the matching of agricultural land-water resources, with 50% of its total population being overloaded. Other “overloaded” countries are Uzbekistan, Turkmenistan, and Kyrgyzstan. Only Kazakhstan still has enough farmland and agricultural water to support additional populations. The main reasons are the uneven spatial distribution of farmland and agricultural water in this county and the imbalance between agricultural land-water resources and population. Our findings provide useful insights for policymakers aiming to facilitate the land-water resources carrying capacity for agricultural self-sufficiency in Central Asia, as well as in other countries.
Land-water resources carrying capacity contributes to more cross-cutting themes and policy implications regarding sustainable development of agricultural and food security. Thinking hard about the change of land-water resources carrying capacity reveals several avenues for future research. First, there is value in exploring the impact of infrastructure on water; for example, how irrigation water is transported and distributed through established infrastructures between upstream and downstream countries. Second, it would be informative to evaluate how international trade of foods alters land-water resources carrying capacity for the importing (or exporting) country. Third, incorporating climate change into the analysis framework of the land-water resources carrying capacity can better estimate the impact of changes in agricultural systems on food security.
Author Contributions
Conceptualization, Y.Z. (Yuhan Zhao), Y.Z. (Yongxun Zhang) and X.L.; formal analysis, Y.Z. (Yuhan Zhao); funding acquisition, Y.Z. (Yongxun Zhang) and X.L.; investigation, Y.Z. (Yuhan Zhao); methodology, Y.Z. (Yuhan Zhao) and Y.Z. (Yongxun Zhang); writing—original draft, Y.Z. (Yuhan Zhao) and Y.Z. (Yongxun Zhang); writing—review and editing, Y.Z. (Yongxun Zhang), X.L. and C.Q. All authors have read and agreed to the published version of the manuscript.
Funding
This research was funded by the National Natural Science Foundation of China (Project No. 71961147001); and the Foundational Research Fund for Central Non-profit Scientific Institution, (Project No. 161005202116); and the Agricultural Science and Technology Innovation Project of Chinese Academy of Agricultural Sciences (Project No. ASTIP-IAED-2022-06; Project No. ASTIP-IAED-2022-ZD-02).
Institutional Review Board Statement
Not applicable.
Informed Consent Statement
Not applicable.
Data Availability Statement
The datasets generated during the current study are available from the corresponding author on reasonable request.
Acknowledgments
We sincerely thank National Tibetan Plateau Data Center for providing the data of Figure 1 and Figure 2 (http://data.tpdc.ac.cn, accessed on 28 January 2022).
Conflicts of Interest
The authors declare no competing interest.
References
- Food and Agriculture Organization of the United Nations; International Fund for Agricultural Development; United Nations International Children’s Emergency Fund; World Food Programme; World Health Organization. The State of Food Security and Nutrition in the World 2021. Transforming Food Systems for Food Security, Improved Nutrition and Affordable Healthy Diets for All; FAO: Rome, Italy, 2021. [Google Scholar] [CrossRef]
- United Nations. Trends in Sustainable Development: Agriculture, Rural Development, Land, Desertification, and Drought; United Nations: New York, NY, USA, 2008.
- Independent Group of Scientists Appointed by the Secretary-General. Global Sustainable Development Report 2019: The Future Is Now—Science for Achieving Sustainable Development; United Nations: New York, NY, USA, 2019.
- Scherr, S.J.; Yadav, S. Land Degradation in the Developing World—Issues and Policy Options for 2020. In The Unfinished Agenda: Perspectives on Overcoming Hunger, Poverty, and Environmental Degradation; Pinstrup-Andersen, P., Pandya-Lorch, R., Eds.; IFPRI: Washington, DC, USA, 2001; Chapter 21; p. 302. [Google Scholar]
- Ostrom, E. A general framework for analyzing sustainability of social-ecological systems. Science 2009, 325, 419–422. [Google Scholar] [CrossRef] [PubMed]
- Wang, S.F.; Xu, Y.; Liu, T.J.; Ye, J.M.; Pan, B.L.; Chu, C.; Peng, Z.L. Review of evaluation on ecological carrying capacity: The progress and trend of methodology. IOP Conf. Ser. Earth Environ. Sci. 2018, 113, 012108. [Google Scholar] [CrossRef]
- Qian, G.; Chuanglin, F.; Xuegang, C. Carrying capacity for SDGs: A review of connotation evolution and practice. Environ. Impact Assess. Rev. 2021, 91, 106676. [Google Scholar] [CrossRef]
- Ma, P.; Ye, G.; Peng, X.; Liu, J.; Qi, J.; Jia, S. Development of an index system for evaluation of ecological carrying capacity of marine ecosystems. Ocean. Coast. Manag. 2017, 144, 23–30. [Google Scholar] [CrossRef]
- Wang, Q.; Yuan, X.; Zhang, J.; Mu, R.; Yang, H.; Ma, C. Key evaluation framework for the impacts of urbanization on air environment—A case study. Ecol. Indic. 2013, 24, 266–272. [Google Scholar] [CrossRef]
- Zhou, K.; Fan, J. Characteristics and influence factors of resources and environment carrying capacity in underdeveloped areas of China. Geogr. Res. 2015, 34, 39–52. (In Chinese) [Google Scholar]
- Chen, X. Overview of Central Asia Environments; China Meteorological Press: Beijing, China, 2015. (In Chinese) [Google Scholar]
- Kawabata, M.; Berardo, A.; Mattei, P. Food security and nutrition challenges in Tajikistan: Opportunities for a systems approach. Food Policy 2020, 96, 101872. [Google Scholar] [CrossRef]
- Chen, F.; Yuan, Y.J. Streamflow reconstruction for the Guxiang River, eastern Tien Shan (China): Linkages to the surrounding rivers of Central Asia. Environ. Earth Sci. 2016, 75, 1049. [Google Scholar] [CrossRef]
- Deng, H.; Chen, Y. Influences of recent climate change and human activities on water storage variations in Central Asia. J. Hydrol. 2017, 544, 46–57. [Google Scholar] [CrossRef]
- Groll, M.; Kulmatov, R.; Mullabaev, N. Rise and decline of the fishery industry in the Aydarkul–Arnasay Lake System (Uzbekistan): Effects of reservoir management, irrigation farming and climate change on an unstable ecosystem. Environ. Earth Sci. 2016, 75, 921. [Google Scholar] [CrossRef]
- Abdullaev, I.; Rakhmatullaev, S. River basin management in Central Asia: Evidence from Isfara Basin, Fergana Valley. Environ. Earth Sci. 2016, 75, 677. [Google Scholar] [CrossRef]
- Sakal, H.B. Hydroelectricity aspect of the Uzbek-Kyrgyz water dispute in the Syr Darya Basin. Enerj. Diplomasi Derg. 2015, 1, 94–133. [Google Scholar]
- Sun, J.; Li, Y.P.; Suo, C. Impacts of irrigation efficiency on agricultural water-land nexus system management under multiple uncertainties—A case study in Amu Darya River basin, Central Asia. Agric. Water Manag. 2019, 216, 76–88. [Google Scholar] [CrossRef]
- Hamidov, A.; Helming, K.; Balla, D. Impact of agricultural land use in Central Asia: A review. Agron. Sustain. Dev. 2016, 36, 6. [Google Scholar] [CrossRef] [Green Version]
- Pender, J.; Mirzabaev, A.; Kato, E. Economic Analysis of Sustainable Land Management Options in Central Asia. Final Report for the ADB; IFPRI: Washington, DC, USA; ICARDA: Beirut, Lebanon, 2009; p. 168. [Google Scholar]
- Kienzler, K.M.; Lamers, J.P.A.; McDonald, A. Conservation agriculture in Central Asia—What do we know and where do we go from here. Field Crop. Res. 2012, 132, 95–105. [Google Scholar] [CrossRef]
- Petrick, M.; Gramzow, A.; Oshakbaev, D.; Wandel, J. A Policy Agenda for Agricultural Development in Kazakhstan (Issue 15); Leibniz Institute of Agricultural Development in Transition Economies (IAMO): Halle (Saale), Germany, 2014. [Google Scholar]
- Gong, B.L. China’s Agricultural Cooperation with the Belt and Road Countries. Chin. Rural. Econ. 2019, 10, 114–129. (In Chinese) [Google Scholar]
- Xin, P.; Han, S.; Yang, Y.; Zhou, X.; Zhou, H. Changes in water requirements for production and virtual water trade of cotton in Central Asia. Chin. J. Eco-Agric. 2021, 29, 290–298. (In Chinese) [Google Scholar]
- Tang, H.J.; Li, Z.M. Study on per capita grain demand based on Chinese reasonable dietary pattern. Sci. Agric. Sin. 2012, 45, 2315–2327. (In Chinese) [Google Scholar]
- Xiao, Y.; Cheng, S.K.; Xie, G.D. The balance between supply and consumption of the main types of grain in China. J. Nat. Resour. 2017, 32, 927–936. (In Chinese) [Google Scholar]
- Huang, C.Y.; Zhang, W.B.; Jiang, S.F. Comparison of important characters and productive status between sugar-beet and sugarcane in China. Sugar Crop China. 2006, 2, 41–44, 54. (In Chinese) [Google Scholar]
- Zhang, Y.X.; Li, X.D. Analyses of Food supply-demand balance status at provincial level and policy implication in China from the perspective of Resources and environment. J. Nat. Resour. 2021, 36, 1573–1587. (In Chinese) [Google Scholar]
- Xie, H.Y.; Chen, X.S.; Yang, M.Z. The ecological footprint analysis of 1kg livestock product of China. Acta Ecol. Sin. 2009, 29, 3264–3270. (In Chinese) [Google Scholar]
- Ma, C.; Yang, Z.; Song, J.; Hao, C.; Xia, R.; Jia, R.; Chen, Y.; Zhang, X. Characteristics of crop water footprint changes in five Central Asian countries from 1992 to 2017. Chin. J. Eco-Agric. 2021, 29, 269–279. (In Chinese) [Google Scholar]
- Ge, J.H.; Zhou, S.D. Analysis of economic influence factors of agricultural non-point source pollution: Based on data of Jiangsu Province from 1978 to 2009. Chin. Rural. Econ. 2011, 5, 72–81. (In Chinese) [Google Scholar]
- Rao, J.; Xu, X.Y.; Ji, X.T. Research on the current situation, occurrence mechanism and countermeasures of agricultural non-point source pollution in China. Issues Agric. Econ. 2011, 8, 81–87. [Google Scholar]
- Zhang, H.; Hu, H. Verification of Environmental Kuznets Curve for agricultural non-point source pollution: An analysis based on temporal data of Jiangsu Province. Chin. Rural. Econ. 2009, 4, 48–53, 71. [Google Scholar]
- Deng, Y.; Gou, X.; Gao, L. Tree-ring recorded moisture variations over the past millennium in the Hexi Corridor, northwest China. Environ. Earth Sci. 2017, 76, 272. [Google Scholar] [CrossRef]
- Oenema, O.; Van, L.L.; Plette, S. Environmental effects of manure policy options in the Netherlands. Water Sci. Technol. 2004, 49, 101–108. [Google Scholar] [CrossRef]
- Li, B.G.; Huang, F. Defining the baselines for China agricultural water use in green and blue water approach. Sci. Agric. Sin. 2015, 48, 3493–3503. [Google Scholar]
- Zhao, M.J. Agricultural Development in Central Asian: Resources, Zoning and Cooperation; China Agricultural Press: Beijing, China, 2018. (In Chinese) [Google Scholar]
- Shi, X.C.; Qian, Y.; Xiong, J.X. Application of fuzzy mathematical models in the evaluation of soil heavy metal pollution. Chin. J. Soil Sci. 2006, 37, 334–336. [Google Scholar]
- Karimov, B.K.; Matthies, M.; Talskikh, V.; Plotsen, M.A.; Karimov, E.B. Salinization of river waters and suitability of electric conductivity value for saving freshwater from salts in Aral Sea Basin. Asian J. Water Environ. Pollut. 2019, 16, 109–114. [Google Scholar] [CrossRef]
- Yan, Z.; Tan, M. Changes in agricultural virtual water in Central Asia, 1992–2016. J. Geogr. Sci. 2020, 30, 1909–1920. [Google Scholar] [CrossRef]
- Russell, M. Water in Central Asia: An increasingly scarce resource. Eur. Parliam. Res. Serv. 2018. Available online: https://www.europarl.europa.eu/thinktank/en/document/EPRS_BRI(2018)625181 (accessed on 25 December 2021).
- Min, L.; Csa, B.; Fma, B. Assessing extreme climatic changes on a monthly scale and their implications for vegetation in Central Asia. J. Clean. Prod. 2020, 271, 122396. [Google Scholar] [CrossRef]
- Mo, X.; Hu, S.; Lin, Z.; Liu, S.; Xia, J. Impacts of climate change on agricultural water resources and adaptation on the north china plain. Adv. Clim. Chang. Res. 2017, 8, 93–98. (In Chinese) [Google Scholar] [CrossRef]
- Nam, W.; Choi, J.; Yoo, S.; Jang, M. A decision support system for agricultural drought management using risk assessment. Paddy Water Environ. 2012, 10, 197–207. [Google Scholar] [CrossRef]
- Zhang, J.; Chen, Y.; Li, Z. Assessment of efficiency and potentiality of agricultural resources in Central Asia. Geogr. Sci. 2018, 28, 1329–1340. [Google Scholar] [CrossRef] [Green Version]
- Komissarov, A.; Komissarov, M.; Safin, K.; Ishbulatov, M.; Kovshov, Y. Long-term irrigation effect on soil and vegetation cover of floodplain estuaries in the Southern Urals. Asian J. Water Environ. Pollut. 2020, 17, 83–90. [Google Scholar] [CrossRef]
- Devkota, K.; Hoogenboom, G.; Boote, K. Simulating the impact of water saving irrigation and conservation agriculture practices for rice-wheat systems in the irrigated semi-arid drylands of Central Asia. Agric. For. Meteorol. 2015, 214–215, 266–280. [Google Scholar] [CrossRef]
- Nasiev, B.N.; Eleshev, R. Modern state of the soils of flood irrigation systems in the semidesert zone. Eurasian Soil Sci. 2014, 47, 613–620. [Google Scholar] [CrossRef]
- Frenken, K. Irrigation in Central Asia in Figures: AQUASTAT Survey-2012; FAO Water Reports; FAO: Rome, Italy, 2013; Volume 39. [Google Scholar]
- Ospanbayev, Z.H.O.; Kurmanbayeva, M.S.; Abdukadirova, Z.H.A.; Doszhanova, A.S.; Nazarbekova, S.T.; Inelova, Z.A.; Ablaikhanova, N.T.; Kenenbayev, S.B.; Musina, A.S. Water use efficiency of rice and soybean under drip irrigation with mulch in the south-east of Kazakhstan. Appl. Ecol. Environ. Res. 2017, 15, 1581–1603. [Google Scholar] [CrossRef]
- Balmford, A. Crop expansion and conservation priorities in tropical countries. PLoS ONE 2013, 8, e51759. [Google Scholar]
- Latawiec, A.E.; Strassburg, B.N.S.; Rodriguez, A.M.; Matt, E.; Nijbroek, R.; Silos, M. Suriname: Reconciling agricultural development and conservation of unique natural wealth. Land Use Policy 2014, 38, 627–636. [Google Scholar] [CrossRef] [Green Version]
- Ahmed, S.M. Impacts of drought, food security policy and climate change on performance of irrigation schemes in Sub-saharan Africa: The case of Sudan. Agric. Water Manag. 2020, 232, 106064. [Google Scholar] [CrossRef]
- Foresight. The Future of Food and Farming 2011. Final Project Report; The Government Office for Science: London, UK, 2011.
- Godfray, H.C.J.; Beddington, J.R.; Crute, I.R.; Haddad, L.; Lawrence, D.; Muir, J.F.; Pretty, J.; Robinson, S.; Thomas, S.M.; Toulmin, C. Food security: The challenge of feeding 9 billion people. Science 2010, 327, 812–818. [Google Scholar] [CrossRef] [Green Version]
- Aznar-Sánchez, J.; Belmonte-Ureña, L.; Velasco-Muñoz, J.; Valera, D. Aquifer sustainability and the use of desalinated seawater for greenhouse irrigation in the campo de níjar, southeast Spain. Int. J. Environ. Res. Public Health 2019, 16, 898. [Google Scholar] [CrossRef] [Green Version]


Publisher’s Note: MDPI stays neutral with regard to jurisdictional claims in published maps and institutional affiliations. |
© 2022 by the authors. Licensee MDPI, Basel, Switzerland. This article is an open access article distributed under the terms and conditions of the Creative Commons Attribution (CC BY) license (https://creativecommons.org/licenses/by/4.0/).