Article

Analysis of Effects of Recent Changes in Hydrothermal Conditions on Vegetation in Central Asia

1
State Key Laboratory of Desert and Oasis Ecology, Xinjiang Institute of Ecology and Geography, Chinese Academy of Sciences, Urumqi 830011, China
2
Shenzhen Institute of Advanced Technology, Chinese Academy of Sciences, Shenzhen 518055, China
3
Research Center for Ecology and Environment of Central Asia, Chinese Academy of Sciences, Urumqi 830011, China
4
University of Chinese Academy of Sciences, Beijing 100049, China
5
Key Laboratory of GIS & RS Application Xinjiang Uygur Autonomous Region, Xinjiang Institute of Ecology and Geography, Chinese Academy of Sciences, Urumqi 830011, China
6
Department of International Relations, Kazakh Agro Technical University named Saken Seifullin, Nur-Sultan 010000, Kazakhstan
*
Author to whom correspondence should be addressed.
Land 2022, 11(3), 327; https://doi.org/10.3390/land11030327
Submission received: 3 January 2022 / Revised: 13 February 2022 / Accepted: 17 February 2022 / Published: 23 February 2022
(This article belongs to the Section Land–Climate Interactions)

Abstract

:
Understanding the relationship of hydrothermal conditions to vegetation changes is conducive to revealing the feedback mechanism connecting climate variations and vegetation. Based on the methods of Theil–Sen median analysis, and the Mann–Kendall trend test, this research investigated the spatiotemporal vegetation dynamics in Central Asia using the Normalized Difference Vegetation Index (NDVI) and grid climate data from 1982 to 2015. Further, the contributions of hydrothermal conditions to vegetation changes were quantified using a boosted regression tree model (BRT). The results demonstrated that the spatiotemporal characteristics of vegetation dynamics exhibited significant differences in different seasons, and most pixels showed increasing trends in the growing season and spring. Boosted regression tree analysis indicated that the contributions of hydrothermal conditions to vegetation dynamics exhibited temporal and spatial heterogeneity. During the annual, growing season, and summer examination periods, the contribution value of the increase in warming conditions (temperature or potential evapotranspiration) to vegetation degradation in the region due to the hydrothermal tradeoff effect (water) was 49.92%, 44.10%, and 44.95%, respectively. Moreover, the increase in warming conditions promoted vegetation growth, with a contribution value of 59.73% in spring. The contribution value of the increase in wetting conditions (precipitation or soil moisture) to vegetation growth was 48.46% in northern Central Asia, but the contribution value of the increase in warming conditions to vegetation degradation was 59.49% in Ustyurt Upland and the Aral Sea basin in autumn. However, the increase in warming conditions facilitated irrigation vegetation growth, with a contribution value of 59.86% in winter. The increasing potential evapotranspiration was the main factor affecting vegetation degradation in the Kyzylkum Desert and Karakum Desert during the annual, growing season, and autumn examination periods. Precipitation and soil moisture played decisive roles in vegetation dynamics in northern Central Asia during the growing season, summer, and autumn. This research provides reference information for ecological restoration in Central Asia.

1. Introduction

Vegetation, a vital primary product, is a fundamental element of the terrestrial ecosystem [1]. It is regarded as one of the most critical indicators of the status of the regional terrestrial eco-environment, and plays a crucial role in terrestrial carbon cycles and climatic maintenance [2,3,4,5]. The dynamics and growth of vegetation are highly sensitive to climate changes [6,7,8]. Furthermore, the causes of vegetation changes under hydrothermal conditions vary with regional changes. On the one hand, in arid and semi-arid areas, moisture conditions during the vegetation growth period are an important factor in vegetation development [9], and on the other hand, in humid areas, water conditions are no longer a limitation to vegetation growth, and extreme precipitation generally results in lower temperatures, thus restraining vegetation growth [10]. Additionally, there is an interaction between thermal conditions and moisture conditions. For example, an increment in thermal conditions can stimulate the metabolism of vegetation and accelerate its accumulation of carbon, and it also accelerates the rapid consumption of soil moisture [11,12]. Furthermore, an increase in moisture can weaken the effects of thermal conditions on vegetation, but too much water can also inhibit photosynthesis and lead to vegetation senescence [13]. Existing works have found that changes in hydrothermal conditions affect vegetation dynamics by affecting vegetation photosynthesis, respiration, and transpiration [14,15,16]. Against the background of climate warming, hydrothermal conditions in different regions have exhibited significant change, and the impact of climate variations on vegetation dynamics in different regions varies [9,13,17], leading to a complex relationship between hydrothermal actors and vegetation changes. Therefore, differences in time and region lead to variable hydrothermal conditions, different vegetation changes, and significant uncertainty in the mechanism relating vegetation dynamics and climate change. During the last decade, with global warming, regional climate conditions have tended to be unstable. Consequently, increasing attention is focused on the quantification of the contributions of hydrothermal conditions to vegetation change [18,19,20,21,22,23].
As the best representative indicator of vegetation, the Normalized Difference Vegetation Index (NDVI) is closely correlated with vegetation status and is used as a proxy for the improvement or senescence of vegetation [24,25]. Additionally, NDVI can be used to quickly and accurately monitor the dynamics and trends of vegetation in a larger region; it has been widely applied in various studies of ecology and climate [4,26,27].
Central Asia, characterized by complex topography and landforms, is located in the mid-Eurasia continent. It is far from the oceans, which means that it receives very little moisture from marine sources. With global climate warming, the region surrounding Central Asia has exhibited a rapid warming trend during the last three decades [28,29]. However, there has been a slight, spatially heterogeneous decline in precipitation in Central Asia [30,31]. The increase in temperature and decrease in precipitation have led to an increase in the uncertainty of vegetation dynamics in Central Asia in relation to climate change [30,32,33]. Hence, the study of the interactions between the hydrothermal conditions and vegetation ecosystems of Central Asia is critical. Previous studies have suggested that climate warming strongly affects the vegetation ecosystems in arid and semi-arid regions [33,34]. In Central Asia, studies have revealed significant vegetation loss trends in several regions [21,35]. Existing research found a positive correlation between the annual NDVI and precipitation in western Central Asia, while a helpful correlation was found between the annual NDVI and temperature in southwestern Central Asia [36]. Meanwhile, variation in the impacts of climate elements and human actions on different vegetation types was found in Central Asia, and the narrowing ranges of shrubs and increased regions of steppes and crops could be the result of anthropological activities [37]. Significant progress has been made in the recent research on the mechanisms of vegetation and climate change in Central Asia. However, there are uncertainties in the mechanism by which hydrothermal conditions cause vegetation variations, and the contribution of climate elements to vegetation changes under different hydrothermal conditions remains unclear in Central Asia. Additionally, given that water and heat resources in Central Asia are highly heterogeneous in their temporal distribution, the mechanism of action of vegetation and climate are different, and the factors by which climate influences vegetation are not the same at different times. Therefore, it is necessary to explain the relationships between different climate factors and vegetation in diverse periods, and the tradeoff and synergy effects of hydrothermal conditions.
This present study aims to quantify the contributions of hydrothermal conditions to vegetation changes in Central Asia, based on the analysis of spatiotemporal vegetation dynamics and the impact of climate dynamics on vegetation during the period 1982 to 2015 (The flowchart is shown in Figure A1). Because of the differences in the seasonal distribution of hydrothermal conditions in Central Asia, analysis at the scale of the year (January–December), the growing season (April–September), spring (March–May), summer (June–August), autumn (September–November), and winter (December–February) is conducted to achieve a better understanding of the feedback mechanism between hydrothermal conditions and vegetation changes. The objectives of this research are to (1) assess the characteristics and trends in vegetation changes at different periods of the year in Central Asia over the past 34 years, (2) identify areas exhibiting synergistic and tradeoff effects between hydrothermal conditions and vegetation at different time scales, and (3) quantify the contributions of hydrothermal conditions to vegetation dynamics.

2. Materials and Methods
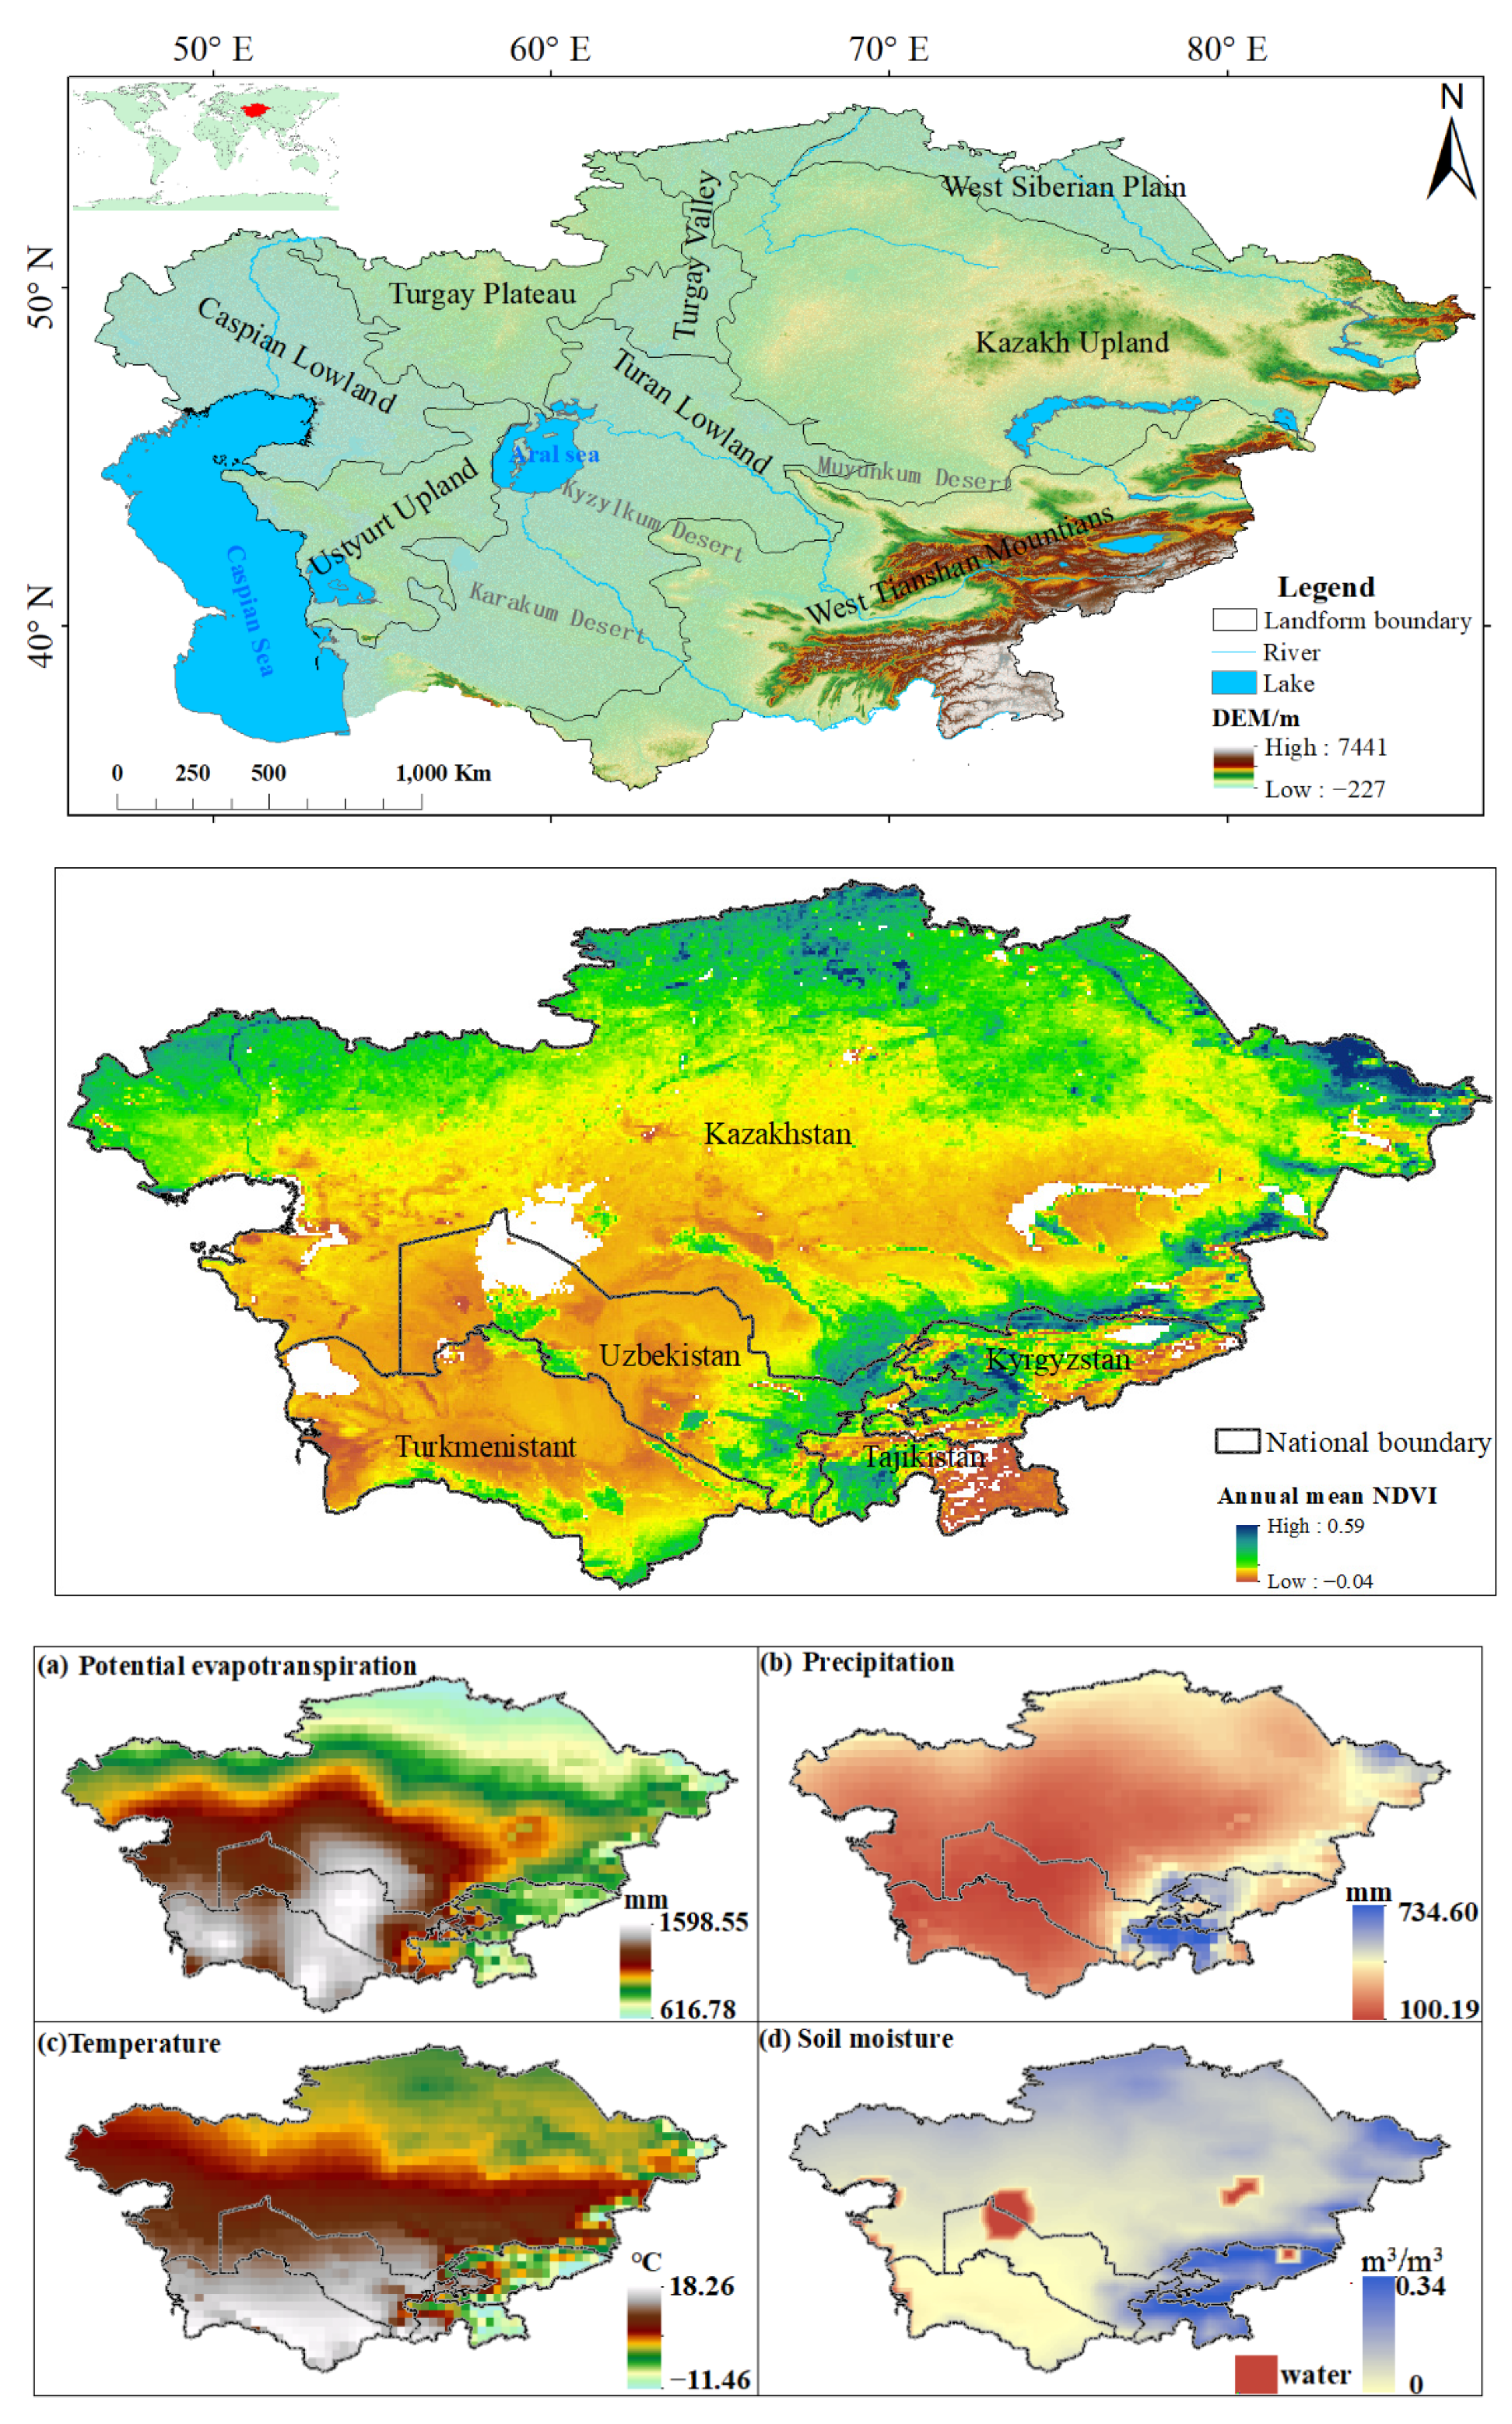
2.1. Study Area

Central Asia is positioned in the hinterland of Eurasia, located in the middle and high latitudes of the eastern hemisphere, from 46°29′ E to 87°19′ E, and from 35°07′ N to 55°26′ N (Figure 1). Its altitude decreases smoothly from the eastern mountainous regions to the coastline of the Caspian Sea in the west [38]. In terms of topography, Central Asia is divided into the Caspian Sea Lowlands, the Turan Lowlands, the Turgay Valley, the Western Siberian Plain, the Ustyurt Highlands, the Turgay Plateau, the Kazakh Highlands, and the Western Tianshan Mountains [39]. The region is characterized by a temperate continental climate, with significant regional differences in its hydrothermal conditions, including spatial variance in precipitation, soil moisture, and temperature, all of which decrease from the mountains to the plains and from north to south [29,37,40]. According to long-term climate records, the average annual temperature of Central Asia increases from north to south, and decreases from the mountainous areas in the east to the plains in the west. The average yearly precipitation and soil moisture gradually decrease from the eastern mountains to the western plains. Specifically, annual precipitation is between 600 and 800 mm in mountainous and hilly areas, while it is less than 100 mm in the southern plains, and about 400 mm in the northern plain areas [41]. Near-surface soil moisture decreases from 0.34 to 0 m3/m3 from the eastern mountain to the central plain. Temperature in the southern plain varies from 2 °C in the north to more than 18 °C elsewhere [42]. Therefore, the vegetation coverage in the northern part of the study area is relatively extensive, comprising mostly rain-fed agricultural areas and grasslands, while the southern vegetation coverage is relatively sparse, with some deserts and areas of agricultural irrigation mostly concentrated along rivers. The eastern mountains are covered by forest.

2.2. Data

2.2.1. NDVI Dataset Sources

The latest updated version of the Global Inventory Modeling and Mapping Studies (GIMMS) NDVI dataset (Table 1) was utilized to monitor vegetation changes. NDVI is based on the ratio between near-infrared and red bands in the remote sensing data obtained by the AVHRR sensor mounted on an NOAA satellite (https://ecocast.arc.nasa.gov, accessed date: 27 October 2020). This dataset is broadly used to research large-scale vegetation dynamics at the global and regional level [13,43,44,45]. The data have a temporal resolution of 15 days and a spatial resolution of 0.083°, covering the period of 1982–2015. For consistency with the temporal resolution of the climate dataset, the maximum-value composition technique was utilized to temporally assemble monthly NDVI values [33]. The mean NDVI for the year, the growing season, and the seasons was calculated for analysis. Pixels of snow and water were masked as non-vegetation areas.

2.2.2. Climate Data Sources

The TS 4.03 climate dataset (Table 1) published by the University of East Anglia Climatic Research Unit (CRU) (http://www.cru.uea.ac.uk/, accessed date: 20 October 2020) was used for detecting the factors influencing vegetation changes. The temperature, precipitation, and potential evapotranspiration (PET) datasets from 1982 to 2015 in CRU TS 4.03 were selected. The near-surface soil moisture dataset for the period from 1982 to 2015 was obtained from the European Centre for Medium-Range Weather Forecasts (ECMWF) (https://www.ecmwf.int/, accessed date: 25 October 2020); this dataset has been widely used [39,46]. Accumulated precipitation, PET, and average temperature and soil moisture values for the year, the growing season, and individual seasons were calculated for analysis. The climate datasets were resampled at the spatial resolution of the GMMIS-NDVI dataset, using the nearest neighbor assignment method when quantifying the contributions of climate to vegetation changes.

2.3. Methods

2.3.1. Theil–Sen Median Analysis and the Mann–Kendall Trend Test

Theil–Sen median analysis and the Mann–Kendall trend test are effective tools for detecting trends in vegetation dynamics over a series of lengthy periods at pixel scale. Theil–Sen median analysis is a robust nonparametric statistical method, which is calculated as follows:
β = m e d i a n ( N D V I i N D V I j t i t j )
where 1 < i < j < n. β is employed to calculate the monotonic trend. This calculation indicates the median of the integrated slope of the NDVI time series data (the data number is n (n − 1)/2). When β > 0, there is an upward trend in vegetation change in the time series; β < 0 suggests a downward trend.
The Mann–Kendall test was utilized to study trends in the NDVI time series dataset; Zc is the attenuation index of NDVI at the pixel scale. The design formulation follows:
Z c = { S 1 V a r ( S ) S > 0 0         S = 0 S + 1 V a r ( S ) S < 0  
where
S = i = 1 n 1 k = i + 1 n s i g n ( N D V I k N D V I i )  
V a r ( S ) = n × ( n 1 ) × ( 2 n + 5 ) p q t p ( t p ( 2 n + 5 ) ) 18  
s i g n ( N D V I k N D V I i ) = { 1 ( N D V I k N D V I i ) > 0 0 ( N D V I k N D V I i ) = 0 1 ( N D V I k N D V I i ) < 0  
NDVIk and NDVIi are the examples of NDVI dataset; S represents the correlation coefficient of Zc given above; n represents the size of the data; sign represents the sign function; tp represents the number of data point with equal values in a certain set p; and q represents the quantity of groups covering equal values in a chain of data in a group p. At the given α level, when |Zc| > u 1 α / 2 , the time chain dataset exhibits substantial variation at the α level.   Z 1 α / 2 represents standard normal deviation. Z = ±2.576 is the significance level α = 0.01, Z = ±1.96 is the significance level α = 0.05, and Z = ±1.645 is the significance level α = 0.1; α = 0.05 is consistently utilized as the common level; |Zc| > 1.96 is the time-chain confidence level α < 0.05; |Zc| < 1.96 is the time-chain confidence level α > 0.05.

2.3.2. Correlation Analysis

Correlation analysis is a powerful tool, and we used it to study the correlation between vegetation and climate variables. According to the positive and negative relationships between vegetation and hydrothermal factors, we categorized the tradeoff and synergetic effect areas of hydrothermal conditions in relation to vegetation. The calculation formulation follows:
r = i = 1 n ( n d v i i n d v i ¯ ) × ( f a c t o r i f a c t o r ¯ ) i = 1 n ( n d v i i n d v i ¯ ) 2 × i = 1 n ( f a c t o r i f a c t o r ¯ ) 2
where r is the correlation coefficient, and ndvi and factor represent the average values of the NDVI dataset and the climate factor dataset, respectively. If r > 0, ndvi and factor are positively correlated; on the contrary, if r < 0, ndvi and factor are negatively correlated; r = 0 means that ndvi and factor are unrelated.
After calculating the correlation coefficient r, we also tested whether it is statistically significant. The p-value is the alternative hypothesis test value. Here, the p-value was obtained by the t-test method:
t = r × n 2 1 r 2  
p = 2 × t p v a l u e ( a b s ( t ) , n 2 )
where tp-value(−abs(t),n − 2) is the t corresponding to the p-value in the t-distribution. When the p was less than 0.05, we rejected the null hypothesis and assumed a significant linear correlation between ndvii and factori. Otherwise, ndvii and factori were considered to be insignificant.

2.3.3. Boosted Regression Tree Model

The boosted regression tree (BRT) is a model with strong predictive performance and reliable identification of relevant variables and interactions [47,48]; it is one of numerous methods that aim to improve the performance of a single model by fitting various models to it and conjoining them for use in prediction. BRT utilizes two algorithms—regression trees and boosting—to build and combine a group of models which can generate multiple regression trees through continuous random selection and self-learning methods, thereby improving the stability and prediction accuracy of the model [48,49]. In the operation process, a certain amount of data is randomly selected by repeated iterations to analyze the influence of the independent variable on the dependent variable. The remaining data are used to cross-validate the fitting results [48]. Finally, the generated multiple regression tree is averaged and outputted. It can calculate the relationship between the independent variable and the dependent variable when other independent variables take the mean value or remain unchanged. The advantage of BRT is that there is no need to consider interactions between independent variables. Moreover, the input data of BRT can have default values and the data types are flexible and diverse, and the output contribution of independent variables and response curves are intuitive and easy to interpret [50]. This approach has been applied for the identification of vegetation change factors [13,51].
According to the study of Elith et al., values in BRT must be provided for two important parameters—learning rate (lr) and tree complexity (tc). lr determines the contribution of each tree to the growing model, and tc controls whether interactions are fitted. Additionally, these two parameters then determine the number of trees (nt) required for optimal prediction [48].
In this study, the Generalized Boosted Regression Models (GBM) package written by Elith et al. in R language [48] was used. The NDVI data and hydrothermal factors (potential evapotranspiration, temperature, soil moisture, and precipitation), for the period 1982 to 2015 in Central Asia, were used as response variables and independent variables, respectively; the family was set to Gaussian; the max trees were set to 10,000; the tree complexity was set to 5; the learning rate was 0.001; the bag fraction was 0.5. In each computation, 50% of the data were picked up, and 10 cross-validations were executed. The hydrothermal condition with the highest contribution value was considered to be the primary controlling factor for vegetation growth.

3. Results

3.1. Spatiotemporal Patterns of Vegetation Dynamics Trend

In this research, the Theil–Sen median values were classified as follows: stable or non-vegetated area (with an SNDVI equal to 0), improved area (with an SNDVI greater than or equal to 0), or degraded area (with an SNDVI less than 0). Moreover, based on a confidence level of 0.05, the Mann–Kendall test results were categorized as a significant change (Z > 1.96 or Z < −1.96) or an insignificant change (−1.96 ≤ Z ≤ 1.96). The calculation results of the Theil–Sen median analysis and the Mann–Kendall trend test are divided into five categories (Table 2).
The spatial distribution of the vegetation variation varied across time scales in Central Asia over the past 34 years (Figure 2). At the annual scale, from 1982 to 2015, more pixels exhibited vegetation degradation than improvement. The vegetation decreased in 66.97% of the total area, with 31.31% displaying a notable decreasing trend, mainly located in western and middle Central Asia, including the Ustyrt Upland, the Kyzylkum Desert, the Karakum Desert, and the Turgay Plateau (Figure 2a). A significant improvement was seen in 10.81% of the total pixels. On the contrary, most of the vegetation (50.79%) experienced improvements in the growing season. Significant improvement (18.84%) was observed in the eastern mountainous areas, including the Kazakh Upland and the West Tianshan Mountains (Figure 2b).
At the seasonal scale, the spatial distribution of vegetation trends exhibited significant differences. The vegetation increased in a large part of the total study area (65.6%), and only 17.08% of the vegetative area presented significant degradation in spring (Figure 2c). Most pixels showing significant degradation were observed in western and middle Central Asia in summer and autumn, comprising 27.95% and 42.64% of the total study area, respectively (Figure 2d,f). Winter showed the highest proportion of degradation (57.65%) among the four seasons, and only a small area (3.49%) presented improvement—the irrigation areas distributed along rivers (Figure 2e).

3.2. Correlation Analysis between Vegetation Changes and Hydrothermal Conditions

Hydrothermal conditions, considered to be important climate factors, play key roles in vegetation change and growth [13,52,53,54]. To better understand the differences in the influence of hydrothermal factors on vegetation in Central Asia, a comprehensive climate dataset comprising temperature, potential evapotranspiration (PET), precipitation, and soil moisture was considered. The temperature and PET datasets were used to study the heat conditions. The precipitation and soil moisture datasets were used to study the water conditions. Moreover, based on the significance of the correlations between vegetation and various factors, PET and soil moisture were used to supplement temperature and precipitation (Figure 3 and Figure 4). Further, we superimposed the data on the significance and correlation of NDVI and hydrothermal factors to obtain the spatial distribution of different function types of hydrothermal factors affecting vegetation (Figure 5).

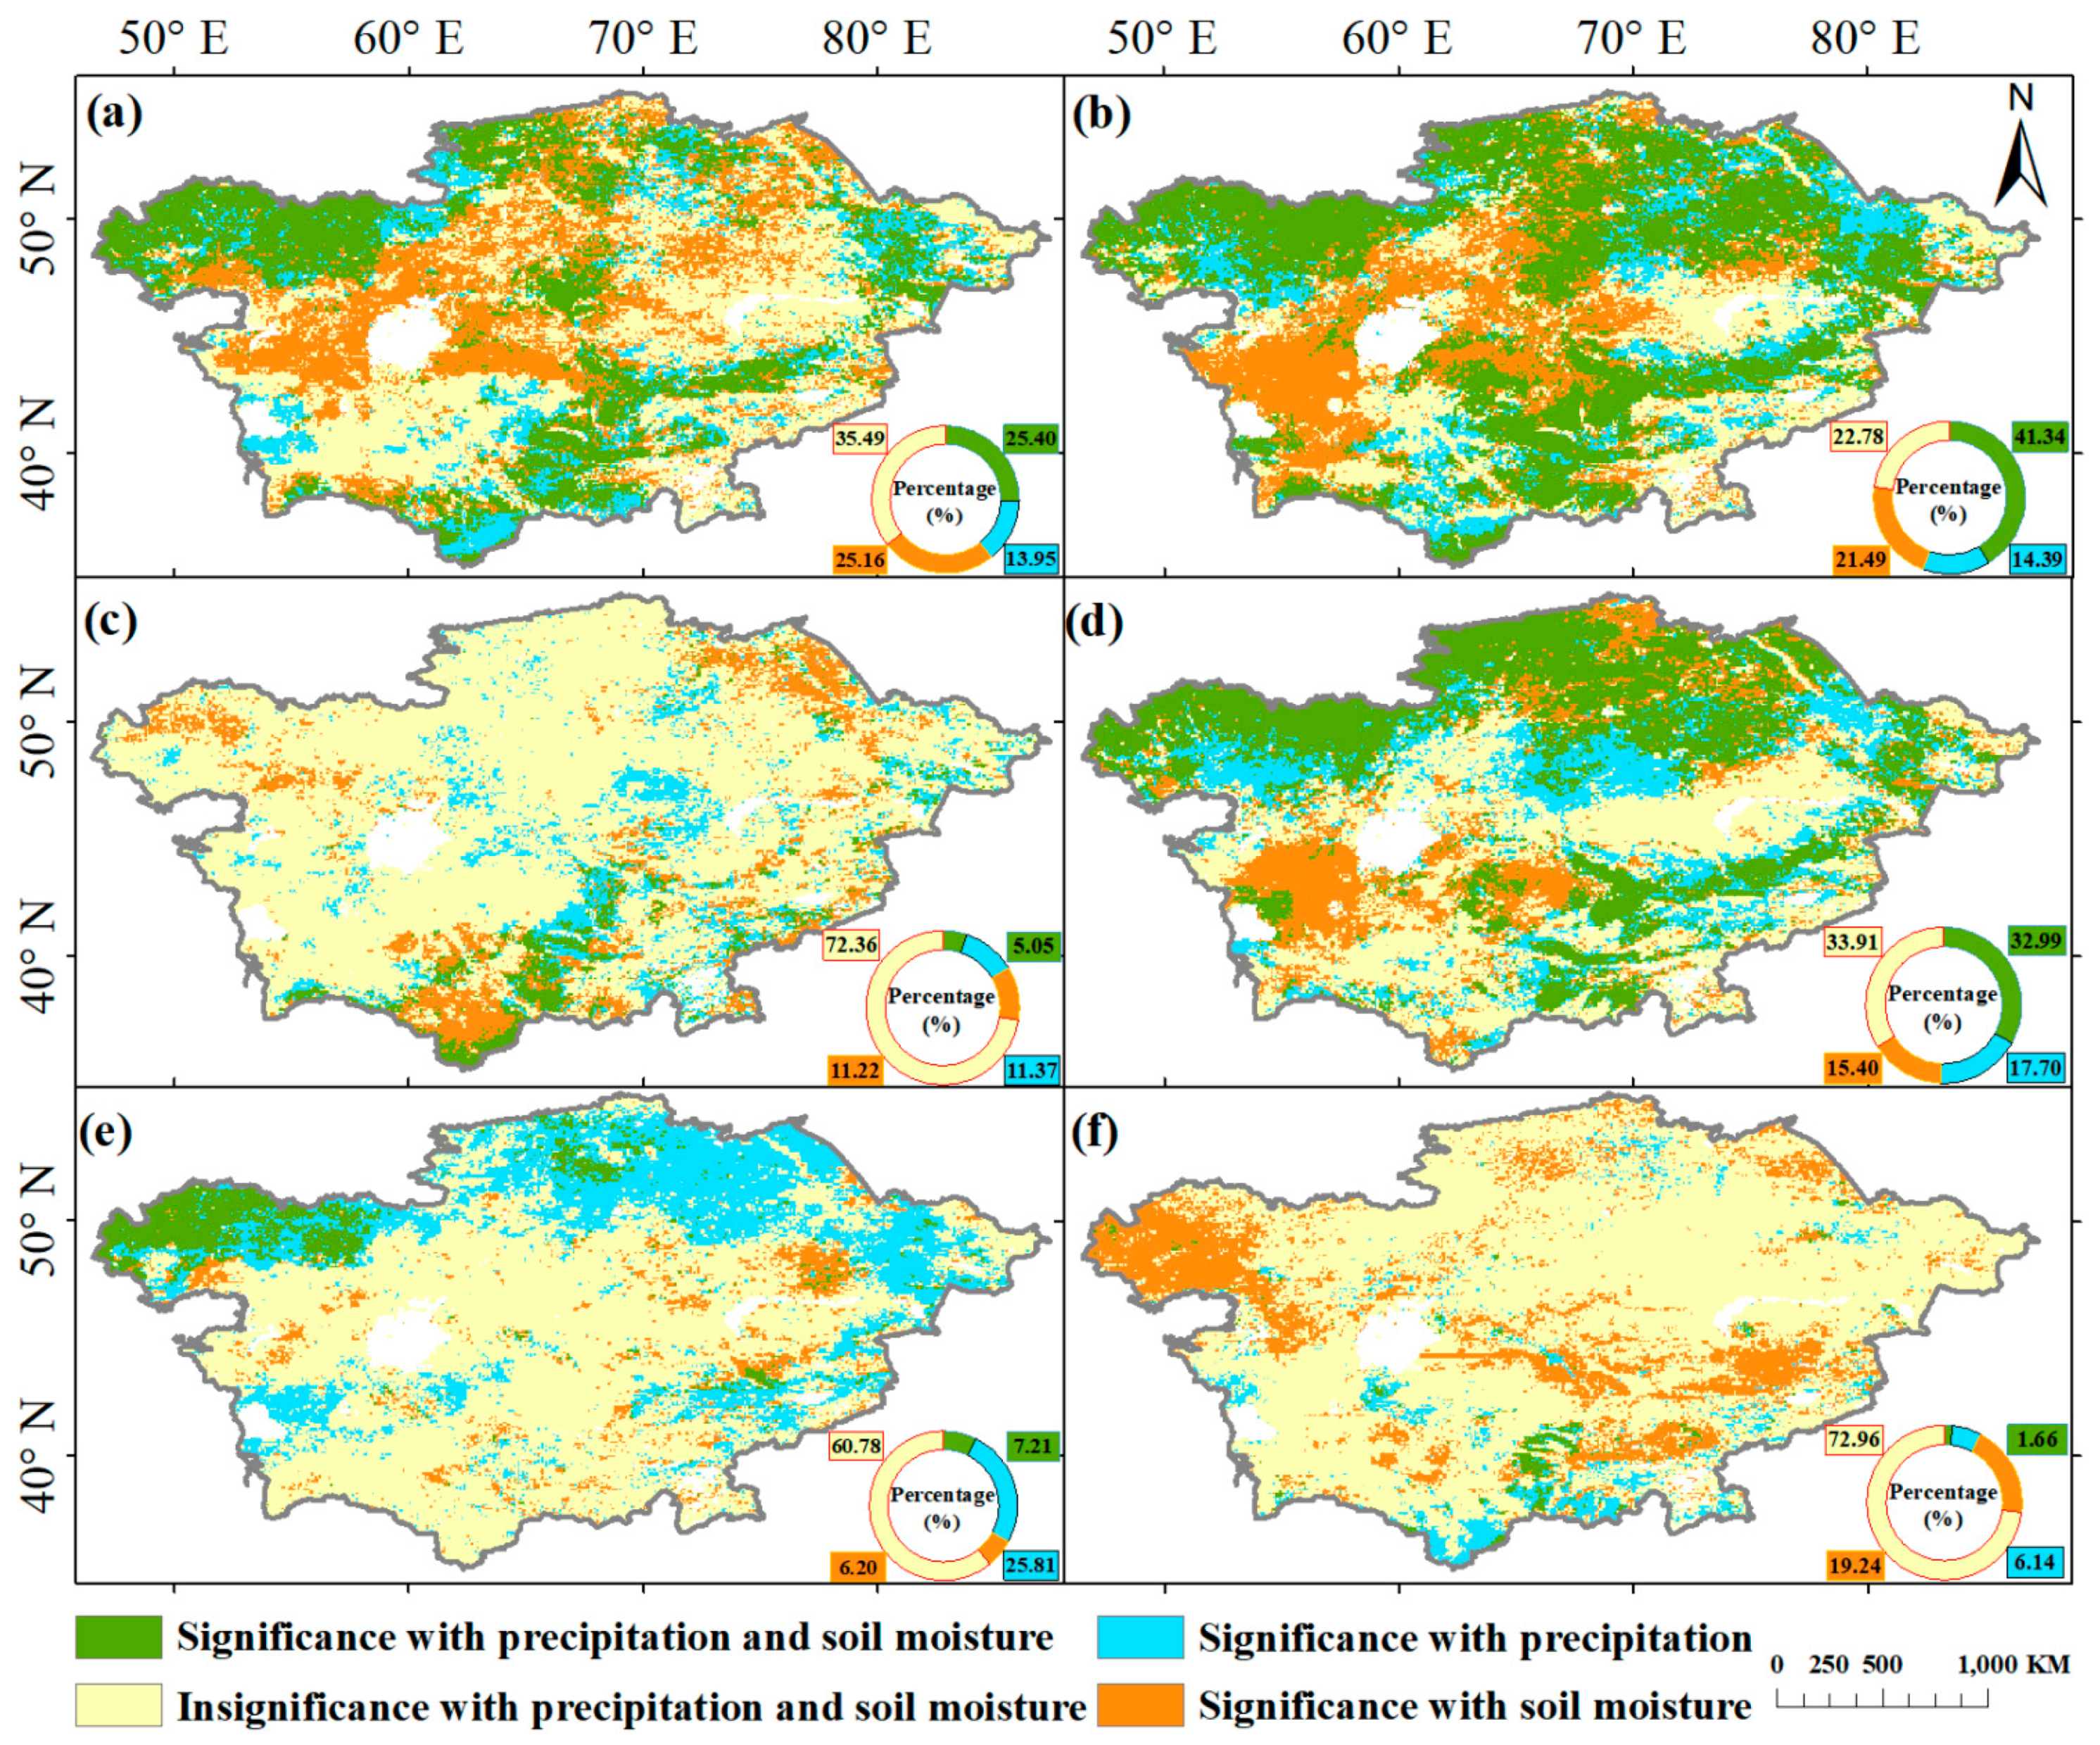
3.2.1. Significance of Correlations between Vegetation and Hydrothermal Conditions

The significant influence of hydrothermal factors on vegetation changes varied seasonally (Figure 3 and Figure 4). As shown in Figure 3, most pixels showing a significant correlation between PET and vegetation were identified at the annual and growing season scales, accounting for 63.12% and 52.10% of total pixels, respectively, and a small number of pixels showed a significant correlation between temperature and vegetation (Figure 3a,b). At the seasonal scale (excluding winter), the area showing a significant correlation between vegetation and PET was much larger than that showing the effect of temperature (Figure 3c–e). As for winter, only 16.17% of vegetation was found to have a significant correlation with hydrothermal factors (Figure 3f). Based on the significance of the correlation between vegetation and heat elements, PET is a useful supplement to the analysis.
As shown in Figure 4, the area showing a significant correlation between soil moisture and vegetation was larger than that showing vegetation’s relation with precipitation at the annual and growing season scales (Figure 4a,b). At the seasonal scales, smaller areas showing the significant effects of precipitation and soil moisture were found in spring and winter compared to other seasons, but most of these were regionally independent of one another (Figure 4c,f). We found that most pixels showed a significant correlation between vegetation and precipitation, accounting for 50.69% of the total vegetation area in summer (Figure 4d), but soil moisture may better illustrate the relationship between vegetation and climate in the Ustyurt Upland area. In addition, precipitation had a stronger effect on vegetation in the northern region of Central Asia in autumn (Figure 4e). Thus, the combined water conditions of precipitation and soil moisture could more effectively substantiate the influence of climate on vegetation changes.

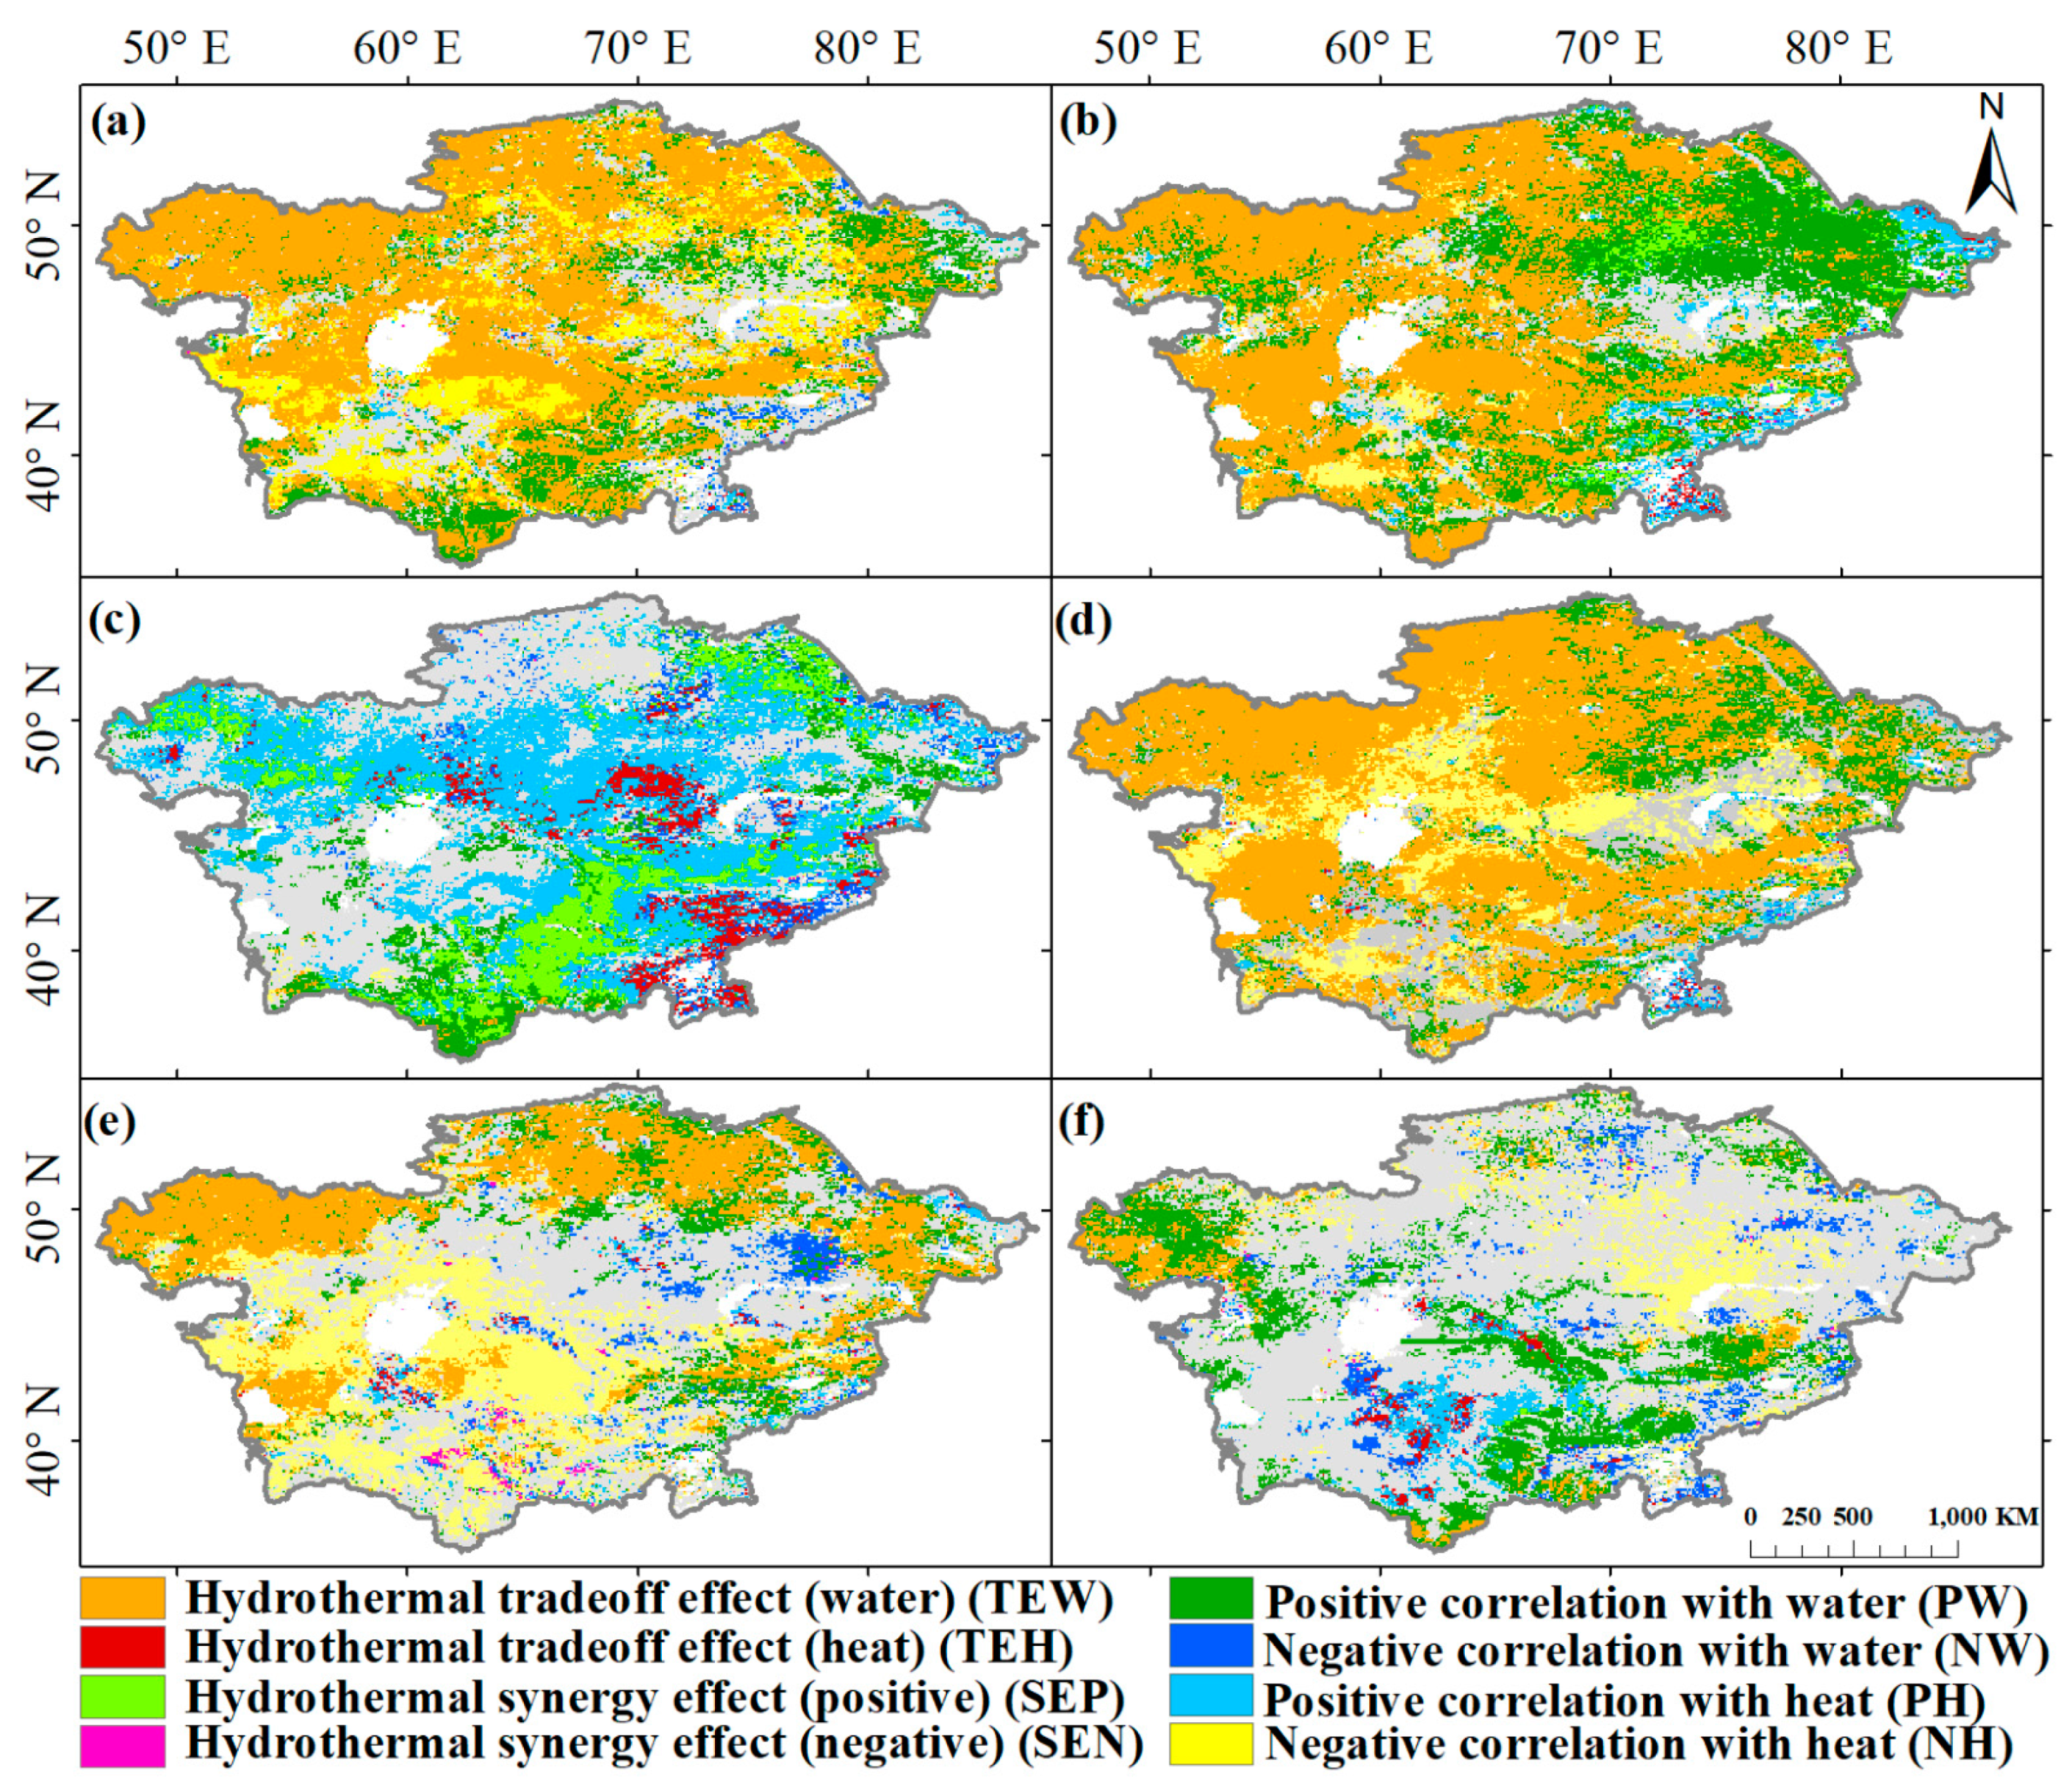
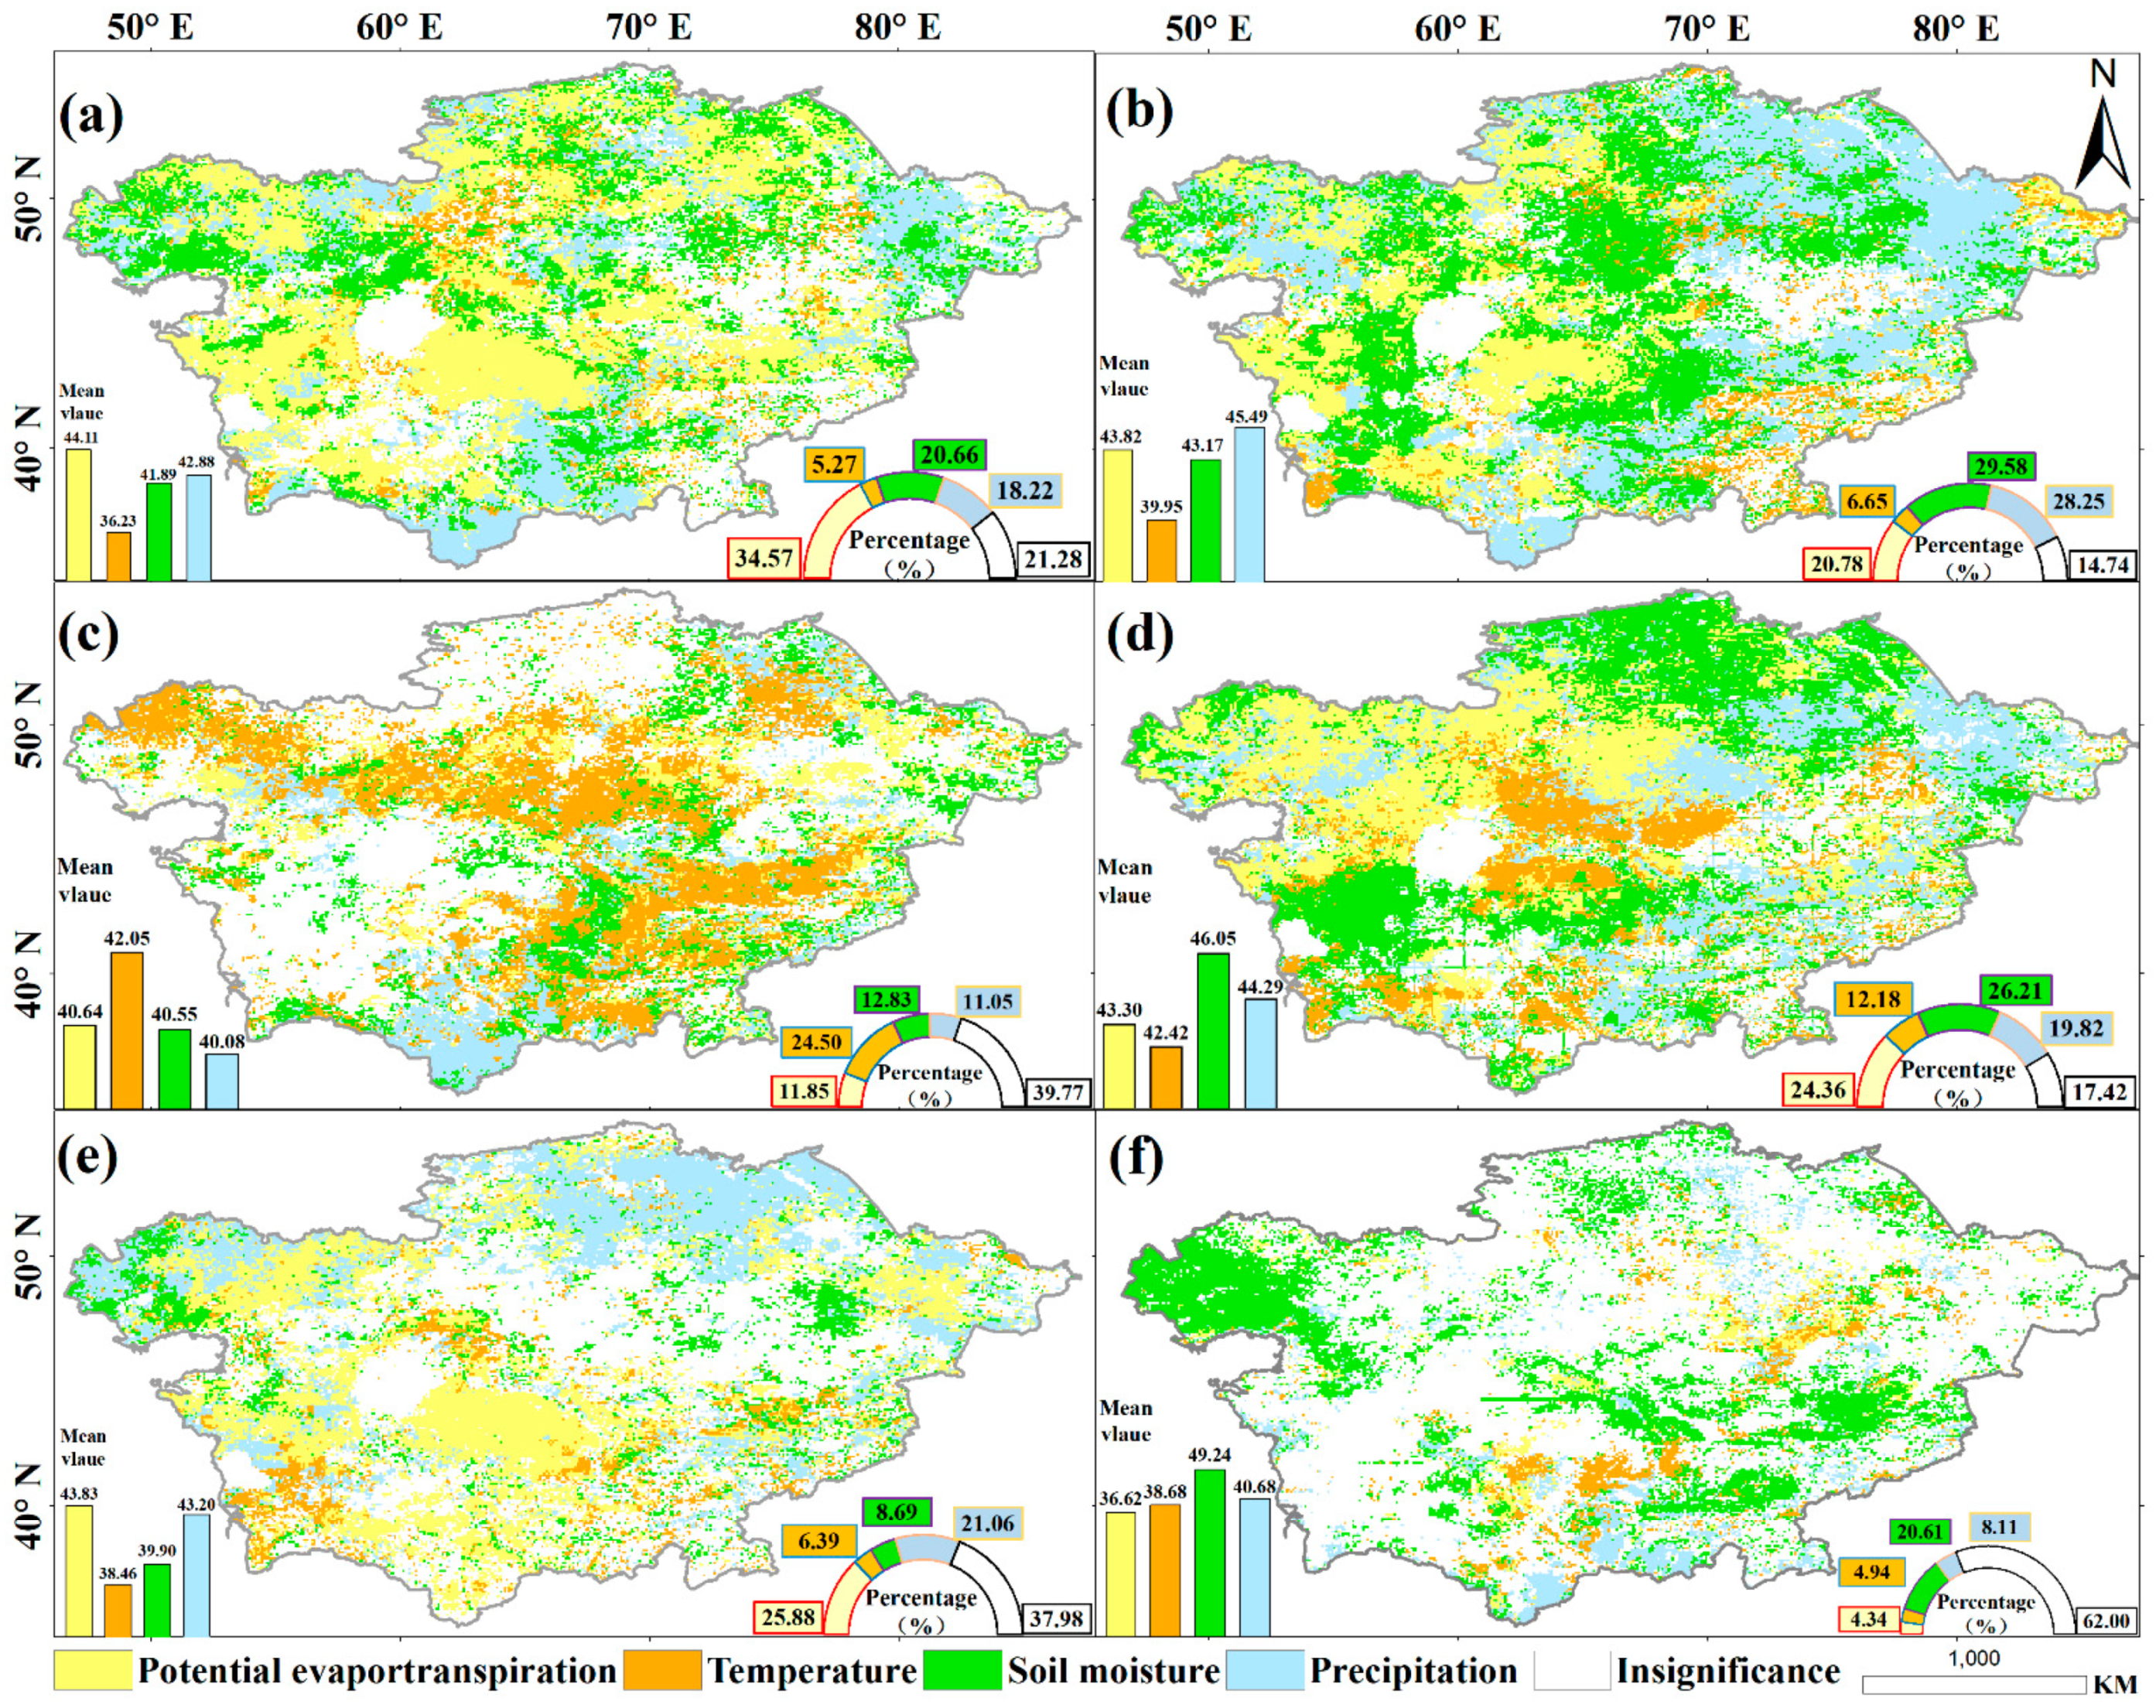
3.2.2. Superposition Analysis of Correlations between Hydrothermal Conditions and Vegetation

The correlation coefficients between hydrothermal factors and vegetation in Central Asia were calculated for the period 1982 to 2015. Based on the correlation between hydrothermal factors and vegetation, the region affected by water and heat conditions in terms of vegetation growth can be divided into different function types (Figure 5). In order to comprehensively consider the impact of water and heat conditions on vegetation growth, the correlation coefficients between hydrothermal factors and vegetation were superimposed to obtain integrated information on the different influences of hydrothermal conditions on vegetation in different seasons. The integrated results have been categorized into nine classes as shown in Table 3. In this study, a hydrothermal tradeoff was inferred when the water conditions and thermal conditions had opposite effects; hydrothermal tradeoff effects can be categorized as the positive effects of water conditions or the positive effects of heat conditions. The synergistic effects of the hydrothermal conditions were inferred when the water conditions and heat conditions exhibited the same effect; this can be classified as a positive synergistic effect or a negative synergistic effect.
According to the correlation coefficient r value and the significance p value, calculated by Formulas (6) and (8), we divided the functional areas showing the impact of water and heat conditions on vegetation into nine classes.
When the p value of the correlation between NDVI and hydrothermal factors is significant (ptep ≤ 0.05 and ppet ≤ 0.05, and ppre ≤ 0.05 and psm ≤ 0.05), four functional classes are established, namely:
(1).
Hydrothermal tradeoff effect (water) (TEW) (rpre > 0 or rsm > 0 and rtmp ≤ 0 or rpet ≤ 0 and ptep ≤ 0.05, and ppet ≤ 0.05 and ppre ≤ 0.05, and psm ≤ 0.05), that is, heat conditions have an inhibitory effect on vegetation growth, while water conditions have a promoting effect;
(2).
Hydrothermal tradeoff effect (heat) (TEH) (rpre < 0 or rsm < 0 and rtmp > 0 or rpet > 0 and ptep ≤ 0.05, and ppet ≤ 0.05 and ppre ≤ 0.05, and psm ≤ 0.05), that is, heat conditions have a promoting effect on vegetation growth, while water conditions have an inhibitory effect;
(3).
Hydrothermal synergy effect (positive) (SEP) (rpre > 0 or rsm > 0 and rtmp > 0 or rpet > 0 and ptep ≤ 0.05, and ppet ≤ 0.05 and ppre ≤ 0.05, and psm ≤ 0.05), that is, heat conditions and water conditions have a promoting effect on vegetation growth;
(4).
Hydrothermal synergy effect (negative) (SEN) (rpre < 0 or rsm < 0 and rtmp < 0 or rpet < 0 and ptep ≤ 0.05, and ppet ≤ 0.05 and ppre ≤ 0.05, and psm ≤ 0.05), that is, heat conditions and water conditions have an inhibitory effect on vegetation growth.
When the NDVI is significantly correlated with water factors (ppre ≤ 0.05 and psm ≤ 0.05) and insignificantly correlated with heat factors (ptep > 0.05 and ppet > 0.05), the function is divided into two classes:
(1)
Positive correlation with water (PW) (rpre > 0 or rsm > 0 and ppre ≤ 0.05, or psm ≤ 0.05 and ptep > 0.05 and ppet > 0.05), that is, water conditions promote vegetation growth, while heat conditions have an insignificant effect on vegetation growth;
(2)
Negative correlation with water (NW) (rpre < 0 or rsm < 0 and ppre ≤ 0.05, or psm ≤ 0.05 and ptep > 0.05 and ppet > 0.05), that is, water conditions have an inhibitory effect on vegetation growth, while heat conditions have an insignificant effect on vegetation growth.
When NDVI is significantly correlated with the heat factor (ptep ≤ 0.05 or ppet ≤ 0.05) and insignificantly correlated with the moisture factor (ppre > 0.05 and psm > 0.05), the function is divided into two classes:
(1)
Positive correlation with heat (PH) (rtmp > 0 or rpet > 0 and ptep ≤ 0.05, or ppet ≤ 0.05 and ppre > 0.05 and psm > 0.05), that is, heat conditions promote vegetation growth, while water conditions have an insignificant effect on vegetation growth;
(2)
Negative correlation with heat (NH) (rtmp < 0 or rpet < 0 and ptep ≤ 0.05, or ppet ≤ 0.05 and ppre > 0.05 and psm > 0.05), that is, heat conditions have an inhibitory effect on vegetation growth, while water conditions have an insignificant effect on vegetation growth.
When the NDVI value is insignificantly correlated with the heat and water conditions (ptep > 0.05 and ppet > 0.05, and ppre > 0.05 and psm > 0.05), the hydrothermal conditions have an insignificant effect on vegetation growth.
As shown in Table 4 and Figure 5, in the regions showing significant relationships between hydrothermal factors and vegetation at the annual scale, the hydrothermal tradeoff effect (water) (TEW) was highest (49.0%)—mostly in the West Siberian Plain, the Caspian Lowland, and the Turgay Upland—followed by areas showing positive correlation with water conditions (PW) (14.16%) and negative correlation with heat conditions (NH) (13.6%), and each of the other regions accounted for less than 1% (Figure 5a). This result shows that at the annual scale in Central Asia, water conditions had a promotional effect on vegetation growth, which was also affected by the tradeoff effect of heat conditions. Compared to the annual scale, significant differences in the proportions and spatial distributions of different function types were found during the growing season. The proportion of NH decreased by 9.2%, mainly in the desert area, while the proportion of PW increased by 13.47%, mainly in the Kazakh Upland (Figure 5b). In addition, areas showing positive correlations with heat (PH) were observed in the mountains. The results illustrate that the growth of vegetation was greatly affected by water conditions. However, the increase in temperature promoted vegetation growth in high-altitude areas at the annual and growing season scales. As an active period for vegetation, the growing season greatly depended on water conditions. At the same time, in the Kazakh Upland, the tradeoff effects of heat conditions on water conditions were weakened, indicating that water conditions were the key element promoting vegetation growth.
At the seasonal scale, about 32.11% of the pixels were located in the PH area, and the hydrothermal synergy effect (positive) (SEP) function type accounted for 10.80% of the total pixels, distributed in southeastern Central Asia. Moreover, the region showing a hydrothermal tradeoff effect (heat) (TEH) was identified as being in higher-altitude areas, accounting for 5.04% of the study area, in spring (Figure 5c). In summer, about 52.53% of the study area was influenced by the hydrothermal tradeoff effect (water) (TEW). Areas of NH were observed in the northern Turan Lowland, accounting for 15.20% of the vegetation area. Moreover, pixels showing PW accounted for 12.74% of the total area (Figure 5d). In autumn, the area of TEW accounted for 24.95% of all pixels, primarily in the northern region, and an area of NH was observed in the Aral Sea basin, accounting for 21.52% of the study area (Figure 5e). As for winter, most of the regions exhibited insignificant effects of hydrothermal conditions (62% of the total area). However, about 16.01% of the vegetation was located in PW areas, observed in the western Caspian Lowland and southeastern Central Asia. In addition, the function types of negative correlations with water (NW) and PH were identified in irrigation areas (Figure 5f).
In spring, during the vegetation recovery period, the climate warms and the demands of vegetation for heat and water increase. The warming of spring thus provides beneficial conditions for vegetation growth [53]; in summer, high temperatures prevail in Central Asia, and the tradeoff effects of thermal conditions on water conditions is enhanced, which accelerates the decline in soil water utilization and has a significant inhibitory effect on vegetation growth [34]. In autumn, thermal conditions continue to limit vegetation growth. There was a significant positive correlation between vegetation and moisture conditions in northern Central Asia, which was affected by the tradeoff effects of thermal conditions. Owing to the decrease in precipitation, however, vegetation was shown to be significantly negatively correlated with thermal conditions in the southern region of Central Asia [37]; winter is the non-growing season, and the NDVI value in this period showed a greater correlation with surface cover and soil.

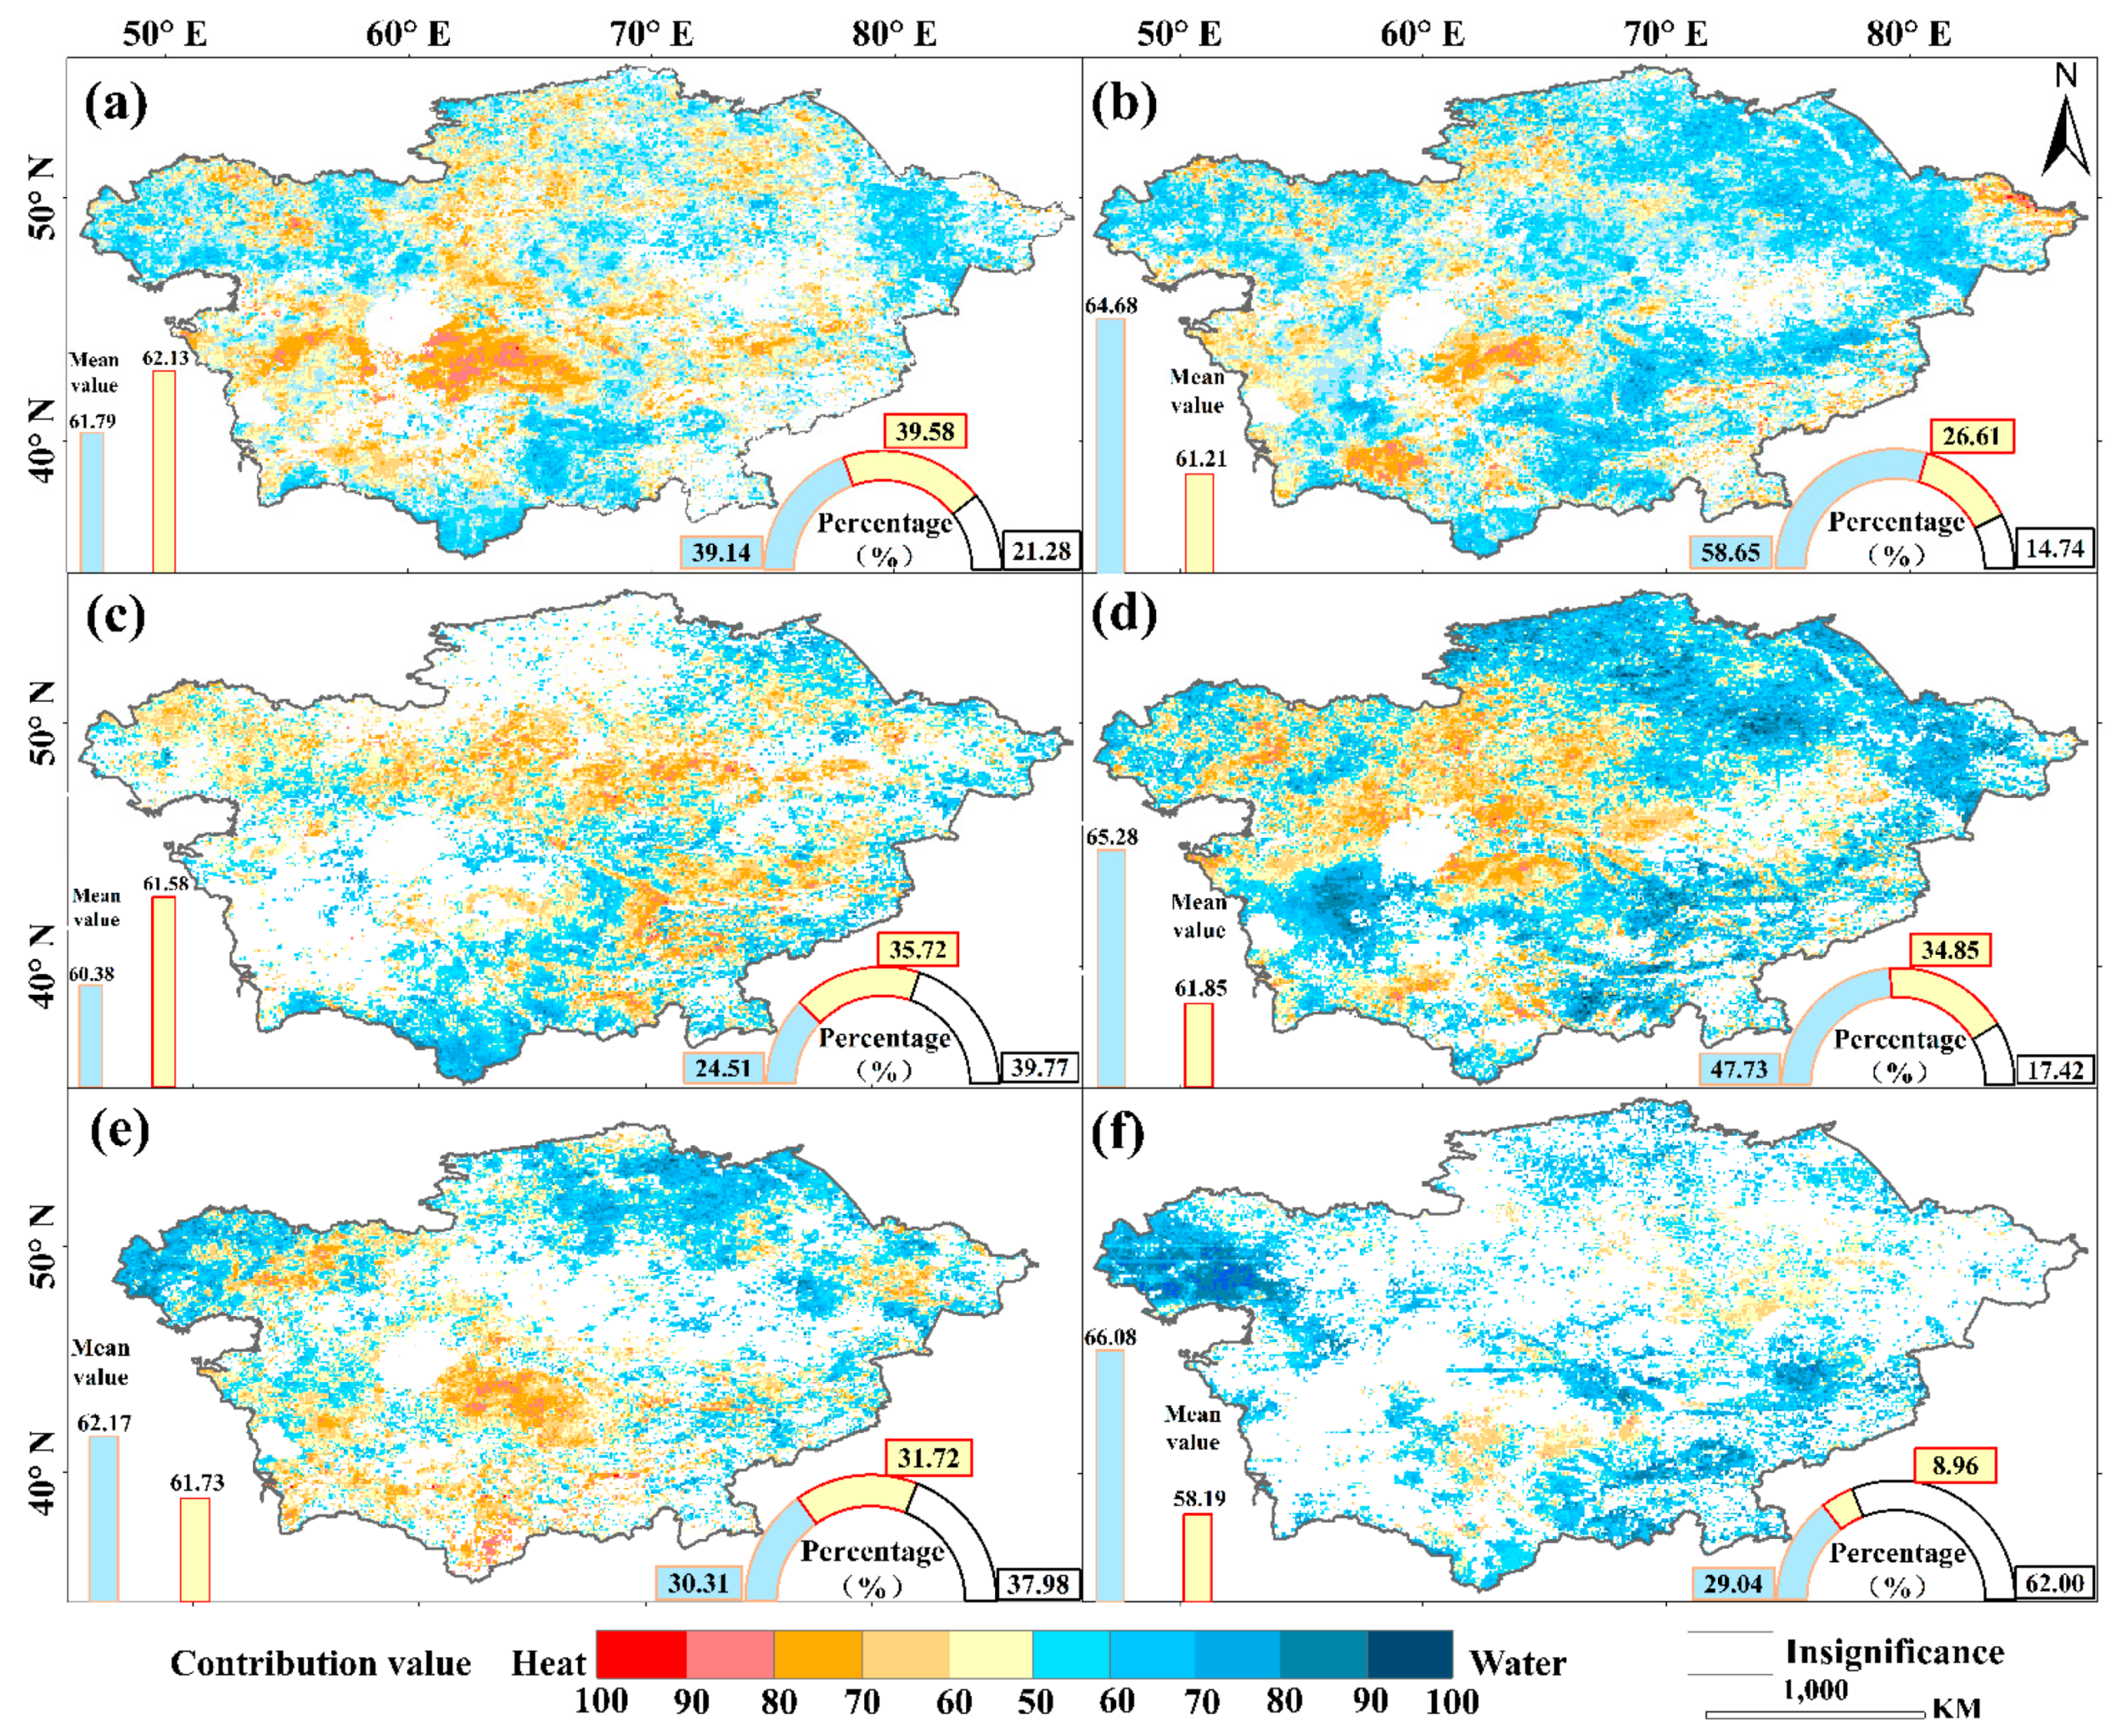
3.3. Contributions of Hydrothermal Conditions to Vegetation Changes

Through the BRT method, the contribution of hydrothermal factors to vegetation changes was quantified. Based on the contributions of different factors to vegetation change, we can calculate the contributions of heat conditions to vegetation changes, which were equal to the contribution of PET plus temperature to vegetation changes, and we can also calculate the contribution of water conditions, which equaled the contribution of soil moisture plus precipitation to vegetation changes (Figure 6).
There was a significant difference in the contribution of hydrothermal conditions to vegetation changes at different time scales. On the annual scale, about 39.58% of the vegetation was affected by thermal conditions, concentrated in the Ustyurt Upland, the Turan Lowland, the Turgay Valley, and high-altitude areas, with an average contribution value of 62.13% (Figure 6a). This can be attributed to the fact that the vegetation in these regions is sensitive to thermal conditions, and the increase in warming conditions (temperature or PET) in high-altitude areas promotes the early growth of vegetation in spring. Furthermore, due to the increase in warming conditions, the melting of frozen soil and snow provided water for vegetation growth [21]. In the inner regions of Central Asia, with an increase in warming conditions, soil evaporation and vegetation transpiration were intensified, and the effective use of water by the vegetation in the soil decreases, resulting in the senescence of the vegetation [30]. However, during the growing season, the area affected by thermal conditions was significantly reduced, and only accounted for 26.61% of the total study area, with its average contribution having reduced to 61.21%. The areas influenced by water conditions accounted for 58.65% of the total study area, and were distributed primarily in the east, with an average contribution of 64.68% (Figure 6b). During the growing season, the increase in wetting conditions (precipitation or soil moisture) was the main factor contributing to the growth of vegetation. The amount of precipitation was increased compared to the inter-annual scale, which effectively alleviated the inhibitory effects of heat conditions on vegetation growth.
The regional differences in the hydrothermal contribution values at the seasonal scale were significant. In spring, about 35.72% of the total study area was affected by thermal conditions, mostly in the southeast and middle regions of Central Asia, with an average contribution value of 61.58%. These areas were mostly grassland and positively correlated with temperature, indicating that the increase in temperature in spring can promote the growth of grassland vegetation, which is consistent with the results of Chu et al. and Propastin et al. [53,55]. The regions influenced by the contributions of water conditions were located in the the upper of the Aral Sea basin, and in southern Central Asia, with an average contribution value of 60.38% (Figure 6c). In summer, vegetation in the southern Karakum Desert and the middle of Central Asia was more influenced by thermal conditions, with an average contribution value of 61.85%. Moreover, 47.73% of the vegetation in the northeastern and southeastern mountainous and hilly regions of Central Asia was more influenced by water conditions, with an average contribution value of 65.28% (Figure 6d), showing that in the summers, in most parts of Central Asia, vegetation changes were affected by the interactions of water and heat conditions. The effects of water conditions on vegetation in the northern region exceeded those of heat conditions. On the contrary, the effects of heat conditions on vegetation growth were greater than those of water in the central region of Central Asia. In autumn, the latitudinal differences in the influence of hydrothermal conditions on vegetation variation were obvious; areas influenced by thermal conditions were concentrated in the southern part of Central Asia, accounting for 31.27% of the total study area, with an average contribution value of 61.73%. Areas where water conditions were the dominant factor were located in northern Central Asia, with an average contribution value of 61% (Figure 6e). These results are presumably attributable to the abundant precipitation in northern Central Asia, where the moisture conditions weaken the oppressiveness of thermal conditions. In south Central Asia, precipitation was relatively scarce, and water conditions had a weak influence on thermal conditions. Therefore, changes in thermal conditions had a greater impact on vegetation. In winter, the areas dominated by thermal conditions were concentrated in the Kazakh Upland and the Aral Sea basin, accounting for 8.96% of the total study area, with an average contribution of 58.19%, while the areas dominated by water conditions were broadly scattered in the northern, western, and eastern regions of Central Asia, with an average contribution of 66.08% (Figure 6f). As winter is the non-growing season for vegetation, in most areas, the correlation between vegetation and hydrothermal conditions was insignificant. The relationship between NDVI and hydrothermal conditions depended on the land coverage. For example, the vegetation in river irrigation areas was more affected by thermal conditions [37].
To identify the differences in the contribution values of thermal and water conditions in different function types, we calculated the mean values of pixels in different functional types, as shown in Figure 7. On the annual scale, the contribution value of the increase in warming conditions (temperature or PET) to vegetation senescence was 61.84% in NH, and the contribution value of the increase in warming conditions to vegetation greenness was 64.85% in PH. The contribution value of increasing wetting conditions (precipitation or soil moisture) to vegetation loss was 57.15% in NW, and the contribution value of increasing wetting conditions to vegetation growth was 60% in PW. The contribution value of increasing warming conditions to vegetation growth was 52.27% in SEN, and the contribution value of increasing wetting conditions was 47.30% in the region of SEP; the contribution value of increasing warming conditions to vegetation decline in the region of THE was 51.83%, and the contribution value of increasing wetting conditions was 50.08% in TEW (Figure 7a). Compared with the annual scale, in the growing season, the contribution value of increasing warming conditions to vegetation growth increased to 62.19% in NH (Figure 7b—NH), and the positive contribution value decreased to 61.84% in PH (Figure 7b—PH); the contribution value of wetting conditions to vegetation degradation increased to 59.36% in NW (Figure 7b—NW), and the positive contribution value increased to 63.73% in PW (Figure 7b—PW). The contribution value of increasing warming conditions to vegetation degradation decreased to 43.25% in SEN (Figure 7b—SEN), and the positive contribution of increasing wetting conditions to vegetation growth increased to 54.80% in SEP (Figure 7b—SEP); the positive contribution value of increasing warming conditions to vegetation growth in the hydrothermal tradeoff region increased to 55.93% (Figure 7b—TEH), and the positive contribution of increasing wetting conditions increased to 55.90% (Figure 7b—TEW). The results indicate that water conditions played a crucial role in the vegetation growth period in Central Asia, and with the increase in precipitation, the influence of moisture conditions inhibiting the heat conditions’ effects on vegetation was alleviated.
At the seasonal scale, the contribution value of increasing warming conditions to vegetation greenness was greater than that of water conditions in NH and PH, while the contribution of increasing wetting conditions to vegetation growth was greater than that of thermal conditions in NW and PW. The contribution value of increasing wetting conditions to vegetation changes in SEN and SEP was greater than that of warming conditions in spring and summer, but warming conditions contributed more to vegetation changes than water conditions in autumn and winter in SEN and SEP areas. The positive contribution value of increasing wetting conditions to vegetation growth in TEH and TEW was greater than that of warming conditions at the seasonal scale (Figure 7c–f). The results show that the synergy and tradeoff effects of hydrothermal conditions varied with the season. In most areas, heat conditions made a greater contribution to vegetation growth in spring. In summer, with the increase in temperature, the limiting influence of thermal conditions on vegetation was strengthened in TEW, and with the increase in precipitation, the tradeoff effects of water conditions on thermal conditions were strengthened in PW. In autumn, with the decrease in precipitation in most areas, the tradeoff effect of water conditions on thermal conditions weakened, and the inhibitory effect of thermal conditions on vegetation increased. In winter, the contribution values of water conditions in most areas were greater than those of heat conditions, but the contribution value of heat conditions were higher than those of water conditions in irrigation areas.

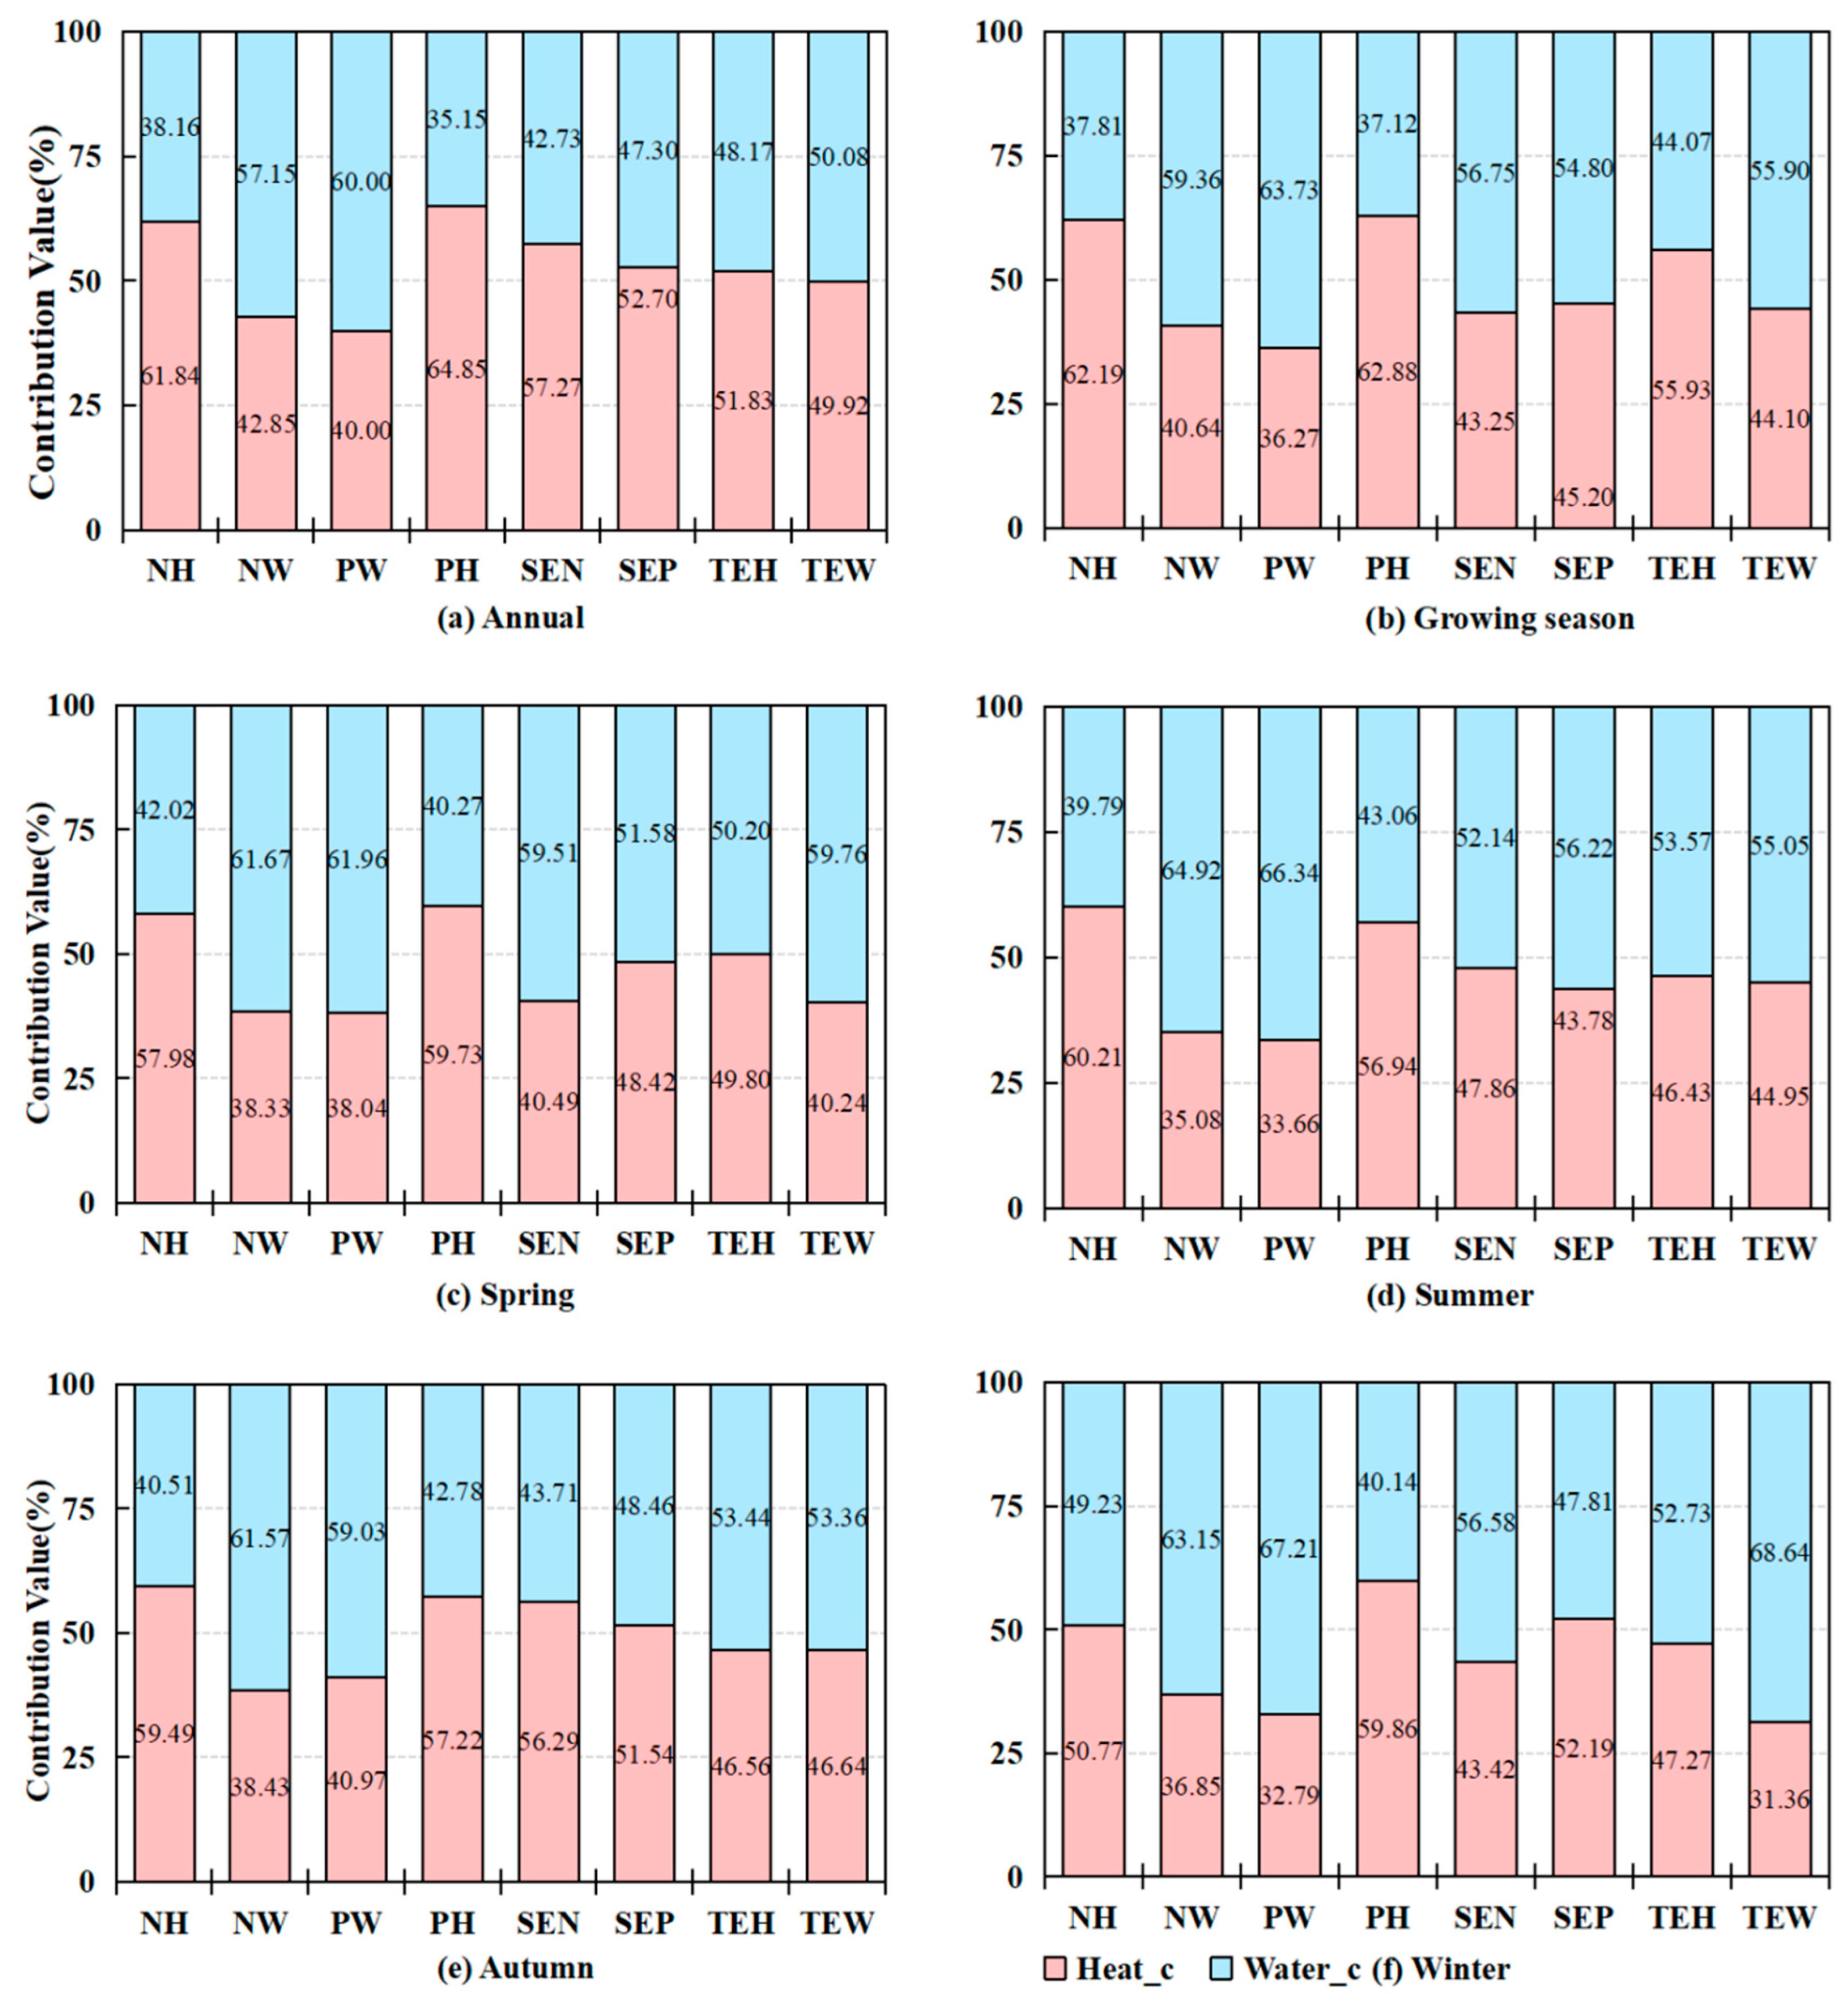
3.4. Contributions of Hydrothermal Factors to Vegetation Change

The contribution value of hydrothermal factors to vegetation growth in Central Asia were investigated for the period 1982 to 2015 (Figure 8). On the annual scale, approximately 34.57% of the regional vegetation variation was strongly influenced by PET, particularly in the Aral Sea basin, the Ustyurt Upland, and the Karakum Desert, with an average contribution of 44.11%. The proportion of areas influenced by soil moisture accounted for 20.66% of the study areas, mostly in the central regions of Central Asia, with an average contribution value of 41.89%. Around 18.22% of the total pixels were influenced by precipitation, particularly in the eastern and southern regions, with an average contribution of 42.88%. The area of vegetation affected by temperature accounted for 5.27%, mainly distributed in the Turgay Valley and southeastern mountainous areas, with an average contribution of 36.23% (Figure 8a). Compared to the annual scale, the percentage of the area of vegetation mainly affected by soil moisture and precipitation increased by 18.95% in the growing season. Moreover, the average contribution values of soil moisture and precipitation to vegetation exhibited increasing trends in the eastern region, from 441.89% to 43.17% and from 42.88% to 45.49% respectively. Vegetation dynamics influenced by PET accounted for 20.78% of all pixels, mainly distributed in the Kyzylkum Desert and the Karakum Desert, with an average contribution value of 43.82% (Figure 8b). This result shows that the increase in soil moisture effectively alleviated the inhibitory effect of PET on vegetation during the growth period.
On the seasonal scale, about 24.50% of the vegetation change was mainly affected by temperature, with an average contribution value of 42.05% in spring (Figure 8c). Soil moisture was the main hydrothermal factor affecting vegetation variations in the Ustyrt Plateau and northern Central Asia, with an average contribution value of 46.05% in summer (Figure 8d). In addition, about 25.88% of vegetation changes were mainly caused by PET, with an average contribution of 43.83% in autumn (Figure 8e). However, 20.61% of vegetation changes are mainly affected by soil moisture, with an average contribution value of 49.24% in winter (Figure 8f).
In spring, the increase in temperature promoted the advancement of the phenological period of vegetation, and the melting of ice and snow, supplementing soil moisture and providing favorable environmental conditions for vegetation growth [53]. In summer, with the increase in temperature, the negative impact of PET on vegetation in the northwestern region increased, while the increase in soil moisture in the northeast region effectively alleviated the inhibitory impact of temperature on vegetation [34]. In autumn, with the decrease in precipitation, the tradeoff effect of water conditions on heat conditions weakened, and PET, as the main factor affecting soil moisture, had an increased negative impact on vegetation [36]. In winter, soil moisture in the irrigation area was relatively abundant, the growth of vegetation was limited by heat conditions, and the contributions of temperature and PET to the growth of vegetation were greater [36,37].
Furthermore, the contribution of hydrothermal factors to vegetation changes was investigated for different functional types. As shown in Figure 9, the contribution of hydrothermal factors to vegetation change varied slightly across time scales in different functional types. At the annual scale, PET was the main driving factor of vegetation changes in NH and PH; decreasing soil moisture was the main factor that inhibits vegetation growth, with a negative contribution value 35.92% in NW (Figure 9a—NW), and increasing precipitation was the main factor promoting vegetation growth, with a positive contribution value of 32.71% in PW (Figure 9a—PW). In SEN, vegetation growth was mainly inhibited by the increasing PET, with a negative contribution value of 39.06% (Figure 9a—SEN), and an increasing temperature, acting as the main factor, promoted vegetation growth, with a positive contribution value of 30.1% in SEP (Figure 9a—SEP). In areas of TEH and TEW, the inhibitory effect of the increasing PET on vegetation growth (Figure 9a—the) exceeded its promotional effect (Figure 9a—TEW). Compared with the annual scale, the decreasing soil moisture was the main factor inhibiting the growth of vegetation in SEN (Figure 9b—SEN), and the increase in precipitation had the largest positive effect on vegetation growth at 31.89% in SEP (Figure 9b—SEP). In hydrothermal tradeoff areas, increasing temperature and soil moisture were the main promoting factors for vegetation growth, with a contribution value of 31.68% and 30.52%, respectively (Figure 9b—TEH,TEW). Further, the contribution value of PET to vegetation changes decreased in the growing season (Figure 9b—NH, SEN, SEP, TEH, TEW). Additionally, in most regions, the contribution of precipitation to vegetation change increased, while the contribution of PET to vegetation change decreased, indicating that precipitation during the vegetation growth period had a certain mitigating effect on the inhibitory action of high temperatures in Central Asia.
At seasonal scales, the hydrothermal conditions that dominated vegetation changes varied between different functional types, and the tradeoff and synergy effects between water and heat conditions were different. In PH, temperature was the main driving factor for vegetation growth in all seasons (Figure 9c–f—PH), while PET had the largest negative effect on vegetation changes in spring and autumn in NH (Figure 9c—NH, Figure 9f—NH). In NW, the increasing soil moisture was the main driving factor for vegetation degradation at the season scale (Figure 9c–f), and in PW, the increasing precipitation played a vital role in promoting vegetation growth in spring and autumn (Figure 9c,f), while the increasing soil moisture was the main promoting factor in vegetation growth in summer and winter (Figure 9d,g). In SEN, the increase in soil moisture was the main driving factor of vegetation degradation in spring and summer (Figure 9c,d) and the increasing PET was the main inhibitory factor in autumn (Figure 9f), while vegetation senescence was inhibited by the increasing precipitation in winter (Figure 9g). In areas of SEP, the increasing temperature was the most important factor for vegetation growth in spring, autumn, and winter (Figure 9c,f,g), but in summer, the increase in soil moisture played the main role in vegetation greenness (Figure 9d). In TEH, soil moisture played an important role in vegetation growth in spring, summer, and autumn (Figure 9c,d,f). Precipitation, however, was an important factor for vegetation degradation in winter (Figure 9g). In THW, the increasing soil moisture was the major factor for vegetation growth in spring, summer, and winter (Figure 9c,d,g), while precipitation was the main factor affecting the value of NDVI in winter (Figure 9g).

4. Discussion

Studies have found that vegetation in the northern hemisphere has been increasing, mainly in middle and high latitudes [15,56,57]. Lou et al. found that NDVI increased during the growing season in most areas of Central Asia, which is consistent with this study’s results [58]. Additionally, our research found that vegetation in eastern Central Asia showed a significant increase in spring. Further, the current study found that during the growing season, vegetation in the Ustyurt Upland and the middle and lower reaches of the Aral Sea basin deteriorated significantly, while the vegetation in the Kazakh Upland was significantly improved, which is consistent with the results of Jiang et al. and Lou et al. [37,58]. Further, this study also compared the spatial changes of vegetation at other scales, and found that some areas in the middle and lower reaches of the Aral Sea basin and the Ustyurt Upland improved in spring and winter, but the vegetation in the Kazakh Upland showed a downward trend in autumn and winter.
Climate warming and precipitation changes in Central Asia had an important impact on vegetation dynamics [24,29,30,37]. Previous studies found that in Central Asia, due to the increase in temperature and potential evapotranspiration and the decrease in precipitation in summer, the vegetation water deficit showed a significant upward trend, which in turn caused the decline of vegetation [34]. However, the causes of vegetation changes were spatially and temporally heterogeneous [3,13,41,44]. Yin et al. [36] found that the annual, growing season, summer, and winter NDVIs exhibited a positive correlation with precipitation and a negative correlation with temperature, while the NDVI for spring showed a significant positive correlation with temperature in Central Asia. Jiang et al. [37] found that desert areas were positively correlated with precipitation, while mountain and plateau areas were negatively correlated, which is consistent with the results of this researcher. In addition, the current research takes soil moisture and PET into consideration, and quantitatively evaluates the contributions of hydrothermal elements to vegetation dynamics in terms of different hydrothermal conditions’ tradeoff and synergy functions. According to the mean value of the NDVI time series for different functional types of hydrothermal conditions, the linear regression method was used to fit the trend slope of NDVI, as shown by Table 5 [36]. Our results had temporal and spatial heterogeneity between different functional types. Vegetation changes showed a downward trend in NH at the annual, growing season, and seasonal scales (Table 5—NH). The thermal conditions in these regions had the largest contributory values, especially the thermal factor PET, indicating that an increase in temperature led to an increase in potential evapotranspiration, accelerating the consumption of water available in the soil and inhibiting the growth of vegetation in this region. Xu et al. also found that the increase in temperature and the decrease in precipitation in Central Asia exacerbated the degree of drought and inhibited the growth of summer vegetation [34]. However, the vegetation became greener at the annual and growing season scales, mainly in the high-altitude grassland in PH. These were areas where sufficient water and insufficient heat were important factors limiting vegetation growth. The increase in temperature compensated for the lack of heat and promoted the growth of vegetation. This is consistent with the results reported by Jiang et al. [37].
Among the regions that only showed the significant effects of water conditions (Table 5—NW, PW), vegetation showed greenness changes at the annual, spring, and autumn scales in NW. In contrast, the vegetation experienced a tendency towards greening at the annual and growing season scales, and in spring and summer in PW, where precipitation played an important role in vegetation growth. This result is attributed to the increases in precipitation in the plateau and mountainous areas, which hindered the photosynthesis of vegetation [55], while the increase in precipitation in the Kazakh Upland improved soil moisture and weakened the negative effects of thermal conditions on vegetation [32].
In hydrothermal-condition synergy areas (Table 5—SEN, SEP), vegetation deteriorated, and we found that PET made an important negative contribution in SEN, indicating that the increase in temperature brought about an increase in PET, which reduced the moisture in the soil surface and led to senescence, as is consistent with the views of Mohammat et al. [42]. Vegetation in SEP showed a greenness trend, except in winter, which reflects the positive feedback between vegetation and temperature increase in Central Asia.
The greenness of vegetation in TEH was observed at different time scales (Table 5—TEH). The increase in temperature and PET were the main reasons for vegetation greening at the annual and growing season scales, while reductions in precipitation were the main reason for vegetation greening in this region on the seasonal scale, which also verified that the temperature in Central Asia has undergone an upward trend over the last 30 years, while the precipitation in these regions has shown a downward trend [59]. Overall, a lack of vegetation was found in TEW, mainly attributed to the increase in temperature (Table 5—TEW), enhancing the impact of drought stress on vegetation and inhibiting the growth of vegetation [34]. Specifically, there was significant spatial heterogeneity in the regional vegetation changes in TEW. In the eastern part of Central Asia, including the northern and eastern areas of the Kazakh Upland and the southeastern mountainous region, the vegetation was significantly greener on the annual and growing season scales and in summer, owing to the increase in soil moisture and precipitation [21,36,37]. In contrast, the vegetation deteriorated significantly in the central and western areas, including in the Caspian Sea Lowland and the Ustyurt Upland, because of the increase in temperature and the decrease in precipitation, which is consistent with the results reported by Xu et al., Yin et al., and Jiang et al. [34,36,37]. Additionally, we found that in the desert area of the Turan Lowland, the senescence was attributed to the increase in PET, which accelerated soil water depletion and inhibited the growth of vegetation [12].
However, vegetation dynamics may be affected by changes in other factors, such as CO2 concentration, soil composition, light intensity, and human activities, in the regions that exhibited no significant relationships between vegetation and hydrothermal conditions [6,14,20,60,61,62]. In addition, the winter surface vegetation coverage is the lowest relative to the other five time scales, resulting in a greater impact for surface conditions on vegetation changes in this season.
This research considered two factors driving vegetation changes, namely, water and heat, and quantitatively calculated the contributions of hydrothermal conditions to vegetation dynamics on the annual, growing season, and seasonal scales. The contributions of different hydrothermal factors to vegetation were also calculated. However, the effects of other factors on vegetation changes were not considered, and the contributions of climate factors, other than hydrothermal conditions, to vegetation change were not evaluated. The calculated hydrothermal contribution values also contain a certain degree of uncertainty. A consideration of the synergy and trade-off effects between hydrothermal conditions, together with the roles of other climatic factors, will be the focus of future research.

5. Conclusions

This present study investigated the spatiotemporal characteristics of vegetation dynamics in Central Asia during the period from 1982 to 2015, and identified areas with differing relationships between hydrothermal conditions and vegetation dynamics. Further, the contribution values of hydrothermal conditions to vegetation variation were quantitatively evaluated based on the AVHHR GIMMS NDVI 3g dataset and gridded climate data. The results indicate that the vegetation dynamics exhibited significant temporal and regional characteristics. There was a weak increasing trend in vegetation greenness in the spring and growing season, primarily in eastern Central Asia.
Different function types for the effects of hydrothermal conditions on vegetation variations showed significant temporal and spatial heterogeneity. Function type was dominated by TEW at the annual and growing season scales, and in summer. However, the proportion of NW was largest in spring. In autumn, the main function type was TEW in northern Central Asia, while in southern Central Asia, it was NH. In addition, most irrigation areas were located in PH in winter.
The results of the quantitative evaluation of the hydrothermal factors affecting vegetation variations reveal that the contributions of thermal conditions and water conditions at different time scales varied from 58.19% to 62.13%, and from 60.38% to 66.08%, respectively. Increasing PET played a dominant role in vegetation senescence in the Kyzlkum Desert and Karakum Desert at the annual scale and during the growing season, but the increase in warming conditions (temperature or PET) made positive contributions to vegetation growth in high-altitude areas. In addition, the increase in wetting conditions (precipitation or soil moisture) had a positive effect on the growth of vegetation in northeast Central Asia during the growing season. On the seasonal scale, there were significant differences between the contributions of water and heat conditions to vegetation growth. In spring, increasing water and heat conditions had positive contributions to vegetation growth in most areas of Central Asia. In summer, increasing warming conditions (temperature or PET) were the main limiting factor for vegetation growth, and the increase in wetting conditions (precipitation or soil moisture) made a positive contribution to vegetation growth. However, in high-altitude areas, warming conditions promoted vegetation growth. In autumn, the increase in warming conditions was the limiting factor for vegetation growth in the Aral Sea basin and the Ustyur Upland, while the increase in wetting conditions made a positive contribution to vegetation growth in the northern region of Central Asia. In addition, warming conditions made a positive contribution to vegetation growth in the river irrigation areas in winter.

Author Contributions

J.Q. designed the research. X.X. processed the data, analyzed the results and wrote the manuscript. C.C. downloaded the data and performed preprocessing. J.S. and S.W. debugged the computer code and supporting algorithms. X.C., D.Y. and Z.Z. contributed to the processes of data processing and paper writing. All authors have read and agreed to the published version of the manuscript.

Funding

This work was funded by the Strategic Priority Research Program of the Chinese Academy of Sciences, Pan-Third Pole Environment Study for a Green Silk Road, grant number Pan-TPE XDA20060303, and Shenzhen International S&T Cooperation Project, grant number GJHZ20190821155805960; and the Deployment project of the Maritime Surgery Education Cooperation Center of the Chinese Academy of Sciences, grant number 131965KYSB20210024, and the National Natural Science Foundation of China, grant number 41971386.

Institutional Review Board Statement

Not applicable.

Informed Consent Statement

Not applicable.

Data Availability Statement

The data that support the findings of this study are available from the corresponding author upon reasonable request.

Conflicts of Interest

The authors declare no conflict of interest.

Appendix A

Figure A1. The flowchart of this study.
Land 11 00327 g0a1

References

  1. Foley, J.A.; Levis, S.; Costa, M.H.; Cramer, W.; Pollard, D. Incorporating dynamic vegetation cover within global climate models. Ecol. Appl. 2000, 10, 1620–1632. [Google Scholar] [CrossRef]
  2. Cao, M.; Woodward, F.I. Dynamic responses of terrestrial ecosystem carbon cycling to global climate change. Nature 1998, 393, 249–252. [Google Scholar] [CrossRef]
  3. Peng, J.; Liu, Z.; Liu, Y.; Wu, J.; Han, Y. Trend analysis of vegetation dynamics in Qinghai–Tibet plateau using hurst exponent. Ecol. Indic. 2012, 14, 28–39. [Google Scholar] [CrossRef]
  4. Piao, S.; Wang, X.; Ciais, P.; Zhu, B.; Wang, T.; Liu, J. Changes in satellite-derived vegetation growth trend in temperate and boreal Eurasia from 1982 to 2006. Glob. Chang. Biol. 2011, 17, 3228–3239. [Google Scholar] [CrossRef]
  5. Zhu, S.; Li, C.; Shao, H.; Ju, W.; Lv, N. The response of carbon stocks of drylands in Central Asia to changes of CO2 and climate during past 35 years. Sci. Total Environ. 2019, 687, 330–340. [Google Scholar] [CrossRef] [PubMed]
  6. Chen, T.; Xia, J.; Zou, L.; Hong, S. Quantifying the Influences of Natural Factors and Human Activities on NDVI Changes in the Hanjiang River Basin, China. Remote Sens. 2020, 12, 3780. [Google Scholar] [CrossRef]
  7. Peng, S.; Piao, S.; Ciais, P.; Myneni, R.B.; Chen, A.; Chevallier, F.; Dolman, A.J.; Janssens, I.A.; Peñuelas, J.; Zhang, G.; et al. Asymmetric effects of daytime and night-time warming on Northern Hemisphere vegetation. Nature 2013, 501, 88–92. [Google Scholar] [CrossRef]
  8. Zhu, L.; Meng, J.; Zhu, L. Applying Geodetector to disentangle the contributions of natural and anthropogenic factors to NDVI variations in the middle reaches of the Heihe River Basin. Ecol. Indic. 2020, 117, 106545. [Google Scholar] [CrossRef]
  9. Vicente-Serrano, S.M.; Gouveia, C.; Camarero, J.J.; Beguería, S.; Trigo, R.; Lopez-Moreno, J.I.; Azorin-Molina, C.; Pasho, E.; Lorenzo-Lacruz, J.; Revuelto, J.; et al. Response of vegetation to drought time-scales across global land biomes. Proc. Natl. Acad. Sci. USA 2013, 110, 52–57. [Google Scholar] [CrossRef] [Green Version]
  10. Nemani, R.R.; Keeling, C.D.; Hashimoto, H.; Jolly, W.M.; Piper, S.C.; Tucker, C.J.; Myneni, R.B.; Running, S.W. Climate-Driven Increases in Global Terrestrial Net Primary Production from 1982 to 1999. Science 2003, 300, 1560–1563. [Google Scholar] [CrossRef] [Green Version]
  11. Hasanuzzaman, M.; Nahar, K.; Alam, M.; Roychowdhury, R.; Fujita, M. Physiological, Biochemical, and Molecular Mechanisms of Heat Stress Tolerance in Plants. Int. J. Mol. Sci. 2013, 14, 9643–9684. [Google Scholar] [CrossRef]
  12. Chai, Q.; Wang, T.; Di, C. Evaluating the impacts of environmental factors on soil moisture temporal dynamics at different time scales. J. Water Clim. Chang. 2021, 12, 420–432. [Google Scholar] [CrossRef]
  13. Yang, Y.; Wang, S.; Bai, X.; Tan, Q.; Li, Q.; Wu, L.; Tian, S.; Hu, Z.; Li, C.; Deng, Y. Factors Affecting Long-Term Trends in Global NDVI. Forests 2019, 10, 372. [Google Scholar] [CrossRef] [Green Version]
  14. Dusenge, M.E.; Duarte, A.G.; Way, D.A. Plant carbon metabolism and climate change: Elevated CO2 and temperature impacts on photosynthesis, photorespiration and respiration. New Phytol. 2019, 221, 32–49. [Google Scholar] [CrossRef] [PubMed] [Green Version]
  15. Myers-Smith, I.H.; Kerby, J.T.; Phoenix, G.K.; Bjerke, J.W.; Epstein, H.E.; Assmann, J.J.; John, C.; Andreu-Hayles, L.; Angers-Blondin, S.; Beck, P.S.A.; et al. Complexity revealed in the greening of the Arctic. Nat. Clim. Chang. 2020, 10, 106–117. [Google Scholar] [CrossRef] [Green Version]
  16. Zandalinas, S.I.; Mittler, R.; Balfagón, D.; Arbona, V.; Gómez-Cadenas, A. Plant adaptations to the combination of drought and high temperatures. Physiol. Plant. 2018, 162, 2–12. [Google Scholar] [CrossRef] [Green Version]
  17. Xu, H.-J.; Wang, X.-P.; Yang, T.-B. Trend shifts in satellite-derived vegetation growth in Central Eurasia, 1982–2013. Sci. Total Environ. 2017, 579, 1658–1674. [Google Scholar] [CrossRef]
  18. Luo, N.; Mao, D.; Wen, B.; Liu, X. Climate Change Affected Vegetation Dynamics in the Northern Xinjiang of China: Evaluation by SPEI and NDVI. Land 2020, 9, 90. [Google Scholar] [CrossRef] [Green Version]
  19. Piao, S.; Nan, H.; Huntingford, C.; Ciais, P.; Friedlingstein, P.; Sitch, S.; Peng, S.; Ahlström, A.; Canadell, J.G.; Cong, N.; et al. Evidence for a weakening relationship between interannual temperature variability and northern vegetation activity. Nat. Commun. 2014, 5, 5018. [Google Scholar] [CrossRef] [Green Version]
  20. Saseendran, S.; Trout, T.; Ahuja, L.; Ma, L.; McMaster, G.; Nielsen, D.; Andales, A.; Chávez, J.; Ham, J. Quantifying crop water stress factors from soil water measurements in a limited irrigation experiment. Agric. Syst. 2015, 137, 191–205. [Google Scholar] [CrossRef]
  21. Tai, X.; Epstein, H.E.; Li, B. Elevation and Climate Effects on Vegetation Greenness in an Arid Mountain-Basin System of Central Asia. Remote Sens. 2020, 12, 1665. [Google Scholar] [CrossRef]
  22. Wang, H.; Li, Z.; Cao, L.; Feng, R.; Pan, Y. Response of NDVI of Natural Vegetation to Climate Changes and Drought in China. Land 2021, 10, 966. [Google Scholar] [CrossRef]
  23. Wang, H.; Liu, X.; Zhang, X.; Wang, P.; Lin, H.; Yu, L. Spatiotemporal crop NDVI responses to climatic factors in mainland China. Int. J. Remote Sens. 2019, 40, 89–103. [Google Scholar] [CrossRef]
  24. Bai, J.; Shi, H.; Yu, Q.; Xie, Z.; Li, L.; Luo, G.; Jin, N.; Li, J. Satellite-observed vegetation stability in response to changes in climate and total water storage in Central Asia. Sci. Total Environ. 2019, 659, 862–871. [Google Scholar] [CrossRef]
  25. De Jong, R.; De Bruin, S.; de Wit, A.; Schaepman, M.; Dent, D.L. Analysis of monotonic greening and browning trends from global NDVI time-series. Remote Sens. Environ. 2011, 115, 692–702. [Google Scholar] [CrossRef] [Green Version]
  26. Tucker, C.J.; Pinzon, J.E.; Brown, M.E.; Slayback, D.A.; Pak, E.W.; Mahoney, R.; Vermote, E.F.; El Saleous, N. An extended AVHRR 8-km NDVI dataset compatible with MODIS and SPOT vegetation NDVI data. Int. J. Remote Sens. 2005, 26, 4485–4498. [Google Scholar] [CrossRef]
  27. Zhu, Z.; Piao, S.; Myneni, R.B.; Huang, M.; Zeng, Z.; Canadell, J.G.; Ciais, P.; Sitch, S.; Friedlingstein, P.; Arneth, A.; et al. Greening of the Earth and its drivers. Nat. Clim. Chang. 2016, 6, 791–795. [Google Scholar] [CrossRef]
  28. Davi, N.; D’Arrigo, R.; Jacoby, G.; Cook, E.; Anchukaitis, K.; Nachin, B.; Rao, M.; Leland, C. A long-term context (931–2005 C.E.) for rapid warming over Central Asia. Quat. Sci. Rev. 2015, 121, 89–97. [Google Scholar] [CrossRef] [Green Version]
  29. Hu, Z.; Zhang, C.; Hu, Q.; Tian, H. Temperature Changes in Central Asia from 1979 to 2011 Based on Multiple Datasets. J. Clim. 2014, 27, 1143–1167. [Google Scholar] [CrossRef]
  30. Li, Z.; Chen, Y.; Li, W.; Deng, H.; Fang, G. Potential impacts of climate change on vegetation dynamics in Central Asia. J. Geophys. Res. Atmos. 2015, 120, 12345–12356. [Google Scholar] [CrossRef]
  31. Mannig, B.; Müller, M.; Starke, E.; Merkenschlager, C.; Mao, W.; Zhi, X.; Podzun, R.; Jacob, D.; Paeth, H. Dynamical downscaling of climate change in Central Asia. Glob. Planet. Chang. 2013, 110, 26–39. [Google Scholar] [CrossRef]
  32. Guo, H.; Bao, A.; Ndayisaba, F.; Liu, T.; Jiapaer, G.; El-Tantawi, A.M.; De Maeyer, P. Space-time characterization of drought events and their impacts on vegetation in Central Asia. J. Hydrol. 2018, 564, 1165–1178. [Google Scholar] [CrossRef]
  33. Liu, Y.; Li, L.; Chen, X.; Zhang, R.; Yang, J. Temporal-spatial variations and influencing factors of vegetation cover in Xinjiang from 1982 to 2013 based on GIMMS-NDVI3g. Glob. Planet. Chang. 2018, 169, 145–155. [Google Scholar] [CrossRef]
  34. Xu, H.-J.; Wang, X.-P.; Zhang, X.-X. Decreased vegetation growth in response to summer drought in Central Asia from 2000 to 2012. Int. J. Appl. Earth Obs. Geoinf. 2016, 52, 390–402. [Google Scholar] [CrossRef]
  35. Deng, H.; Yin, Y.; Han, X. Vulnerability of vegetation activities to drought in Central Asia. Environ. Res. Lett. 2020, 15, 084005. [Google Scholar] [CrossRef]
  36. Yin, G.; Hu, Z.; Chen, X.; Tiyip, T. Vegetation dynamics and its response to climate change in Central Asia. J. Arid Land 2016, 8, 375–388. [Google Scholar] [CrossRef] [Green Version]
  37. Jiang, L.; Guli·jiapaer, G.; Bao, A.; Guo, H.; Ndayisaba, F. Vegetation dynamics and responses to climate change and human activities in Central Asia. Sci. Total Environ. 2017, 599–600, 967–980. [Google Scholar] [CrossRef]
  38. De Beurs, K.M.; Henebry, G.M.; Owsley, B.C.; Sokolik, I. Using multiple remote sensing perspectives to identify and attribute land surface dynamics in Central Asia 2001–2013. Remote Sens. Environ. 2015, 170, 48–61. [Google Scholar] [CrossRef]
  39. Wang, W.; Alim, S.; Jilili, A. Geo-detector based spatio-temporal variation characteristics and driving factors analysis of NDVI in Central Asia. Remote Sens. Land Resour. 2019, 31, 32–40. [Google Scholar]
  40. Dong, W.; Lin, Y.; Wright, J.S.; Xie, Y.; Ming, Y.; Zhang, H.; Chen, R.; Chen, Y.; Xu, F.; Lin, N.; et al. Regional disparities in warm season rainfall changes over arid eastern–central Asia. Sci. Rep. 2018, 8, 13051. [Google Scholar] [CrossRef]
  41. Klein, I.; Gessner, U.; Kuenzer, C. Regional land cover mapping and change detection in Central Asia using MODIS time-series. Appl. Geogr. 2012, 35, 219–234. [Google Scholar] [CrossRef]
  42. Mohammat, A.; Wang, X.; Xu, X.; Peng, L.; Yang, Y.; Zhang, X.; Myneni, R.; Piao, S. Drought and spring cooling induced recent decrease in vegetation growth in Inner Asia. Agric. For. Meteorol. 2013, 178–179, 21–30. [Google Scholar] [CrossRef]
  43. Jiang, W.; Yuan, L.; Wang, W.; Cao, R.; Zhang, Y.; Shen, W. Spatio-temporal analysis of vegetation variation in the Yellow River Basin. Ecol. Indic. 2015, 51, 117–126. [Google Scholar] [CrossRef]
  44. Liu, Y.; Li, Y.; Li, S.C.; Motesharrei, S.C. Spatial and Temporal Patterns of Global NDVI Trends: Correlations with Climate and Human Factors. Remote Sens. 2015, 7, 13233–13250. [Google Scholar] [CrossRef] [Green Version]
  45. Tucker, C.J.; Townshend, J.R.; Goff, T.E. African Land-Cover Classification Using Satellite Data. Science 1985, 227, 369–375. [Google Scholar] [CrossRef] [PubMed]
  46. Chen, C.; Qian, J.; Chen, X.; Hu, Z.; Sun, J.; Wei, S.; Xu, K. Geographic Distribution of Desert Locusts in Africa, Asia and Europe Using Multiple Sources of Remote-Sensing Data. Remote Sens. 2020, 12, 3593. [Google Scholar] [CrossRef]
  47. Ashby, J.; Moreno-Madriñán, M.J.; Yiannoutsos, C.T.; Stanforth, A. Niche Modeling of Dengue Fever Using Remotely Sensed Environmental Factors and Boosted Regression Trees. Remote Sens. 2017, 9, 328. [Google Scholar] [CrossRef] [Green Version]
  48. Elith, J.; Leathwick, J.R.; Hastie, T. A working guide to boosted regression trees. J. Anim. Ecol. 2008, 77, 802–813. [Google Scholar] [CrossRef]
  49. Prasad, A.M.; Iverson, L.R.; Liaw, A. Newer Classification and Regression Tree Techniques: Bagging and Random Forests for Ecological Prediction. Ecosystems 2006, 9, 181–199. [Google Scholar] [CrossRef]
  50. De’Ath, G. Boosted trees for ecological modeling and prediction. Ecology 2007, 88, 243–251. [Google Scholar] [CrossRef]
  51. Liu, Z.; Yang, J.-G.; Ma, L.-H.; Ke, Z.-M.; Hu, Y.-M.; Yan, X.-Y. Spatial-temporal trend of grassland net primary production and their driving factors in the Loess Plateau, China. Ying Yong Sheng Tai Xue Bao = J. Appl. Ecol. 2021, 32, 113–122. [Google Scholar]
  52. Nezlin, N.; Kostianoy, A.; Li, B.-L. Inter-annual variability and interaction of remote-sensed vegetation index and atmospheric precipitation in the Aral Sea region. J. Arid Environ. 2005, 62, 677–700. [Google Scholar] [CrossRef]
  53. Propastin, P.A.; Kappas, M.; Muratova, N.R. Inter-Annual Changes in Vegetation Activities and Their Relationship to Temperature and Precipitation in Central Asia from 1982 to 2003. J. Environ. Inform. 2008, 12, 75–87. [Google Scholar] [CrossRef] [Green Version]
  54. Sun, W.; Song, X.; Mu, X.; Gao, P.; Wang, F.; Zhao, G. Spatiotemporal vegetation cover variations associated with climate change and ecological restoration in the Loess Plateau. Agric. For. Meteorol. 2015, 209–210, 87–99. [Google Scholar] [CrossRef]
  55. Chu, H.; Venevsky, S.; Wu, C.; Wang, M. NDVI-based vegetation dynamics and its response to climate changes at Amur-Heilongjiang River Basin from 1982 to 2015. Sci. Total Environ. 2019, 650, 2051–2062. [Google Scholar] [CrossRef] [PubMed]
  56. Hu, T.; Li, X.; Gong, P.; Yu, W.; Huang, X. Evaluating the effect of plain afforestation project and future spatial suitability in Beijing. Sci. China Earth Sci. 2020, 63, 1587–1598. [Google Scholar] [CrossRef]
  57. Zhou, L.M.; Tucker, C.J.; Kaufmann, R.K.; Slayback, D.; Shabanov, N.V.; Myneni, R.B. Variations in northern vegetation activity inferred from satellite data of vegetation index during 1981 to 1999. J. Geophys. Res.-Atmos. 2001, 106, 20069–20083. [Google Scholar] [CrossRef]
  58. Luo, M.; Sa, C.; Meng, F.; Duan, Y.; Liu, T.; Bao, Y. Assessing extreme climatic changes on a monthly scale and their implications for vegetation in Central Asia. J. Clean. Prod. 2020, 271, 122396. [Google Scholar] [CrossRef]
  59. Gessner, U.; Naeimi, V.; Klein, I.; Kuenzer, C.; Klein, D.; Dech, S. The relationship between precipitation anomalies and satellite-derived vegetation activity in Central Asia. Glob. Planet. Chang. 2013, 110, 74–87. [Google Scholar] [CrossRef]
  60. Dubovyk, O.; Landmann, T.; Dietz, A.; Menz, G. Quantifying the Impacts of Environmental Factors on Vegetation Dynamics over Climatic and Management Gradients of Central Asia. Remote Sens. 2016, 8, 600. [Google Scholar] [CrossRef] [Green Version]
  61. Lioubimtseva, E. A multi-scale assessment of human vulnerability to climate change in the Aral Sea basin. Environ. Earth Sci. 2015, 73, 719–729. [Google Scholar] [CrossRef]
  62. Mueller, T.; Dressler, G.; Tucker, C.J.; Pinzon, J.E.; Leimgruber, P.; Dubayah, R.O.; Hurtt, G.C.; Böhning-Gaese, K.; Fagan, W.F. Human Land-Use Practices Lead to Global Long-Term Increases in Photosynthetic Capacity. Remote Sens. 2014, 6, 5717–5731. [Google Scholar] [CrossRef] [Green Version]
Figure 1. Topographic map of Central Asia and spatial distribution of annual mean value of NDVI and climate factors 1982–2015. (National boundary data was acquired from the National Administration of Surveying, Mapping, and Geoinformation (No. GS (2016) 2948)).
Land 11 00327 g001
Figure 2. Spatial distribution of the variation tendency per year (a) and growing season (b), and for spring (c), summer (d), autumn (e), and winter (f), in the NDVI in Central Asia.
Land 11 00327 g002
Figure 3. Spatial distribution of significant correlations between the annual (a) and growing season (b) scales, and the spring (c), summer (d), autumn (e), and winter (f) NDVIs and heat conditions in Central Asia during the period 1982 to 2015.
Land 11 00327 g003
Figure 4. Spatial distribution of significant correlations between the annual (a) and growing season (b) scales, and the spring (c), summer (d), autumn (e), and winter (f) NDVIs and water conditions in Central Asia during the period 1982 to 2015.
Land 11 00327 g004
Figure 5. Spatial distributions of different function types for hydrothermal conditions affecting vegetation variations at the annual (a) and growing season (b) scales, and in spring (c), summer (d), autumn (e), and winter (f).
Land 11 00327 g005
Figure 6. The contributions of hydrothermal conditions to vegetation changes at the annual (a) and growing season (b) scales, and in spring (c), summer (d), autumn (e), and winter (f); the pie chart represents the proportion of heat conditions values and water conditions values ≥50%; the Mean value represents the average contribution of heat and water conditions in the areas with heat or water contribution value ≥50%.
Land 11 00327 g006
Figure 7. The average contribution value of heat and water conditions under different function types for the effect of hydrothermal conditions on vegetation growth. Heat_c represents the average contribution value of heat conditions under the influence of hydrothermal conditions’ tradeoffs and synergies. Water_c represents the average contribution value of heat conditions under the influence of hydrothermal conditions’ tradeoffs and synergies.
Land 11 00327 g007
Figure 8. The contributions of hydrothermal conditions to vegetation changes at the annual (a) and growing season (b) scales, and in spring (c), summer (d), autumn (e), and winter (f), and the proportions of different factors’ main areas of contribution in the total study area (pie chart), together with the average contribution value (mean value) of hydrothermal factors.
Land 11 00327 g008
Figure 9. The average contribution value of hydrothermal factors to vegetation growth under different function types.
Land 11 00327 g009
Table 1. Specific parameters of NDVI and climate elements.
DatasetSpatial ResolutionTemporal Resolution
GIMMS NDVI0.083°15 days
Precipitation0.5°month
Soil moisture0.25°month
PET0.5°month
Temperature0.5°month
Table 2. Separation of the grades of vegetation variation trends.
SNDVIZNDVItrend
>0≥1.96 or ≤−1.96Significant improvement
>0−1.96~1.96Slight improvement
0≥1.96 or ≤−1.96 or −1.96~1.96Stable or non-vegetated
<0−1.96~1.96Slight degradation
<0≥1.96 or ≤−1.96Severe degradation
Table 3. Division of the function types of hydrothermal conditions affecting vegetation dynamics.
ClassificationsConditionsContribution Direction
Thermal ConditionsWater Conditions
Hydrothermal tradeoff effect (water)(TEW)rpre > 0 or rsm > 0 and rtmp ≤ 0 or rpet ≤ 0 and ptem ≤ 0.05 and ppet ≤ 0.05 and ppre ≤ 0.05 and psm ≤ 0.05negativepositive
Hydrothermal tradeoff effect (heat)(TEH)rpre < 0 or rsm < 0 and rtmp > 0 or rpet > 0 and ptem ≤ 0.05 and ppet ≤ 0.05 and ppre ≤ 0.05 and psm ≤ 0.05positivenegative
Hydrothermal synergy effect (positive)(SEP)rpre > 0 or rsm > 0 and rtmp > 0 or rpet > 0 and ptem ≤ 0.05 and ppet ≤ 0.05 and ppre ≤ 0.05 and psm ≤ 0.05positivepositive
Hydrothermal synergy effect (negative)(SEN)rpre < 0 or rsm < 0 and rtmp < 0 or rpet < 0 and ptem ≤ 0.05 and ppet ≤ 0.05 and ppre ≤ 0.05 and psm ≤ 0.05negativenegative
Positive correlation with water(PW)rpre > 0 or rsm > 0 and ppre ≤ 0.05 or psm ≤ 0.05 and ptem > 0.05 and ppet > 0.05insignificancepositive
Negative correlation with water(NW)rpre < 0 or rsm < 0 and ppre ≤ 0.05 or psm ≤ 0.05 and ptem > 0.05 and ppet > 0.05insignificancenegative
Positive correlation with heat(PH)rtmp > 0 or rpet > 0 and ptem ≤ 0.05 or ppet ≤ 0.05 and ppre > 0.05 and psm > 0.05positiveinsignificance
Negative correlation with heat(NH)rtmp < 0 or rpet < 0 and ptem ≤ 0.05 or ppet ≤ 0.05 and ppre > 0.05 and psm > 0.05negativeinsignificance
Insignificanceptem > 0.05 and ppet > 0.05 and ppre > 0.05 and psm > 0.05insignificanceinsignificance
rtmp, rpet, rpre, and rsm represent the correlation coefficients between vegetation dynamics and precipitation, soil moisture, temperature, and potential evapotranspiration, respectively; ptem, ppet, ppre, and psm represent the significance of the correlation coefficients between vegetation dynamics and precipitation, soil moisture, temperature, and potential evapotranspiration, respectively.
Table 4. Proportion of different function types for hydrothermal conditions affecting vegetation dynamics in Central Asia. (unit: %).
Time ScalesTEWTEHSEPSENPWNWPHNHInsignificance
Annual49.060.190.080.0514.160.970.6213.6021.28
Growing season46.170.572.520.0427.630.273.644.4014.74
Spring0.275.0410.800.067.743.7232.110.4939.77
Summer52.530.320.110.0312.740.351.3015.2017.42
Autumn24.950.560.050.489.783.391.3021.5237.98
Winter4.271.190.200.1416.015.232.848.1262.00
Table 5. Vegetation trends in different function types in Central Asia (unit: 10−3).
RegionsAnnualGrowing SeasonSpringSummerAutumnWinter
NH−0.48−0.77−0.80−0.90−0.99−1.17
PH0.981.390.701.821.39−0.13
NW0.81−0.090.62−0.100.02−0.19
PW0.240.710.480.90−0.05−1.29
SEN−0.64−2.55−1.65−2.70−0.68−0.94
SEP0.0041.710.973.211.91−0.59
TEH1.290.961.101.101.010.08
TEW−0.66−0.52−0.51−0.58−0.88−1.57
Publisher’s Note: MDPI stays neutral with regard to jurisdictional claims in published maps and institutional affiliations.

