Article

Evaluating the Impact of the Influx of Syrian Refugees on Land Use/Land Cover Change in Irbid District, Northwestern Jordan

1
Department of Geography, Faculty of Social Sciences, Mutah University, AlKarak 61710, Jordan
2
Physical Geography, Institute of Geographical Sciences, Freie Universidad Berlin, Malteserstraße 74–100, 12449 Berlin, Germany
3
Department of Geography, Yarmouk University, Irbid 21163, Jordan
4
Ministry of Education, Amman 11118, Jordan
*
Author to whom correspondence should be addressed.
Land 2022, 11(3), 372; https://doi.org/10.3390/land11030372
Submission received: 6 February 2022 / Revised: 27 February 2022 / Accepted: 1 March 2022 / Published: 3 March 2022

Abstract

:
The refugee movement creates urban and environmental pressures at their destination locations. This pressure often presents in the form of Land Use/Land Cover (LULC) change. This study seeks to understand the impact of the Syrian refugees’ influence on changing the urban and agricultural land dynamics in Irbid district in northwestern Jordan from 1985 to 2021, including the period of the civil war in Syria, using Landsat Thematic Mapper (TM) images for the years 1985 and 2004, and the Landsat-8 Operational Land Imager (OLI) for the years 2013 and 2021. The Google Earth Engine (GEE) platform was used to conduct all image processing and perform calculations and classification analysis using the Random Forest (RF) approach. The study of the classified images compared LULC before and during the Syrian crisis using images from 1985, 2004, 2013, and 2021. The results show that the urban area increased. In parallel, agricultural land increased. During the Syrian refugee crisis, agriculture became a significant livelihood activity for Syrian refugees. In summary, the movement of the refugees to Irbid district caused an increased demand for land and housing, which accelerated the building and construction process.

1. Introduction

Humanitarian actors and policymakers often use remotely sensed images for managing refugees and the displaced people’s camps. However, most displaced people live in urban areas. The UNHCR estimates that approximately 60% of all refugees globally are settled in towns and cities [1]. In general, refugees leave refugee camps to find security, sustenance, economic independence, better services, living conditions, and a sense of community [2]. In addition, it is known that refugees prefer living in residential neighborhoods in cities to get better opportunities for work [3].
Jordan remains the second-largest refugee-hosting country per capita worldwide, with one refugee out of fifteen citizens. There are approximately 747,602 refugees of 57 different nationalities [4]. Successive waves of asylum to Jordan started since its independence in 1946, flowing to its lands due to the circumstances of the neighboring countries and their strategic location that forced them to do so. It started with the Palestinians who left their homeland in 1948 in the last century with about 400,000 refugees. The second wave that accompanied war in June 1967 was an estimated 350,000 displaced people. The number of refugees returning from Kuwait after the Gulf War in 1990 amounted to about 220,000, as shown by the general population and housing census results in 1994 [5].
Since the beginning of the war in Syria, Syrian refugee migrations have continued. About 700,000 people registered in 2015 with the High Commissioner for Refugees in Jordan; 89% of them reside in cities and villages, and 11% in refugee camps [6]. The official statistics indicate approximately 1.5 million Syrian refugees (registered and unregistered) in Jordan until 2020. Among them, more than 90% do not want to live permanently in the refugee camps in northern Jordan [7]. Consequently, many small and medium-sized cities in the north of Jordan experienced vast demographic shifts when refugees began to cross the borders.
The total number of Syrian refugees (registered and unregistered) in the Irbid district was estimated at around 140,000 in 2018 [8]. They have settled in the city and nearby rural areas, which led to increased pressure on public services and demand for housing [9]. The municipalities in Irbid district faced overloaded public services without any additional resources. However, there is some incentive for this situation; for example, displaced people often bring skills and experience to the local economy. In addition, displacement crises potentially attract humanitarian resources to contribute to regional development. In such cases, it is assumed that the Syrian refugee crisis has accelerated urban sprawl and the housing sector in Irbid district. In this regard, tracking Land Use and Land Cover changes (LULC) can identify the ramifications of increasing Syrian refugees and assess their effects on the urban sprawl.
LULC changes are a pervasive phenomenon; consequently, their analysis is given top priority by a wide range of scientists and practitioners worldwide. These changes could affect biological diversity, contribute to forest fragmentation, soil erosion, alter ecosystem services, disrupt socio-cultural practices, and increase natural disasters [10]. In general, the LULC changes indicate human activities and environmental systems [11]. Though it is possible to monitor LULC changes by involving traditional surveys and inventories, remote sensing is advantageous in cost and time saving at the regional scale. It provides large-scale data on LULC changes with information about their geographic distribution [12]. Furthermore, the combining of Geographic information systems (GIS) and remote sensing (RS) has provided valuable tools for assessing the spatiotemporal dynamics of LULC [13]. For example, GIS was used to build a model for Land Transformation of urban land-use change in Tabriz city [14]. Sahwan et al. successfully used GIS to study the relationship between surface soils and precipitation gradients in Irbid district based on Landsat 8 and Sentinel 2 classifications [15]. In this context, Landsat data have been recognized as one of the most critical data sources for mapping and monitoring LULC changes over time. The Landsat data provide a spatial resolution of 30m for continuity missions over 30 years [16,17].
In this regard, the Google Earth Engine (GEE) is currently the most popular platform for big data processing in Remote Sensing and GIS applications. The GEE is a free cloud-based platform for geospatial analysis with supercomputing ability for complex calculation or massive processing problems [18]. Users can analyze all available remotely sensed images using a web-based Integrated Development Environment (IDE) code editor without downloading these data to the local machine. In this way, users can easily access, select, and process large volumes of data for a large study area [18]. It also provides several packages with algorithms that simplify access to remote sensing tools for both experts and non-experts [19]. Consequently, the GEE quickly facilitated time-performing algorithms to conduct machine learning classifications like Random Forest (RF).
For Syrian refugees, multiple factors determined their choice to move to Irbid district, including their own home’s primarily geographical proximity, pre-existing familiarity with the area, family, tribal and social ties, cultural or political affinity, and prior or current employment. Consequently, Irbid district has received prominent Syrian refugees who accounted for up to 15.7% of the entire population in 2020. Data from the United Nations High Commission on Refugees (UNHCR) suggests that it transferred more than 369,000 people in 2015 to the Irbid governorate. This estimate excludes many unregistered refugees [20]. In 2015, Jordan’s Department of Statistics estimated the number of Syrian refugees living in Irbid district to be 168,000 [6].
According to the latest update in November 2021, the UNHCR has estimated the total number of Syrian refugees in Irbid district by 136,515 [21]. For Irbid district, refugees’ sudden, large-scale influence has placed tremendous strain on the institutional capacities, social relations, and existing economic, financial, and infrastructural public services by overburdening facilities [22,23]. Refugee immigration also caused a significant increase in the demand for natural resources, reflected by the extent of agricultural lands [22,24].
This observation agrees with the findings of Hagenlocher et al., who describe the interrelation between refugee immigration and the spread of settlement areas that affect the local environment [25]. In Irbid district, Syrian civil war refugees after 2011 increased the population, leading to increased environmental pressure and changing LULC. Moreover, refugees moving into Irbid district impacted housing, services, utilities, job opportunities, income, and the distribution of resources among residents. In particular, the effects of Syrian refugees were remarkable on the urban areas and agricultural lands. This study explored the impact of Syrian refugee migration on land use/land cover in Irbid district.
Finally, to include recent and current changes in the study area, this paper was designed to evaluate the changes in Land Use/Land Cover (LULC) in Irbid district using Google Earth Engine and Landsat images from 1985 to 2021. The specific objectives were (1) to quantify the rate of LULC change in the period from 1985 to 2021; (2) to identify the effects of Syrian refugees on the urban and agricultural land use in Irbid district.

2. Materials and Methods
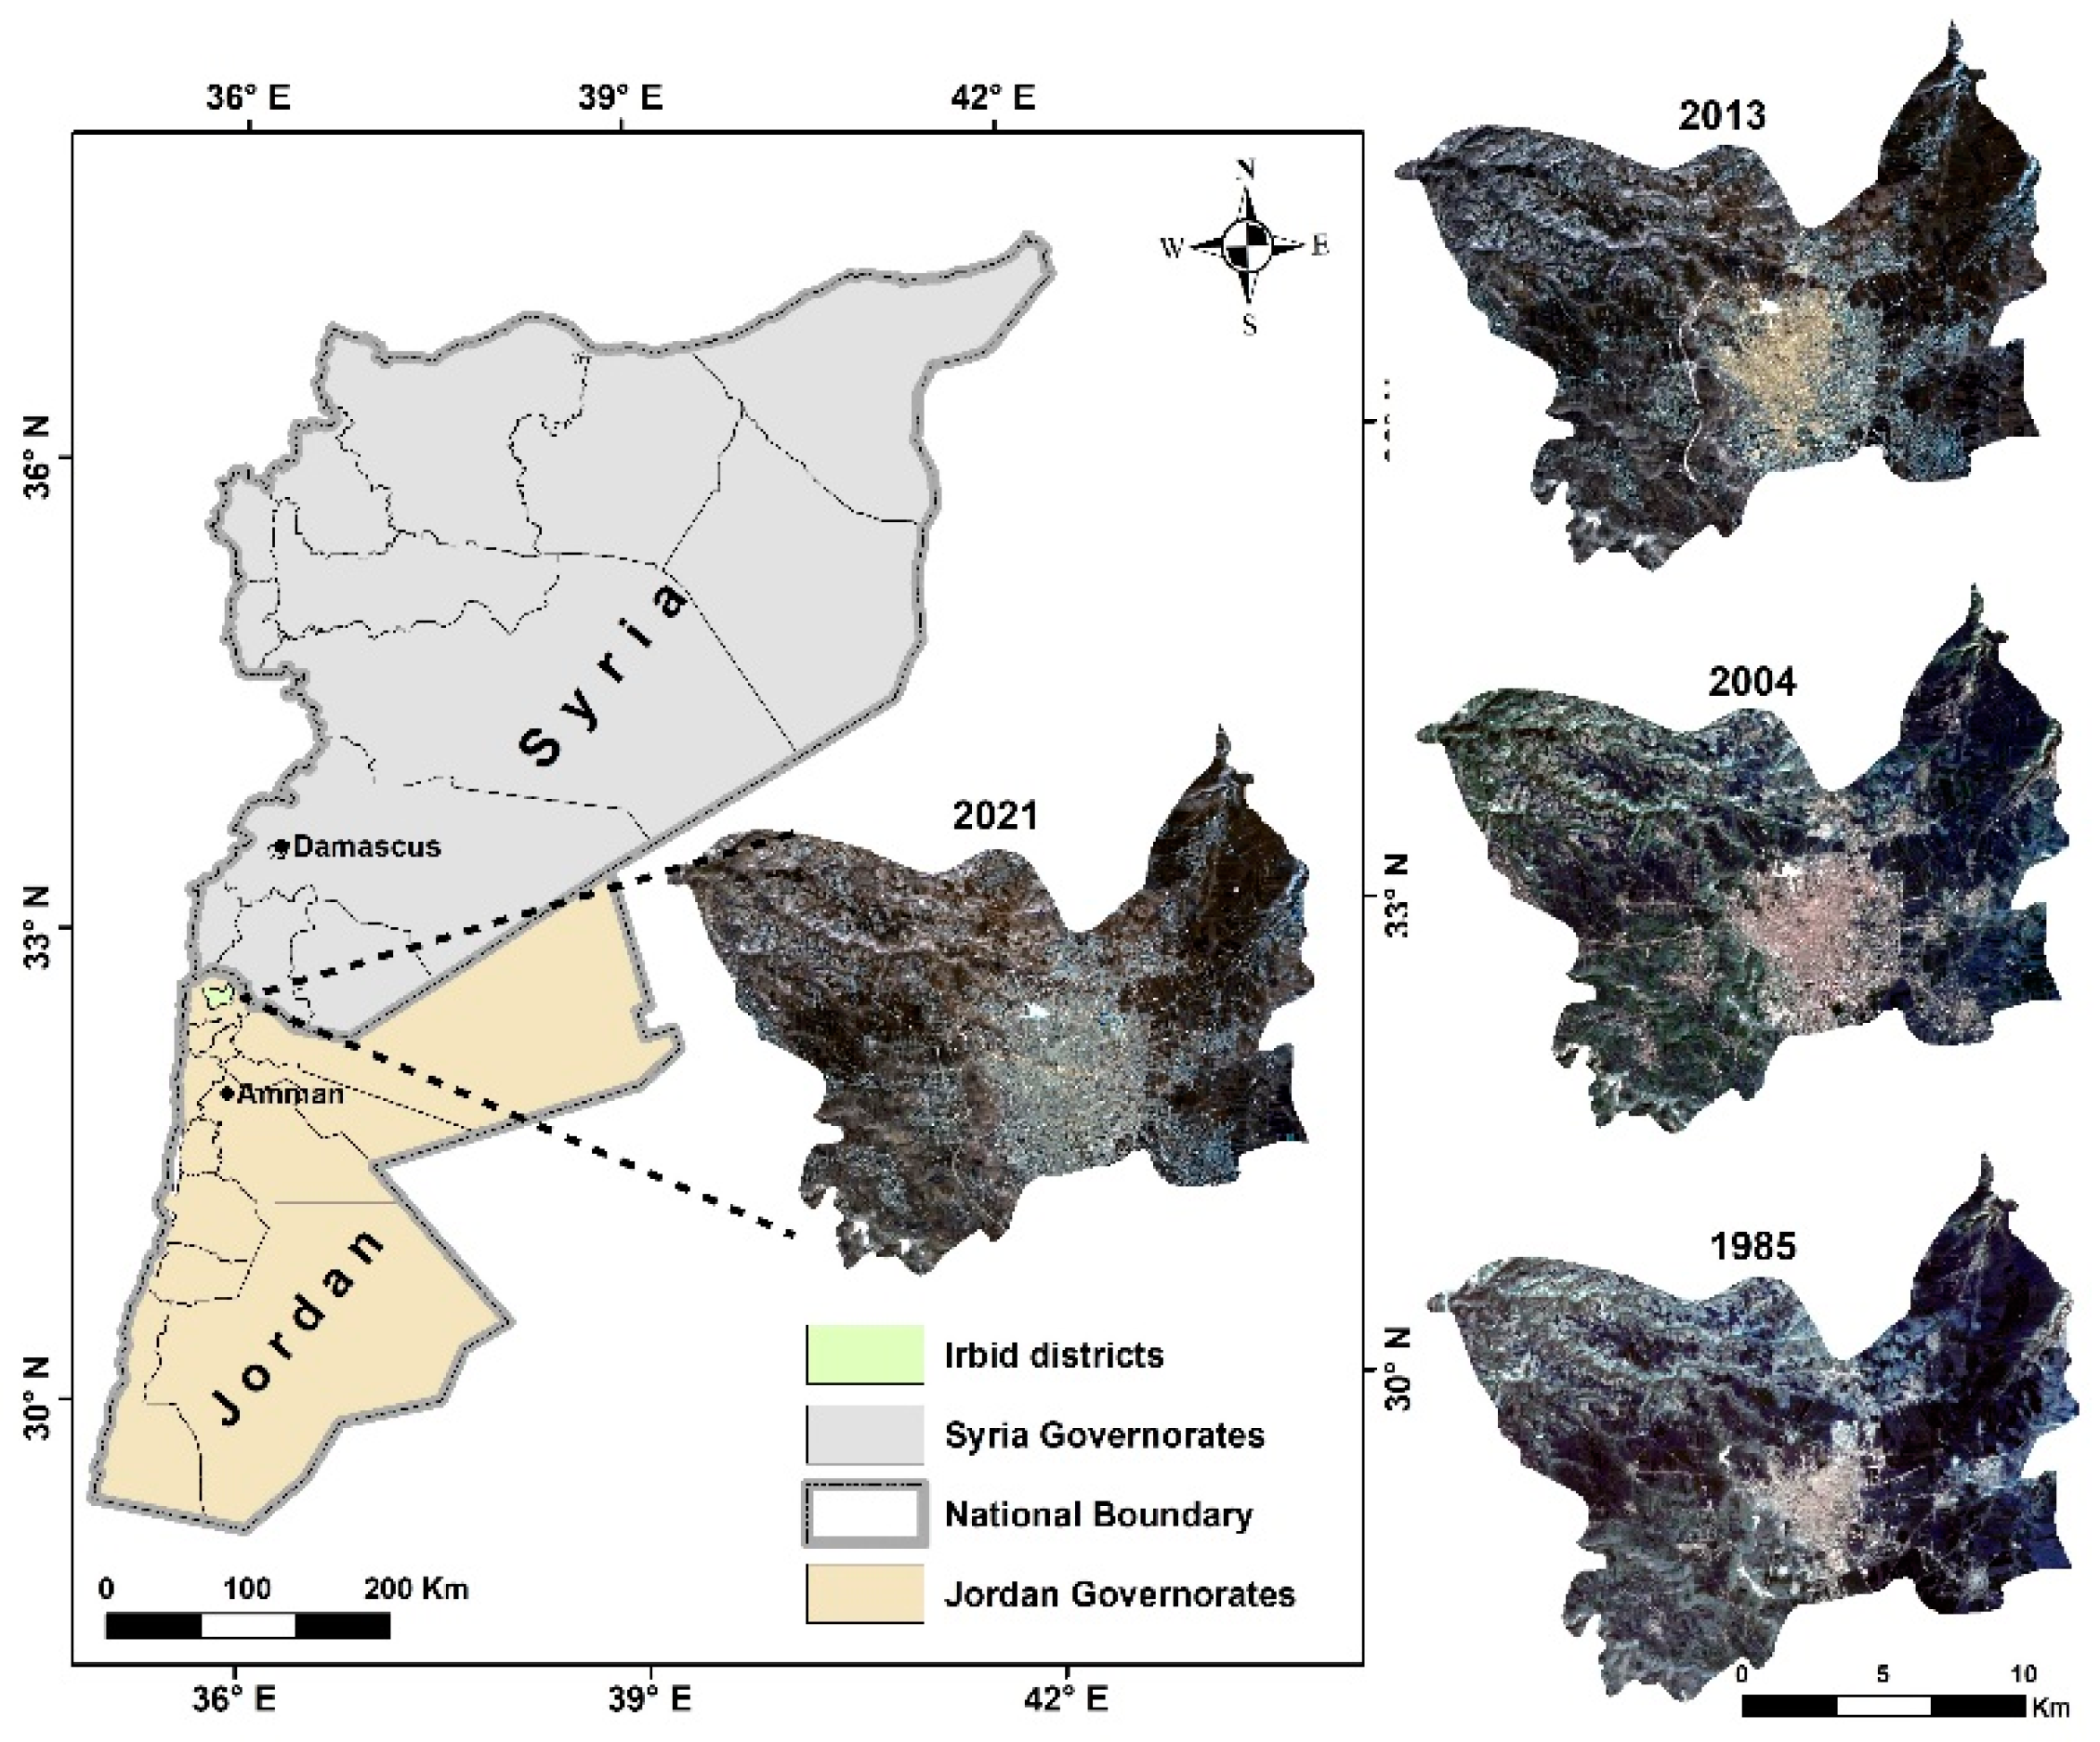
2.1. Study Area

Irbid district forms a part of the northwestern fringe of Jordan. The study area is located between 32°30′–32°39′ (N), 35°43′–35°56′ (E), covering an area of 235 km2 (Figure 1). The ground relief of the study area is altogether flat and is located on a plateau between 600–800 m.a.s.l. The climate in Irbid district is Mediterranean (Table 1), characterized by dry summers and mild, wet winters. The annual average rainfall in Irbid district amounts to 465 mm; thus, the study site belongs to one of the rainiest areas in Jordan [15,26]. Accordingly, Irbid district is suitable for rain-fed agriculture, which can be found on vast fertile plains; beyond, multiple freshwater springs make the area ideal for settlement. Next to the cultivation of grain (wheat, barley), the area is characterized by olive olericulture and fruit trees’ pomiculture [27].
Irbid district is the third-largest city in Jordan, measured by a population of about 867,800 in 2020 [7]. The population has increased from 281,178 in 2004 to 560,171 in 2010, and 867,800 inhabitants in 2020 (Figure 2), primarily due to the Syrian refugees moving into the area since 2013 and the high birthrate in the district [8]. Evaluating the impacts of conflict and migration on land use and land cover in an active war zone remains a challenge. Spatial and statistical analyses of satellite imagery for the recent Syrian refugee mass migration period provided evidence of rapid changes in land use when comparing premigration and postmigration periods [23].

2.2. Datasets

Landsat imageries were the primary data source for LULC classification. Landsat imagery data with less than 10% cloud cover were obtained from Landsat Thematic Mapper (TM) for 1985 and 2004 and from Landsat-8 Operational Land Imager (OLI) for 2013 and 2021.
Change analysis and periodically conducted LULC updates for the two time periods P1: (1985–2004) and P2: (2004–2021) provided the LULC information for the start and end year of each period and identified the changes in the areas in addition to trends for each of the LULC classes in the second period compared to the first period. Furthermore, to examine the relationship between the influence of refugees fleeing civil war in Syria and the changes in LULC in Irbid district, we divided the second period (2004–2021) into two sub-periods (i.e., 2004–2013 and 2013–2021), where the later sub-period coincided with the period where an influence of the refugees on the land use of the study area was expected.

2.3. Data Processing and Classification

The LULC change analysis depends on data acquisition, image sub-setting, data preprocessing, supervised classification, and accuracy assessment. Image preprocessing facilitates the extraction of relevant information from satellite data [28].
In this study, all pre-processing was completed using GEE [29]. The LULC classification was conducted using the Random Forest (RF) approach, which provides a classification method based on machine learning. The RF approach uses artificial intelligence to generate information and knowledge by first training the classifier in a training phase and subsequently generalizing the learned ability to either describe or predict a phenomenon of interest. For many years, the RF approach has been essential for remote sensing applications, as it enables accurate LULC classifications of different types. Applying the RF approach, the LULC classes were categorized according to Level 1 (Table 2) after the U.S. Geological Survey Land-Use/Land-Cover Classification System [30].
Classification accuracy refers to the correspondence rate between the remotely sensed data and reference information [31,32]. In this study, the classification accuracy was determined empirically using a group of randomly selected reference sample points compared against the classified images. The percentage of the correctly/erroneously labeled pixels from each class in the images was estimated. This comparison produced error matrices representing the base of the accuracy assessment process and providing detailed information of the agreement between the other ossification results a reference information [33]. Overall accuracy, producer’s accuracy, user’s accuracy, and Kappa Coefficient were calculated for each image according to the Equations (1) and (2).
o v e r a l l   a c c u r a c y = i = 1 r x i i x
where xii is the error matrix.
K = N x j ( x i +     x + j )   N 2 ( x i +     x + j )
where, k is the number of rows in the matrix; xij is the number of observations in row i and column j; xi+ and x+i are the marginal totals of row i and column i respectively; and N is the total number of observations (pixels) [31].
N = z 2 p q E 2
where, N is the sample size, p is the expected percent accuracy of the entire map, q = 100 − p, E is the allowable error, and z = 2.

3. Results

3.1. Classification Accuracy Assessment

The overall accuracies of the classifications range between 87% to 97% (Table 3). An overall accuracy greater than 85% is a satisfactory classification accuracy level of remotely sensed data for LULC using Landsat imageries [30,32]. Kappa Coefficient values amount between 0.815 to 0.96 for the classified images produced from RF classification. These values of the Kappa Coefficient are also satisfactory and fall in the range of very good to excellent agreement between images and variables measured [33].
The producer’s and user’s accuracies of RF-based classifications show high accuracy in all classes. These high accuracy values might be due to several reasons, including the spectral separability between LULC classes; thus, mixed pixels had minimal effects. However, some errors occurred in the classification results, which refers to the processes of preprocessing and calibration, as well as to the type of Landsat images used, geometric and radiometric corrections of the images, and geometric accuracy [34].

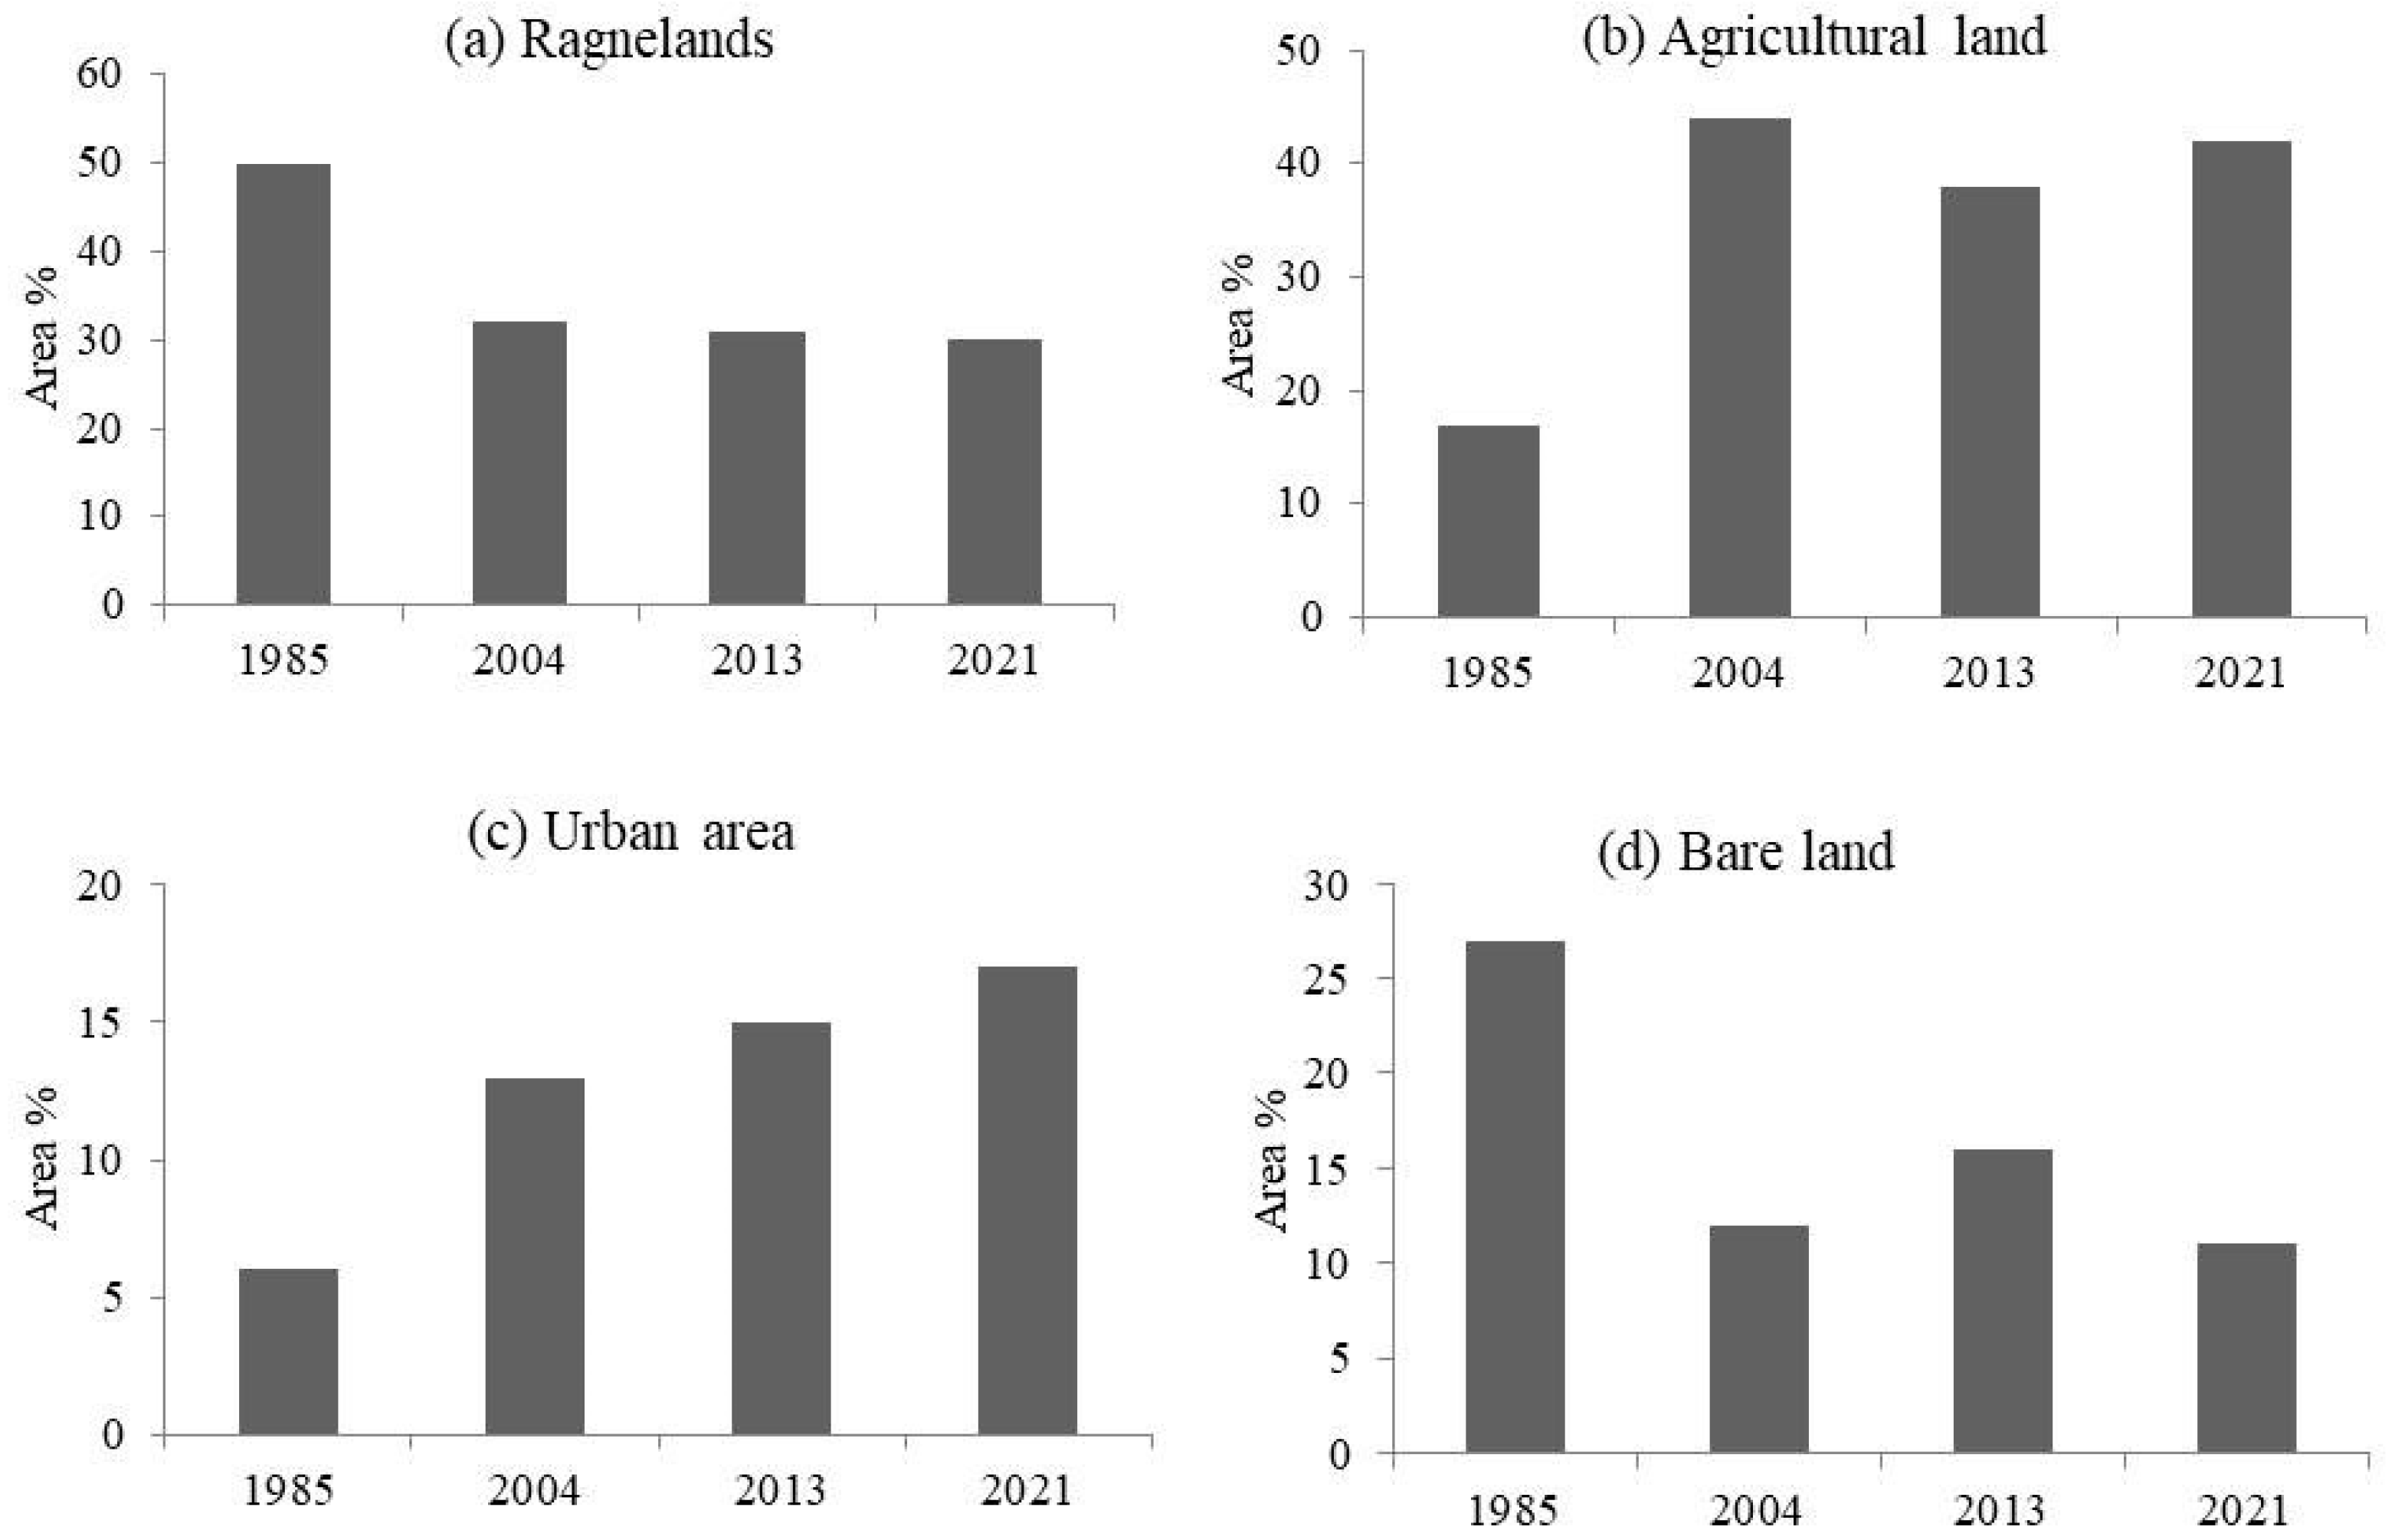
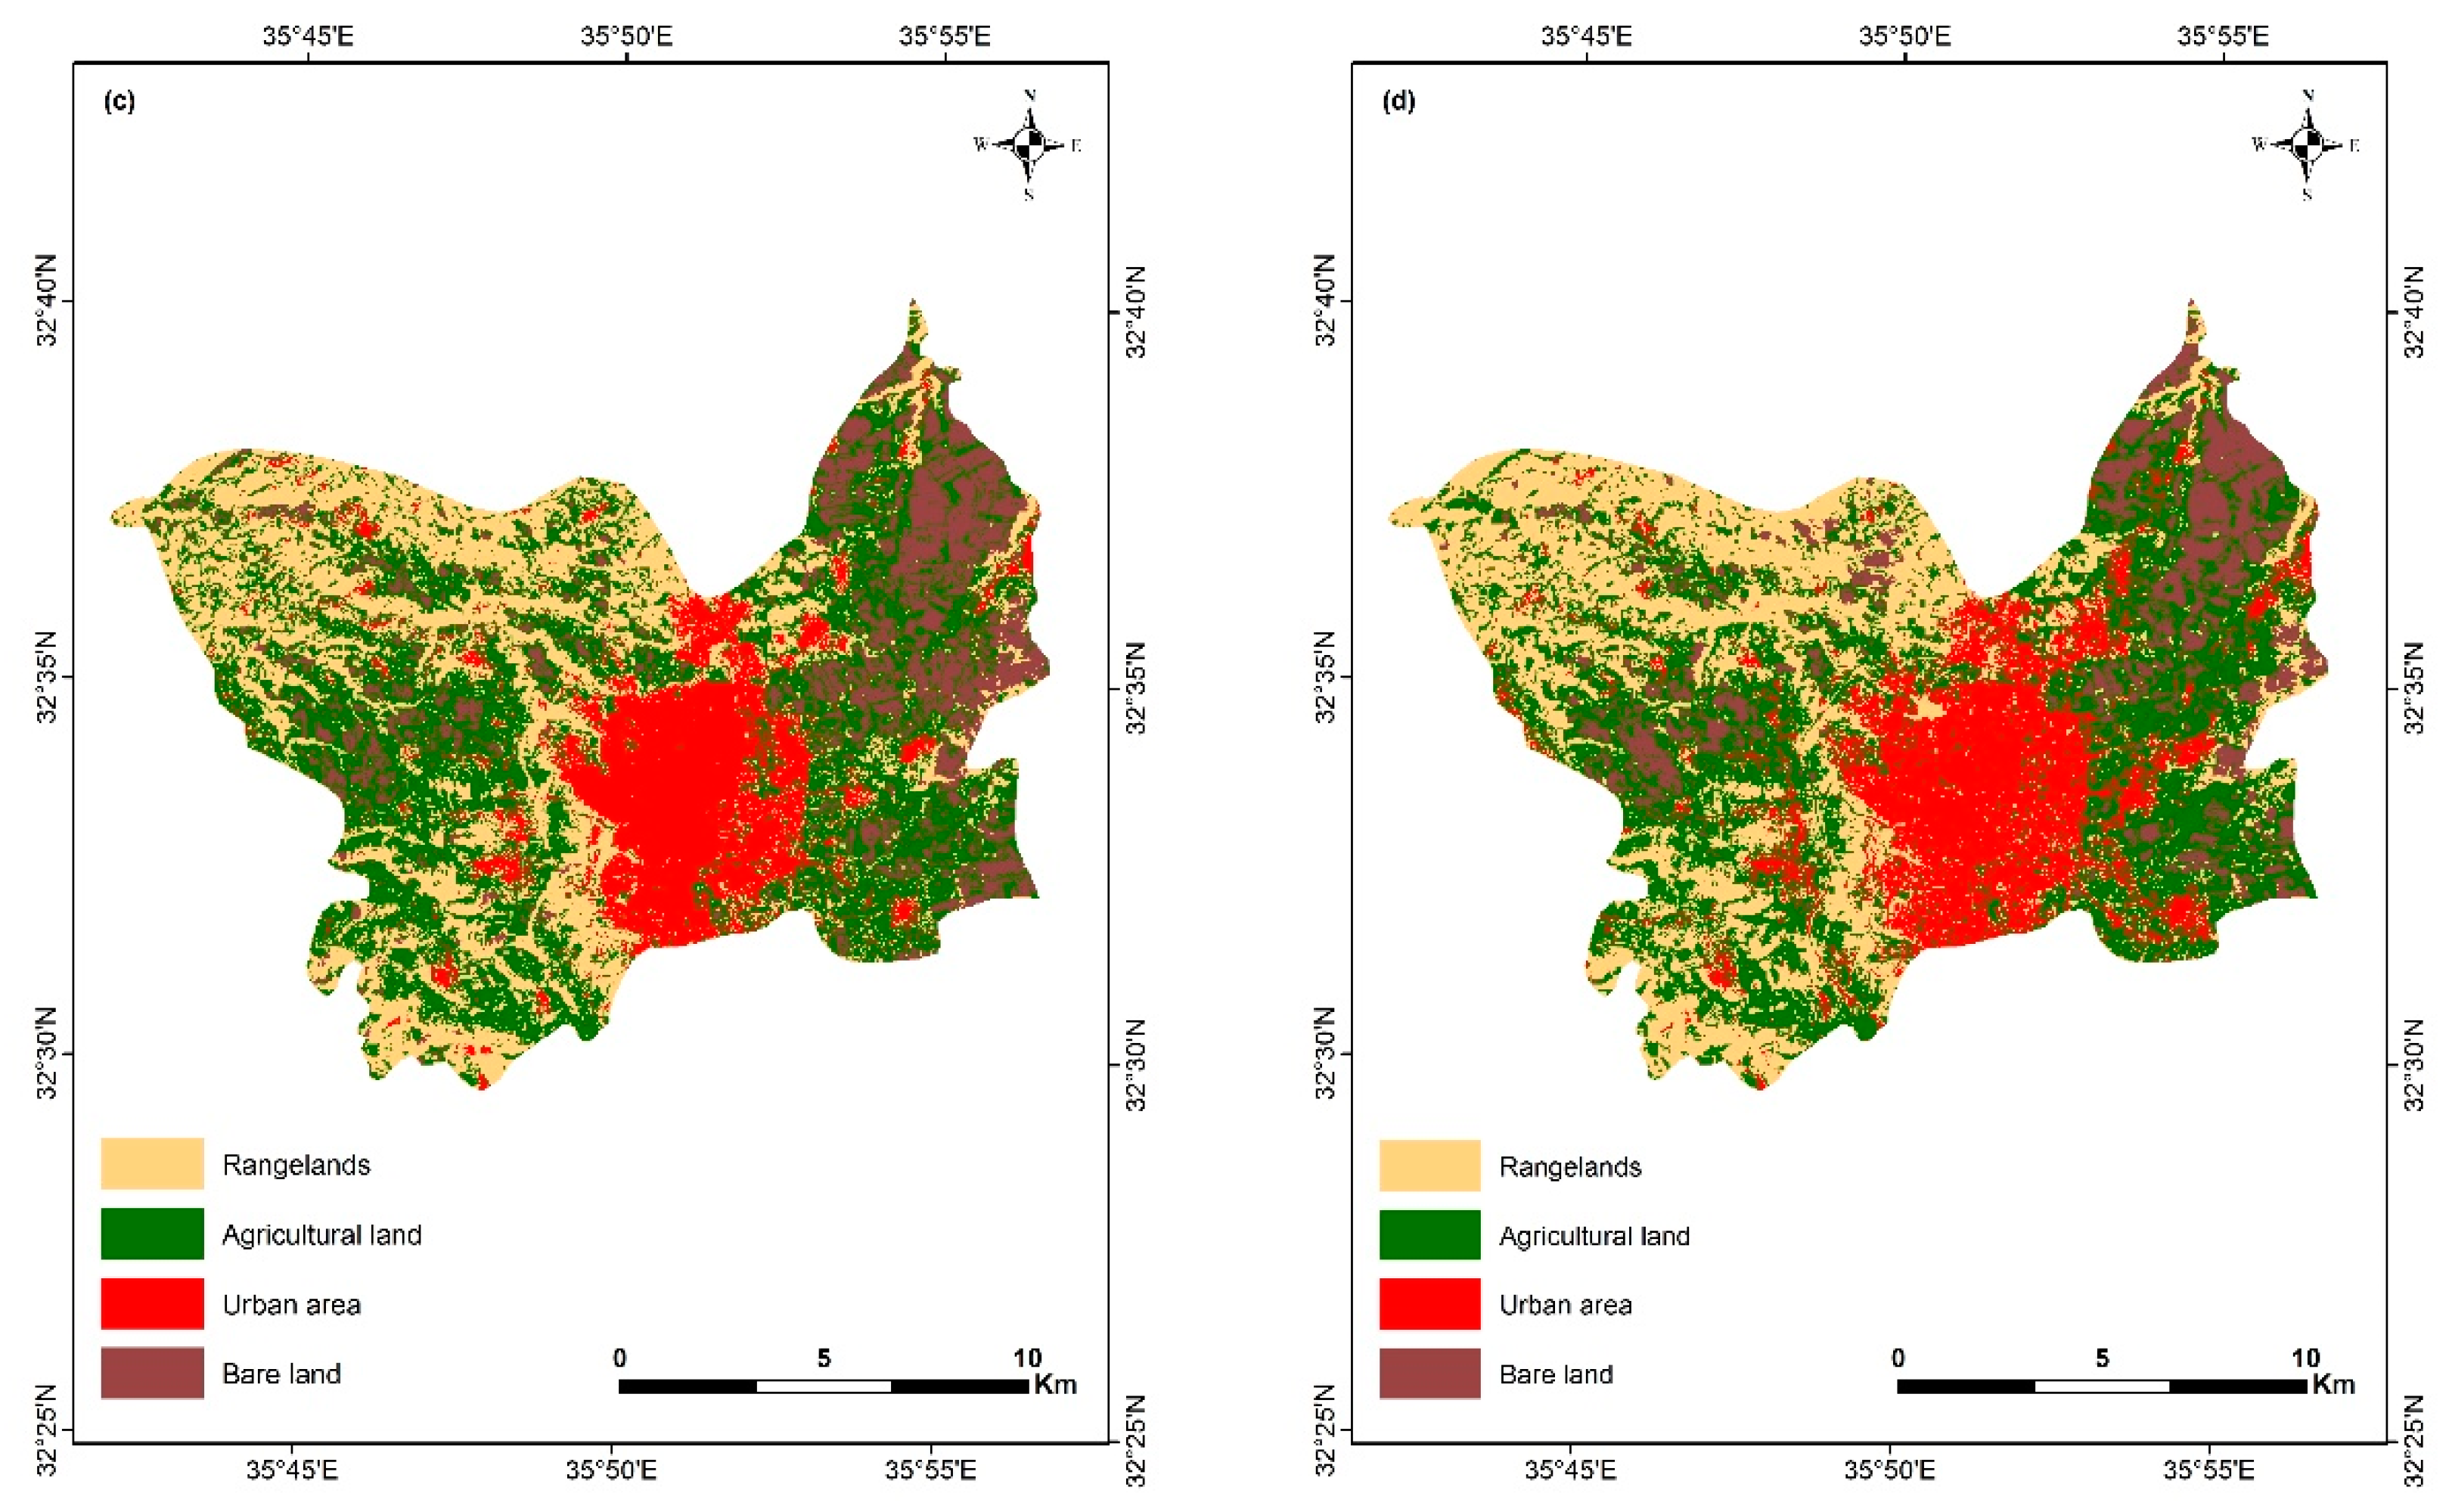
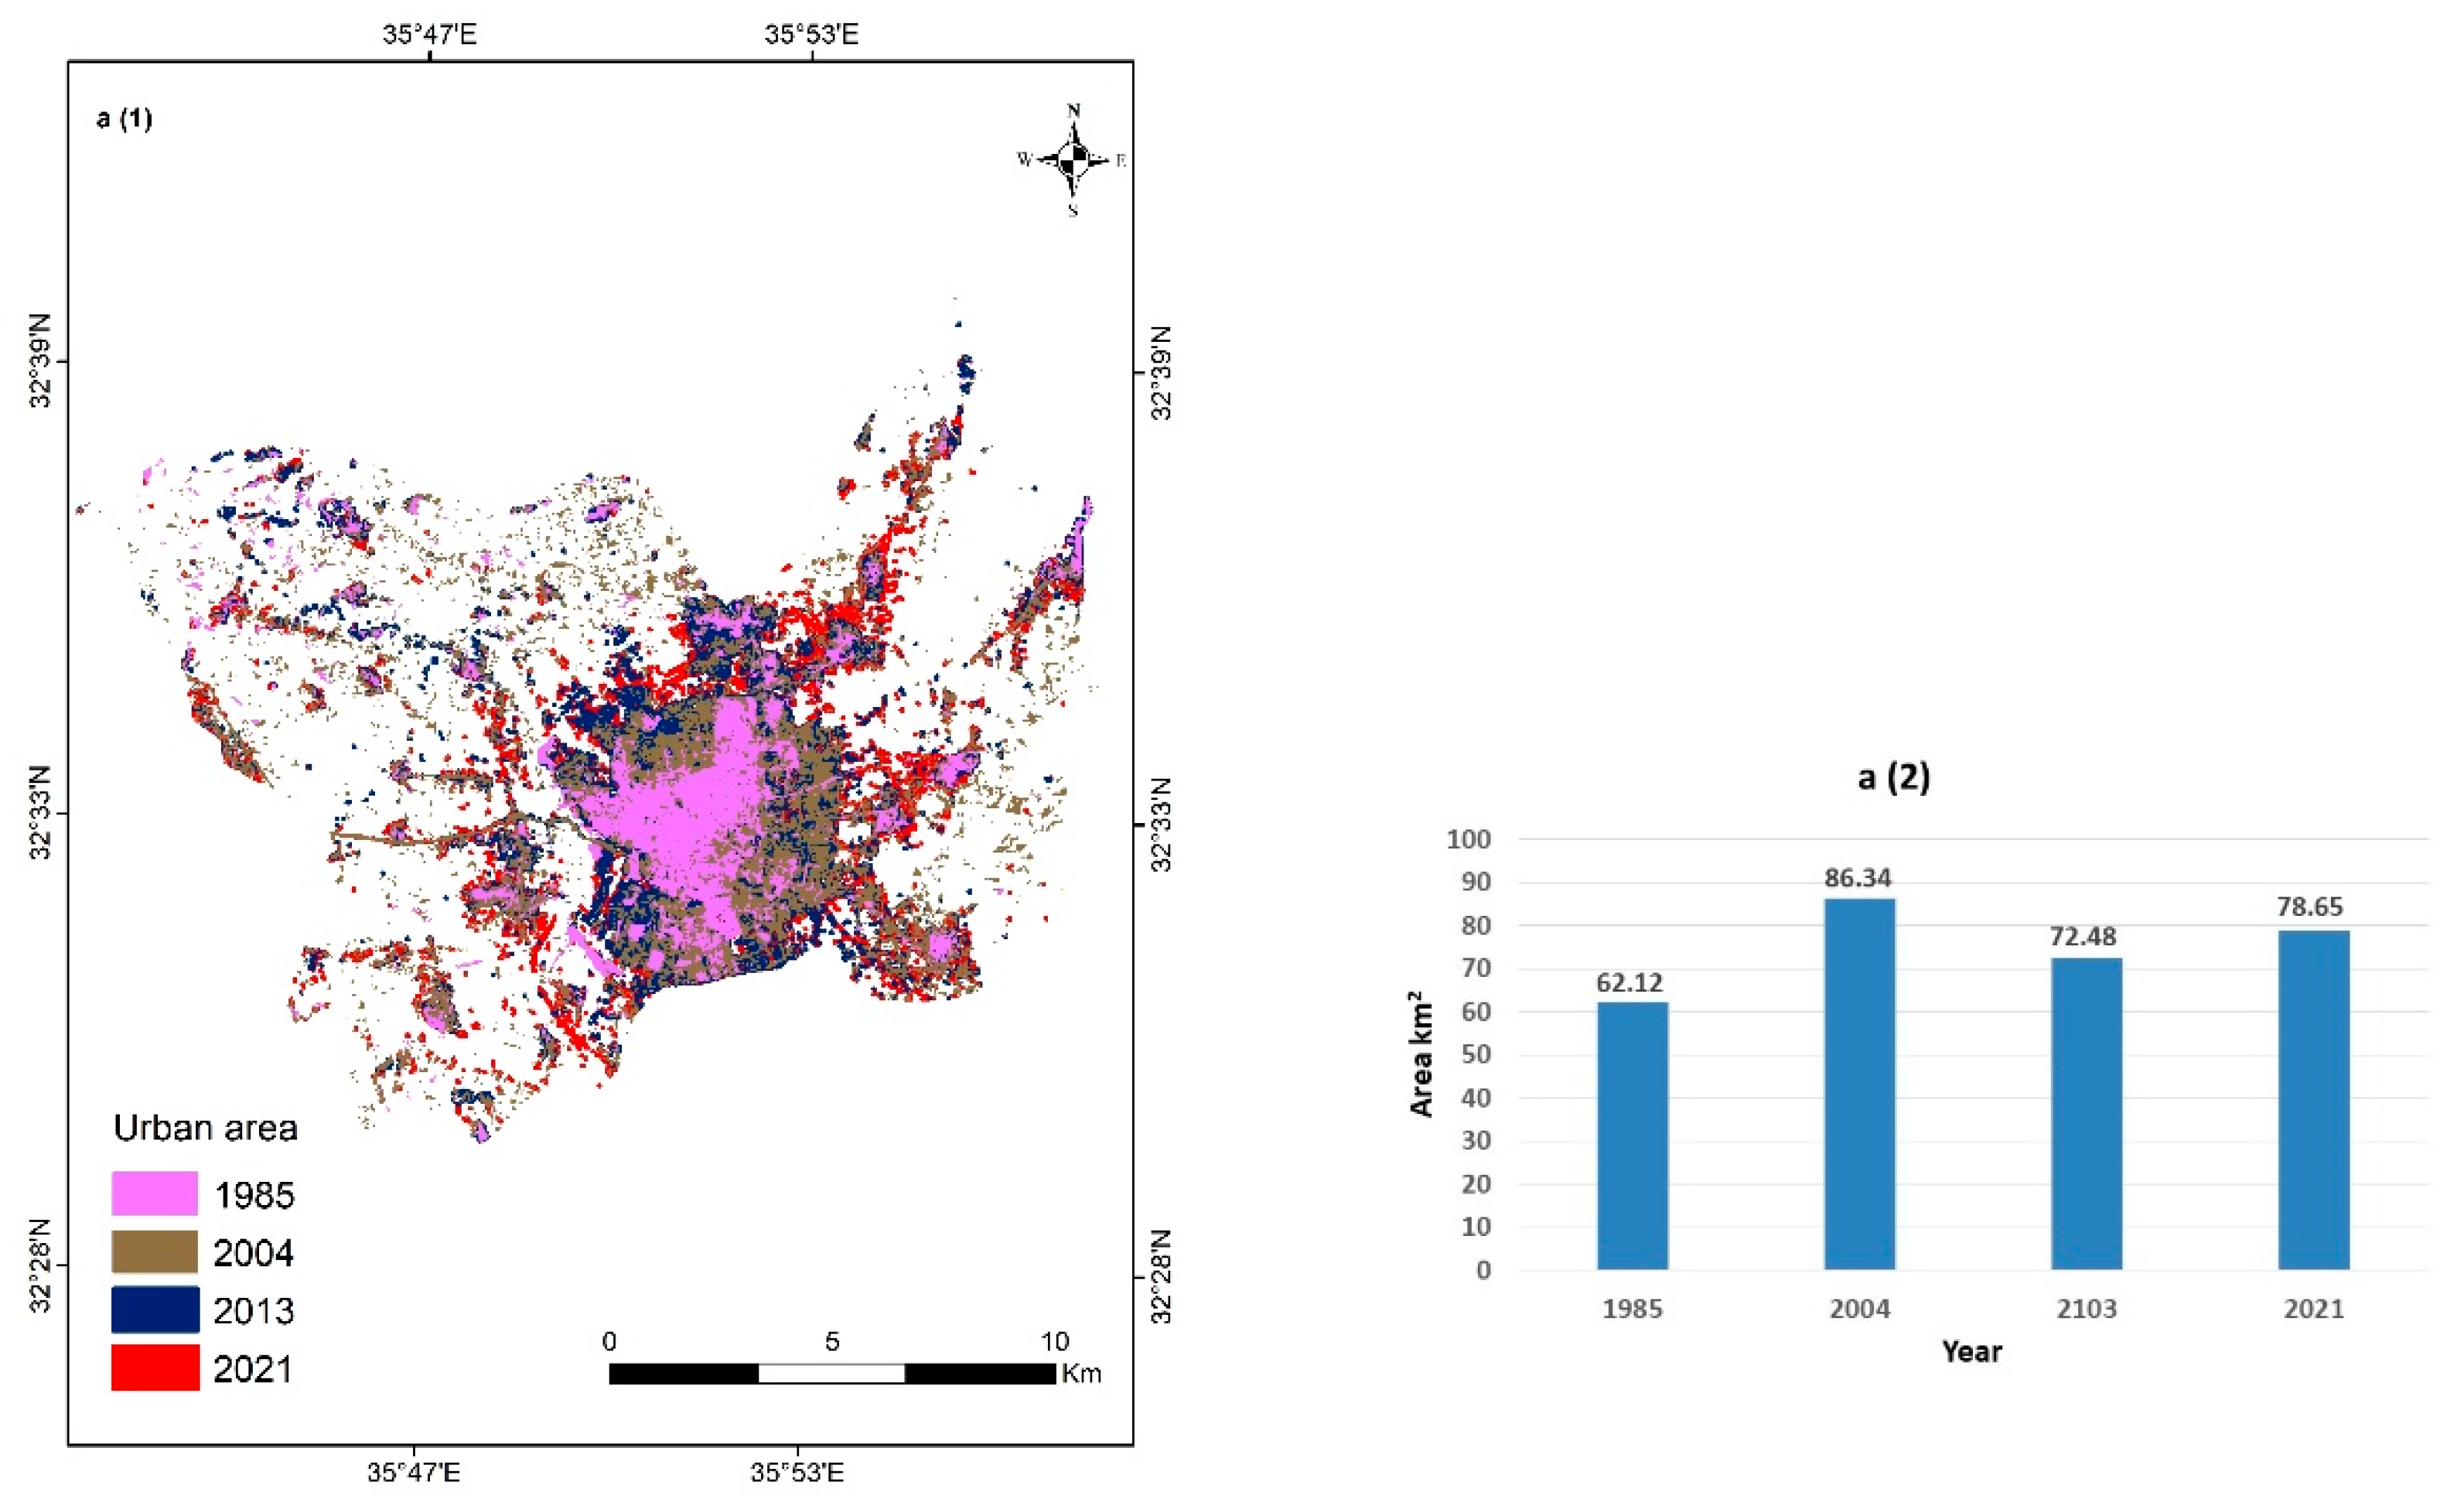
3.2. Land Use/Land Cover Change Patterns (1985–2021)

The LULC maps generated on the base of the satellite images display the four different LULC classes: rangelands, agricultural land, urban area, and bare land for 1985, 2004, 2013, and 2021 (Figure 3, Figure 4 and Figure 5). Urban areas increased remarkably, but the rangelands and bare land were decreased during the study period. There was a substantial expansion of the urban area in 2021, which persisted during the civil war in Syria after the 2011s. Meanwhile, the increase in the urban area was alongside an increase in agricultural land (Figure 3 and Figure 4). Urban areas increased by about 15.89 km2 from 1985 to 2004. The high agricultural land increases were recorded from 1985 to 2004, expanding to cover about 63.12 km2 of Irbid district. As shown in Table 4, rangelands made up 118.06 km2 of the study area in 1985; bare land made up 63.97 km2, agricultural land made up 39.75 km², and urban areas covered 14.16 km². In 2021 the agricultural land increased to 98.37 km², and urban areas increased to 40.59 km². The rangeland decreased to 70.9 km², and bare land decreased to 26.08 km² (Figure 4).
Accordingly, the spatial extent of the urban areas showed a yearly gain of approximately 5.4% and that of agricultural land showed a gain of 8% between 1985 and 2004. During the period before the crisis in Syria between 2004 and 2013, the urban areas annually increased by 1.6%, while after the Syrian crisis, between 2013 and 2020, urban growth annually averaged 2.2% (Figure 5). In contrast, bare land has distinctly declined; the highest decline rates occurred between 2013 and 2021, with an annual average decrease of bare land of 3.99%. Results indicate that the most significant changes in LULC distribution occurred in the phase 1985–2004, e.g., during this period, the spread of agricultural lands increased by 61.6%, those of rangelands by 42.27%, and that of urban areas by 15.89% (Table 5). The spread of these three classes took place at the expense of bare land, whose extent in parallel declined by 36.74%. These trends stopped with the turn of the millennium and even inverted the spread of agricultural land, which decreased by 13.86 between 2004–2013. With the onset of the Syrian crisis, agricultural lands and urban areas again distinctly increased in Irbid district (2013–2021). Over the whole study period, the urban area growth was increased by 23.6%, while that of rangelands decreased by 50.1% (Table 5).
All LULC classes experienced some degree of change in Irbid district (Table 6). Accordingly, about 58.6 km2 of rangelands and bare land areas were transformed into agricultural land, and 24.2 km2 were transformed into urban areas. In addition, about 2 km2 of areas of agricultural land were transformed into urban areas. The total development in urban areas was made by converting agricultural, bare land, and rangelands to about 26.43 km2.

4. Discussion

Globally, most refugees who have been displaced live at the fringes of urban areas in developing countries. In many cases, this results in grave consequences for the local environment, leading to further deterioration in the host communities’ socio-economic, sanitary, and political conditions [35]. This study analyzed the influence of Syrian refugees moving into Irbid district on the spread of urban areas and agricultural lands. Analysis was based on remote sensing data and supervised LULC classification applying a RF algorithm.
The trend of LULC for the period 1985 to 2021 documents that Irbid district showed highly dynamic changes of the LULC classes. In 1985–2021, the urban area increased by 25.43 km2, and the agricultural area increased by 58.62 km2 (Table 6). Simultaneously, expansion of bare land declined by 37.89 km2 and that of rangelands by 47.16 km2. This land use change characteristically occurs during population increase and an acceleration of development pressure coinciding with the need for food supplies. The effects of refugees on the environment are also described by Hugo [36]. He points out that the refugee movement reduces environmental pressure at their place of origin and increases environmental pressure at their destination. The high rate of increase in the urban area and agricultural land in Irbid district was associated with the immigration of Iraq refugees and other Arab refugees [37]. Since Iraq invaded Kuwait in 1990, hundreds of thousands of people have fled the Arab Gulf and Iraq to Jordan [37]. In mid-2004, about 45% of the total population in Jordan originated from the 1948 refugees, 1967 displaced, the 1991 returnees from Kuwait and the Arab Gulf, and around 450,000 Iraqis and 230,453 other Arabs [38]. The number of refugees hosted by the Hashemite Kingdom of Jordan remained stable at 15% refugees out of the total registered population in 2021 [39].
In Irbid district, the spread of the urban areas and infrastructure development went along with a substantial loss of rangelands and bare land (Table 6). The transition of rangelands and bare land into agricultural land was exceptionally high in 1985–2004, corresponding to the increased immigration of refugees to Jordan from Lebanon and Iraq. Due to Jordan being a destination for refugees for decades, the population multiplied by a factor of 20 since 1950 (481,000 inhabitants); at present, more than a third of Jordan’s inhabitants were born outside the country [40].
Since March 2011, Jordan has been an essential destination for Syrian refugees. This is also distinctly displayed in a striking increase in urban areas since 2013 (2013–2021). Although the net increase of urban expansion in Irbid district after the beginning of the Syrian crisis appears to be minor compared to the urbanization processes coinciding with the immigration of Iraqi refugees to the Amman capital, it should not be ignored. The size of the urban expansion between 2013 and 2021 was not compatible with the number of incoming refugees (168,000–136,000). Most of the refugees are poor and depend on the support given by international organizations [41]. Housing rental prices increased by up to six times than the average rates before the Syrian civil war crisis; due to this, Syrians were often forced to accommodate as many as 20 people in one flat, thus increasing the residential density. The increase in housing rental rates also triggered an increase in land prices [42].
The increase in agricultural land between 2013 and 2021 confirms the observations by Wilson [43] and Gbanie et al. [1]. Syrian refugees have been integrated within host communities in urban, suburban, and rural areas as they suffer increasing vulnerability and face high poverty rates [44]. This caused an expansion of agricultural land as most of the Syrian refugees who moved to Irbid district had an agricultural background, both as a livelihood, a coping mechanism, and to provide food [44].
Refugees who escaped to Irbid district during the Syrian civil war would cause increased landscape fragmentation and an increasing urban spread. Our findings also underline the results of Li et al. [45] and Reddy et al. [46], who emphasize that accelerated urbanization in developing countries expedites land cover change. In addition, our study’s findings agree with the conclusions introduced by Braimoh [47] and Griscom et al. [48], which point out that the expansion of urban areas and agricultural land are drivers of Land Use/Land Cover changes and are inextricably linked. Furthermore, our findings are consistent with the studies of Gorsevski et al. [49] and Mansaray et al. [50] that have examined the effect of civil war on land use patterns in Sudan and South Sudan.
The Syrian refugee crisis has exacerbated Jordan’s political, economic, and resource challenges. Jordan’s open border policy with Syria between 2011 and 2014 led to a significant influence of Syrian refugees on land use and water resources. The situation continued in this state until 2015 when Jordan signed the “sponsorship” system with strict application [51]. The government has taken the initiative to abolish the sponsorship system and conduct a “civilian verification” that requires Syrian refugees to re-register and apply for a new biometric service card from the Ministry of Interior [52]. This contributed to a decline in the number of refugees. More than 168,000 Syrians were registered in 2015 and 124,000 in 2020 by the United Nations Refugee Agency in Irbid district.
The findings from the LULC analysis provided some evidence to support the hypothesis that the immigration of refugees in general, and of Syrian refugees specifically, focusing on the past decade in the study area led to an expansion of the urban areas and agricultural lands. In contrast, the spread of rangelands and bare land decreased in parallel. The refugees’ immigration caused an increase in the local population, which triggered the demand for land and food.

5. Recommendation

The study provides a detailed assessment of the extent of LULC transformation. Ongoing research should emphasize the interrelationship between metrical changes of an urban area and agricultural land and socio-economic and demographic variables to further enhance our understanding of LULC change. Such studies will help to identify the role of socio-economic processes, if any, in contributing to increasing in LULC change.

Author Contributions

Conceptualization, S.A.S., W.S. and E.A.; methodology, S.A.S., W.S. and K.H.; validation, S.A.S.; formal analysis, S.A.S. and E.A.; investigation, S.A.S. and E.A.; data curation, S.A.S.; writing—original draft preparation, S.A.S.; writing—review and editing, W.S. and B.S.; and project administration, S.A.S., W.S. and B.S. All authors have read and agreed to the published version of the manuscript.

Funding

The publication of this article was funded by Freie Universität Berlin.

Institutional Review Board Statement

Not applicable.

Informed Consent Statement

Not applicable.

Data Availability Statement

The data presented in this study are available on request from the first author.

Acknowledgments

We thank the German Academic Exchange Service DAAD for funding the project GEO-IT-The Technology of Data Acquisition for Sustainable Development and Crisis Management, which enabled us to conduct the joint research. We are grateful to the anonymous reviewers for their careful reading of our manuscript and their many insightful comments and suggestions.

Conflicts of Interest

The authors declare no conflict of interest. The roles in the collection, analyses, or interpretation of data; in the writing of the manuscript, and the decision to publish the results are solely by the authors.

References

  1. Gbanie, S.P.; Griffin, A.L.; Thornton, A. Impacts on the urban environment: Land cover change trajectories and landscape fragmentation in post-war Western Area, Sierra Leone. Remote Sens. 2018, 10, 129. [Google Scholar] [CrossRef] [Green Version]
  2. Pavanello, S.; Elhawary, S.; Pantuliano, S. Hidden and Exposed: Urban Refugees in Nairobi, Kenya; Overseas Development Institute: UK, London, 2010. [Google Scholar]
  3. Walker, R.B.; Hiller, J.E. Places and health: A qualitative study to explore how older women living alone perceive the social and physical dimensions of their neighbourhoods. Soc. Sci. Med. 2007, 65, 1154–1165. [Google Scholar] [CrossRef] [PubMed]
  4. UNHCR. Syria Regional Refugee Response (Jordan); The UN Refugee Agency: Geneva, Switzerland, 2020. [Google Scholar]
  5. Department of Statistics. The Hashemite Kingdom of Jordan; Ministry of Planning: Amman, Jordan, 1994.
  6. Department of Statistics. The Hashemite Kingdom of Jordan; Ministry of Planning: Amman, Jordan, 2015.
  7. Department of Statistics. The Hashemite Kingdom of Jordan; Ministry of Planning: Amman, Jordan, 2020.
  8. UNHCR. Syrian Regional Refugee Response Jordan; The UN Refugee Agency: Geneva, Switzerland, 2018.
  9. MOPIC. Jordan Response Plan for the Syria Crisis (JPR); Ministry of Planning and International Cooperation: Amman, Jordan, 2018.
  10. Mas, J.-F.; Velázquez, A.; Díaz-Gallegos, J.R.; Mayorga-Saucedo, R.; Alcántara, C.; Bocco, G.; Castro, R.; Fernández, T.; Pérez-Vega, A. Assessing land use/cover changes: A nationwide multidate spatial database for Mexico. Int. J. Appl. Earth Obs. Geoinf. 2004, 5, 249–261. [Google Scholar] [CrossRef]
  11. Olson, J.M.; Alagarswamy, G.; Andresen, J.A.; Campbell, D.J.; Davis, A.Y.; Ge, J.; Huebner, M.; Lofgren, B.M.; Lusch, D.P.; Moore, N.J. Integrating diverse methods to understand climate–land interactions in East Africa. Geoforum 2008, 39, 898–911. [Google Scholar] [CrossRef]
  12. Yuan, F.; Sawaya, K.E.; Loeffelholz, B.C.; Bauer, M.E. Land cover classification and change analysis of the Twin Cities (Minnesota) Metropolitan Area by multitemporal Landsat remote sensing. Remote Sens. Environ. 2005, 98, 317–328. [Google Scholar] [CrossRef]
  13. Serra, P.; Pons, X.; Saurí, D. Land-cover and land-use change in a Mediterranean landscape: A spatial analysis of driving forces integrating biophysical and human factors. Appl. Geogr. 2008, 28, 189–209. [Google Scholar] [CrossRef]
  14. Rahimi, A. A methodological approach to urban land-use change modeling using infill development pattern—A case study in Tabriz, Iran. Ecol. Process. 2016, 5, 1. [Google Scholar] [CrossRef] [Green Version]
  15. Sahwan, W.; Lucke, B.; Kappas, M.; Bäumler, R. Assessing the spatial variability of soil surface colors in northern Jordan using satellite data from Landsat-8 and Sentinel-2. Eur. J. Remote Sens. 2018, 51, 850–862. [Google Scholar] [CrossRef] [Green Version]
  16. Wulder, M.A.; White, J.C.; Goward, S.N.; Masek, J.G.; Irons, J.R.; Herold, M.; Cohen, W.B.; Loveland, T.R.; Woodcock, C.E. Landsat continuity: Issues and opportunities for land cover monitoring. Remote Sens. Environ. 2008, 112, 955–969. [Google Scholar] [CrossRef]
  17. Roy, D.P.; Wulder, M.A.; Loveland, T.R.; Woodcock, C.E.; Allen, R.G.; Anderson, M.C.; Helder, D.; Irons, J.R.; Johnson, D.M.; Kennedy, R. Landsat-8: Science and product vision for terrestrial global change research. Remote Sens. Environ. 2014, 145, 154–172. [Google Scholar] [CrossRef] [Green Version]
  18. Gorelick, N.; Hancher, M.; Dixon, M.; Ilyushchenko, S.; Thau, D.; Moore, R. Google Earth Engine: Planetary-scale geospatial analysis for everyone. Remote Sens. Environ. 2017, 202, 18–27. [Google Scholar] [CrossRef]
  19. Tamiminia, H.; Salehi, B.; Mahdianpari, M.; Quackenbush, L.; Adeli, S.; Brisco, B. Google Earth Engine for geo-big data applications: A meta-analysis and systematic review. ISPRS J. Photogramm. Remote Sens. 2020, 164, 152–170. [Google Scholar] [CrossRef]
  20. UNHCR. Field Trip Reports; Hosseini, K., Ed.; The UN Refugee Agency: Geneva, Switzerland, 2015. [Google Scholar]
  21. UNHCR. Registered Persons of Concern Refugees and Asylum Seekers in Jordan; The UN Refugee Agency: Geneva, Switzerland, 2021. [Google Scholar]
  22. Carrion, D. Syrian Refugees in Jordan: Confronting Difficult Truths; Chatham House, The Royal Institute of International Affairs: London, UK, 2015. [Google Scholar]
  23. Müller, M.F.; Yoon, J.; Gorelick, S.M.; Avisse, N.; Tilmant, A. Impact of the Syrian refugee crisis on land use and transboundary freshwater resources. Proc. Natl. Acad. Sci. USA 2016, 113, 14932–14937. [Google Scholar] [CrossRef] [Green Version]
  24. Alshoubaki, W.; Harris, M. The impact of Syrian refugees on Jordan: A framework for analysis. J. Int. Stud. 2018, 11, 154–179. [Google Scholar] [CrossRef] [PubMed]
  25. Hagenlocher, M.; Lang, S.; Tiede, D. Integrated assessment of the environmental impact of an IDP camp in Sudan based on very high resolution multi-temporal satellite imagery. Remote Sens. Environ. 2012, 126, 27–38. [Google Scholar] [CrossRef]
  26. Sahwan, W.; Lucke, B.; Sprafke, T.; Vanselow, K.A.; Bäumler, R. Relationships between spectral features, iron oxides and colours of surface soils in northern Jordan. Eur. J. Soil Sci. 2020, 72, 80–97. [Google Scholar] [CrossRef]
  27. Meteorological Department. The Hashemite Kingdom of Jordan; Ministry of Transportation: Amman, Jordan, 2021.
  28. Jensen, J.R. Introductory Digital Image Processing: A Remote Sensing Perspective, 2nd ed.; Jensen, J.R., Ed.; Prentice Hall Series in Geographic Information Science; Prentice Hall: London, UK; Prentice-Hall International: Upper Saddle River, NJ, USA, 1996. [Google Scholar]
  29. Google Earth Engine. 2012. Available online: https://earthengine.google.org/#intro (accessed on 5 February 2014).
  30. Anderson, J.R.; Hardy, E.E.; Roach, J.T.; Witmer, R.E. Professional Paper; US Geological Survey: Reston, VA, USA, 1976.
  31. Jensen, J.R. Introductory Digital Image Processing. A Remote Sensing Perspective; Pearson Series in Geographic Information Science; Pearson Education Inc.: Glenview, IL, USA, 2016. [Google Scholar]
  32. Manandhar, R.; Odeh, I.O.A.; Ancev, T. Improving the accuracy of land use and land cover classification of Landsat data using post-classification enhancement. Remote Sens. 2009, 1, 330–344. [Google Scholar] [CrossRef] [Green Version]
  33. Monserud, R.A.; Leemans, R. Comparing global vegetation maps with the Kappa statistic. Ecol. Model. 1992, 62, 275–293. [Google Scholar] [CrossRef]
  34. Phiri, D.; Morgenroth, J. Developments in Landsat Land Cover Classification Methods: A Review. Remote Sens. 2017, 9, 967. [Google Scholar] [CrossRef] [Green Version]
  35. Hugo, G. Migration, Development and Environment; International Organization for Migration: Geneva, Switzerland, 2008. [Google Scholar]
  36. Hugo, G. Environmental Concerns and International Migration. Int. Migr. Rev. 1996, 30, 105–131. [Google Scholar] [CrossRef]
  37. Refugees, Displaced Persons, and Forced Migration Studies Center (RDPFMSC). Successive Waves of Asylum and Immigration to the Hashemite Kingdom of Jordan and Their Effects during 100 Years Report; Yarmouk University: Irbid, Jordan, 2021. [Google Scholar]
  38. Department of Statistics. The Hashemite Kingdom of Jordan; Ministry of Planning: Amman, Jordan, 2004.
  39. Department of Statistics. The Hashemite Kingdom of Jordan; Ministry of Planning: Amman, Jordan, 2021.
  40. United Nations. International Migration Report; United Nations: New York, NY, USA, 2017. [Google Scholar]
  41. Rosshandler, K. Syrian Refugee Return: Implications for the Jordanian Host State; WANA Institute, UK Aid; MercyCorps: Amman, Jordan, 2019; p. 23. [Google Scholar]
  42. Mercy Corps. Mapping of Host Community-Refugee Tensions in Mafraq and Ramtha, Jordan. 2013. Available online: https://data2.unhcr.org/en/documents/details/38301 (accessed on 5 February 2014).
  43. Wilson, C. Spectral analysis of civil conflict-induced forced migration on land-use/land-cover change: The case of a primate and lower-ranked cities in Sierra Leone. Int. J. Remote Sens. 2014, 35, 1094–1125. [Google Scholar] [CrossRef]
  44. UNHCR. Regional Strategic Overview 3RP, Regional Refugee & Resilience Plan 2018–2019; The UN Refugee Agency: Geneva, Switzerland, 2019. [Google Scholar]
  45. Li, M.; Mao, L.; Zhou, C.; Vogelmann, J.E.; Zhu, Z. Comparing forest fragmentation and its drivers in China and the USA with Globcover v2.2. J. Environ. Manag. 2010, 91, 2572–2580. [Google Scholar] [CrossRef] [PubMed]
  46. Reddy, C.S.; Sreelekshmi, S.; Jha, C.S.; Dadhwal, V.K. National assessment of forest fragmentation in India: Landscape indices as measures of the effects of fragmentation and forest cover change. Ecol. Eng. 2013, 60, 453–464. [Google Scholar] [CrossRef]
  47. Braimoh, A.K. Agricultural land-use change during economic reforms in Ghana. Land Use Policy 2009, 26, 763–771. [Google Scholar] [CrossRef]
  48. Griscom, H.R.; Miller, S.N.; Gyedu-Ababio, T.; Sivanpillai, R. Mapping land cover change of the Luvuvhu catchment, South Africa for environmental modelling. GeoJournal 2010, 75, 163–173. [Google Scholar] [CrossRef]
  49. Gorsevski, V.; Kasischke, E.; Dempewolf, J.; Loboda, T.; Grossmann, F. Analysis of the Impacts of armed conflict on the Eastern Afromontane forest region on the South Sudan—Uganda border using multitemporal Landsat imagery. Remote Sens. Environ. 2012, 118, 10–20. [Google Scholar] [CrossRef]
  50. Mansaray, L.R.; Huang, J.; Kamara, A.A. Mapping deforestation and urban expansion in Freetown, Sierra Leone, from pre-to post-war economic recovery. Environ. Monit. Assess. 2016, 188, 1–16. [Google Scholar] [CrossRef]
  51. Ministry of Interior. The Hashemite Kingdom of Jordan; Ministry of Interior: Amman, Jordan, 2015.
  52. Ministry of Planning and International Cooperation. Irbid Governorate Development Program 2013–2016; Ministry of Planning and International Cooperation: Amman, Jordan, 2016.
Figure 1. Location map of Irbid District and True Color Composite Images Landsat-5 (1985 and 2004) and Landsat-8 (2013 and 2021).
Land 11 00372 g001
Figure 2. Population and refugees’ dynamics in Irbid district (1994–2021).
Land 11 00372 g002
Figure 3. Graphs illustrating the proportion of each land cover class over the study period.
Land 11 00372 g003
Figure 4. LULC maps of the study area Irbid for (a) 1985; (b) 2004; (c) 2013; (d) 2021.
Land 11 00372 g004aLand 11 00372 g004b
Figure 5. (a1) urban extent; (a2) the area of the urban area over the study period from 1985–2021; (b1) agricultural land extent growth; (b2) the area of agricultural land over the study period (1985–2021).
Land 11 00372 g005aLand 11 00372 g005b
Table 1. Climate data for Irbid, Rainfall mm, temperature °C [27].
MonthJanuaryFebruaryMarchAprilMayJuneJulyAugustSeptemberOctoberNovemberDecemberYear
Avg. high13.414.317.722.827.23031.531.830.126.720.715.523.5
Daily mean9.351012.817.921.52425.826.224.621.315.611.118.3
Avg. low5.35.78.011.314.917.920.120.519.015.810.56.713.0
Avg. Rainfall10111069.6206.41.60.00.00.713.958.481.9465
Avg. Rainfall/day11.310.69.44.62.00.20.00.00.23.26.09.657.1
Table 2. Description of LULC classes that have been identified according to Anderson et al. [30].
LULC TypeGeneral Description
AgricultureCropland and pasture, orchards, groves, vineyards, nurseries, and ornamental horticulture areas, confined feeding operations, other agricultural land, and mixed forest
Urban areaResidential area, commercial and services, industrial, transportation, communications, and utilities, industrial and commercial complexes, mixed urban or built-up, and other urban or built-up land
Bare landBare exposed rock, strip mines, quarries, transitional areas, and mixed barren land
Range LandHerbaceous rangeland, shrub rangeland, and mixed rangeland
Table 3. Classification accuracy assessment results using error matrix.
Year of Classified DataType of LULCRangelandsAgricultural LandUrban AreaBare LandProducer’s AccuracyUser’s AccuracyOverall Accuracy %Kappa Value %
1985
Classified data
Rangelands2901193.5593.55
Agricultural land13400100.0097.14
Urban area1028096.5596.55
Bare land0004097.56100.00
9796
2004
Classified data
Rangelands2912085.2990.63
Agricultural land2360390.0087.80
Urban area3034094.4491.89
Bare land0304493.6293.62
9188
2013
Classified data
Rangelands23001100.0095.83
Agricultural land0500683.3389.29
Urban area04400100.0090.91
Bare land0603081.0883.33
8985.4
2021
Classified data
Rangelands26026083.8796.30
Agricultural land05005084.7590.91
Urban area2424100.0083.78
Bare land353578.5773.33
8781.5
Table 4. Irbid LULC (km2) change computed four-time periods 1985–2021.
Class2021201320041985
Rangelands70.974.1975.79118.06
Agricultural land98.3789.01102.8739.75
Urban area40.5934.4230.0514.16
Bare land26.0838.3227.2363.97
TOTAL235.94235.94235.94235.94
Table 5. Estimates of percentage change in land use in Irbid district computed over three time periods during 1985–2021.
YearRangelands %Agricultural Land %Urban Area %Bare Land %
1985–200442.2763.1215.89−36.74
2004–20132−13.864.3711.09
2013–2021−3.299.366.17−12.24
Table 6. Land use conversions in Irbid district for the three periods and during the overall study period.
Periodfrom Classto ClassThe Area Changed (km2)
1985–2004Bare landAgricultural land28.4
Urban area7.4
RangelandsAgricultural land37.8
Urban area8.5
Total81.7
2004–2013Agricultural landBare land9.1
Urban area3.9
RangelandsBare land1.1
Urban area0.5
Total14.6
2013–2021Bare landAgricultural land6.6
Urban area1.9
RangelandsAgricultural land4.8
Urban area1.4
Total14.7
Rangelands−50.1
Urban area23.6
Bare land−35.2
Publisher’s Note: MDPI stays neutral with regard to jurisdictional claims in published maps and institutional affiliations.

