Article

Quantitatively Calculating the Contribution of Vegetation Variation to Runoff in the Middle Reaches of Yellow River Using an Adjusted Budyko Formula

1
College of Resources and Environmental Sciences, Henan Agricultural University, Zhengzhou 450002, China
2
Center for Energy, Environment & Economy Research, Zhengzhou University, No. 100 Science Avenue, Gaoxin District, Zhengzhou 450001, China
3
Tourism Management School, Zhengzhou University, No. 100 Science Avenue, Gaoxin District, Zhengzhou 450001, China
*
Author to whom correspondence should be addressed.
Land 2022, 11(4), 535; https://doi.org/10.3390/land11040535
Submission received: 13 March 2022 / Revised: 1 April 2022 / Accepted: 5 April 2022 / Published: 7 April 2022

Abstract

:
The middle reaches of the Yellow River (MRYR) are a key area for carrying out China’s vegetation restoration project. However, the impact of vegetation variation on runoff in the MRYR is still unclear. For quantitatively evaluating the contribution rate of vegetation variation to runoff in the MRYR, this paper quantified the relationship between Normalized Difference Vegetation Index (NDVI) and Budyko parameters (w). Then, we used multiple linear regression to quantitatively calculate the contribution rate of different factors on vegetation variation. Finally, an adjusted Budyko formula was constructed to quantitatively calculate the influence of vegetation variation on runoff. The results showed that there is a linear relationship between NDVI and Budyko parameters (w) (p < 0.05); the fitting parameter and constant term were 12.327 and −0.992, respectively. Vegetation change accounted for 33.37% in the MRYR. The contribution of climatic and non-climatic factors on vegetation change is about 1:99. The contribution of precipitation, potential evaporation, anthropogenic activities on the runoff variation in the MRYR are 23.07%, 13.85% and 29.71%, respectively.

1. Introduction

In the past few decades, many ecological protection projects carried out in China have led to a significant increase in vegetation [1,2]. The middle reaches of the Yellow River (MRYR) are the key area for the implementation of the vegetation restoration project in China [3,4]. Vegetation index is a simple, effective and empirical measure of surface vegetation, so the Normalized Difference Vegetation Index (NDVI) was used to characterize the vegetation change in the MRYR. Some studies show that NDVI in the MRYR has increased significantly, and its vegetation coverage has been restored [5,6,7].
Vegetation change can significantly change runoff by changing hydrological processes, such as vegetation transpiration and interception evaporation, and then affect the available amount of watershed runoff [8,9,10]. The debate on the relationship between “vegetation and water” dates back to at least the mid-19th century [11]. Although most studies show that the increase in vegetation will lead to a decrease in water yield (called negative impact here), only a few studies show that the increase in vegetation has little impact on water yield [12,13] (called no impact here) and even leads to an increase in water yield [14,15] (called positive impact here). Interestingly, the areas with positive and no impact are mostly in humid areas and large watersheds with complex terrain. In the past few decades, the spatial variability and periodicity of precipitation and runoff in the MRYR have changed [16,17,18,19]. Therefore, quantitatively calculating the influence of vegetation variation on runoff variation is helpful to deeply understand the response mechanism of the water cycle process to the underlying surface condition changes, and has theoretical and practical significance for improving watershed water resources management measures. It is useful for the utilization and development of water resources in the Yellow River, the protection of the human living environment and the sustainable development of the economy.
Many scholars have carried out studies for quantitatively calculating the influence of vegetation variation on runoff variation in the MRYR [20,21,22]. The runoff decreased with the improvement of vegetation coverage, seen by analyzing the statistical relationship between vegetation coverage and runoff in most basins in the MRYR [23]. Liang et al. [24] quantitatively analyzed the influence of ecological restoration measures for the streamflow variation of most watersheds on the Loess Plateau from 1961 to 2009, based on Budyko theory, and found that ecological restoration measures are the leading factor for the decline in runoff in most watersheds. Li et al. [25] found that the Normalized Difference Vegetation Index (NDVI) in most basins in the Loess Plateau increased significantly after 2000, while the runoff decreased significantly. A higher evapotranspiration rate from restored vegetation is the primary reason for the reduced runoff coefficient. Zhang et al. [26] quantitatively evaluated the influence of vegetation cover variation on streamflow variation in the MRYR over the past 37 years. It was shown that vegetation variation is the leading driving force of streamflow decline from 2000 to 2010. Wang et al. [27] discovered that the vegetation coverage in the MRYR increased by 29.72% from 1982 to 2018. The average runoff at each station showed a downward trend from 1961 to 2018, and ecological restoration played an important role in the decline in runoff in the MRYR. However, the contribution of vegetation variation on streamflow variation in the MRYR has not been calculated quantitatively.
Therefore, in order to quantitatively evaluate the contribution rate of vegetation variation on streamflow variation in the middle reaches of the Yellow River (MRYR), this paper analyzes its hydro-meteorological characteristics from 1982 to 2015, identifies the mutation year of streamflow, and quantifies the relationship between the NDVI and a Budyko parameter (w). Then, multiple linear regression is adopted to distinguish the contribution rate of different factors on vegetation variation. Finally, an adjusted Budyko formula is constructed to quantitatively calculate the influence of vegetation variation on runoff in the MRYR. This work is useful to understand the influence of vegetation variation on the evolution of water resources in the MRYR, and also supply important insights for water resources management.

2. Research Region and Data

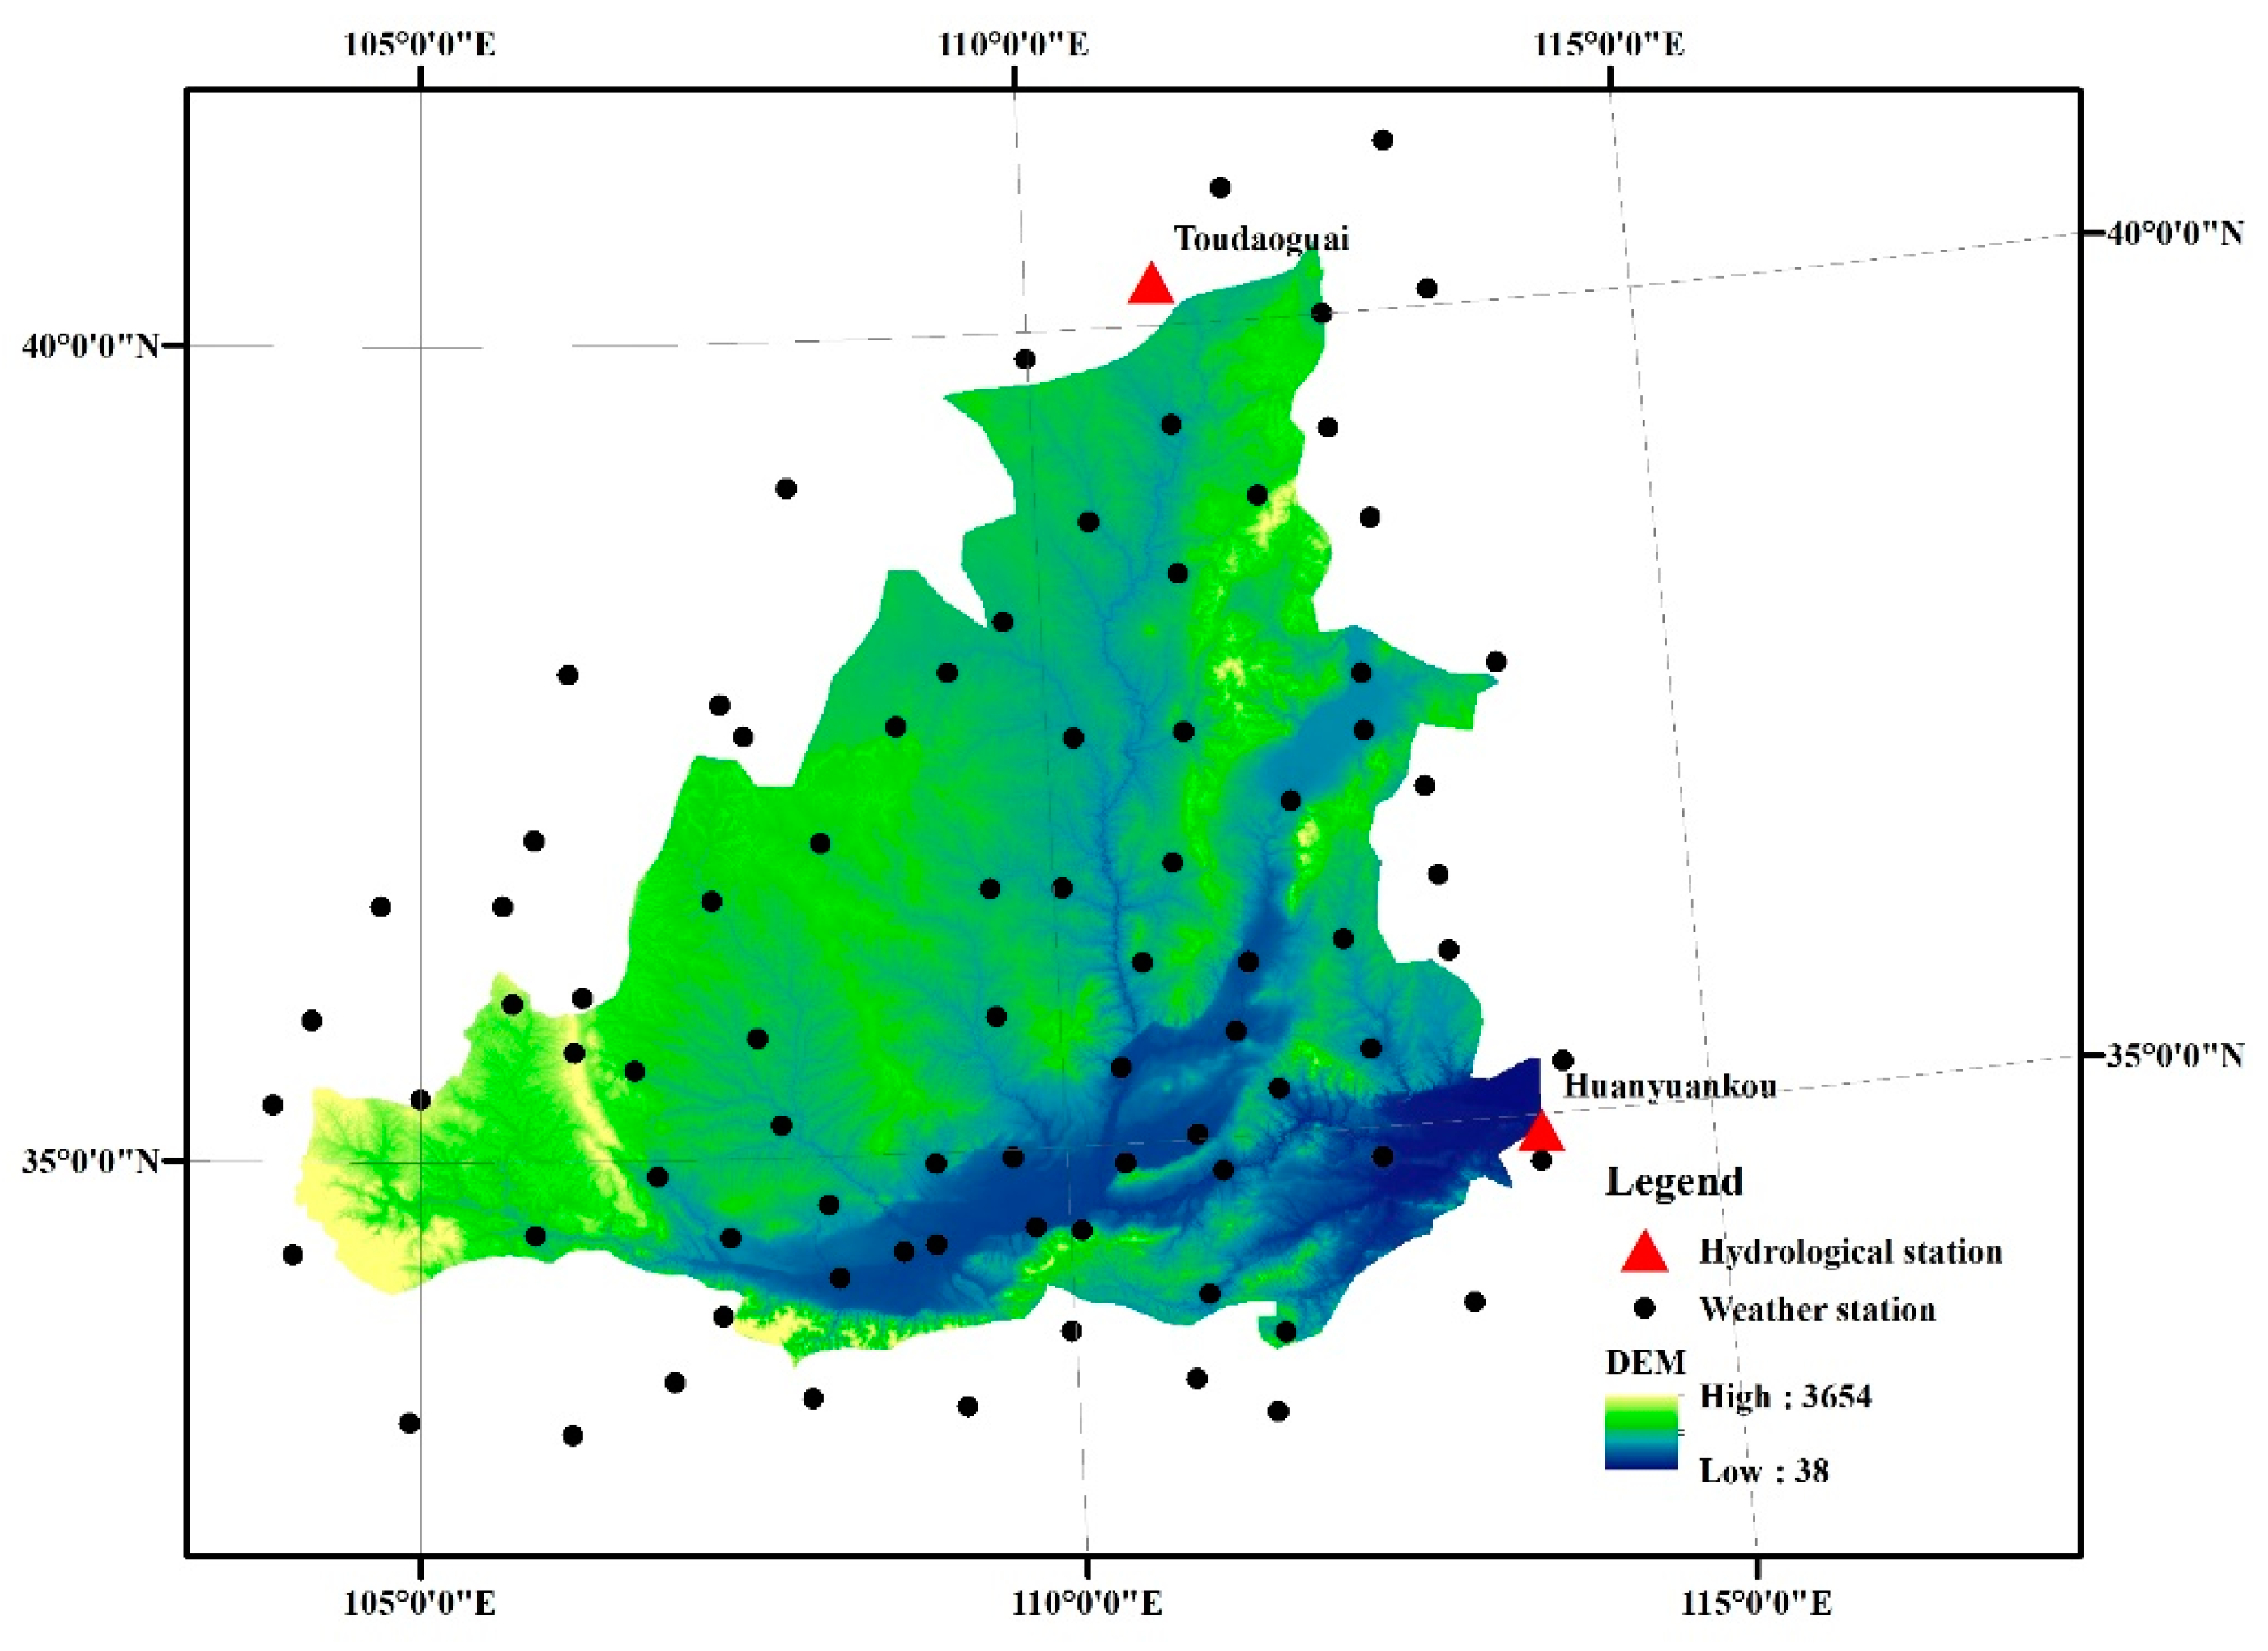
2.1. Research Region

The middle reaches of the Yellow River (MRYR) are in the area of the Toudaoguai-Huayuankou hydrological station (Figure 1). The length of this reach is about 1234.6 km, its area accounts for about 45.7% and its runoff accounts for about 44.3% of the Basin. Guanzhong Plain and Hetao Plain are in the MRYR, which produce a large number of agricultural products every year. The wheat output ranks first, soybean output ranks second, and cotton output ranks fourth in China. The decreasing runoff in the MRYR has brought great harm to agricultural production and food security.

2.2. Data

(1) The annual runoff observation data of Toudaoguai and Huayuankou hydrometric stations from 1982 to 2015 were obtained from the hydrological statistical yearbook of China. In this study, the annual runoff data in the MRYR was equal to a value, which was the annual measured runoff of Huayuankou hydrometric station minus the annual measured runoff data of Toudaoguai hydrological station.
(2) 82 meteorological stations data (1982–2015) were downloaded from China Meteorological Administration. We adopted the Penman–Monteith formula for calculating the potential evaporation of 82 meteorological stations, and then the annual precipitation and potential evaporation were interpolated by Kriging. Finally, the average annual precipitation and potential evaporation in the MRYR can be obtained.
E T 0 = 0.408 Δ ( R n G ) + γ 900 T + 273 U 2 ( e a e d ) Δ + γ ( 1 + 0.34 U 2 )
(3) The NDVI dataset (8 × 8 km2) was sourced from the National Aeronautics and Space Administration. The time span of the dataset is from July 1981 to December 2015, its time resolution is 15 d, and its downloaded files are in NC4 format. The annual NDVI are calculated by the average value composites method, and is equal to the arithmetic mean of all grids in the study area. This method further eliminates some interference of cloud, atmosphere, solar altitude, and sensor sensitivity. Finally, the annual NDVI from 1982 to 2015 can be obtained.

3. Methods

3.1. Trend Analysis Method (Slope)

The formula of Slope method is as follows [28,29]:
S l o p e = n i = 1 n i X i i = 1 n i i = 1 n X i n i = 1 n i 2 ( i = 1 n i ) 2
If Slope is greater than 0, the variable shows ever-growing properties. If Slope < 0, it implies that the variable gets less with the day; n means the number of years; X indicates the annual precipitation, and potential evaporation runoff.

3.2. Mann-Kendall (MK) Mutation Detection Algorithm

For X containing n data, we first construct a rank sequence. Then, we calculated Sk.
S k = i = 1 k r i ( k = 2 , 3 ,   , i )
r i = { + 1 x i > x j 0 x i x j ( j = 2 , 3 ,   , i )
E(Sk) represents the average value of Sk, Var(Sk) represents the variance of Sk. Finally, UF1 = 0, the Ufk statistics can be calculated.
E ( S k ) = n ( n + 1 ) 4 ( 2 k n )
V a r ( S k ) = n ( n 1 ) ( 2 n + 5 ) 72 ( 2 k n )
U F k = [ S k E ( S k ) ] V a r ( S k ) ( k = 1 , 2 ,   , i )
Constructing the reverse order of X, and making UBk = UFk (k = n, n − 1, , 1), UB1 = 0, we calculated the UBk statistics in this way.

3.3. Budyko Hypothesis

There are two hypotheses in the attribution analysis of runoff change using Budyko hypothesis: (1) assuming that human activities, climate factors and vegetation do not affect each other, and are independent factors; (2) assuming that the base period is only affected by climate factors.
The multi-year scale water balance leads to Formula (8).
Q = P E
where, Q represents runoff depth; P represents precipitation; E represents actual evaporation.
According to the Buduko hypothesis, there is a nonlinear function relation between E/P and dryness ratio (phi = E0/P) of a specific watershed.
E P = F ( E 0 P ) = F ( φ )
E0 is the potential evaporation (mm). The Fu-type Budyko equation is [30]:
F ( φ ) = 1 + φ + ( 1 + φ w ) 1 / w
w represents the variable representing the underlying surface information of the basin, and is used to characterize human activities. Human activities can affect the runoff change of the Yellow River Basin through many aspects, including vegetation change, water conservancy project construction, domestic water for urban residents and agricultural irrigation water, etc. The larger the value of w, the less precipitation is transformed into runoff.
Q = P ( ( 1 + φ w ) 1 / w φ )
Li et al. [31] found that there is a good linear relationship between NDVI and Budyko parameter (w) in the 26 major global river basins, which makes it possible to quantitatively evaluate the contribution rate of vegetation variation on runoff change.
w = a × N D V I + b
a and b are constants for a specific watershed and can be calculated by the least squares method.
Q = P ( ( 1 + φ a × N D V I + b ) 1 / ( a × N D V I + b ) φ )
The elasticity coefficient is used to measure the relative change of another variable caused by the change of one variable. ε P , ε E 0 , ε w and ε N D V I represent the elastic coefficient of P, E0, w and NDVI on runoff, respectively.
ε P = 1 + φ F ( φ ) 1 F ( φ )
ε E o = φ F ( φ ) 1 F ( φ )
ε w = w F ( w ) 1 F ( φ )
ε N D V I = ε w a × N D V I a × N D V I + b
F ( φ ) = 1 φ w 1 ( 1 + φ w ) 1 / w 1
F ( w ) = ( 1 + φ w ) 1 / w ln ( 1 + φ w ) w 2 φ w ( 1 + φ w ) 1 / w 1 ln φ w
Δ R P , Δ R E 0 , Δ R w , Δ R N D V I and Δ R H represent the value of runoff change caused by precipitation, potential evapotranspiration, underlying surface change, vegetation change and human activities.
Δ R P = ε P R P × Δ P  
Δ R E 0 = ε E 0 R E 0 × Δ E 0
Δ R w = ε w R w × Δ w
Δ R N D V I = ε N D V I R N D V I × Δ N D V I
Δ R H = Δ R w Δ R N D V I
Δ P , Δ E 0 , Δ w and Δ N D V I represent the changes of multi-year average P, E0, w and NDVI from T1 to T2 period.
Δ N D V I is attributed to NDVI change value caused by climate factors ( Δ N D V I c ) and human activities ( Δ N D V I H ):
Δ N D V I = N D V I T 2 N D V I T 1 = Δ N D V I c + Δ N D V I H
Average NDVI is significantly correlated with P and E0 [32,33,34], so we calculated the multiple linear regression equation between NDVI, P and E0 in T1 period. There are two assumptions in the attribution analysis of vegetation change using multiple linear regression method: (1) Human activities and climate factors are independent factors. (2) The base period is only affected by climate factors. Therefore, except for climate factors, other factors affecting vegetation change are classified as human activities.
N D V I T 1 = a × P T 1 + b × E 0 T 1 + c
N D V I T 2 , s = a × P T 2 + b × E 0 T 2 + c
Δ N D V I H = N D V I T 2 N D V I T 2 , S
Δ N D V I c = N D V I T 2 , S N D V I T 1
η N D V I H = Δ N D V I H / Δ N D V I
η N D V I C = Δ N D V I c / Δ N D V I
where, N D V I T 2 , S represents average NDVI value under climate change in the T2 period. N D V I T 1 and N D V I T 2 represent average NDVI value of the two periods, respectively. η N D V I H and η N D V I C represent the influence of anthropic and climatic factors on vegetation variation.
Δ R = Δ R P + Δ R E 0 + η N D V I C × Δ R N D V I + η N D V I H × Δ R N D V I + Δ R H
η R P = Δ R P / Δ R × 100 %
η R E 0 = Δ R E 0 / Δ R × 100 %
η R N D V I C = η N D V I C × Δ R N D V I / Δ R × 100 %
η R N D V I H = η N D V I H × Δ R N D V I / Δ R × 100 %
η R H = Δ R H / Δ R × 100 %
η R p , η R E 0 , η R N D V I C , η R N D V I H and η R H represent the contribution rates of precipitation, potential evaporation, climatic vegetation change, anthropogenic vegetation change and anthropic factors on runoff.

4. Results and Analysis

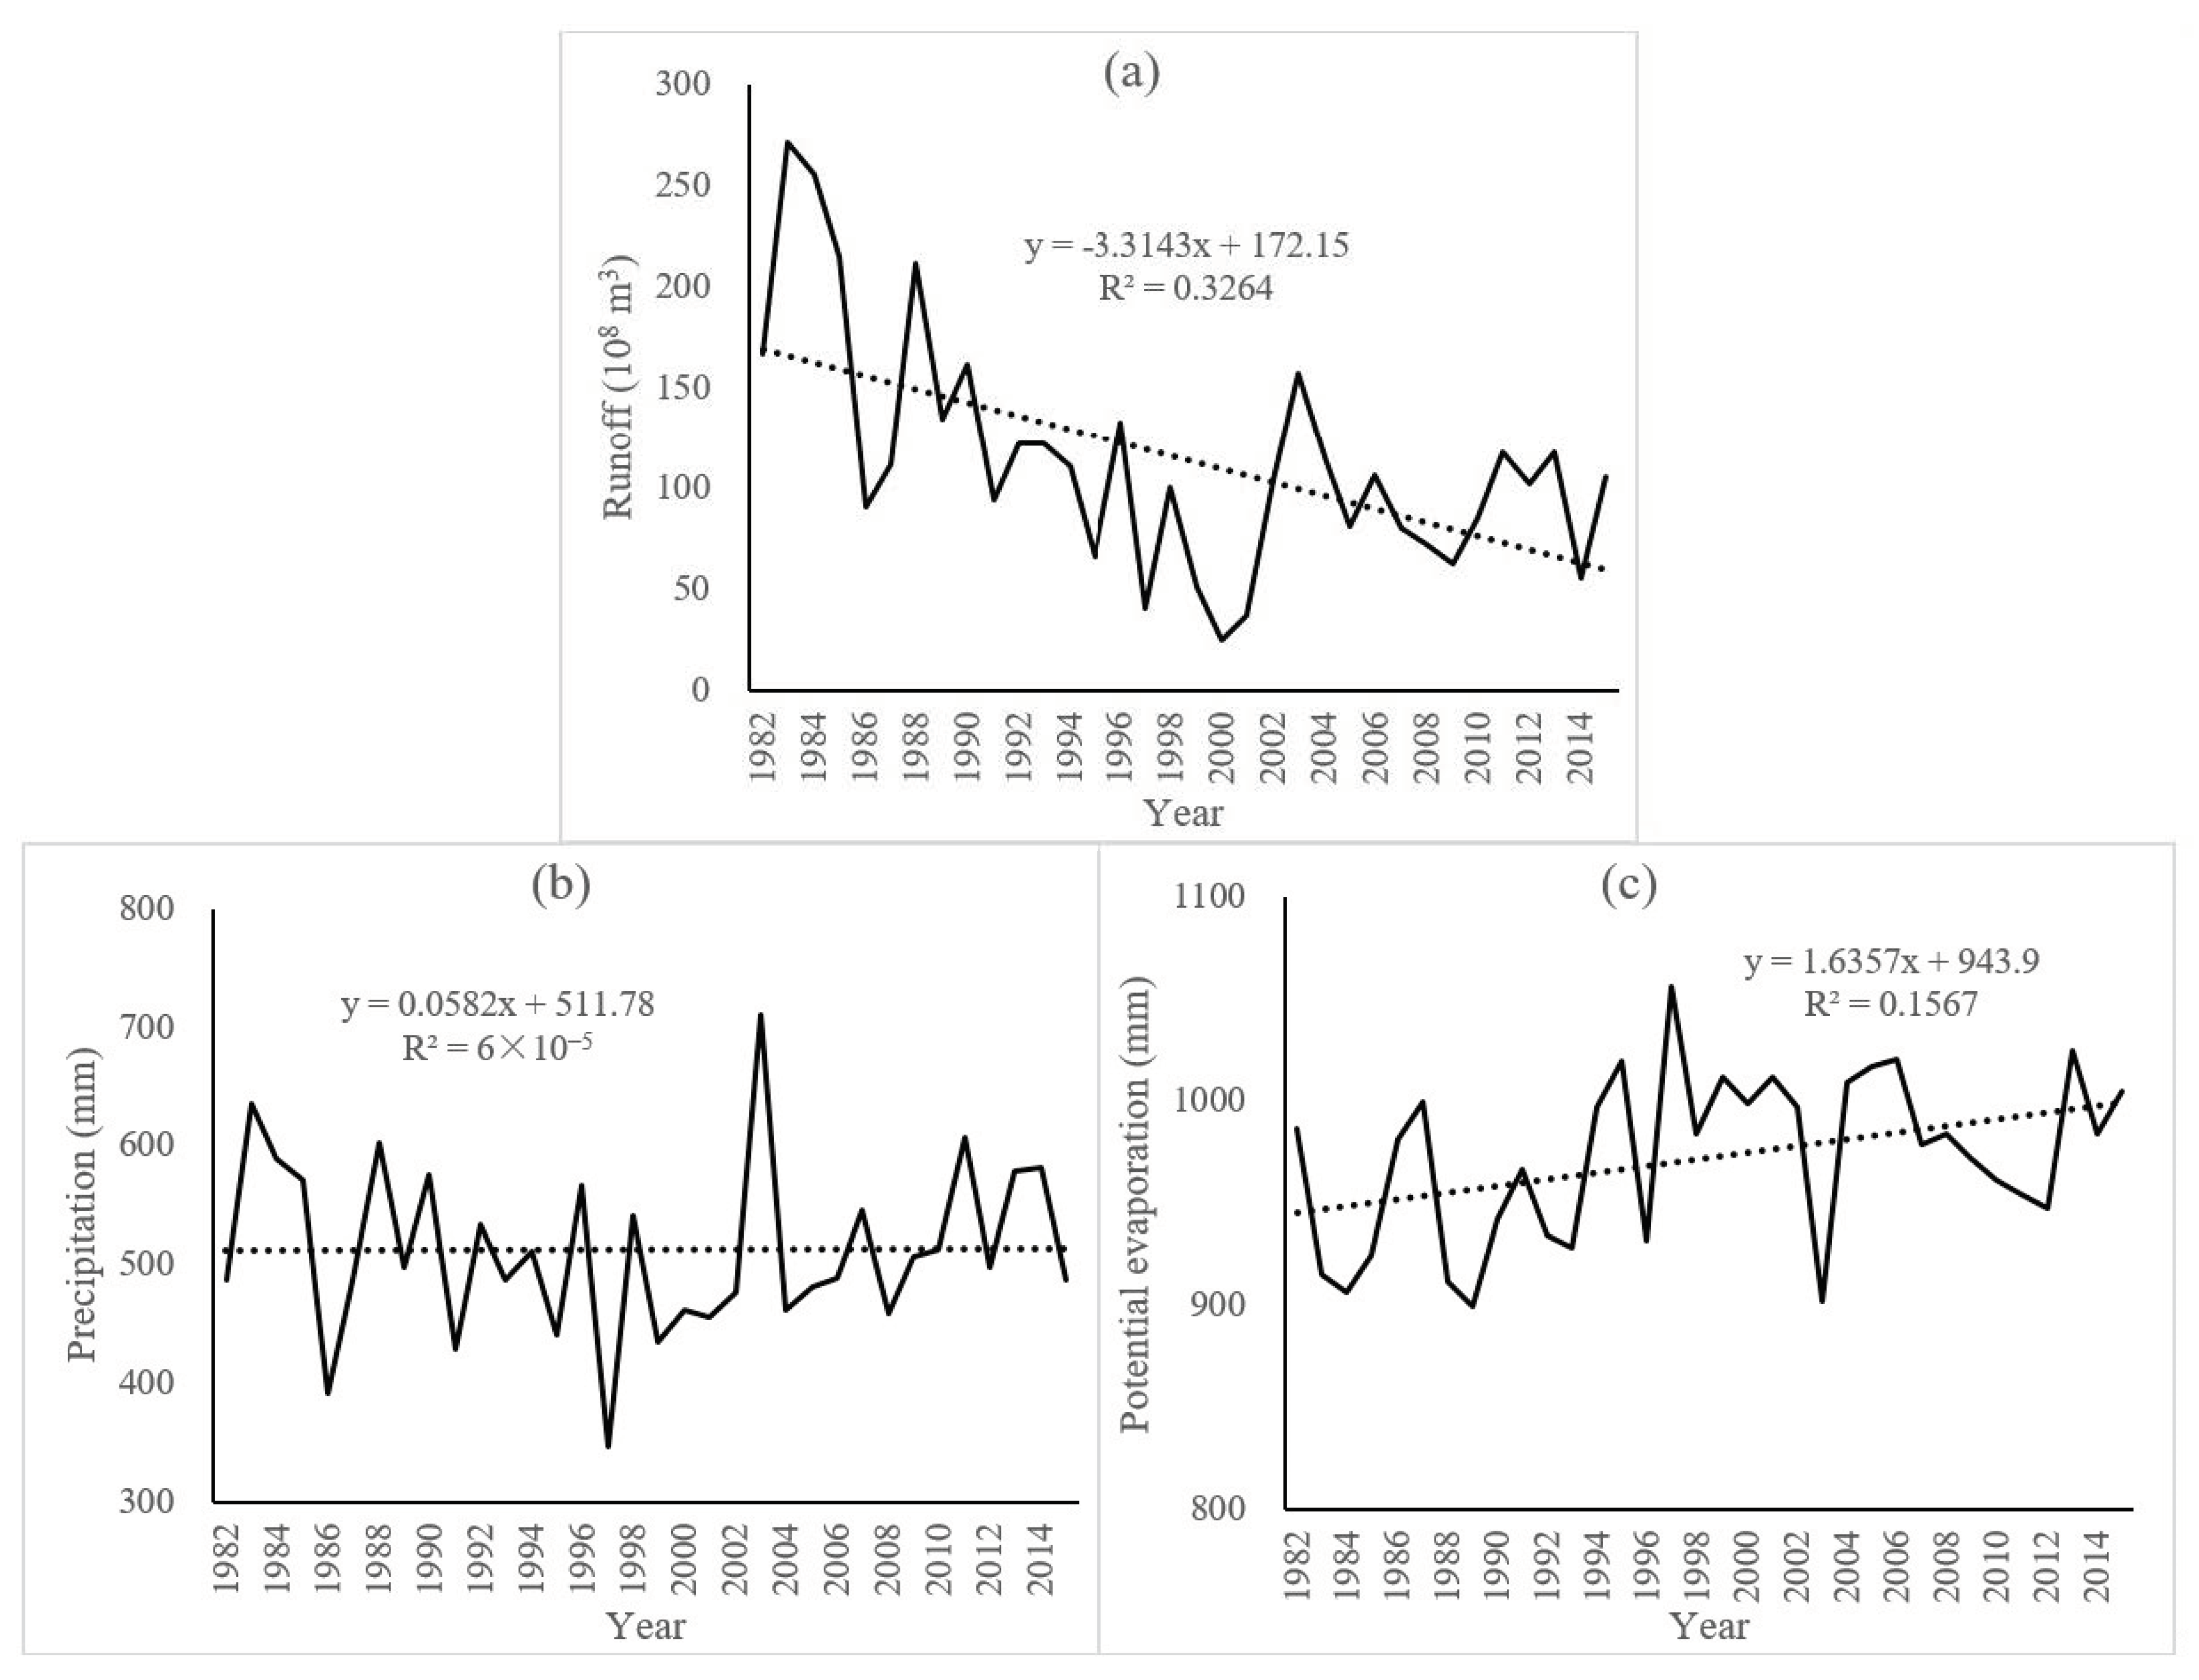
4.1. Trend Analysis of Meteorological and Hydrological Elements

The changes in runoff, precipitation and potential evaporation in the MRYR from 1982 to 2015 are displayed in Figure 2. From Figure 2a, the annual runoff in the MRYR showed a significant decreasing tendency in the period of 1982–2015 (p < 0.05), with a slope of −3.3143 × 10⁸ m3/a. From Figure 2b, the average annual precipitation in the MRYR showed a tendency to increase from 1982 to 2015 (p > 0.05), with a slope of 0.0582 mm/a. The average annual potential evaporation in the middle reaches of the Yellow River displayed a fluctuating growth tendency in the period of 1982–2015 (p < 0.05), and the increase rate was 1.6357 mm/a.

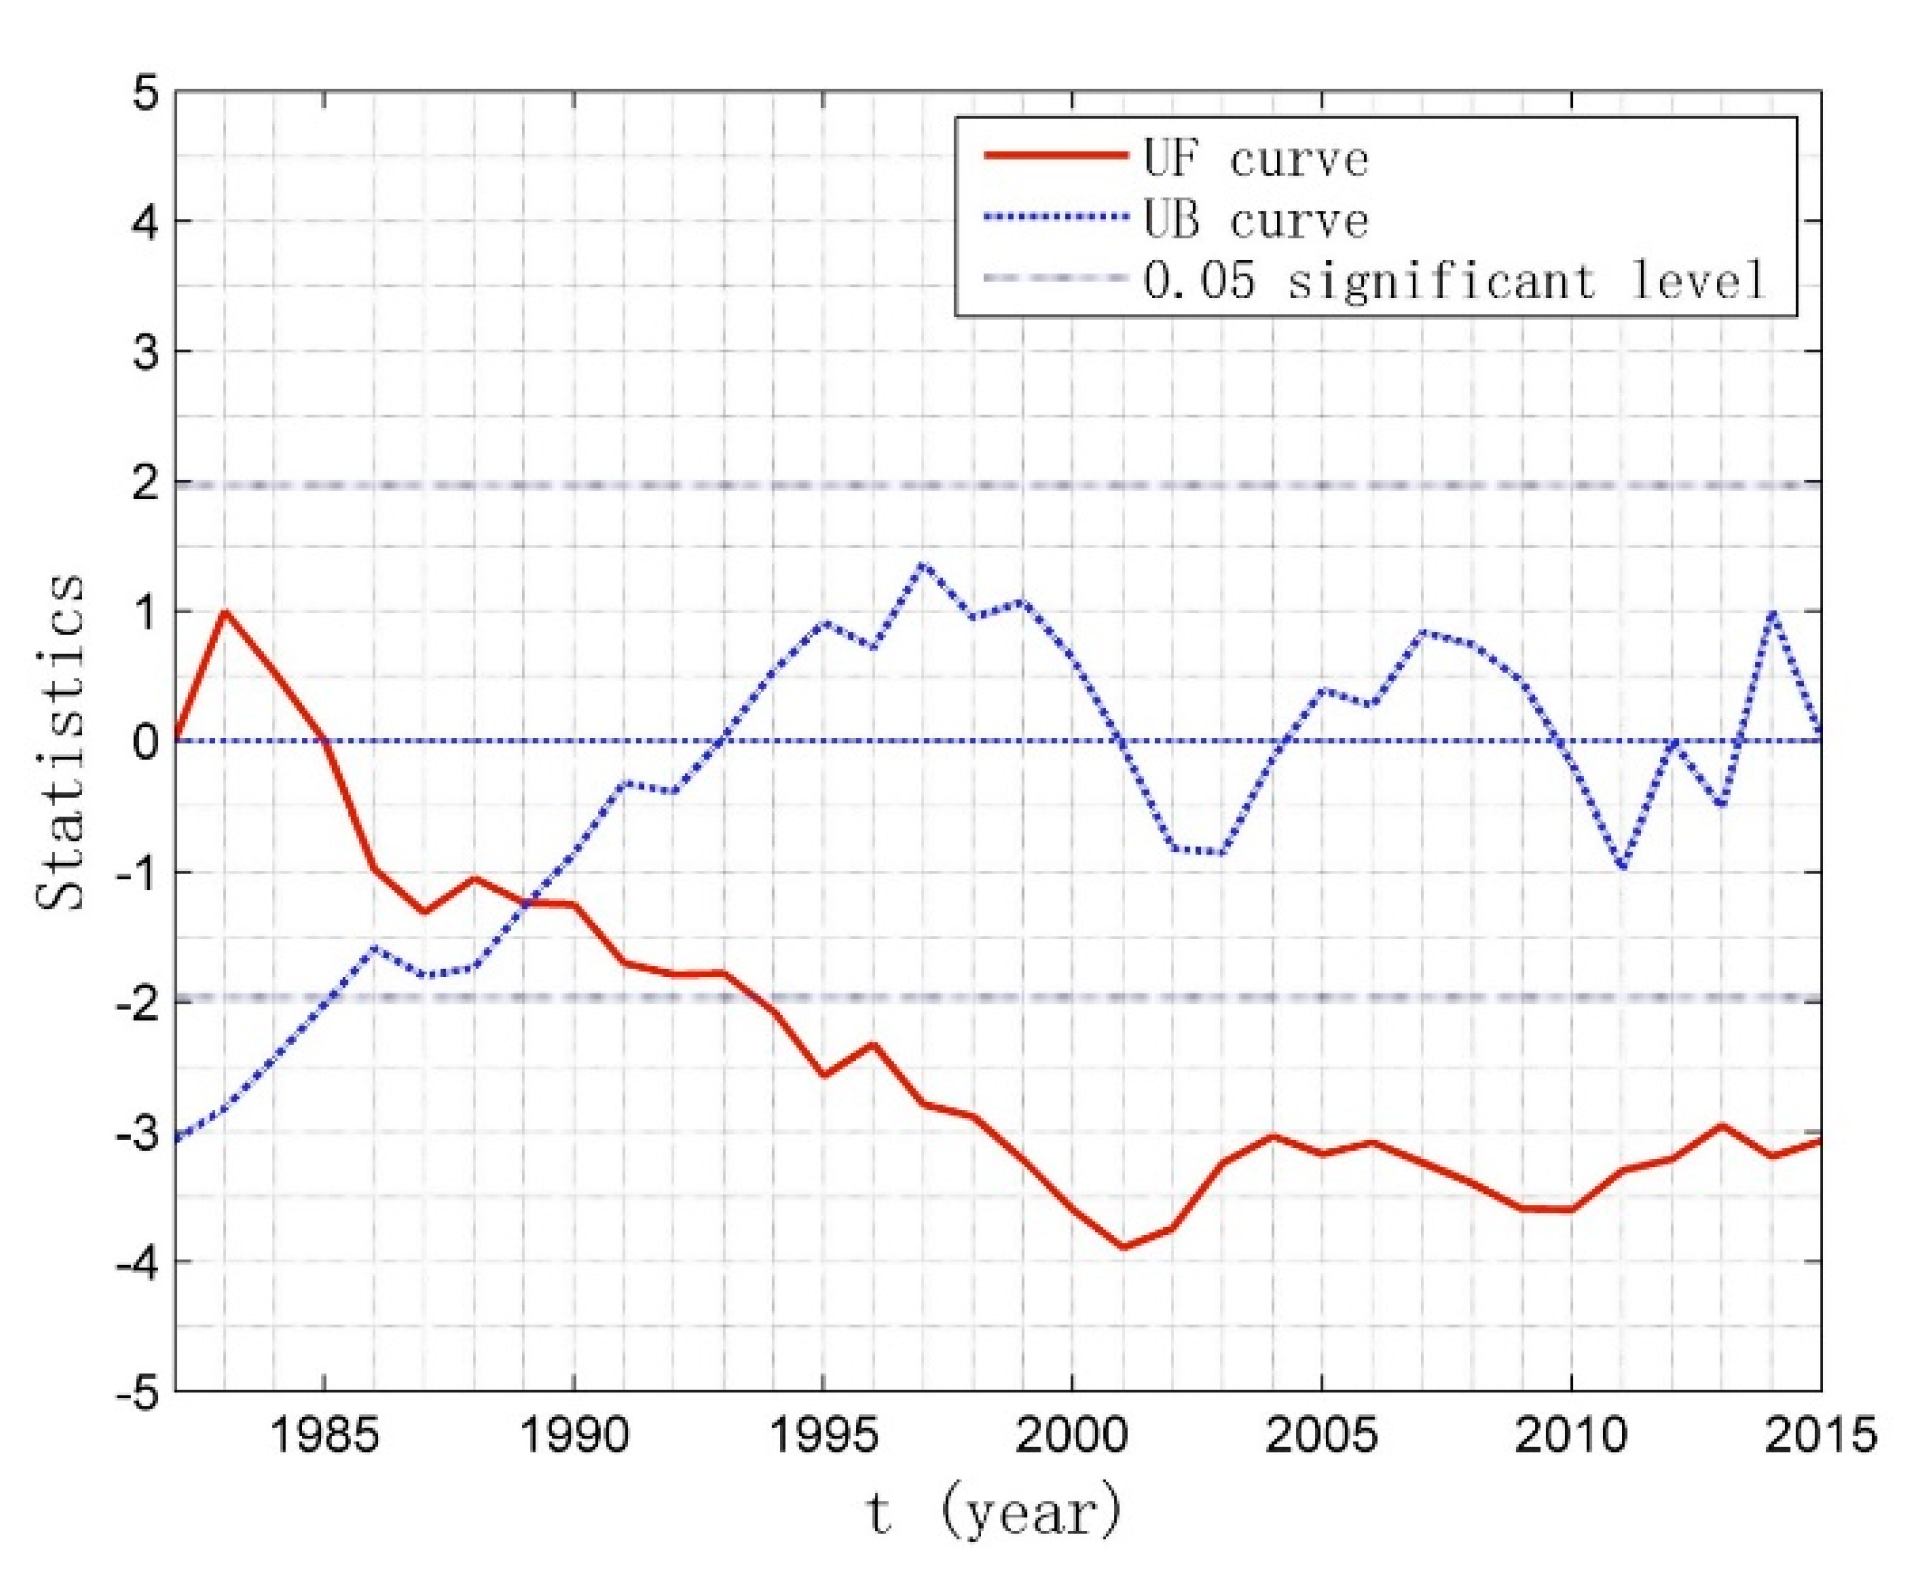
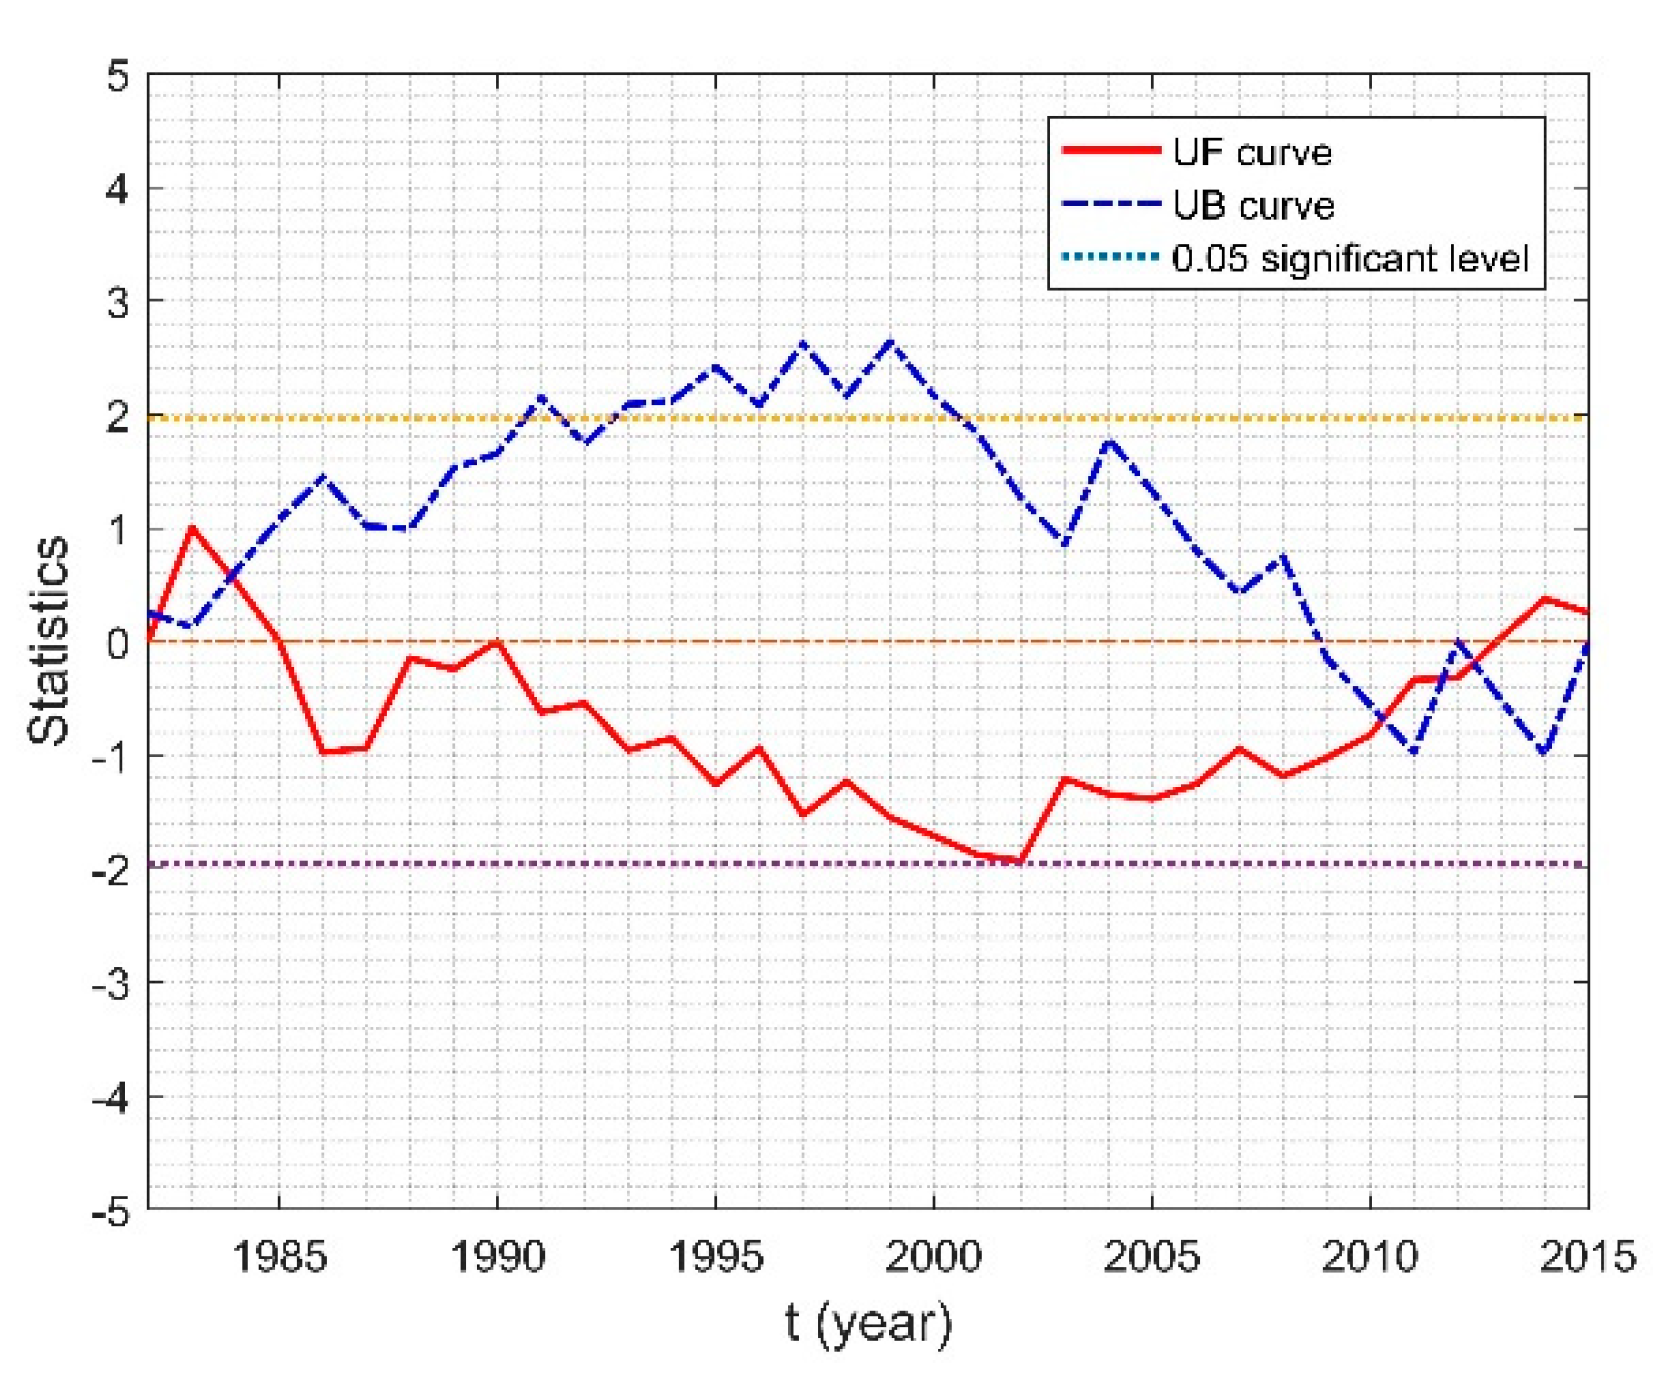
4.2. Mutation Year Identification

Because the Mann-Kendall mutation test algorithm is not disturbed by a few outliers and has the advantages of simple calculation, it is widely used to identify the mutation points of hydro-meteorological elements [35,36,37,38].
In the Mann-Kendall mutation detection algorithm, UF statistics are a sequence of statistics calculated by the order of time series X, and UB statistics are a sequence of statistics calculated by the inverse order of time series X. In practical application, it is generally considered that the result is credible at the significance level of 0.05. If the UF statistics line and UB statistics line have intersections and these intersections are within the range of 0.05, this is significant. The year corresponding to the intersection is the mutation year of the time series data.
UF statistics of runoff time series data in the MRYR intersected with UB statistics in 1989 (Figure 3), and this intersection is within the range of 0.05 (significant level), indicating that 1989 is a runoff mutation year in the MRYR.
UF statistics of precipitation time series data in the MRYR intersected with UB statistics in 1984, 2010, 2012 (Figure 4), and these intersections are all within the range of the 0.05 significant level, indicating that 1984, 2010, 2012 are precipitation mutation years in the MRYR.

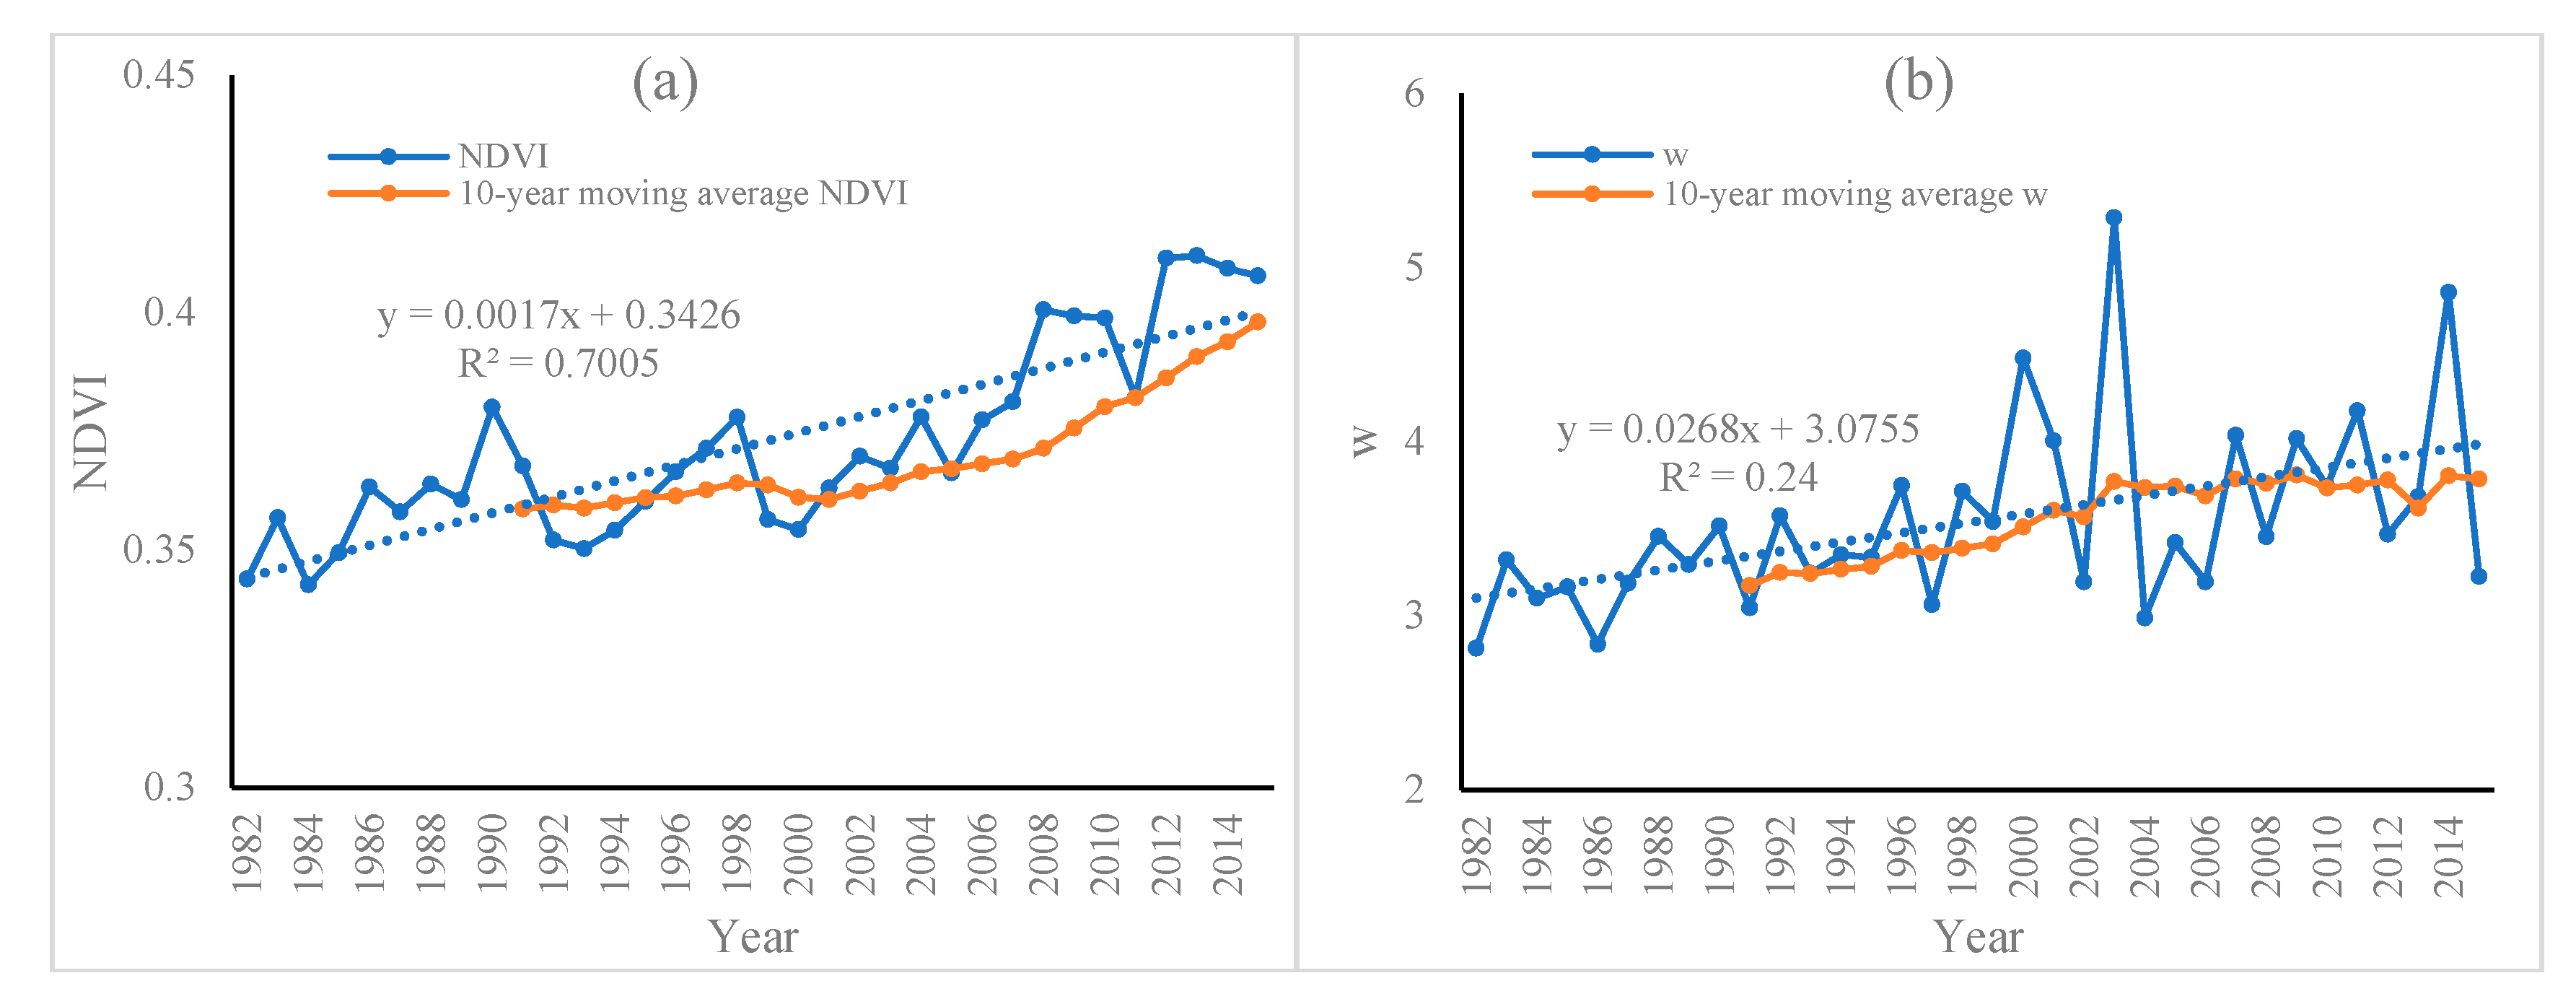
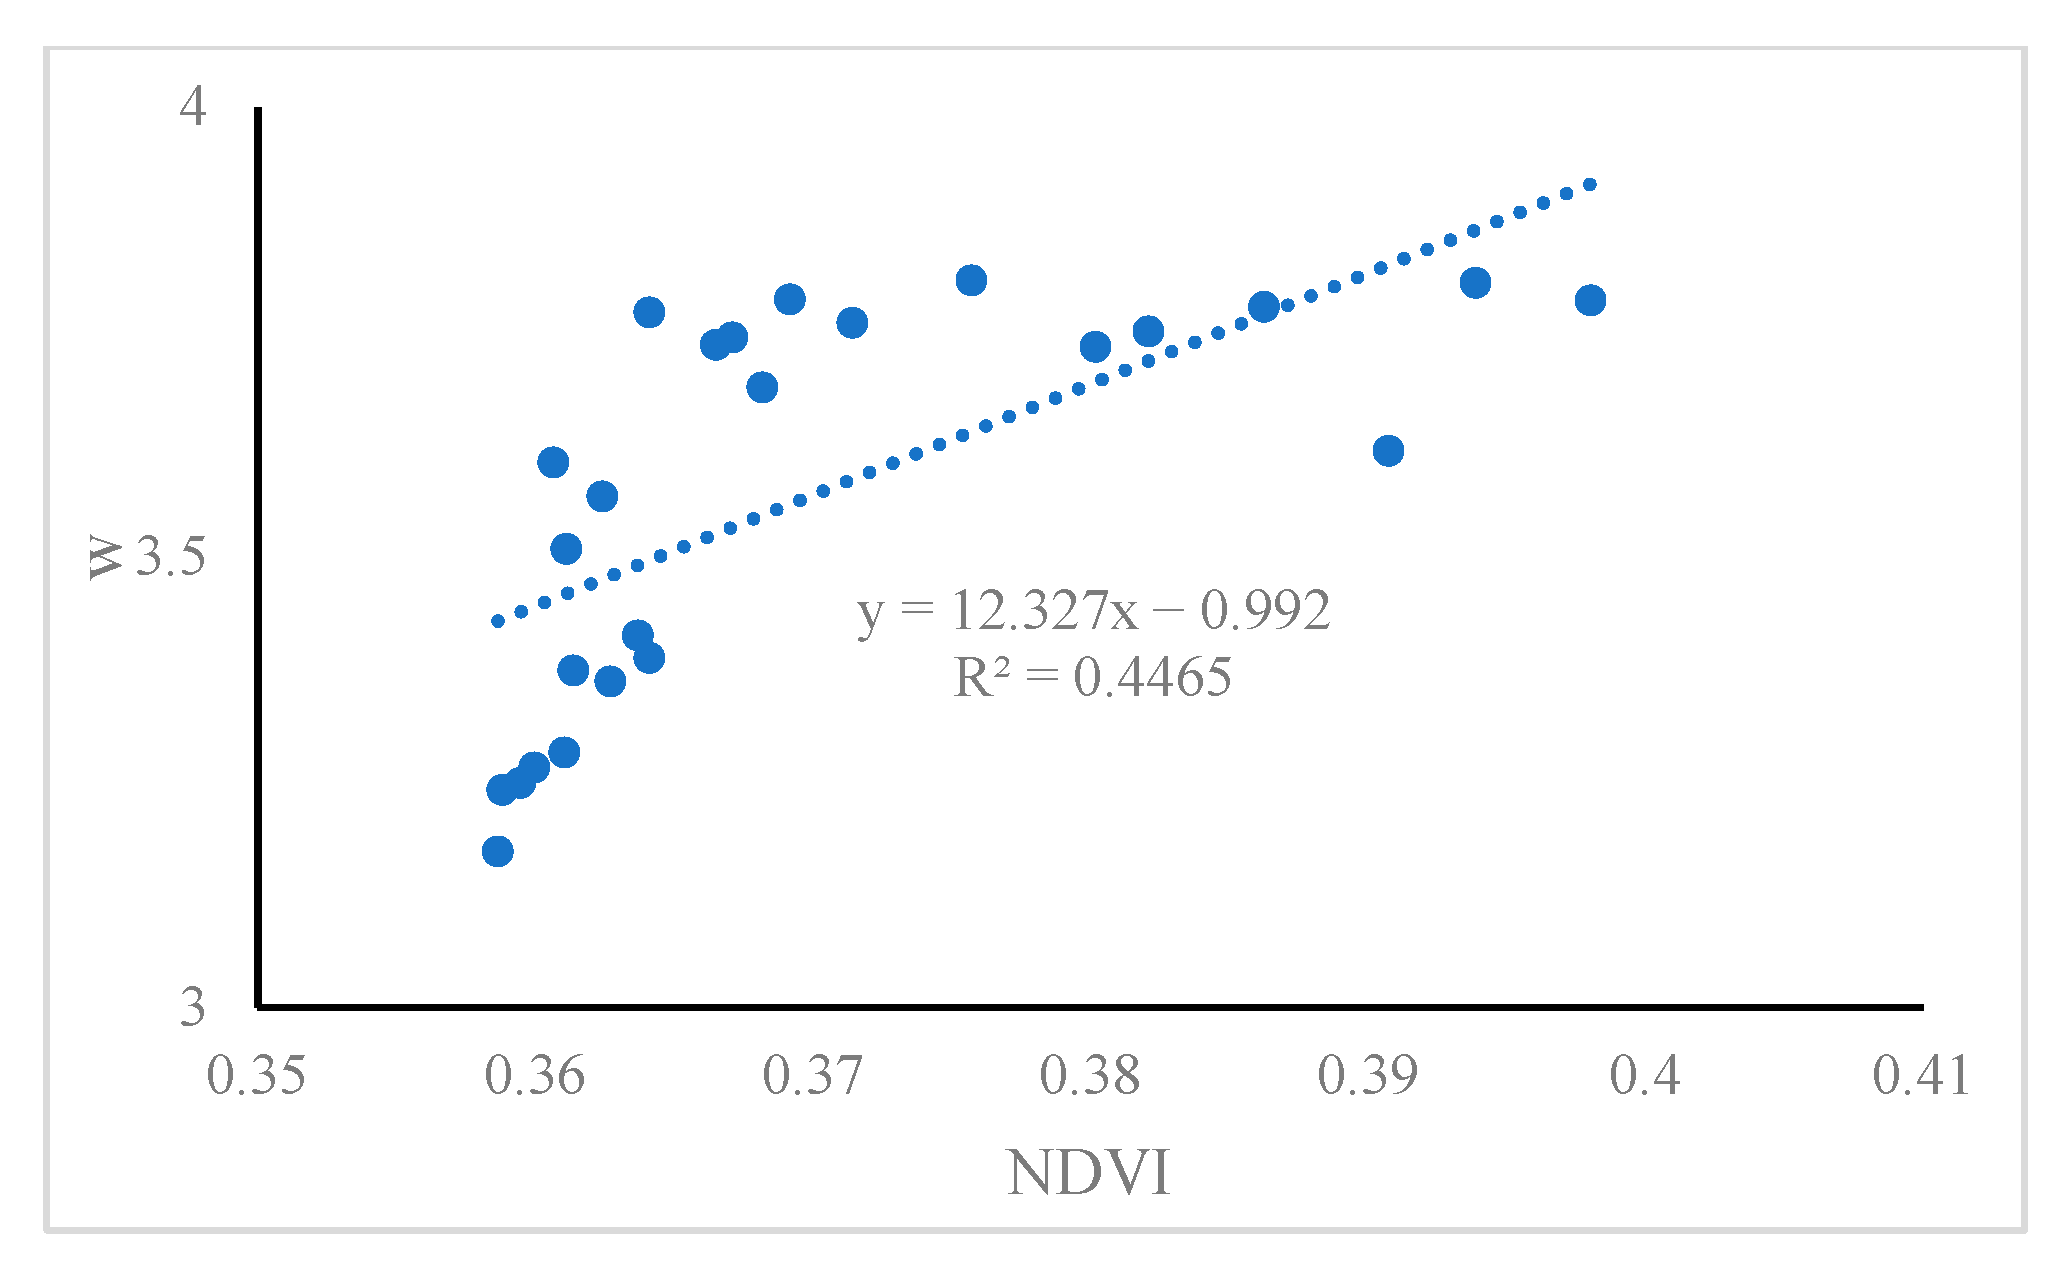
4.3. The Relationship between NDVI and w

In Budyko’s hypothesis, the parameter (w) reflects the change in the underlying surface, so the parameter (w) should change on an annual or multi-year scale. For the Fu-type Budyko equation, if the elements (Q, P, E0) in the equation can be determined, the parameter (w) can be solved. Using the hydrological and meteorological data in the MRYR from 1982 to 2015, the parameters (w) from 1982 to 2015 are obtained. Figure 5 displayed the variation tendency of NDVI and underlying surface parameters (w) in the MRYR from 1982 to 2015. The NDVI and underlying surface parameters (w) in the middle reaches of the Yellow River increased significantly (p < 0.05), and the slopes were 0.017/10a and 0.268/10a, respectively.
In this paper, the values of underlying surface parameters (w) and NDVI are processed by a 10-year moving average, and then the regression coefficients (a and b) are obtained by least square fitting, a = 12.327, b = −0.992. The R2 of equation fitting is 0.4465, and is significant (p < 0.05), indicating that the fitting result is good (Figure 6).

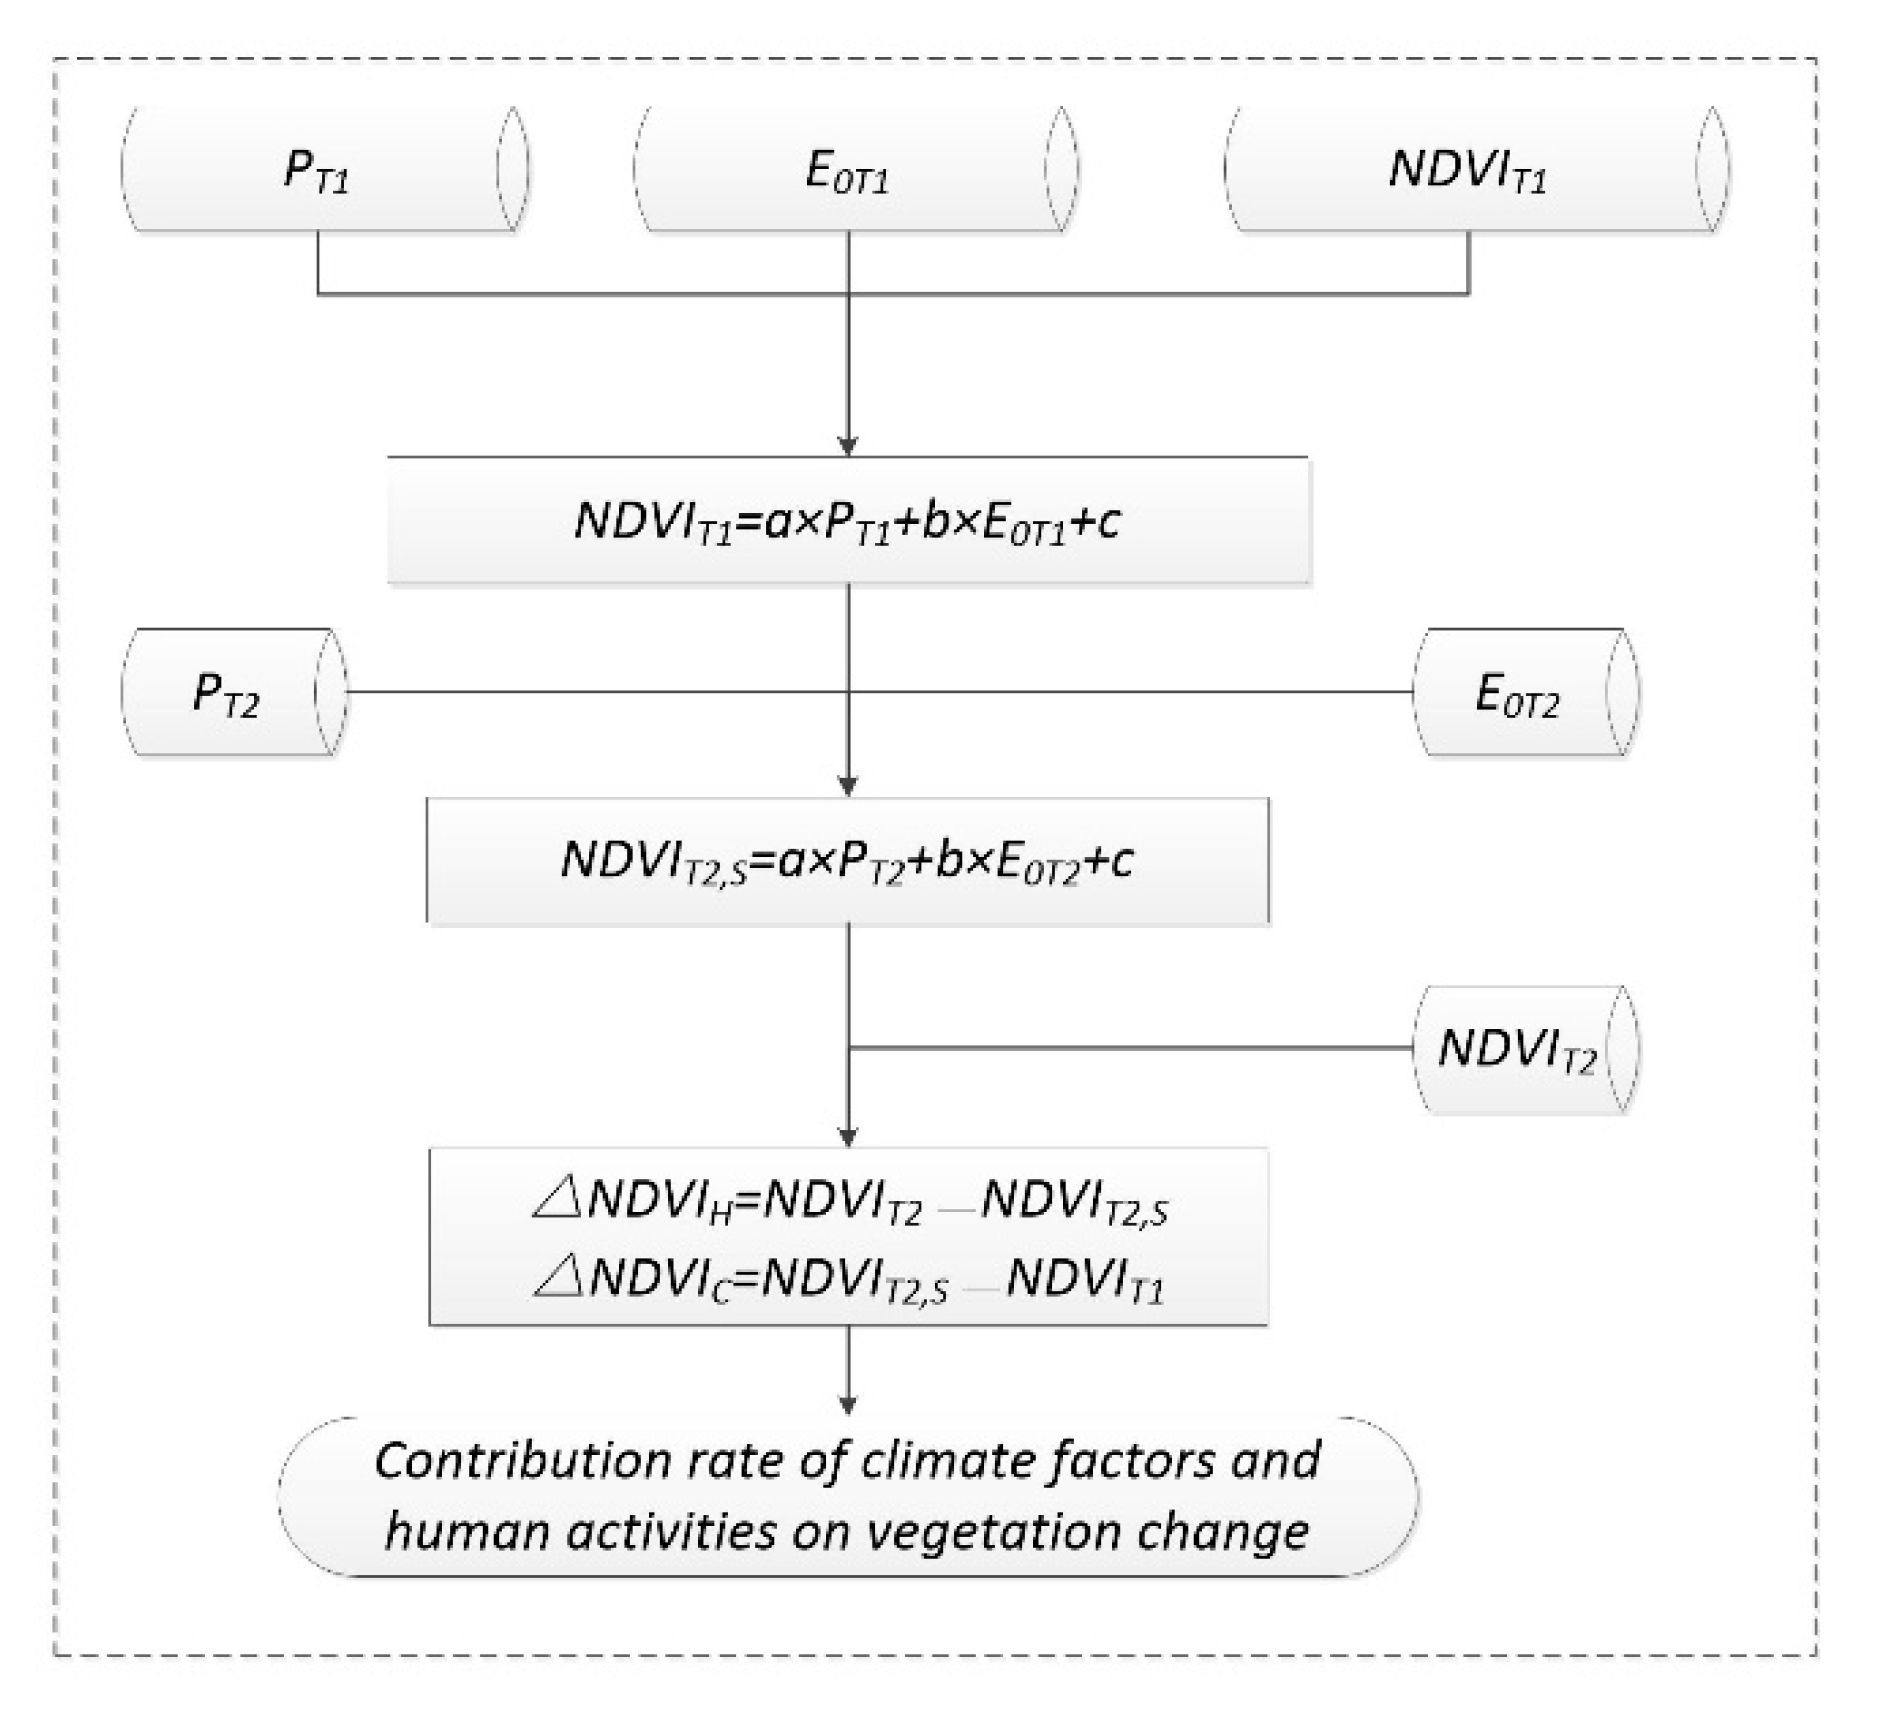
4.4. Quantifying the Influence of Vegetation Variation on Runoff

Because we want to quantitatively calculate the contribution rate of different factors on runoff change (Figure 7), 1982–2015 is separated into T1 (1982–1989) and T2 (1990–2015), according to the catastrophe analysis results of runoff data in the MRYR. Firstly, we analyzed the correlation between NDVI, P and E0 (Figure 8), implying that NDVI is significantly correlated with P and E0. Next, we calculated the linear function relation between NDVI, P and E0 in T1 period. Finally, we analyzed the contribution rate of different factors on vegetation change, using formulas 27–31 (Table 1). The results showed that the contribution of climatic and non-climatic factors on vegetation variation is close to 1:99.
Shown in Table 2, compared with the T1 period, the potential evaporation in the T2 period increased by 41.70 mm, precipitation and runoff depth decreased by 25.89 mm and 24.49 mm, respectively, underlying surface parameters (w) and NDVI increased by 0.52 and 0.023, respectively.
Table 3 displays the influence of climatic and anthropogenic factors on the annual runoff of the post-change period. Contrasted to T1, runoff variation amount caused by precipitation, potential evapotranspiration, vegetation variation and anthropogenic activities in the T2 is −5.42 mm, −3.25 mm, −7.84 mm, and −6.98 mm. Their contributions were 23.07%, 13.85%, 33.37%, and 29.71%, respectively.

5. Conclusions and Discussion

Using NDVI, meteorological data and measured runoff data, based on an adjusted Fu-type Budyko equation, this paper quantitatively analyzed the contribution of vegetation variation on runoff in the MRYR from 1982 to 2015. The results showed that the influence of climatic and anthropogenic factors on vegetation variation is about 1:99. Vegetation change played a major role on runoff in the MRYR. Precipitation, potential evaporation and human activities account for 23.07%, 13.85% and 29.71% in runoff variation, respectively.
Although this paper carries out strict quality control on the data and model, some non-determinacy remains. Firstly, precipitation and potential evaporation data are interpolated from the data of meteorological stations in and around the MRYR, which will bring some non-determinacy. Secondly, the precondition of the study is that all variables are independent and do not affect each other. For example, when calculating the partial derivative of multi-year evapotranspiration to runoff, it is required that the factors, such as vegetation change, precipitation and human activities, are independent. However, in practice, the underlying surface and climate system are a whole. These factors interact and affect each other, which will have some non-determinacy on the research results.
This paper quantitatively calculated the influence of vegetation variation on runoff in the MRYR, but in order to reveal the influence mechanism of vegetation on water cycle, it is necessary to analyze how vegetation affects the hydrological process of “precipitation-interception-infiltration-evapotranspiration-runoff”. In the follow-up study, we will combine the distributed hydrological model HLMS with the PML model, coupling leaf area index information to build a distributed Hydrothermal Coupling Model [39,40,41], for clarifying the response of water heat balance to vegetation variation. In addition, in the process of quantitatively calculating the contribution rate of different factors on runoff change, in addition to climate factors and vegetation change, water conservancy project construction, urban residents’ domestic water and agricultural irrigation water are classified as human activity factors. We will quantitatively calculate the contribution rate of urban water, industrial water, agricultural water and water conservancy project construction on runoff change in the follow-up study.

Author Contributions

Conceptualization: G.J. and D.Y.; Data curation: G.J. and J.H.; Methodology: G.J., Y.G. and D.Y.; Writing—original draft: G.J. and D.Y.; Writing—review and editing: G.J., J.H., Y.G. and D.Y. All authors have read and agreed to the published version of the manuscript.

Funding

This research was funded by the National Key R&D Program of China (2021YFD1700900), Soft Science Research of Technology Development Projects of Henan Province (212400410077), Think tanks key research projects of Colleges and Universities of Henan Province (2022ZKYJ07), Young backbone teachers program of Henan Province (2019GGJS048) and the special fund for top talents in Henan Agricultural University (30501031).

Institutional Review Board Statement

Not applicable.

Informed Consent Statement

Not applicable.

Data Availability Statement

Not applicable.

Conflicts of Interest

We declare no conflict of interest.

References

  1. Wei, X.; Sun, G.; Liu, S.; Jiang, H.; Zhou, G.; Dai, L. The forest-streamflow relationship in China: A 40-year retrospect. J. Am. Water Resour. Assoc. 2008, 44, 1076–1085. [Google Scholar] [CrossRef] [Green Version]
  2. Lü, Y.; Zhang, L.; Feng, X.; Zeng, Y.; Fu, B.; Yao, X.; Li, J.; Wu, B. Recent ecological transitions in China: Greening, browning, and influential factors. Sci. Rep. 2015, 5, 8732. [Google Scholar] [CrossRef]
  3. Piao, S.; Yin, G.; Tan, J.; Cheng, L.; Huang, M.; Li, Y.; Liu, R.; Mao, J.; Myneni, R.B.; Peng, S. Detection and attribution of vegetation greening trend in China over the last 30 years. Glob. Chang. Biol. 2015, 21, 1601–1609. [Google Scholar] [CrossRef] [PubMed]
  4. Feng, X.; Fu, B.; Piao, S.; Wang, S.; Ciais, P.; Zeng, Z.; Lü, Y.; Zeng, Y.; Li, Y.; Jiang, X. Revegetation in China’s Loess Plateau is approaching sustainable water resource limits. Nat. Clim. Chang. 2016, 6, 1019–1022. [Google Scholar] [CrossRef]
  5. Liu, J.; Li, Z.; Zhang, X.; Li, R.; Liu, X.; Zhang, H. Responses of vegetation cover to the Grain for Green Program and their driving forces in the He-Long region of the middle reaches of the Yellow River. J. Arid. Land 2013, 5, 511–520. [Google Scholar] [CrossRef] [Green Version]
  6. Gao, H.; Wu, Z. Vegetation restoration and its effect on runoff and sediment processes in the Toudaoguai-Tongguan section of the Yellow River. Acta Geogr. Sin. 2021, 76, 1206–1217. (In Chinese) [Google Scholar]
  7. Tian, F.; Liu, L.; Yang, J.; Wu, J. Vegetation greening in more than 94% of the Yellow River Basin (YRB) region in China during the 21st century caused jointly by warming and anthropogenic activities. Ecol. Indic. 2021, 125, 107479. [Google Scholar] [CrossRef]
  8. Piao, S.L.; Wang, X.H.; Ciais, P.; Zhu, B.; Liu, J. Changes in satellite-derived vegetation growth trend in temperate and boreal Eurasia from 1982 to 2006. Glob. Chang. Biol. 2011, 17, 3228–3239. [Google Scholar] [CrossRef]
  9. Jackson, R.B.; Jobbágy, E.G.; Avissar, R.; Roy, S.; Barrett, D.; Cook, C.; Farley, K.; Maitre, D.; Mccarl, B.; Cook, C. Trading water for carbon with biological carbon sequestration. Science 2005, 310, 1944–1947. [Google Scholar] [CrossRef] [Green Version]
  10. Ji, G.; Song, H.; Wei, H.; Wu, L. Attribution Analysis of Climate and Anthropic Factors on Runoff and Vegetation Changes in the Source Area of the Yangtze River from 1982 to 2016. Land 2021, 10, 612. [Google Scholar] [CrossRef]
  11. Calder, I.R.; Smyle, J.; Aylward, B. Debate over flood-proofing effects of planting forests. Nature 2007, 450, 945. [Google Scholar] [CrossRef]
  12. Buttle, J.M.; Metcalfe, R.A. Boreal forest disturbance and streamflow response, northeastern Ontario. Can. J. Fish Aquat. Sci. 2000, 57, 5–18. [Google Scholar] [CrossRef]
  13. Ceballos-Barbancho, A.; Morán-Tejeda, E.; Luengo-Ugidos, M.Á.; Llorente-Pinto, J.M. Water resources and environmental change in a Mediterranean environment: The south-west sector of the Duero river basin (Spain). J. Hydrol. 2008, 351, 126–138. [Google Scholar] [CrossRef]
  14. Zhou, G.; Wei, X.; Luo, Y.; Zhang, M.; Li, Y.; Qiao, Y.; Liu, H.; Wang, C. Forest recovery and river discharge at the regional scale of Guangdong Province, China. Water Resour. Res. 2010, 46, W09503. [Google Scholar] [CrossRef] [Green Version]
  15. Wang, S.; Fu, B.; He, C.; Sun, G.; Gao, G. A comparative analysis of forest cover and catchment water yield relationships in northern China. For. Ecol. Manag. 2011, 262, 1189–1198. [Google Scholar] [CrossRef]
  16. Liu, Y.; Tang, X.; Sun, Z.; Zhang, J.; Wang, G.; Jin, J.; Wang, G. Spatiotemporal precipitation variability and potential drivers during 1961–2015 over the Yellow River Basin, China. Weather 2019, 74, 32–39. [Google Scholar] [CrossRef] [Green Version]
  17. Yi, H.; Mu, X.; Peng, G.; Zhao, G.; Wang, F.; Sun, W.; Zhang, Y. Spatial Variability and Periodicity of Precipitation in the Middle Reaches of the Yellow River, China. Adv. Meteorol. 2016, 2016, 9451614. [Google Scholar]
  18. Ji, G.; Lai, Z.; Xia, H.; Liu, H.; Wang, Z. Future Runoff Variation and Flood Disaster Prediction of the Yellow River Basin Based on CA-Markov and SWAT. Land 2021, 10, 421. [Google Scholar] [CrossRef]
  19. Liu, W.; Shi, C.; Zhou, Y. Trends and attribution of runoff changes in the upper and middle reaches of the Yellow River in China. J. Hydro-Environ. Res. 2021, 37, 57–66. [Google Scholar] [CrossRef]
  20. Hu, C.; Ran, G.; Li, G.; Yu, Y.; Wu, Q.; Yan, D.; Jian, S. The effects of rainfall characteristics and land use and cover change on runoff in the Yellow River basin, China. J. Hydrol. Hydromech. 2021, 69, 29–40. [Google Scholar] [CrossRef]
  21. Liu, Q.; Yang, Z.F.; Cui, B.S.; Sun, T. Temporal trends of hydro-climatic variables and runoff response to climatic variability and vegetation changes in the Yiluo River basin, China. Hydrol. Process. 2009, 23, 3030–3039. [Google Scholar] [CrossRef]
  22. Xu, J.; Jiang, X.; Sun, H.; Xu, H.; Zhong, X.; Liu, B.; Li, L. Driving forces of nature and human activities on water and sediment changes in the middle reaches of the Yellow River in the past 100 years. J. Soils Sediments 2021, 21, 2450–2464. [Google Scholar] [CrossRef]
  23. Liu, X.; Liu, C.; Yang, S.; Jin, S.; Gao, Y.; Gao, Y. Influences of shrubs-herbs-arbor vegetation coverage on the runoff based on the remote sensing data in Loess Plateau. Acta Geogr. Sin. 2014, 69, 1595–1603. (In Chinese) [Google Scholar]
  24. Liang, W.; Bai, D.; Wang, F.; Fu, B.; Yan, J.; Wang, S.; Yang, Y.; Long, D.; Feng, M. Quantifying the impacts of climate change and ecological restoration on streamflow changes based on a Budyko hydrological model in China’s Loess Plateau. Water Resour. Res. 2015, 51, 6500–6519. [Google Scholar] [CrossRef]
  25. Li, S.; Liang, W.; Fu, B.J.; Lv, Y.; Fu, S.; Wang, S.; Su, H. Vegetation changes in recent large scale ecological restoration projects and subsequent impact on water resources in China’s Loess Plateau. Sci. Total Environ. 2016, 569, 1032–1039. [Google Scholar] [CrossRef]
  26. Zhang, J.; Ma, X.; Li, Y. Vegetation dynamics and its impact on runoff in the Hekouzhen-Longmen region of the middle reaches in the Yellow River from 1980–2016. South-North Water Transf. Water Sci. Technol. 2020, 18, 91–109. (In Chinese) [Google Scholar]
  27. Wang, X.; Yang, D.; Fang, X.; Cheng, C.; Zhou, C.; Zhang, X.; Ao, Y. Impacts of ecological restoration on water resources in middle reaches of Yellow River. Bull. Soil Water Conserv. 2020, 40, 205–212. (In Chinese) [Google Scholar]
  28. Su, Y.; Chen, X.; Li, Y.; Liao, J.; Ye, Y.; Zhang, H.; Huang, N.; Kuang, Y. China’s 19-year city-level carbon emissions of energy consumptions, driving forces and regionalized mitigation guidelines. Renew. Sustain. Energy Rev. 2014, 35, 231–243. [Google Scholar] [CrossRef]
  29. Xia, H.; Wang, H.; Ji, G. Regional Inequality and Influencing Factors of Primary PM Emissions in the Yangtze River Delta, China. Sustainability 2019, 11, 2269. [Google Scholar] [CrossRef] [Green Version]
  30. Fu, B.P. On the calculation of the evaporation from land surface. Chin. J. Atmos. Sci. 1981, 5, 23–31. (In Chinese) [Google Scholar]
  31. Li, D.; Pan, M.; Cong, Z.; Wood, E. Vegetation control on water and energy balance within the Budyko framework. Water Resour. Res. 2013, 49, 969–976. [Google Scholar] [CrossRef]
  32. Li, J.; Peng, S.; Li, Z. Detecting and attributing vegetation changes on China’s Loess Plateau. Agric. For. Meteorol. 2017, 247, 260–270. [Google Scholar] [CrossRef]
  33. Gao, J.; Jiao, K.; Wu, S. Investigating the spatially heterogeneous relationships between climate factors and NDVI in China during 1982 to 2013. J. Geogr. Sci. 2019, 29, 1597–1609. [Google Scholar] [CrossRef] [Green Version]
  34. Guo, L.; Zuo, L.; Gao, J.; Jiang, Y.; Zhang, Y.; Ma, S.; Zou, Y.; Wu, S. Revealing the Fingerprint of Climate Change in Interannual NDVI Variability among Biomes in Inner Mongolia, China. Remote Sens. 2020, 12, 1332. [Google Scholar] [CrossRef] [Green Version]
  35. Gong, L.; Jin, C. Fuzzy Comprehensive Evaluation for Carrying Capacity of Regional Water Resources. Water Resour. Manag. 2009, 23, 2505–2513. [Google Scholar] [CrossRef]
  36. He, B.; Miao, C.; Shi, W. Trend, abrupt change, and periodicity of streamflow in the mainstream of Yellow River. Environ. Monit. Assess. 2013, 185, 6187–6199. [Google Scholar] [CrossRef]
  37. Zeng, Z.; Liu, J.; Savenije, H.H. A simple approach to assess water scarcity integrating water quantity and quality. Ecol. Indic. 2013, 34, 441–449. [Google Scholar] [CrossRef]
  38. Yan, D.; Lai, Z.; Ji, G. Using Budyko-Type Equations for Separating the Impacts of Climate and Vegetation Change on Runoff in the Source Area of the Yellow River. Water 2020, 12, 3418. [Google Scholar] [CrossRef]
  39. Leuning, R.; Zhang, Y.Q.; Rajaud, A.; Cleugh, H.; Tu, K. A simple surface conductance model to estimate regional evaporation using MODIS leaf area index and the Penman-Monteith equation. Water Resour. Res. 2008, 44, 1–17. [Google Scholar] [CrossRef]
  40. Liu, C.M.; Wang, Z.G.; Yang, S.T.; Sang, Y.; Liu, X.; Li, J. Hydro-informatic modeling system: Aiming at water cycle in land surface material and energy exchange processes. Acta Geogr. Sin. 2014, 69, 579–587. (In Chinese) [Google Scholar]
  41. Zhang, D.; Liu, X.M.; Bai, P. Different influences of vegetation greening on regional water-energy balance under different climatic conditions. Forests 2018, 9, 412. [Google Scholar] [CrossRef] [Green Version]
Figure 1. Location of the study area and distribution of Hydro-meteorological stations.
Land 11 00535 g001
Figure 2. Changes in annual runoff (a), precipitation (b) and potential evaporation (c) in MRYR.
Land 11 00535 g002
Figure 3. Mann-Kendall catastrophe analysis result of runoff in MRYR from 1982 to 2015.
Land 11 00535 g003
Figure 4. Mann-Kendall catastrophe analysis result of precipitation in MRYR from 1982 to 2015.
Land 11 00535 g004
Figure 5. Variation trend of NDVI (a) and underlying surface parameters (w) (b) in the middle reaches of the Yellow River from 1982 to 2015.
Land 11 00535 g005
Figure 6. The relationship between NDVI and underlying surface parameter (w).
Land 11 00535 g006
Figure 7. A flow chart for calculating the contribution of different factors on vegetation change.
Land 11 00535 g007
Figure 8. The relationship between NDVI and precipitation (a) and potential evaporation (b).
Land 11 00535 g008
Table 1. Attribution analysis of vegetation variation in MRYR.
T1T2Fitting Equation Δ N D V I N D V I T 1 N D V I T 2 , S N D V I T 2 η N D V I C η N D V I H
1982–19891990–2015NDVI = 1.495 × 10⁻³P + 1.344 × 10⁻³ET0 + 0.1807
(R2 = 0.84)
0.02270.35480.35510.37750.97%99.03%
Table 2. The value of climate, hydrology and NDVI variables in different periods in MRYR.
PeriodsE0/mmP/mmR/mmwNDVI
T (1982–2015)972.53 512.80 31.52 3.55 0.373
T1 (1982–1989)940.64532.6050.253.150.355
T2 (1990–2015)982.34506.7125.763.670.378
T2T141.70−25.89−24.490.520.023
Table 3. Attribution analysis of runoff variation in MRYR.
εPεE0εωεNDVI Δ R P Δ R E 0 Δ R N D V I Δ R h u m η R P η R E 0 η R N D V I C η R N D V I H η R h u m
3.41−2.41−3.20−4.08−5.42−3.25−7.84−6.9823.07%13.85%0.32%33.05%29.71%
Publisher’s Note: MDPI stays neutral with regard to jurisdictional claims in published maps and institutional affiliations.

