Article

Quantifying the Aboveground Biomass (AGB) of Gobi Desert Shrub Communities in Northwestern China Based on Unmanned Aerial Vehicle (UAV) RGB Images

Institute of Desertification Studies, Chinese Academy of Forestry, Beijing 100091, China
*
Author to whom correspondence should be addressed.
Land 2022, 11(4), 543; https://doi.org/10.3390/land11040543
Submission received: 5 March 2022 / Revised: 4 April 2022 / Accepted: 5 April 2022 / Published: 8 April 2022

Abstract

:
Shrubs are an important part of the Gobi Desert ecosystem, and their aboveground biomass (AGB) is an important manifestation of the productivity of the Gobi Desert ecosystem. Characterizing the biophysical properties of low-stature vegetation such as shrubs in the Gobi Desert via conventional field surveys and satellite remote sensing images is challenging. The AGB of shrubs had been estimated from spectral variables taken from high-resolution images obtained by unmanned aerial vehicle (UAV) in the Gobi Desert, Xinjiang, China, using vegetation feature metrics. The main results were as follows: (1) Based on the UAV images, several RGB vegetation indices (RGB VIs) were selected to extract the vegetation coverage, and it was found that the excess green index (EXG) had the highest accuracy and the overall extraction accuracy of vegetation coverage reached 97.00%. (2) According to field sample plot surveys, the AGB and shrub crown area of single shrubs in the Gobi Desert were in line with a power model. From the bottom of the alluvial fan to the top of the alluvial fan, as the altitude increased, the AGB of the vegetation communities showed an increasing trend: the AGB of the vegetation communities at the bottom of the alluvial fan was 2–90 g/m2, while that at the top of the alluvial fan was 60–201 g/m2. (3) Vegetation coverage (based on the UAV image EXG index) and AGB showed a good correlation. The two conform to the relationship model (R2 = 0.897) and the expression is Y = 1167.341 x0.946, where Y is the AGB of the sample plots in units g/m2 and x is the vegetation coverage extracted by the VI. (4) The predicted AGB values of Gobi Desert shrubs using UAV RGB images based on a power model were closer to the actual observed AGB values. The study findings provide a more efficient, accurate, and low-cost method for estimating vegetation coverage and AGB of Gobi Desert shrubs.

1. Introduction

On the surface of the Earth, over one-fifth of the land surface is covered by mixed woody and herbaceous ecosystems [1], supporting significant global biodiversity and providing ecosystem services including climate regulation, disaster reduction, and soil and water conservation [2,3,4]. Shrub species often dominate the woody vegetation in the ecosystem and play a critical role in accumulating about one-third of global terrestrial carbon in biomass [2,5,6]. Aboveground biomass (AGB) is an important manifestation of the productivity of the Gobi Desert ecosystem because of their close relationships [7,8]. The shrub communities in Gobi Desert are highly resistant to drought, cold, water erosion, wind erosion and infertility, etc., making them of far-reaching significance to sustainable development and ecological construction of Gobi Desert ecosystem [9,10]. In desert shrub communities, estimation of AGB accurately and efficiently is of great scientific importance for monitoring and assessing vegetation growth and degradation, as well as for ensuring sustainability, conservation and development [11]. It is important to work out a methodology to find situation and identify size of shrubs in the Gobi Desert for a Gobi Desert habitat restoration because a considerable number of bushes were destroyed by people or by overgrazing animals in recent years.
However, in shrub-dominated desert ecosystems, modeling estimates of AGB has gained less attention than in other ecosystems such as forests. The accurate characterization of low-stature vegetation is challenging [12], especially in the Gobi Desert ecosystem. A large part of northwest China is covered by the Gobi Desert. The landscapes of the Gobi Desert consist of mostly open terrain and are covered with gravel in arid to extremely arid climates. It endures strong wind erosion and physical weathering [13,14]. The Gobi Desert is one of the harshest natural environments on earth, even among desert ecosystems. The plant community inhabiting the Gobi Desert is unique as the plants have adapted to the harsh conditions through natural selection. These plant species are invaluable genetic resources. There are largely xerotic or extremely xerophytic shrubs and semi-shrubs prevalent in the Gobi Desert. These plants are mostly withered, rarely green and have small canopies. The total vegetation cover in most areas is less than 10%. Consequently, an efficient method for estimating shrub AGB in Gobi Desert ecosystems are relatively poorly developed.
Ground measurements or satellite remote sensing data are the traditional methods for observing AGB. Even though ground measurement provides accurate AGB estimates [15], it can damage vegetation and is unreliable in estimating AGB at the regional level [15,16]. Remote sensing methods are also challenging in this environment since the shrub-dominated vegetation is generally low-stature, indistinct spectrally and spatially heterogeneous at fine scales [2,5,17]. The vegetation of Gobi Desert shrubs is sparse, and the crown size of a single shrub is mainly tens of centimeters, and the highest spatial resolution of satellite images is 1–3 m pixels [18]. Therefore, satellite images are not enough to provide sufficient spatial resolution to identify the characteristics of Gobi Desert shrubs community. The introduction of unmanned aerial vehicles (UAVs) has met the need for high spatiotemporal resolution and centimeter-level spatial resolution during an expansion of satellite remote sensing data and ground measurements on a landscape scale [19,20,21]. In addition, UAV is capable of collecting data at high resolution concerning spectral and structural properties of low-stature vegetation at fine scales [22,23,24,25].
Moreover, UAVs offer a promising solution to sparse vegetation surveys [26,27] as their images allow us to identify vegetation from soil background characteristics efficiently with a high spatial resolution [28,29] and can be used to extract vegetation characteristics accurately within sample plots in the Gobi Desert. Additionally, UAVs offer advantages such as affordable operation for plot sizes commonly found in such sites, as well as the ability to plan flight missions in a flexible manner. Furthermore, cloud cover causes little to no distortion of UAVs images, so UAVs are an invaluable tool for studying ecological processes [30]. UAVs can be used to detect the AGB of vegetation in two main distinct ways. The first uses vegetation indices (VI), texture and other image features to identify the structure [31]. The second utilizes three-dimensional (3D) point clouds to determine the structural characteristics of the vegetation [32]. With the increased use of UAVs, VIs derived from low-cost UAV imagery achieved a good estimation of AGB. The VI method detects farmland, grassland and sandy land biomass well [33,34]. The AGB of desert shrubs has a good correlation with the canopy [35], and branches from new and old shrubs differ significantly in color. Thus, the canopy morphology of shrubs can be used as an indicator to quantify AGB. Indeed, UAVs commonly use the RGB VI method to detect vegetation coverage because it is the simplest and most reliable [36].
Research on plant resources has increased in the Gobi Desert in recent years. Recently published studies have focused on plant community composition [37,38], flora characteristics [39,40,41], diversity, the relationship between biodiversity and external natural environmental factors [42,43], disturbances, such as grazing and socio-economic activities, impact on vegetation distribution and protection [44], impact of climate change on vegetation productivity and coverage [45], and the relationship between desertification and vegetation growth [44,46]. However, all of these studies use ground surveys data to estimate AGB, with few studies having estimated AGB of vegetation using UAVs data in the Gobi Desert. The vegetation in the Gobi Desert varies with altitude. Investigating the AGB of vegetation along altitudinal gradients utilizing UAVs technology might help us better understand the Gobi Desert’s features and functions, as well as guide local biodiversity conservation and water and soil conservation initiatives. The aim of this research is to quantify AGB for Gobi Desert shrubs promptly based on RGB images of a UAV.

2. Materials and Methods

2.1. Experimental Field

The field sites is located in the southern foot of the Tianshan Mountains in Bugur County, Bayingol Mongolian Autonomous Prefecture, Xinjiang Uygur Autonomous Region, China (41°05′–42°32′ N, 83°38′–85°25′ E). It is part of the Gobi Desert, has an altitude range of 1050–1350 m, and a total area of around 172.48 km2 (Figure 1). The average annual temperature is 11.8 °C. The average annual precipitation is 47.4 mm. Due to the arid climate in the Gobi Desert, only shrubs can survive due to their strong drought resistance ability. Therefore, the vegetation coverage in the study area is low. The most common shrubs in the study area are Gymnocarpos przewalskii (G. przewalskii), Ephedra przewalskii (E. przewalskii), Salsola laricifolia (S. laricifolia) and Reaumuria songarica (R. songarica). Among these shrubs, G. przewalskii, is a subshrub. The older branches of this shrub are gray, while the young branches are red ochre, slender and soft, with enlarged nodes. E. przewalskii, a small shrub. The woody stems of this shrub are obvious, with the upper part being more branched, forming a pseudo-whirl shape, and the tip of the branchlet often bent or curled. S. laricifolia is another small shrub. Its young shoots are milky white, while the old shoots are dark brown or brown. R. songarica is another small shrub in the study area. Its new branches are pale red, while its old branches are grayish brown or light brown. All these shrubs are excellent sand-fixing plants. Their strong resistance to drought, wind and water erosion means they play a significant role in water and soil conservation in the Gobi Desert [47].

2.2. Field Sampling Scheme Design

In this study, three sample lines were designed, and a total of 66 sample plots were set up with an altitude difference of 50 m on each sample line (Figure 1). The area of each sample plot was designed to be 30 × 30 m. All plants in the sample plots were investigated, including plant species, plant heights, and crown widths during the vigorous vegetation growth season from July to August in 2018–2020. At the same time, the geomorphology of the sampled land was determined. We also precisely documented the longitude and latitude of the sample plots’ centers for later images coordinate positioning. The study area’s elevation varied from 1050 to 1350 m. In order to have a better understanding of the spatial distribution pattern of plant species in the Gobi Desert, the alluvial fan was split into three zones according to altitude: the top of the alluvial fan (more than 1250 m), middle of the alluvial fan (1150–1250 m) and bottom of the alluvial fan (less than 1150 m) [48].
In this study, the DJI Inspire 1 RAW UAV (SZ DJI Technology Co., Shenzhen, China), which has an anti-shake platform, fitted with a 16-million-pixel camera and a four-rotor flight system, and can resist a 10 m/s wind speed, was used for RGB image collection under clear sky conditions. The UAV flew at a height of 60 m above the sample plots and shot them vertically, and the area was approximately 30 × 30 m. The flight path was configured with 70% side and 75% forward overlap. This was to ensure the maximum number of matching loci while reducing data redundancy. An ortho-mosaic image was created using the imagery and the POS (position and orientation system) data. During the flight, UAV’s visible-light camera took pictures automatically every two seconds at a speed of 19.8 m/s. Excessive wind speed affected the imaged shrub assembly and cloud cover impacted the color consistency of the image mosaic. During each flight, we accurately recorded the latitude and longitude of the four corners and the center of the sample plot for subsequent UAV image coordinate positioning.

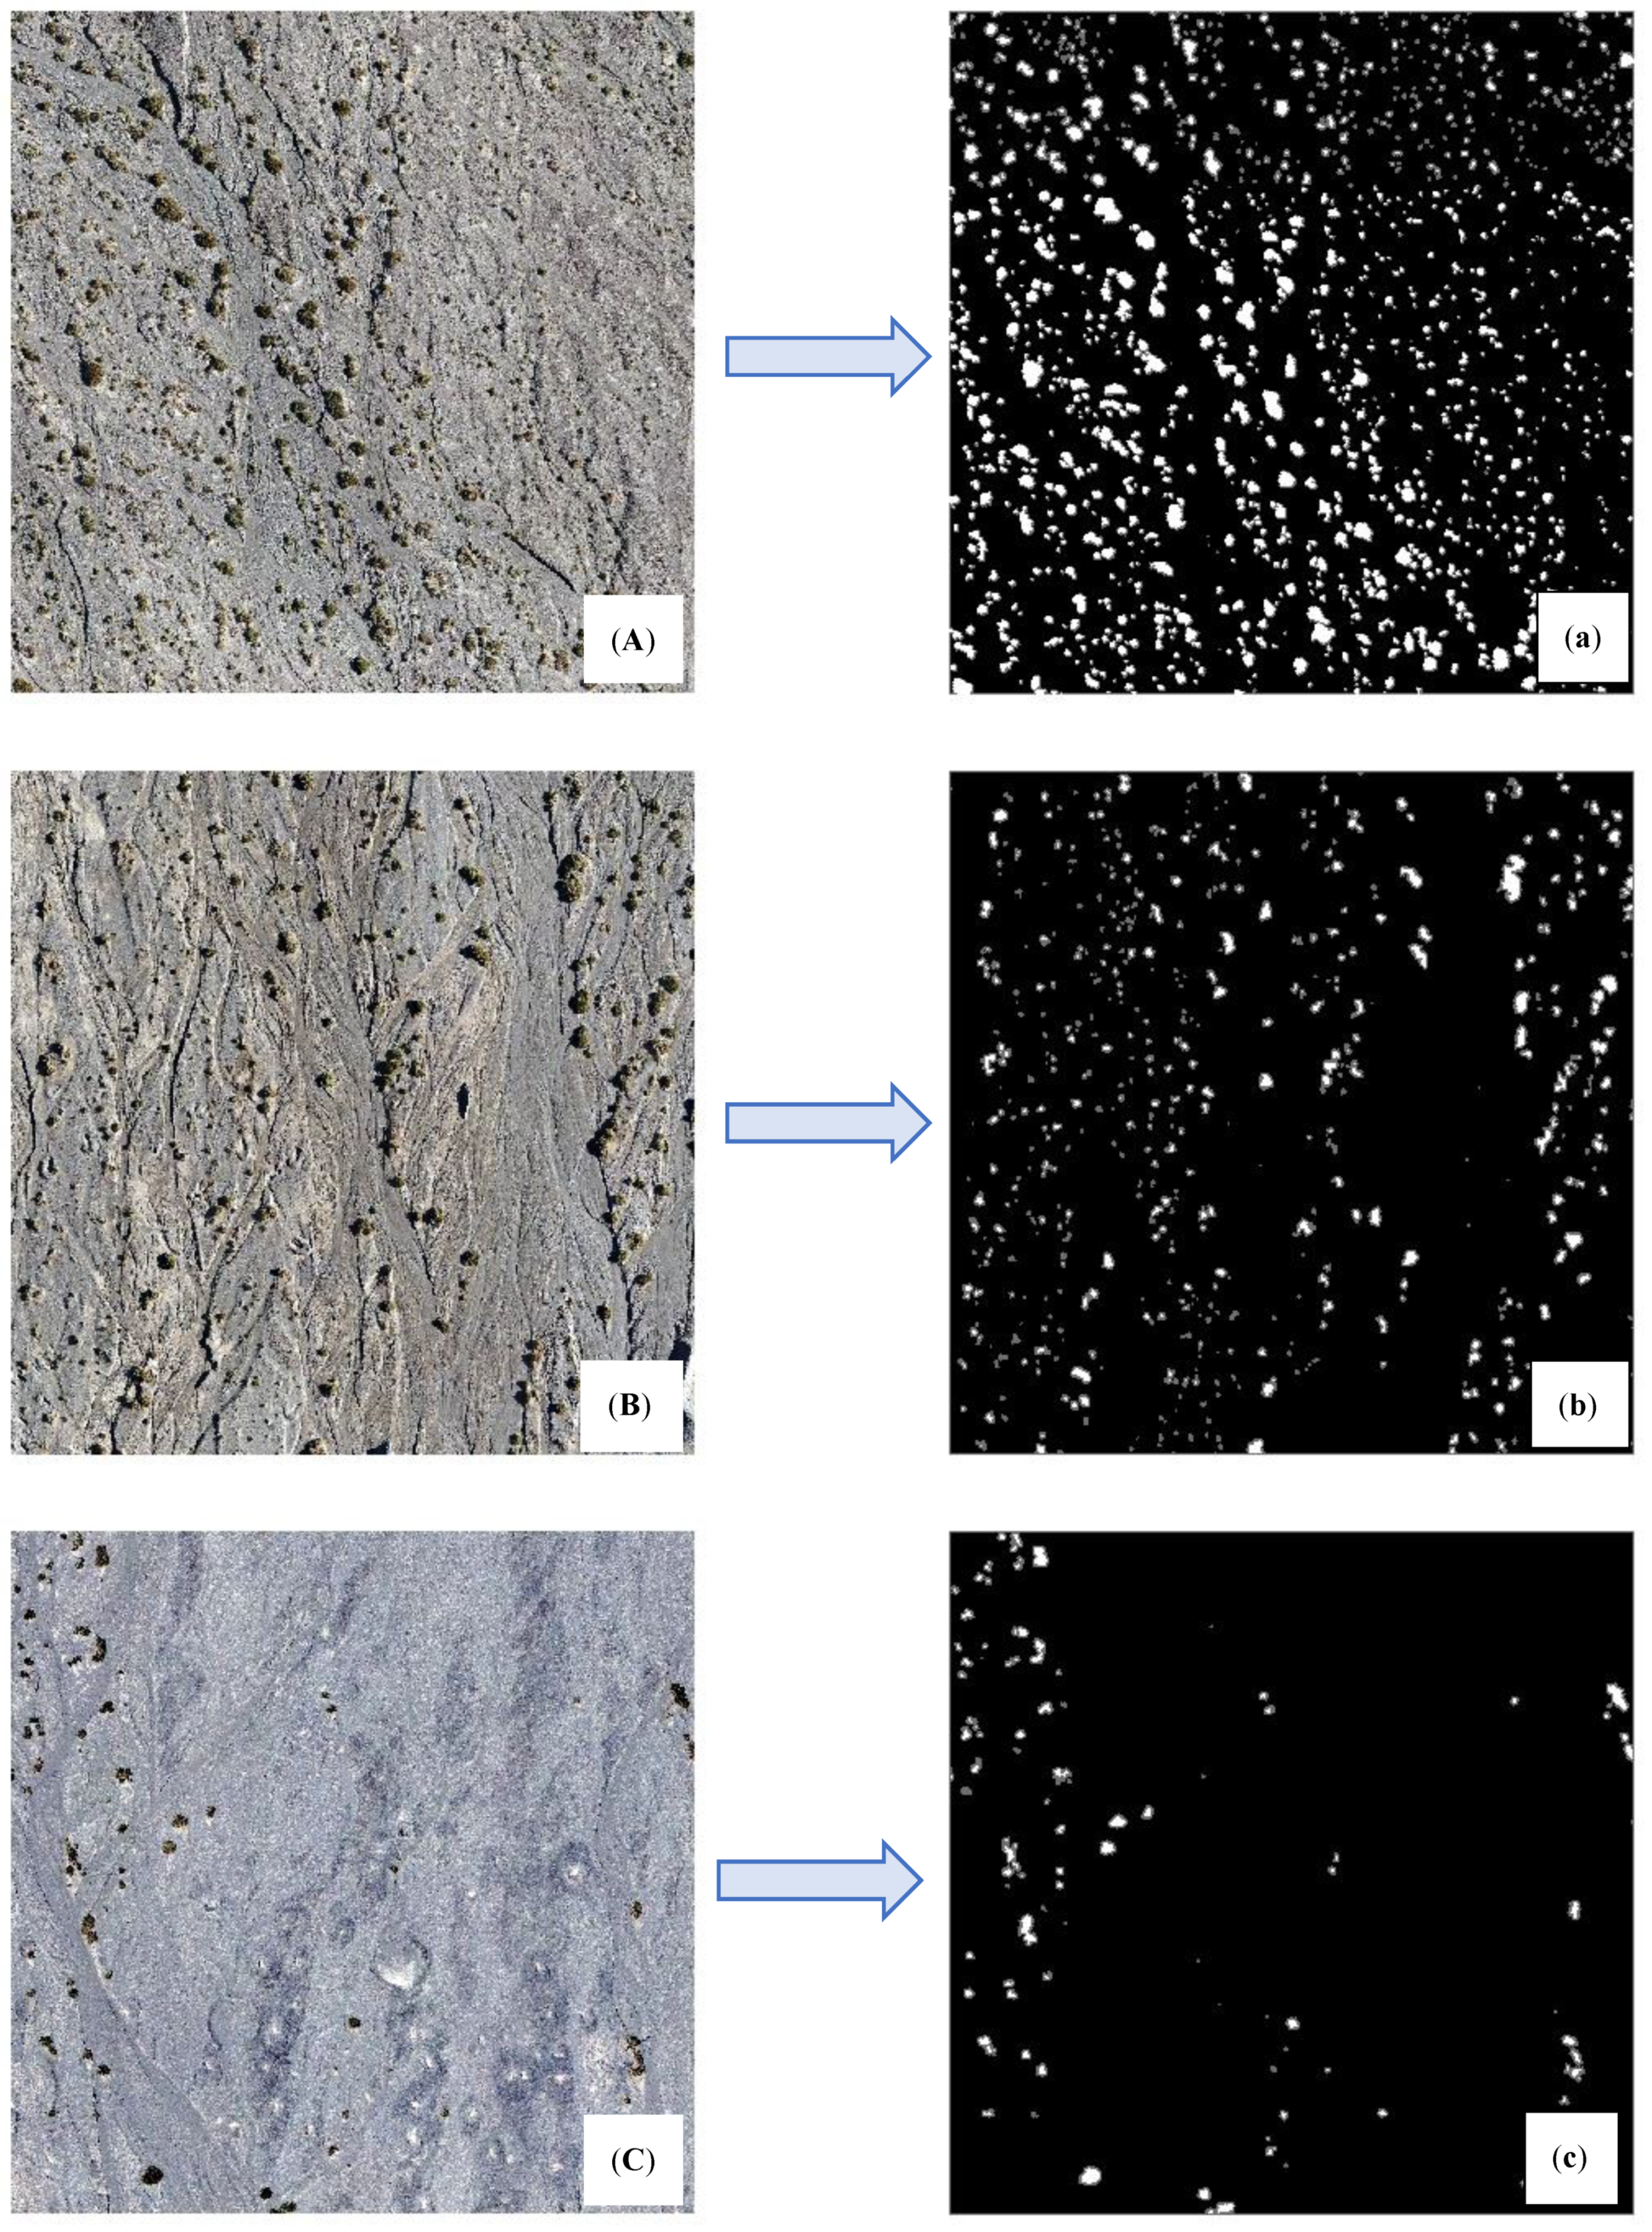
2.3. Vegetation Coverage Extraction Based on the UAV RGB Image

2.3.1. Image Preprocessing

In this study, Agisoft PhotoScan Professional version 1.3.2 (Agisoft LLC, St. Petersburg, Russia) software was used for UAV image preprocessing. Using the structure from motion (SfM) algorithm, this software finds features in multiple images and generates 3D models and ortho-mosaics by superimposing them on top of one another [49]. The workflow we used in PhotoScan for processing RGB images to generate photogrammetric point clouds, as well as georeferenced ortho-mosaics: (1) Filtering out low-quality photographs involved examining each set of photographs and deleting any photographs which were extremely blurry or had exceptionally different illumination. (2) By using the Align Photos tool, we were able to find common points among images and generate a sparse point cloud, which we then used the Build Dense Cloud tool to produce a dense point cloud. (3) Each point cloud was georeferenced using the ground-measured GPS coordinates of the five ground control markers, and then, the optimized alignment tool was used to improve the sparse point clouds based on the identified coordinates. (4) A 3D mesh surface was generated using the Build Mesh tool, a texture file was generated using the Build Texture tool, and an ortho-mosaic image was generated using the Build Orthomosaic tool. The image resolution of DJI Inspire 1 RAW UAV was 1.5 cm/pixel. With this software, an orthophoto image of high spatial resolution can be created, which is useful for subsequent processing.

2.3.2. Vegetation Coverage Calculation

High-resolution images are appropriate for object-oriented classification [50]. Object-oriented classification allows us to categorize vegetation, soil, rocks and other background interferents areas on the Digital Orthophoto Map (DOM, with a resolution of 1.5 cm/pixel) which is generated from the UAV RGB images. Prior to extracting the spectrum corresponding to the green canopy, a mask image had to be generated by segmenting the canopy from the soil background. An object-based classification approach, which involved image segmentation (multi-scale segmentation) and classification, was achieved using eCognition Developer software (version 9.0). For the ideal segmentation scale, ESP (estimation of scale parameters) was employed as a segmentation tool [51]. Object-oriented ortho-mosaic image segmentation was carried out in this study using the segmentation scale of 10, the shape factor of 0.7, the compactness factor of 0.5, and the multiresolution segmentation algorithm. Then, classification indicators were created based on the visible spectral indices (Table 1) for each object, and the training samples were further categorized into “Vegetation,” and “Bare land”.
RGB VIs were used to extract the vegetation coverage of UAV orthophoto images. To determine which RGB indices have previously been useful in estimation of shrub AGB from UAV imagery, we reviewed existing studies which have utilized this data source and have selected six RGB indices that have proven effective in this application (Table 1). The Kappa coefficient was used to measure the accuracy of extracting vegetation from six RGB indices. Additionally, we determined that a threshold should be set to separate vegetation data from other data. In order to determine vegetation coverage using RGB VIs, it is crucial to choose the appropriate threshold value to differentiate vegetation from bare land. Following were the threshold values for the six VIs: the threshold value for excess green index (EXG) was 0.02, for excess green minus excess red index (EXGR) was −0.12, for green blue ratio index (GBRI) was 1.5, for green leaf Index (GLI) was 0.02, for red, green and blue vegetation index (RGBVI) was 0.08, and for vegetative index (VEG) was 1.02. The extraction results of shrub vegetation coverage in the Gobi Desert were tested using 66 field-measured vegetation coverage results.

2.4. Calculation of Shrub AGB

2.4.1. Method of Obtaining Shrub AGB

The harvest method was used to obtain the AGB of a single shrub. To calculate AGB of Gobi Desert shrub, a total of 36 plants of S. laricifolia, 33 plants of E. przewalskii, 24 plants of R. songarica, 23 plants of G. przewalskii, 14 plants of Zygophyllum xanthoxylon and 13 plants of Anabasis brevifolia were harvested. Moreover, their crown widths were measured directly in the field. Crown area was considered to be a predictor of AGB of shrub because of accurate results from previous studies of estimating AGB of shrub [58,59]. The crown area (ca, m2) is defined as the area of the vertical projection of the crown to a horizontal plane [60] and is calculated as:
c a   ( crown   area ) = c w n s   ( crown   width   north south ) × c w e w   ( crown   width   east west ) × π 40,000
In the formula, cwns is crown width in the north–south direction in units cm, and cwew is crown width in the east–west direction in units cm. The AGB of single plants were obtained by constant temperature drying method in the laboratory. The regression relationship between AGB of a single plant and crown area and statistical analysis of significance were determined using SPSS version 22 (IBM, Armonk, NY, USA). Linear, power, exponent, quadratic, cubic and logarithmic regression models were used for the regression models. 80% of the data were used to establish the regression models of shrubs and 20% were used to verify the model.

2.4.2. Calculation AGB of Vegetation in Sample Plots

The shrub crown areas in the sample plots were calculated by formula, and then the AGB of all shrubs were calculated using the crown area-AGB model of a single shrub.

3. Results

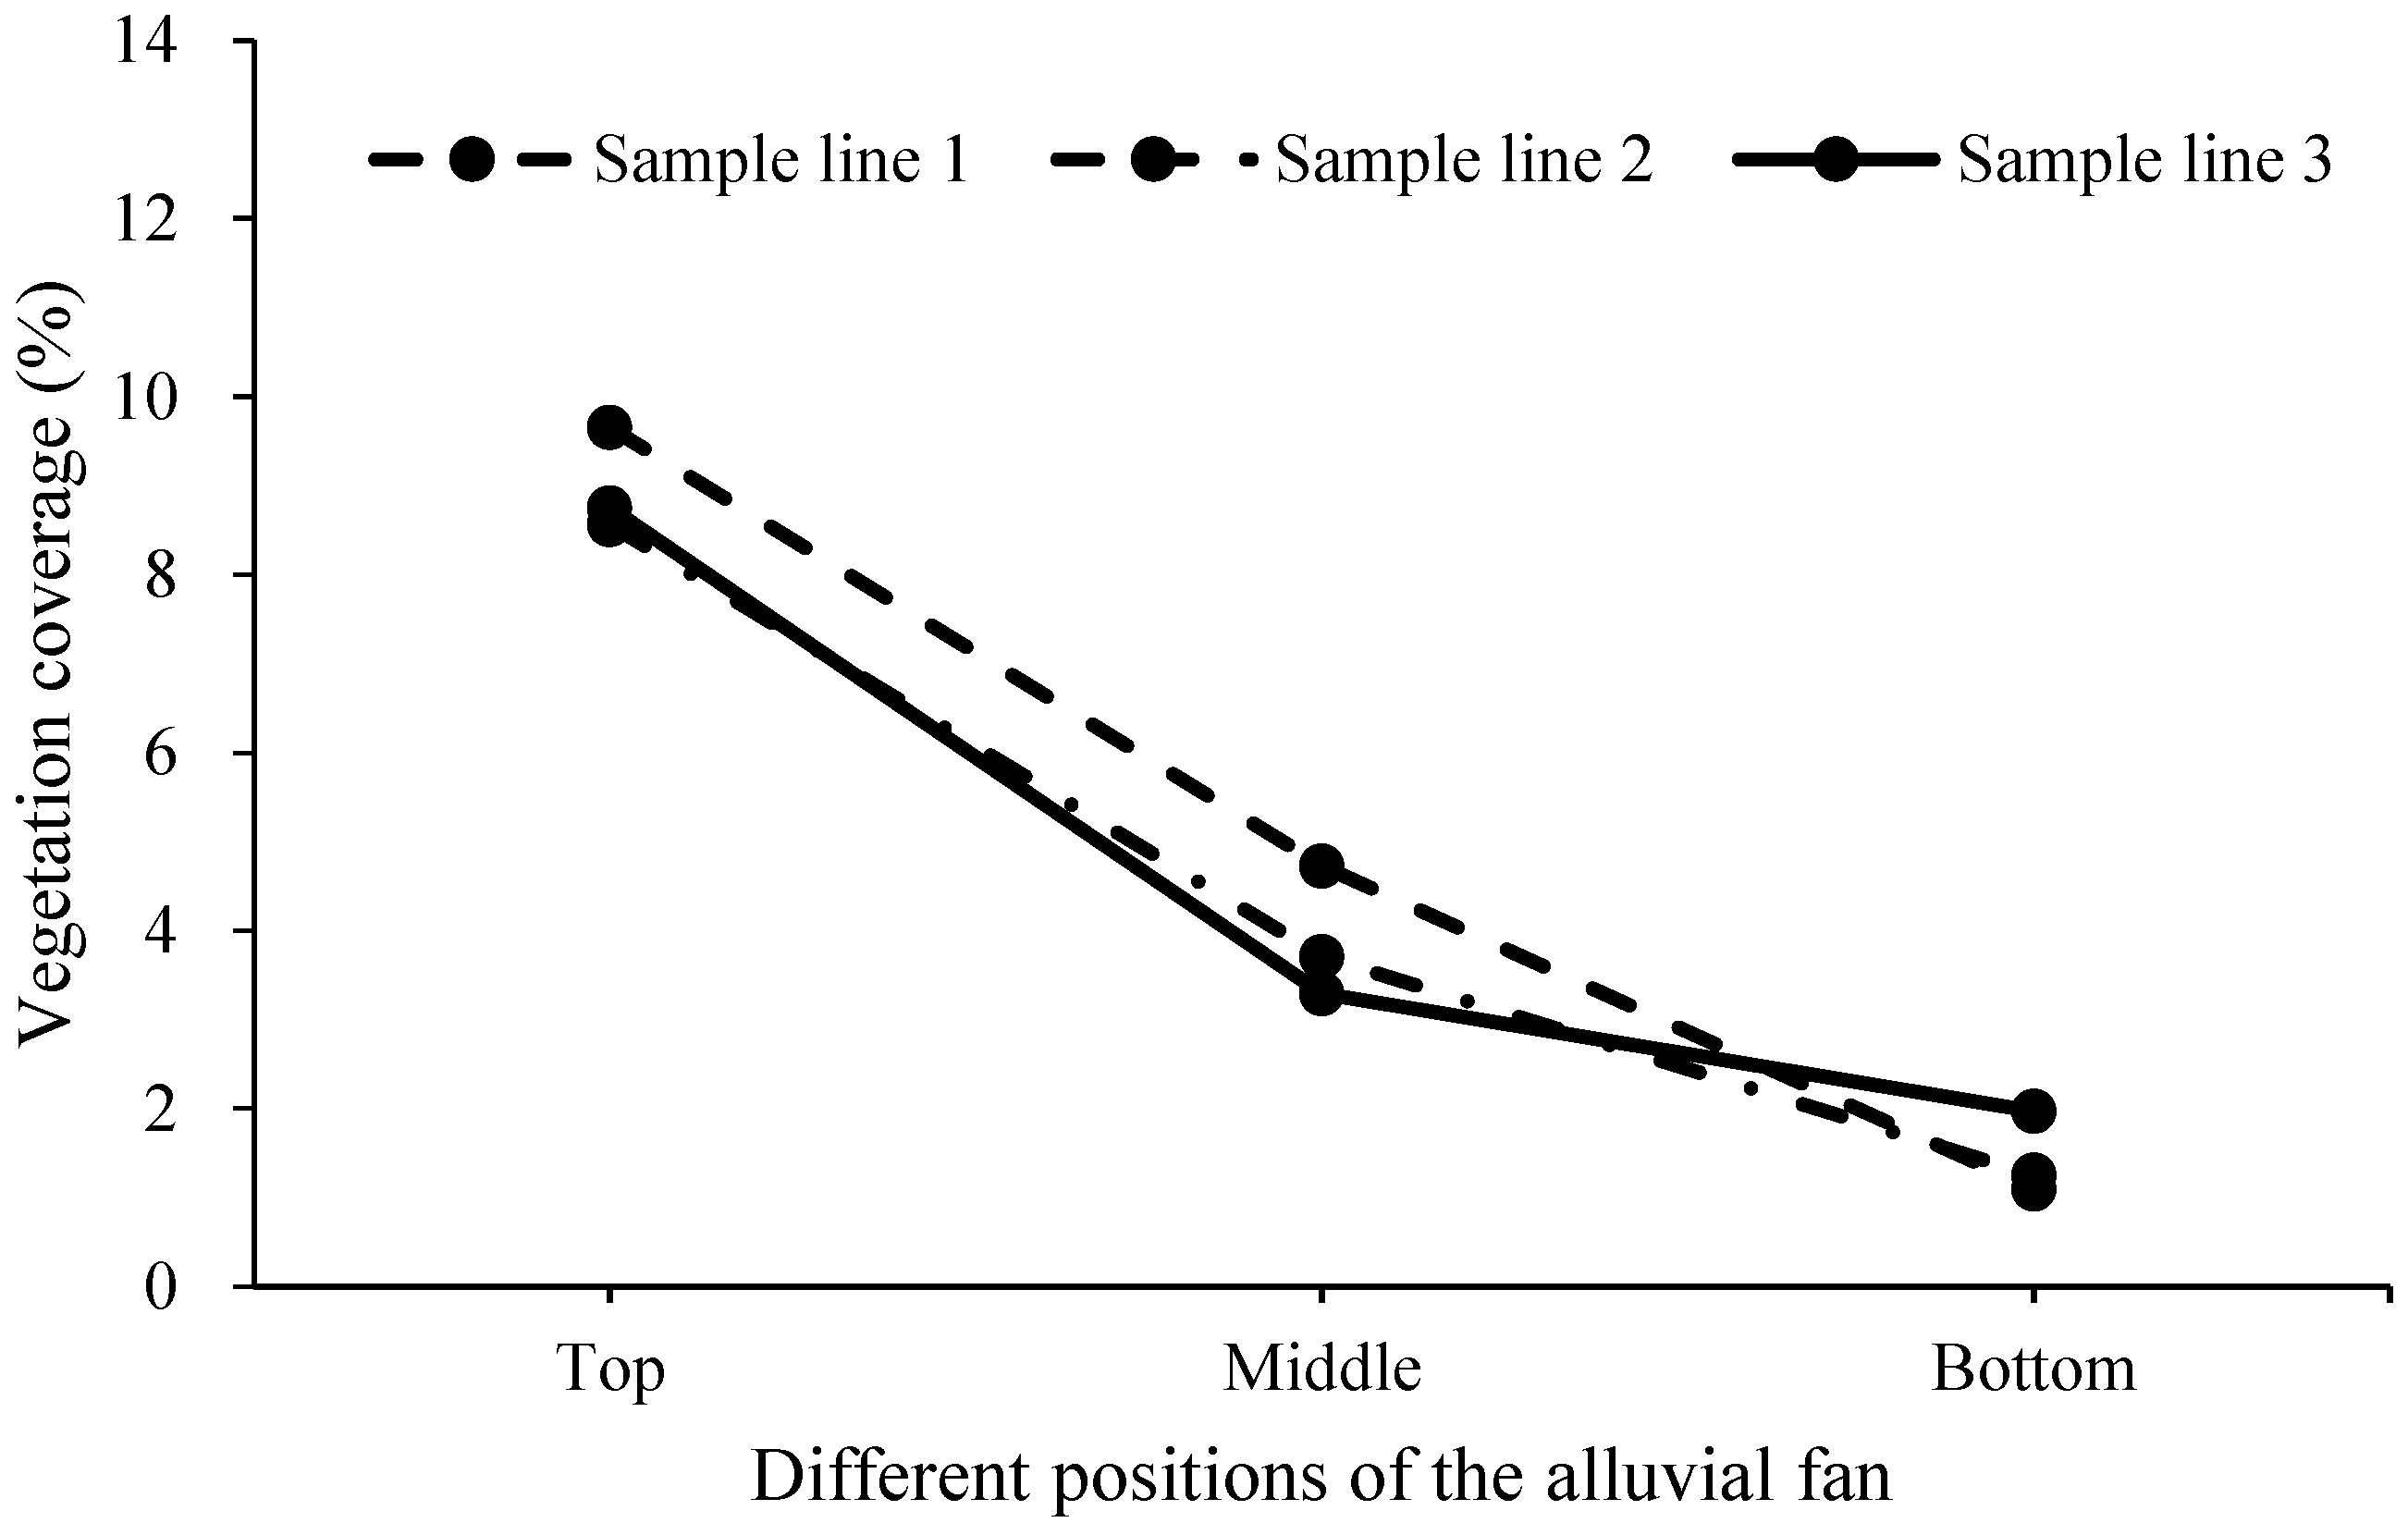
3.1. Vegetation Coverage Extraction Results Based on the UAV RGB Image

The classification results of this study using EXG, EXGR, GBRI, GLI, RGBVI and VEG algorithms for the extraction of shrub crown areas from UAV images are illustrated in Figure 2. Among them, the EXG algorithm performed best for estimating shrub crown areas with an overall accuracy of 0.97 and Kappa coefficient of 0.94 (Table 2). The results after ortho-mosaic image classification are illustrated in Figure 3, where the vegetation crown areas are white, the non-vegetation areas are black. The results of the MAE and RMSE using the 66 field-measured vegetation coverage results for testing the extracted vegetation of the Gobi Desert shrubs are as follows: MAEtop = 0.028, RMSEtop = 0.039, MAEmiddle = 0.016, RMSEmiddle = 0.019, MAEbottom = 0.011, RMSEbottom = 0.015. The values of MAE and MSE indicated that vegetation coverage can be extracted using VIs based on UAV RGB images. Figure 4 shows that the coverage difference at the same position of the alluvial fan is 0.87–1.44%. As the elevation gradient of alluvial fans decreased, the vegetation coverage gradually decreased.

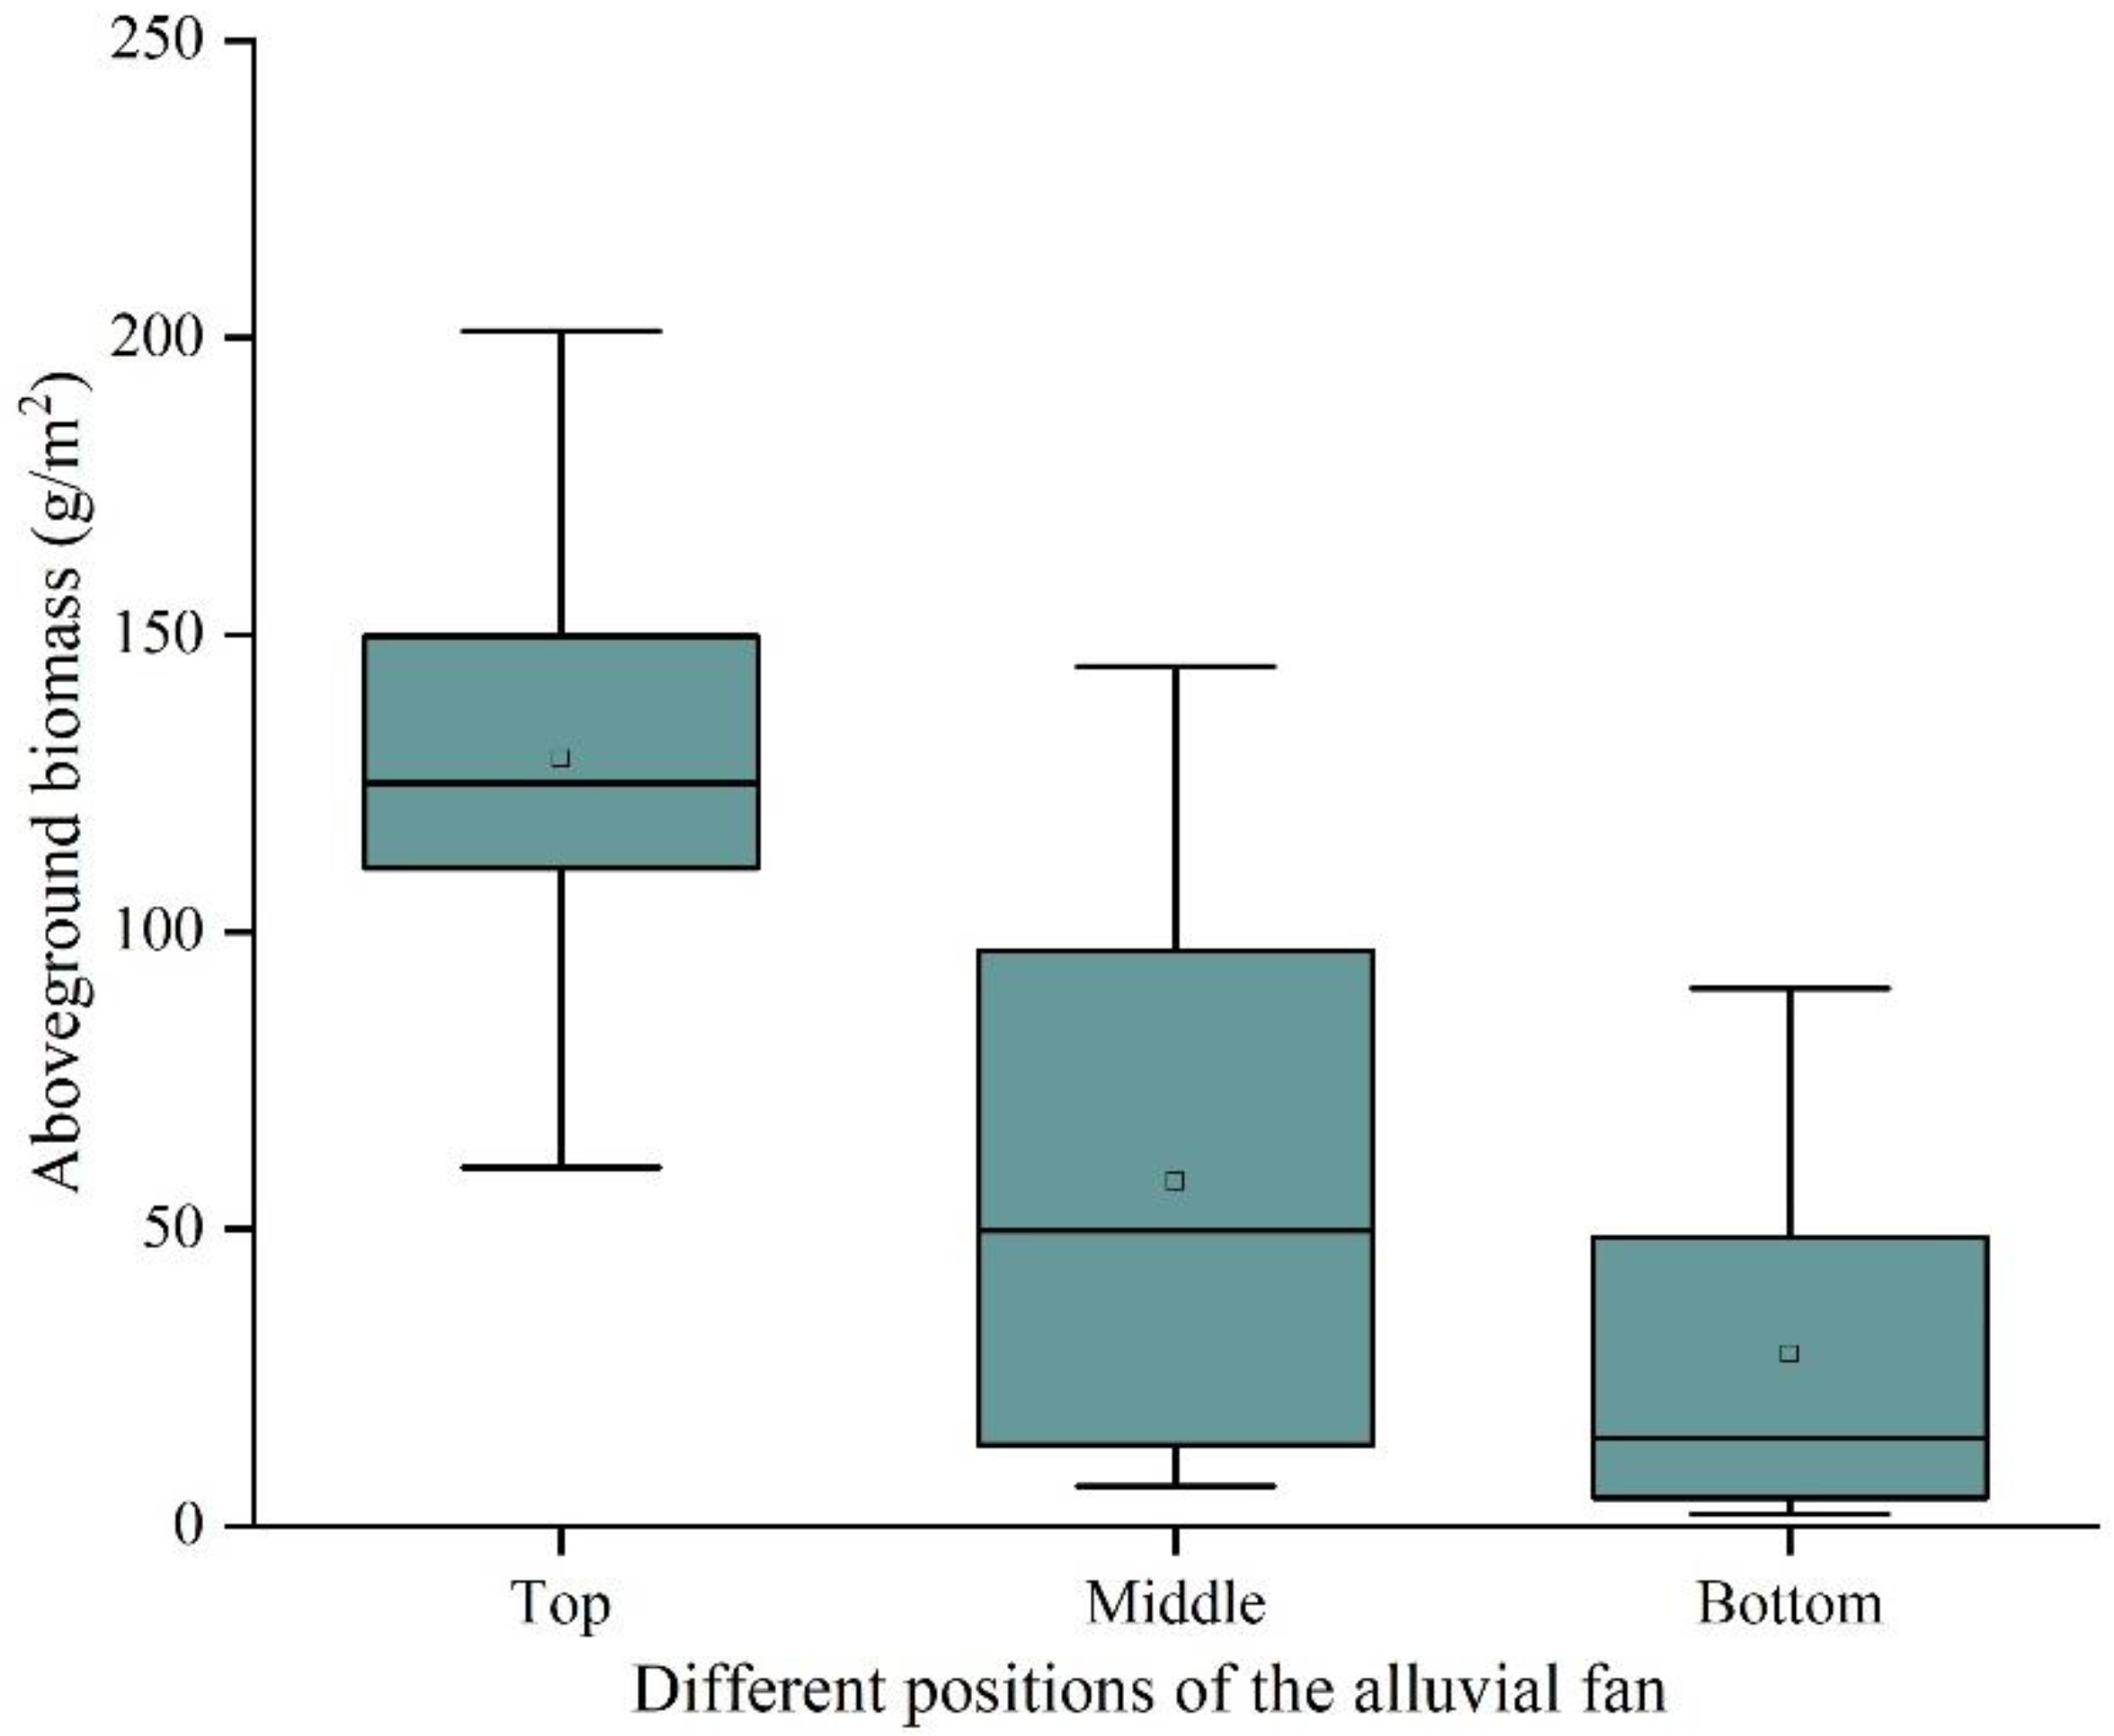
3.2. The AGB Results and Distribution of Gobi Desert Shrubs Based on Ground Survey Data

The AGB of each plant in the sample plots was obtained based on the model of the crown area and the AGB of a single plant. The goodness-of-fit measures of several allometric models were evaluated for trends. Based on the regression models (e.g., power, exponent, quadratic, cubic, linear and logarithm), the assessment of the relationships among AGB and crown area models of shrubs is shown in Table 3 and Figure 5. We observed a power model for the AGB and shrub crown areas (Table 3), because the power model had the highest R2 value. According to the results of model validation, the total relative error (RE) was 8.60% and mean relative error absolute value (RMA) was 34.04%. The values of RE and RMA demonstrated that the regression fitting accuracy of the shrub AGB and the crown area model met the calculation requirements.
The AGBs of the sample plots were calculated and categorized based on their position at the alluvial fan (Figure 6). As the altitude decreased, AGB decreased from 201 to 2 g/m2. The AGBs of sample plots at the top of the alluvial fan ranged from 60–201 g/m2, at the middle of the alluvial fan from 7–145 g/m2, and at the bottom of the alluvial fan from 2–90 g/m2. It was obvious from the maximum and minimum values and distribution (Figure 6), that with a decrease in altitude, the fluctuation range of AGB tended to decrease. The fluctuation falls from 141 g/m2 at the top of the alluvial fan to 88 g/m2 at the bottom.

3.3. The Relationship between Vegetation Coverage and AGB of Gobi Desert Shrubs in Sample Plots

The AGBs of all sample plots were obtained based on the vegetation coverage of the sample plots and the AGB modeling of single plants. Power, cubic, quadratic, linear, logarithmic and exponential functions were applied to fit the regression model between vegetation coverage and AGB. The model fitting degree, F-test, significance, mean absolute error (MAE) and root mean square error (RMSE) are shown in Table 4. The fitting curves of each model are shown in Figure 7. Vegetation coverage and AGB had the best regression fitting relationship with the power function (the fitting equation is Y = 1167.341 x0.946). The optimal fitting model is indicated by the red line.

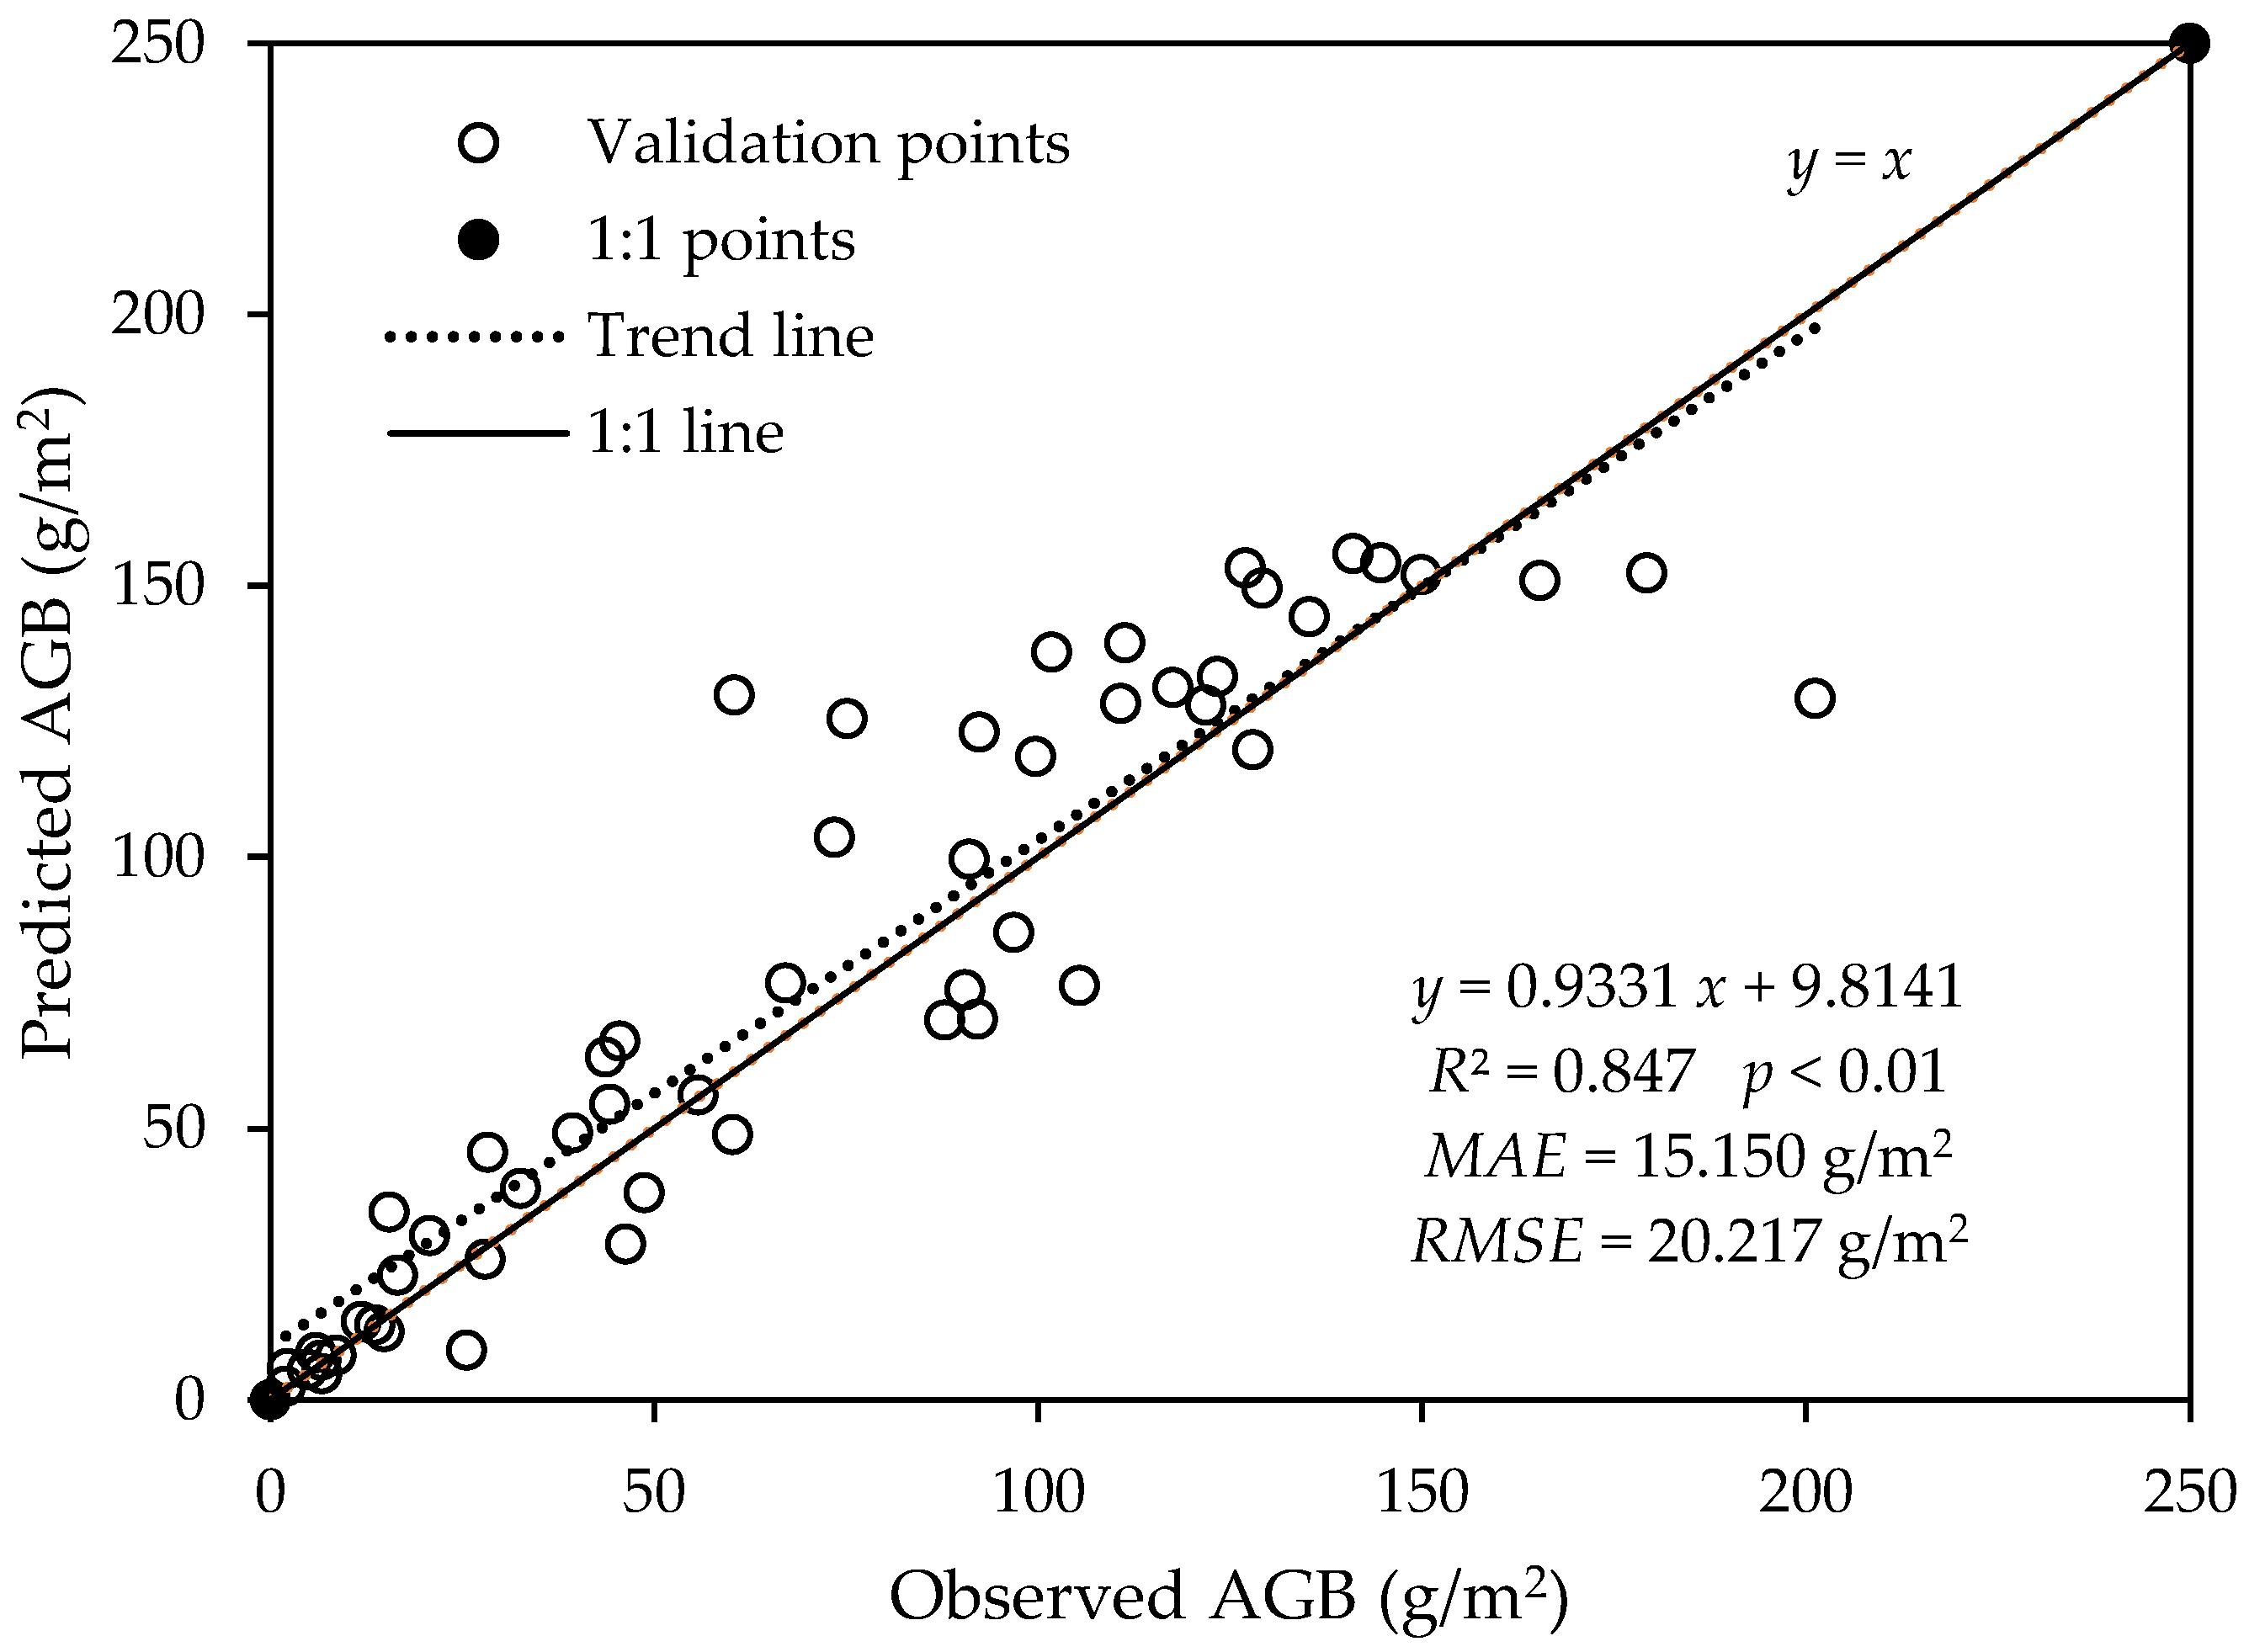
3.4. The AGB Results of Gobi Desert Shrubs Using UAV RGB Images Based on Power Model

The predicted AGBs of shrubs communities were calculated and categorized using UAV RGB Images based on power model at the Gobi Desert alluvial fan (Figure 8). As the altitude decreased, AGB decreased gradually. At the top, middle and bottom of the alluvial fan, the mean AGB values were 115 g/m2, 62 g/m2, and 36 g/m2, respectively. The comparison between observed and UAV predicted AGB values based on 66 sample plots with all statistics showed that the observed AGB and predicted AGB were positively correlated at a highly significant level (p < 0.01) with a coefficient of determination R2 of 0.847 (Figure 9). The predicted AGB values were closer to the actual observed AGB values.

4. Discussion

This study extracted vegetation coverage with an accuracy of over 90%, which was similar to the results of Riihimäki, Zhang and Mao et al. [21,28,61]. In general, as an alternative to conventional field surveys, the RGB VIs can be employed for calculating vegetation coverage. This enables efficient estimation of vegetation coverage at a wider spatial scale in the Gobi Desert region than ground-based measurements and at a higher resolution than satellite remote sensing imagery.
We used the biomass equation method to estimate the AGB of the shrub community [62]. The biomass equation method uses the allometric growth law of shrubs to establish the allometric growth equation of the biomass by measuring the relevant factors (crown width, etc.) and the biomass of the shrubs [63]. For shrubs in the Gobi Desert, plant crown diameter is the easiest indicator to be determined, and there is a correlation between crown area and AGB. Therefore, we used the crown areas of single plants to fit the AGB and to calculate the AGB of the shrub community. The results showed that the AGB of a single shrub has a power function relationship with the crown area, which is the same as the results of Guo (2021) [34]. Therefore, a power function model was used to estimate the AGB of each shrub plant in the shrub community. The sum of the AGBs of all shrub plants was the AGB of the shrub community.
Accurately estimating AGB at the landscape scale in the Gobi Desert is challenging. However, the development of UAVs provides the possibility for the rapid estimation of vegetation AGB. The spatial resolution of the UAV RGB image in this study was 1.5 cm/pixel, which meant that each individual bush contained many pixels and was rich in spectral characteristics. RGB VIs may be sensitive to the biophysical characteristics of vegetation [25,64]. When using UAV images to estimate vegetation biomass, some researchers have found that RGB VIs can be applied to quantify shrub AGB estimation [56,65,66].
We found that there is a good correlation between the AGB of shrubs and vegetation coverage in the Gobi Desert area dominated by shrubs with a low height (<1 m). The best-fitting model was the power function model, which is consistent with the research results of Guo (2021) [34] and Li (2021) [35]. The simple regression model can express the relationship between the predictor variable (vegetation AGB) and the dependent variable (vegetation coverage) in a single equation and can reflect some biological and physical meanings. Some researchers have found that UAV data can be used to estimate vegetation biomass with the same or higher accuracy through a regression model [54,67]. For large-scale vegetation monitoring, our power regression model developed based on UAV data represents a direct and biologically understandable method for AGB modeling. Our research also shows the regression relationship between vegetation coverage and vegetation AGB extracted from UAV images in the Gobi Desert to estimate the accuracy of vegetation AGB. The maximum R2 value obtained by this method is 0.897, while the best interpretation of vegetation AGB estimated by other related studies using similar methods is lower than this value [33,34,68]. We successfully employed crown area-AGB model to estimate the AGB of shrubs in Gobi Desert and performed better than PLS, MLR, SVM, RF and ANN [66,69]. The predicted AGB results of Gobi Desert shrubs using UAV RGB images based on power model were closer to the actual observed AGB results based on field surveys. These results show that the simple regression model we constructed can be used to accurately predict the vegetation biomass in the Gobi Desert. The vegetation AGB detection method constructed is relatively accurate and inexpensive in this study. It is useful for vegetation AGB surveys in areas with simple vegetation types, such as the Gobi Desert, and provides an effective method for the rapid monitoring of large-scale vegetation AGB.

5. Conclusions

With the help of low-cost and high-resolution UAV RGB images, we developed an approach for estimating the AGB of shrub communities in the Gobi Desert with visible VIs. The main conclusions are as follows: As the elevation gradient of the alluvial fan decreased, the vegetation coverage and AGB of shrub gradually decreased. The relationship between vegetation coverage and AGB conformed to the power model Y = 1167.341 x0.946, where Y is the AGB of the sample plots scale in units g/m2, and x is the vegetation coverage obtained from the visible VIs. The predicted AGB values of shrubs using UAV RGB images based on power model were closer to the actual observed AGB values. The AGB estimation results showed that in regions where the composition of the vegetation was simple, a method that combined the single shrub biomass model with object-based image operations to extract the crown area of shrubs had good potential for estimating the AGB of shrub communities. This could provide a basis for restoring habitats in the Gobi Desert. In this study, we only used vegetation coverage to estimate vegetation AGB without considering the community types. Therefore, future research could increase the number of study sites and sample plots of different community types at different positions of the alluvial fan, to further verify the feasibility of UAV to inverse vegetation coverage and AGB of Gobi Desert at a quadrat scale.

Author Contributions

J.D., Y.F., P.Z., Z.L. and H.Z. conceived, designed and performed the experiments; J.D. processed and analyzed the data and wrote the paper. Y.F. and X.C. reviewed this study. All authors have made significant contributions to this research. All authors have read and agreed to the published version of the manuscript.

Funding

This research was funded by the Third Xinjiang Scientific Expedition and Research Program, grant number 2021xjkk0304; Additionally, Research on the Temporal and Spatial Heterogeneity Pattern and Mechanism of Desert Vegetation Based on Functional Vegetation Index, grant number 41971398.

Data Availability Statement

The datasets used and/or analyzed during the current study are available from the corresponding author upon reasonable request.

Acknowledgments

We thank Director Guan Wenke of Xinjiang Academy of Forestry Sciences for his support of Gobi Desert field experiments. We also thank the editor and anonymous reviewers for their thoughtful reviews and constructive comments.

Conflicts of Interest

The authors declare no conflict of interest.

References

  1. Arnon, A.I.; Ungar, E.D.; Svoray, T.; Shachak, M.; Blankman, J.; Perevolotsky, A. The application of remote sensing to study shrub—herbaceous relations at a high spatial resolution. Isr. J. Plant Sci. 2007, 55, 73–82. [Google Scholar] [CrossRef] [Green Version]
  2. Zandler, H.; Brenning, A.; Samimi, C. Quantifying dwarf shrub biomass in an arid environment: Comparing empirical methods in a high dimensional setting. Remote Sens. Environ. 2015, 158, 140–155. [Google Scholar] [CrossRef]
  3. Van Oijen, M.; Bellocchi, G.; Höglind, M. Effects of climate change on grassland biodiversity and productivity: The need for a diversity of models. Agronomy 2018, 8, 14. [Google Scholar] [CrossRef] [Green Version]
  4. Zhang, H.; Sun, Y.; Chang, L.; Qin, Y.; Chen, J.; Qin, Y.; Du, J.; Yi, S.; Wang, Y. Estimation of grassland canopy height and aboveground biomass at the quadrat scale using unmanned aerial vehicle. Remote Sens. 2018, 10, 851. [Google Scholar] [CrossRef] [Green Version]
  5. Wang, Z.; Bastin, G.N.; Liu, L.; Caccetta, P.A.; Peng, D. Estimating woody above-ground biomass in an arid zone of central Australia using Landsat imagery. J. Appl. Remote Sens. 2015, 9, 096036. [Google Scholar] [CrossRef]
  6. Adhikari, A.; White, J.D. Climate change impacts on regenerating shrubland productivity. Ecol. Model. 2016, 337, 211–220. [Google Scholar] [CrossRef]
  7. Xu, M.; Cao, C.; Tong, Q.; Li, Z.; Zhang, H.; He, Q.; Gao, M.; Zhao, J.; Zheng, S.; Chen, W.; et al. Remote sensing based shrub above-ground biomass and carbon storage mapping in Mu Us desert, China. Sci. China Technol. Sci. 2010, 53, 176–183. [Google Scholar] [CrossRef]
  8. Poulter, B.; Frank, D.; Ciais, P.; Myneni, R.B.; Andela, N.; Bi, J.; Broquet, G.; Canadell, J.G.; Chevallier, F.; Liu, Y.Y.; et al. Contribution of semi-arid ecosystems to interannual variability of the global carbon cycle. Nature 2014, 509, 600–603. [Google Scholar] [CrossRef] [PubMed] [Green Version]
  9. Ryser, P.; Eek, L. Consequences of phenotypic plasticity vs. interspecific differences in leaf and root traits for acquisition of aboveground and belowground resources. Am. J. Bot. 2000, 87, 402–411. [Google Scholar] [CrossRef] [PubMed]
  10. Reid, W.V.; Mooney, H.A.; Cropper, A.; Capistrano, D.; Carpenter, S.R.; Chopra, K.; Dasgupta, P.; Dietz, T.; Duraiappah, A.K.; Hassan, R.; et al. Ecosystems and Human Well-Being-Synthesis: A Report of the Millennium Ecosystem Assessment; Island Press: Washington, DC, USA, 2005; Available online: https://library.wur.nl/WebQuery/wurpubs/340442 (accessed on 4 March 2022).
  11. Xu, B.; Yang, X.C.; Tao, W.G.; Miao, J.M.; Yang, Z.; Liu, H.Q.; Jin, Y.X.; Zhu, X.H.; Qin, Z.H.; Lv, H.Y.; et al. MODIS-based remote-sensing monitoring of the spatiotemporal patterns of China’s grassland vegetation growth. Int. J. Remote Sens. 2013, 34, 3867–3878. [Google Scholar] [CrossRef]
  12. Estornell, J.; Ruiz, L.A.; Velázquez-Martí, B.; Hermosilla, T. Estimation of biomass and volume of shrub vegetation using LiDAR and spectral data in a Mediterranean environment. Biomass Bioenergy 2012, 46, 710–721. [Google Scholar] [CrossRef] [Green Version]
  13. Feng, Y.M.; Wu, B.; Yao, A.D. A study on classification system and inventory of Gobi. Acta Geogr. Sin. 2014, 69, 391–398. [Google Scholar] [CrossRef]
  14. Shen, Y.C.; Wang, X.H.; Cheng, W.M. Integrated physical regionalization of stony deserts in China. Prog. Geogr. 2016, 35, 57–66. [Google Scholar] [CrossRef] [Green Version]
  15. Lu, D. The potential and challenge of remote sensing-based biomass estimation. Int. J. Remote Sens. 2006, 27, 1297–1328. [Google Scholar] [CrossRef]
  16. Boschetti, M.; Bocchi, S.; Brivio, P.A. Assessment of pasture production in the Italian Alps using spectrometric and remote sensing information. Agric. Ecosyst. Environ. 2007, 118, 267–272. [Google Scholar] [CrossRef]
  17. Greaves, H.E.; Vierling, L.A.; Eitel, J.U.; Boelman, N.T.; Magney, T.S.; Prager, C.M.; Griffin, K.L. High-resolution mapping of aboveground shrub biomass in Arctic tundra using airborne lidar and imagery. Remote Sens. Environ. 2016, 184, 361–373. [Google Scholar] [CrossRef]
  18. Guan, Z.; Abd-Elrahman, A.; Fan, Z.; Whitaker, V.M.; Wilkinson, B. Modeling strawberry biomass and leaf area using object-based analysis of high-resolution images. ISPRS J. Photogramm. Remote Sens. 2020, 163, 171–186. [Google Scholar] [CrossRef]
  19. Pádua, L.; Vanko, J.; Hruška, J.; Adão, T.; Sousa, J.J.; Peres, E.; Morais, R. UAS, sensors, and data processing in agroforestry: A review towards practical applications. Int. J. Remote Sens. 2017, 38, 2349–2391. [Google Scholar] [CrossRef]
  20. Manfreda, S.; McCabe, M.F.; Miller, P.E.; Lucas, R.; Pajuelo Madrigal, V.; Mallinis, G.; Ben Dor, E.; Helman, D.; Estes, L.; Ciraolo, G.; et al. On the use of unmanned aerial systems for environmental monitoring. Remote Sens. 2018, 10, 641. [Google Scholar] [CrossRef] [Green Version]
  21. Riihimäki, H.; Luoto, M.; Heiskanen, J. Estimating fractional cover of tundra vegetation at multiple scales using unmanned aerial systems and optical satellite data. Remote Sens. Environ. 2019, 224, 119–132. [Google Scholar] [CrossRef]
  22. Michez, A.; Bauwens, S.; Brostaux, Y.; Hiel, M.P.; Garré, S.; Lejeune, P.; Dumont, B. How far can consumer-grade UAV RGB imagery describe crop production? A 3D and multitemporal modeling approach applied to Zea mays. Remote Sens. 2018, 10, 1798. [Google Scholar] [CrossRef] [Green Version]
  23. Näsi, R.; Viljanen, N.; Kaivosoja, J.; Alhonoja, K.; Hakala, T.; Markelin, L.; Honkavaara, E. Estimating biomass and nitrogen amount of barley and grass using UAV and aircraft based spectral and photogrammetric 3D features. Remote Sens. 2018, 10, 1082. [Google Scholar] [CrossRef] [Green Version]
  24. Alonzo, M.; Andersen, H.E.; Morton, D.C.; Cook, B.D. Quantifying boreal forest structure and composition using UAV structure from motion. Forests 2018, 9, 119. [Google Scholar] [CrossRef] [Green Version]
  25. Cen, H.; Wan, L.; Zhu, J.; Li, Y.; Li, X.; Zhu, Y.; Weng, H.; Wu, W.; Yin, W.; Xu, C.; et al. Dynamic monitoring of biomass of rice under different nitrogen treatments using a lightweight UAV with dual image-frame snapshot cameras. Plant Methods 2019, 15, 32. [Google Scholar] [CrossRef]
  26. Mcneil, B.E.; Pisek, J.; Lepisk, H.; Flamenco, E.A. Measuring leaf angle distribution in broadleaf canopies using UAVs. Agric. For. Meteorol. 2016, 218, 204–208. [Google Scholar] [CrossRef]
  27. Liu, H.; Zhang, J.; Pan, Y.; Shuai, G.; Zhu, X.; Zhu, S. An efficient approach based on UAV orthographic imagery to map paddy with support of field-level canopy height from point cloud data. IEEE J. Sel. Top. Appl. Earth Obs. Remote Sens. 2018, 11, 2034–2046. [Google Scholar] [CrossRef]
  28. Zhang, X.; Zhang, F.; Qi, Y.; Deng, L.; Wang, X.; Yang, S. New research methods for vegetation information extraction based on visible light remote sensing images from an unmanned aerial vehicle (UAV). Int. J. Appl. Earth Obs. Geoinf. 2019, 78, 215–226. [Google Scholar] [CrossRef]
  29. Cunliffe, A.M.; Anderson, K.; Boschetti, F.; Brazier, R.E.; Graham, H.A.; Myers-Smith, I.H.; Astor, T.; Boer, M.M.; Calvo, L.G.; Clark, P.E.; et al. Global application of an unoccupied aerial vehicle photogrammetry protocol for predicting aboveground biomass in non-forest ecosystems. Remote Sens. Ecol. Conserv. 2021, 8, 57–71. [Google Scholar] [CrossRef]
  30. Koh, L.P.; Wich, S.A. Dawn of drone ecology: Low-cost autonomous aerial vehicles for conservation. Trop. Conserv. Sci. 2012, 5, 121–132. [Google Scholar] [CrossRef] [Green Version]
  31. Liu, Y.; Liu, S.; Li, J.; Guo, X.; Wang, S.; Lu, J. Estimating biomass of winter oilseed rape using vegetation indices and texture metrics derived from UAV multispectral images. Comput. Electron. Agric. 2019, 166, 105026. [Google Scholar] [CrossRef]
  32. Picos, J.; Bastos, G.; Míguez, D.; Alonso, L.; Armesto, J. Individual tree detection in a eucalyptus plantation using unmanned aerial vehicle (UAV)-LiDAR. Remote Sens. 2020, 12, 885. [Google Scholar] [CrossRef] [Green Version]
  33. Yue, J.; Yang, G.; Tian, Q.; Feng, H.; Xu, K.; Zhou, C. Estimate of winter-wheat above-ground biomass based on UAV ultrahigh-ground-resolution image textures and vegetation indices. ISPRS J. Photogramm. Remote Sens. 2019, 150, 226–244. [Google Scholar] [CrossRef]
  34. Guo, Z.C.; Wang, T.; Liu, S.L.; Kang, W.P.; Chen, X.; Feng, K.; Zhang, X.Q.; Zhi, Y. Biomass and vegetation coverage survey in the Mu Us sandy land-based on unmanned aerial vehicle RGB images. Int. J. Appl. Earth Obs. Geoinf. 2021, 94, 102239. [Google Scholar] [CrossRef]
  35. Li, X.Y.; Yue, P.; Cheng, H. Biomass prediction model for Reaumuria soongorica in the Urat desert steppe in Inner Mongolia. Arid Zone Res. 2021, 37, 462–469. [Google Scholar] [CrossRef]
  36. Rasmussen, J.; Ntakos, G.; Nielsen, J.; Svensgaard, J.; Poulsen, R.N.; Christensen, S. Are vegetation indices derived from consumer-grade cameras mounted on UAVs sufficiently reliable for assessing experimental plots? Eur. J. Agron. 2016, 74, 75–92. [Google Scholar] [CrossRef]
  37. Zhong, Y.; Wang, J.; Zhang, T.; Li, J.; Feng, Y.; Lu, Q. Composition of seed plant species and floristic features in the Gobi area of the northern Qinghai-Tibet plateau of China. Plant Sci. J. 2017, 35, 525–533. [Google Scholar] [CrossRef]
  38. Zhu, Y.J.; Qiao, X.G.; Guo, K.; Xu, R.; Zhao, L.Q. Distribution, community characteristics and classification of Stipa tianschanica var. gobica steppe in China. Chin. J. Plant Ecol. 2018, 42, 785–792. [Google Scholar] [CrossRef] [Green Version]
  39. Li, L.; Jia, X.; Yin, L. Vascular plant range size patterns and the relationship with climate and plant richness in Xinjiang region, China. Sci. Sin. Vitae 2017, 47, 314–324. [Google Scholar] [CrossRef]
  40. Zhang, X.; Zhou, J.; Lai, L.; Jiang, L.; Zheng, Y.; Shi, L. Leaf traits and ecological stoichiometry of dominant desert species across Gobi Desert–oasis ecotone in the lower reaches of Heihe River, China. Chin. J. Appl. Environ. Biol. 2019, 25, 1270–1276. [Google Scholar] [CrossRef]
  41. Dong, X.; Li, Y.; Zhang, Z.; Li, S.; Bao, Y.; Hao, Y.; Yao, B. Niche of dominant shrub species in desert gobi in Jiuquan, Gansu, China. J. Desert Res. 2020, 40, 138–145. [Google Scholar] [CrossRef]
  42. Long, T.; Wang, J.; Li, J.; Feng, Y.; Wu, B.; Lu, Q. Plant diversity and its environmental explanation in gobi district of northern Qinghai-Tibet Plateau, northwestern China. J. Beijing For. Univ. 2017, 39, 17–24. [Google Scholar] [CrossRef]
  43. Zhang, P.; Shao, M.A.; Zhang, X. Spatial pattern of plant species diversity and the influencing factors in a Gobi Desert within the Heihe River Basin, Northwest China. J. Arid Land 2017, 9, 379–393. [Google Scholar] [CrossRef]
  44. Sugimoto, N.; Hara, Y.; Yumimoto, K.; Uno, I.; Nishikawa, M.; Dulam, J. Dust emission estimated with an assimilated dust transport model using lidar network data and vegetation growth in the Gobi desert in Mongolia. Sola 2010, 6, 125–128. [Google Scholar] [CrossRef] [Green Version]
  45. Du, J.M.; Bao, G.; Tong, S.Q.; Huang, X.J. Variations in vegetation cover and its relationship with climate change and human activities in Mongolia during the period 1982–2015. Acta Pratacult. Sin. 2021, 30, 1–13. [Google Scholar] [CrossRef]
  46. Han, K.S.; Park, Y.Y.; Yeom, J.M. Detection of change in vegetation in the surrounding desert areas of Northwest China and Mongolia with multi-temporal satellite images. Asia-Pac. J. Atmos. Sci. 2015, 51, 173–181. [Google Scholar] [CrossRef]
  47. Xiao, S.C.; Ding, A.J.; Tian, Q.Y.; Han, C.; Peng, X.M. Site-and species-specific climatic responses of two co-occurring shrubs in the temperate Alxa Desert Plateau, northwest China. Sci. Total Environ. 2019, 667, 77–85. [Google Scholar] [CrossRef]
  48. Zhang, H.; Feng, Y.; Guan, W.; Cao, X.; Li, Z.; Ding, J. Using unmanned aerial vehicles to quantify spatial patterns of dominant vegetation along an elevation gradient in the typical Gobi region in Xinjiang, Northwest China. Glob. Ecol. Conserv. 2021, 27, e01571. [Google Scholar] [CrossRef]
  49. Whitehead, K.; Hugenholtz, C.H. Remote sensing of the environment with small unmanned aircraft systems (UASs), part 1: A review of progress and challenges. J. Unmanned Veh. Syst. 2014, 2, 69–85. [Google Scholar] [CrossRef]
  50. Blaschke, T.; Hay, G.J.; Kelly, M.; Lang, S.; Hofmann, P.; Addink, E.; Feitosa, R.Q.; van der Meer, F.; van der Werff, H.; van Coillie, F.; et al. Geographic object-based image analysis–towards a new paradigm. ISPRS J. Photogramm. Remote Sens. 2014, 87, 180–191. [Google Scholar] [CrossRef] [PubMed] [Green Version]
  51. Drăguţ, L.; Csillik, O.; Eisank, C.; Tiede, D. Automated parameterisation for multi-scale image segmentation on multiple layers. ISPRS J. Photogramm. Remote Sens. 2014, 88, 119–127. [Google Scholar] [CrossRef] [PubMed] [Green Version]
  52. Woebbecke, D.M.; Meyer, G.E.; Von Bargen, K.; Mortensen, D.A. Color indices for weed identification under various soil, residue, and lighting conditions. Trans. ASAE 1995, 38, 259–269. [Google Scholar] [CrossRef]
  53. Neto, J.C. A Combined Statistical-Soft Computing Approach for Classification and Mapping Weed Species in Minimum-Tillage Systems; The University of Nebraska-Lincoln: Lincoln, NE, USA, 2004. [Google Scholar]
  54. Maimaitijiang, M.; Sagan, V.; Sidike, P.; Maimaitiyiming, M.; Hartling, S.; Peterson, K.T.; Maw, M.J.W.; Shakoor, N.; Mockler, T.; Fritschi, F.B. Vegetation index weighted canopy volume model (CVMVI) for soybean biomass estimation from unmanned aerial system-based RGB imagery. ISPRS J. Photogramm. Remote Sens. 2019, 151, 27–41. [Google Scholar] [CrossRef]
  55. Louhaichi, M.; Borman, M.M.; Johnson, D.E. Spatially located platform and aerial photography for documentation of grazing impacts on wheat. Geocarto Int. 2001, 16, 65–70. [Google Scholar] [CrossRef]
  56. Bendig, J.; Yu, K.; Aasen, H.; Bolten, A.; Bennertz, S.; Broscheit, J.; Gnyp, M.L.; Bareth, G. Combining UAV-based plant height from crop surface models, visible, and near infrared vegetation indices for biomass monitoring in barley. Int. J. Appl. Earth Obs. Geoinf. 2015, 39, 79–87. [Google Scholar] [CrossRef]
  57. Hague, T.; Tillett, N.D.; Wheeler, H. Automated crop and weed monitoring in widely spaced cereals. Precis. Agric. 2006, 7, 21–32. [Google Scholar] [CrossRef]
  58. McGinnis, T.W.; Shook, C.D.; Keeley, J.E. Estimating aboveground biomass for broadleaf woody plants and young conifers in Sierra Nevada, California, forests. West. J. Appl. For. 2010, 25, 203–209. [Google Scholar] [CrossRef] [Green Version]
  59. Zeng, H.Q.; Liu, Q.J.; Feng, Z.W.; Ma, Z.Q. Biomass equations for four shrub species in subtropical China. J. For. Res. 2010, 15, 83–90. [Google Scholar] [CrossRef]
  60. Uzoh, F.C.; Ritchie, M.W. Crown Area Equations for 13 Species of Trees and Shrubs in Northern California and Southwestern Oregon; Forest Service Research Paper, No. PB-98-105380/XAB; FSRP-PSW-227); Pacific Southwest Research Station, Forest Service: Albany, CA, USA, 1996; pp. 1–13. [Google Scholar]
  61. Mao, P.; Qin, L.; Hao, M.; Zhao, W.; Luo, J.; Qiu, X.; Xu, L.; Xiong, Y.; Ran, Y.; Yan, C.; et al. An improved approach to estimate above-ground volume and biomass of desert shrub communities based on UAV RGB images. Ecol. Indic. 2021, 125, 107494. [Google Scholar] [CrossRef]
  62. Cáceres, M.D.; Casals, P.; Gabriel, E.; Castro, X. Scaling-up individual-level allometric equations to predict stand-level fuel loading in Mediterranean shrublands. Ann. For. Sci. 2019, 76, 1–17. [Google Scholar] [CrossRef]
  63. Ma, X.; Wang, X. Biomass partitioning and allometric relations of the Reaumuria soongorica shrub in Alxa steppe desert in NW China. For. Ecol. Manag. 2020, 468, 118178. [Google Scholar] [CrossRef]
  64. Li, W.; Niu, Z.; Chen, H.; Li, D.; Wu, M.; Zhao, W. Remote estimation of canopy height and aboveground biomass of maize using high-resolution stereo images from a low-cost unmanned aerial vehicle system. Ecol. Indic. 2016, 67, 637–648. [Google Scholar] [CrossRef]
  65. Yue, J.; Feng, H.; Jin, X.; Yuan, H.; Li, Z.; Zhou, C.; Yang, G.; Tian, Q. A comparison of crop parameters estimation using images from UAV-mounted snapshot hyperspectral sensor and high-definition digital camera. Remote Sens. 2018, 10, 1138. [Google Scholar] [CrossRef] [Green Version]
  66. Han, L.; Yang, G.; Dai, H.; Xu, B.; Yang, H.; Feng, H.; Li, Z.; Yang, X. Modeling maize above-ground biomass based on machine learning approaches using UAV remote-sensing data. Plant Methods 2019, 15, 10. [Google Scholar] [CrossRef] [PubMed] [Green Version]
  67. Lu, N.; Zhou, J.; Han, Z.; Li, D.; Cao, Q.; Yao, X.; Tian, Y.; Zhu, Y.; Cao, W.; Cheng, T. Improved estimation of aboveground biomass in wheat from RGB imagery and point cloud data acquired with a low-cost unmanned aerial vehicle system. Plant Methods 2019, 15, 17. [Google Scholar] [CrossRef] [PubMed] [Green Version]
  68. Fu, H.; Wang, C.; Cui, G.; She, W.; Zhao, L. Ramie yield estimation based on UAV RGB images. Sensors 2021, 21, 669. [Google Scholar] [CrossRef] [PubMed]
  69. Sharma, P.; Leigh, L.; Chang, J.; Maimaitijiang, M.; Caffé, M. Above-ground biomass estimation in Oats using UAV remote sensing and machine learning. Sensors 2022, 22, 601. [Google Scholar] [CrossRef] [PubMed]
Figure 1. Study sites location: (a) map of study area in the Xinjiang Autonomous Region of China; (b) map of study area in Gobi Desert in the Xinjiang Autonomous Region; (c) map of sampling area in the Gobi Desert; (df) UAV remote sensing images of top, middle and bottom of the alluvial fan, respectively; (gi) vegetation landscape pictures of top, middle and bottom of the alluvial fan, respectively.
Land 11 00543 g001
Figure 2. Classification results based on UAV images for different VIs of Gobi Desert: (a) UAV orthophoto; (bg) the shrub crown of EXGR, GBRI, VEG, RGBVI, GLI and EXG calculated based on a fixed threshold, respectively.
Land 11 00543 g002aLand 11 00543 g002b
Figure 3. Vegetation coverage calculated based on EXG indices at different positions of the alluvial fan: (AC) UAV orthophoto at the top, middle and bottom of the alluvial fan, respectively; (ac) vegetation coverage at the top, middle and bottom of the alluvial fan, respectively, where the vegetation crown areas were white, the non-vegetation areas were black.
Land 11 00543 g003
Figure 4. Vegetation coverage of three sample lines at different positions of the alluvial fan.
Land 11 00543 g004
Figure 5. Optimal fitting models of the AGB and crown area of shrub in a sample area of Gobi Desert.
Land 11 00543 g005
Figure 6. Box diagram of AGB at the alluvial fan of different positions.
Land 11 00543 g006
Figure 7. Shrub vegetation coverage calculated by UAV RGB images fitted to the AGB curve in sample plots.
Land 11 00543 g007
Figure 8. AGB map of Gobi Desert shrub communities: (ac) AGB of shrub communities at the top, middle and bottom of the alluvial fan, respectively.
Land 11 00543 g008
Figure 9. Correlation between observed and UAV predicted AGB.
Land 11 00543 g009
Table 1. RGB VIs used in the study.
Vegetation IndicesSymbolFormulaTheory IntervalReferences
Excess green indexEXG2 × g − r − b[−1, 2][52]
Excess green minus excess red indexEXGREXG − EXR = 3 × g − 2.4 × r − b[−2.4, 3][53]
Green blue ratio indexGBRIG/B[0, 255][54]
Green Leaf IndexGLI(2 × G − B − R)/(−B − R)[−1, 1][55]
Red, green and blue vegetation indexRGBVI(G2 − R × B)/(G2 + R × B)[−1, 1][56]
Vegetative indexVEGG/(R0.667 × B0.333)[0, 255][57]
R, G and B represent the pixel values of the red, green and blue wave segments, respectively. r = red ratio = R/(R + G + B), g = green ratio = G/(R + G + B), b = blue ratio = B/(R + G + B).
Table 2. The accuracy evaluation of spectral indices extraction.
Visible Vegetation IndexOverall Accuracy (%)Kappa Coefficient (%)
EXGR69.0037.13
GBRI75.0048.45
VEG88.0075.57
RGBVI95.0089.81
GLI97.0093.88
EXG97.0094.00
Table 3. The fitting effects and significance of the AGB and shrub crown area model.
ModelR2Adjusted R2F-TestSig.
Power0.7600.758360.2910.000
Exponent0.6490.646210.5840.000
Quadratic0.6480.642104.0580.000
Cubic0.6480.63968.7790.000
Linear0.6420.639204.1780.000
Logarithm0.4620.45797.8760.000
Table 4. Fitting effects of vegetation coverage and AGB.
ModelR2F-TestRMSE (g/m2)
Root Mean Square Error
MAE (g/m2)
Mean Absolute Error
Power0.897443.450 **20.08414.985
Cubic0.76553.091 **10,871.2159137.626
Quadratic0.75275.709 **410.309347.357
Linear0.738143.816 **20.14815.883
Logarithm0.686111.588 **31.14826.580
Exponent0.686111.324 **38.00729.357
p value significance: ** is significant at the 0.01 level (p < 0.01).
Publisher’s Note: MDPI stays neutral with regard to jurisdictional claims in published maps and institutional affiliations.

