1. Introduction
The central place theory has laid a theoretical foundation for the development of the urban system. Through continuous in-depth research, scholars have derived classic regional and urban theories, e.g., the “growth pole theory” and the “core-periphery theory”. In early research of the urban system, the object was often confined to natural geographical units or independent administrative areas. Cities were assumed to exist in isolation and regarded as “spaces of places” in closed areas [
1]. With economic globalization and regional integration and the rapid development of infrastructure construction and information technology, the connection between cities is getting closer and closer. The subsequent flows of various elements have accelerated, and an urban network centered on cities of different sizes has gradually formed. The dominant urban form has gradually changed from “spaces of places” to “spaces of flows” [
2,
3]. Since Castells put forward the “spaces of flows” theory in the 1990s, research on cities and regions has begun to shift from a vertical hierarchy system to a network system [
4]. The development of cities depends not only on their functions and characteristics but also on inter-city relations and spatial spillover effects [
5,
6,
7]. Trying to analyze urban issues from a wider perspective, the proposal of the “spaces of flows” theory and related research have made the research on regional and urban development no longer confined to a closed area. Meanwhile, they have broken the boundaries and scales of traditional urban research and shifted the perspective of urban studies from hierarchy to network connections [
8,
9]. With the deepening of research, urban research has gradually moved from “agglomeration externalities” to “network externalities” that cross geographical boundaries [
10]. Agglomeration economy usually refers to the agglomeration of similar industries or complementary industries in adjacent geographic spaces to form industrial clusters or interdependent economic networks due to the spatial agglomeration of economic activities. Rosenthal et al. believe that agglomeration externalities refer to the spillover effects obtained by economic agents from geographical proximity [
11]. Analyzing from the perspective of agglomeration and economies of scale, scholars pointed out that the expansion of urban scale can increase the benefits brought by agglomeration [
12,
13,
14]. However, geographical proximity is not the only reason for economic externalities; interactions between geographically nonadjacent economic agents can also generate externalities [
15]. Capello introduced network externalities into the research of urban networks, pointing out that cooperation and participation between localities form network advantages, and the existence of inter-city functional networks can create synergy and complementarity [
1]. In recent years, the issue of agglomeration externalities and network externalities has received increasing attention, and their impact on urban development has become the focus of research on urban network externalities [
15]. Since the introduction of network externalities, scholars have analyzed the influence of urban network externalities on economic development and the mechanisms from different perspectives, and compared the impact of network externalities and agglomeration externalities [
15]. The externality research around urban agglomeration focuses more on the different forms of externalities, measures the different dimensions of externalities, and describes less when it comes to larger scales of externalities [
16].
In general, there are few studies focusing on the impact of network externalities and agglomeration externalities on urban economic growth at the urban agglomeration scale, and there is a lack of comparative studies between the two. Under this background, this paper attempts to conduct research at the scale of urban agglomerations and empirically analyze the impact of network externalities and agglomeration externalities on urban development from the perspective of externality theory. Specifically, this paper aims to answer the following questions. Firstly, what is the spatial pattern of network externalities and agglomeration externalities at the urban agglomeration scale? Secondly, how do they promote urban economic growth? Finally, are there differential impacts between network externalities and agglomeration externalities on urban economic development?
In recent years, China has proposed to take urban agglomerations as the main body to build an urban pattern of coordinated development of cities of different sizes, and further enhance the level of integrated development of Beijing–Tianjin–Hebei, Guangdong–Hong Kong–Macao, the Yangtze River Delta, and other regions that are included in the national strategy. Urban agglomerations have become economic growth poles and core regions in development. In December 2019, the “Outline of the Yangtze River Delta Regional Integrated Development Plan” was released, and the Yangtze River Delta (YRD) regional integration strategy entered the implementation stage. It is one of the regions with the most active economic development, the highest degree of economic openness, and the greatest innovation capacity in China. Compared with the connections in closed areas, this paper adopts the perspective of externality to examine the regional connections of urban agglomerations, which is of great significance. Based on this, this paper intends to analyze the impact of network externalities and agglomeration externalities on urban development at the urban agglomeration scale. Specifically, 41 cities in the YRD are selected as the research objects. This paper uses factors such as corporate investment in the YRD and in other cities across the country to characterize the influence of network externalities and agglomeration externalities on urban development. By analyzing their impact on the economic growth of cities in the YRD from 2000 to 2020, this paper aims at clarifying the impact of network externalities and agglomeration externalities on urban economic development and providing case support from the scale of urban agglomerations. On one hand, this paper provides new evidence for urban economic growth at the scale of urban agglomerations, and on the other hand, it provides a basis for decision-making for the development of regional economic integration.
The structure of the remaining paper is as follows: the second section presents the literature review; the third section presents research areas, data sources, and methods used in this study; the fourth section present the results of the empirical analysis; the fifth section is the conclusions and discussion.
2. Literature Review
Since the Industrial Revolution, the functional boundaries of cities have changed significantly with increased mobility and the development of information technology. The central place theory of Christaller focuses primarily on explaining the distribution, size, number of cities and towns, and location of economic activity [
15]. Based on the central place theory, classical regional and urban theories such as polarization-diffusion have emerged. On the other hand, the empirical research of the urban systems dissects the organization of urban systems and the nature of urban networks [
17,
18]. Urban systems are defined as regionally, nationally, and globally connected and interdependent urban spaces [
18]. With the incorporation of the network dimension into external economic and urban growth studies, urban studies have shifted from agglomeration externalities to network externalities. The interplay between economic entities that are not spatially adjacent will also generate externalities, which some scholars call “urban network externalities” [
1], “regional externalities” [
19],“externality fields” [
20], and “borrowed size” [
10,
21].
As early as the 18th century, agglomeration economies were formed in some countries and regions, in which the same (similar) industries or complementary industries agglomerated in specific and adjacent geographic locations to form industrial clusters or economic networks [
22]. Duranton and Puga summarized three micro-mechanisms of the agglomeration economy: “sharing” of intermediate inputs and public facilities; “matching” between market entities and factors; “learning effect” of knowledge interaction and technology diffusion [
23]. Agglomeration theory gives an explanation of urban economic development from a microscopic level. Agglomeration externalities refer to the additional benefits obtained by economic actors from being located in agglomeration areas under these mechanisms, including cost reduction and income increase brought by factor sharing, and learning opportunities brought by knowledge spillovers [
11]. In addition, scholars of new regionalism believe that knowledge spillovers are also affected by social embeddedness, cultural proximity, and institutional thickness [
24], pointing out their regional features [
25].
Development of transportation and information technology has strengthened the endogenous correlation of economic development between cities, and “spaces of flows” constituted by information flow, technology flow, human flow, and logistics have integrated cross-regional structures. Agglomeration economies are no longer limited to isolated space. Local places are absorbed into the inter-city network flows. From the perspective of the global system, the embeddedness of most cities in domestic and international city networks has a greater effect on city performance, compared with the impact of a city’s scale, that is, city status is determined by its position in the network, rather than local agglomeration capabilities [
26]. Capello first proposed the concept of “urban network externalities”, pointing out that network economic cooperation participants can obtain the advantages of network externalities [
1]. Network externalities may stem from economies of scale, knowledge effects, transaction cost reductions, and organizational advantages [
27]. The agglomeration externality decreases by distance, while the network externality is not strictly confined in space and changes with the strength of the urban functional relations [
10,
28].
Scholars have conducted a lot of research on the impact of network externalities and agglomeration externalities on urban development. One view holds that agglomeration externalities are more important to economic growth than network externalities. For example, Biox et al. incorporated agglomeration economies and network externalities into urban growth models to explain why sectoral employment growth in one city is higher than in another city. The result showed that the agglomeration economies’ coefficient is greater than the network externality coefficient [
27,
29]. Taking Japan’s high-speed rail as an example, Jetpan Wetwitoo et al. studied the relationship between high-speed rail (HSR) and regional economic productivity, and found that network externalities and agglomeration externalities both promote regional productivity, and network externalities were significantly weaker than agglomeration effects [
30].
Other scholars believe that network externalities can substitute agglomeration externalities to some extent. For example, McCann and Acs believe that in different stages of globalization, the importance of agglomeration externalities and the relationship between urban scale and economic development will change. Cities’ connections to regions and the world matter more than their size [
26]. Chenghui Tang et al. analyzed the heterogeneous impact of HSR on the innovation performance of Chinese cities, and found that urban innovation performance can be improved through both network externalities and agglomeration externalities, and compared with the latter, network externalities have a greater impact [
31]. Yin Huang et al. believe that urban network externalities have a significant role in promoting urban economic development, and compared with agglomeration economies, urban network externalities do not depend on the geographic proximity of cities, but rather relies on connections in the network, which can have cross-spatial spillover effects [
32]. Jiaming Li et al. explored the impact of strategic emerging industries (SEIs) on urban economic growth in mainland China, arguing that network externalities are usually more important than agglomeration externalities [
33].
In addition, there is a growing view that there is a complementary relationship between network externalities and agglomeration externalities, and the two provide market participants with a complimentary benefit [
5]. As Cabus argues, there are two complementary components in explaining the geographic impact of external economies: agglomeration economies driven by geographic proximity, and network externalities, where the latter is linked to the network itself and influenced by geographic competition and capabilities [
34]. In a word, network externality research makes up for the limited spatial scope of agglomeration externalities and the lack of measurement of the relationship between cities and extends the theoretical connotation of urban research.
On the other hand, under the background of globalization and marketization, cross-regional enterprises and metropolises are actively integrating into the urban network, and the network system pattern is profoundly shaped by market mechanisms, culture, and institutions within the region. The agglomeration effect performs at a larger spatial scale [
21]. In addition to the urban scale, network externalities have multiple spatial scales such as “global scale”, “national scale”, and “regional scale” [
35,
36]. At present, scholars have conducted a large number of empirical studies on network externalities and agglomeration externalities at the urban scale, but relatively few studies have been conducted at the urban agglomeration scale. The empirical study on the impact of network externalities and agglomeration externalities on urban economic growth at the urban agglomeration scale has important policy-reference value for promoting the integrated development of urban agglomerations.
The agglomeration externalities at the urban scale refer more to the close upstream and downstream relationships between enterprises, knowledge and information spillovers, and large-scale labor markets [
30,
37]. Due to the proximity of space, enterprises in different industries generate new ideas due to the spatial gathering of industries and people, and promote local economic development [
38]. In contrast to industrial clusters’ cooperative networks based on spatial proximity, network externalities emphasize the benefits of information or financial linkages beyond regions and cities, highlighting the effects of nonlocalization [
33]. The agglomeration externality at the urban agglomeration scale means that cities within the urban agglomeration generate agglomeration economies through resource sharing, mutual competition, and mutual learning, thereby promoting spatial spillovers. Cities within urban agglomeration will continue to attract the spatial agglomeration of factors of production and economic activities, and continue to expand the agglomeration. The network externalities at the urban agglomeration scale means that with the strengthening of transportation and economic links, cities within the urban agglomeration acquire externalities outside the urban agglomeration, share resources through network channels, and learn from each other. With the help of the trend of networking, cities absorb the external economic factors of urban agglomerations, improve resource allocation efficiency, match resources on a larger spatial scale, and improve production factors’ allocation efficiency, thereby generating network externalities and promoting economic development.
The overall framework of this study is shown in
Figure 1. The concepts of agglomeration economy and network externalities are compared at the urban agglomeration scale to explain the theoretical impact mechanism of externalities on economic growth. The basis for the formation of urban agglomerations is the close connection between cities in the region. Under the background of regional integration, the cost of transportation and connection within the urban agglomeration is reduced, and industrial division of labor and agglomeration advantages are formed between cities. Different from the analysis of externalities at the urban scale, the urban connections within the urban agglomeration are taken as the representation of agglomeration externalities at the urban agglomeration scale. Similarly, cities can acquire development elements in larger areas outside the urban agglomeration; thus, the urban connections outside the urban agglomeration are regarded as a representation of network externalities. The agglomeration externalities at the urban agglomeration scale are spatially restricted by the urban agglomerations, while the network externalities are not; agglomeration externalities are mainly manifested in the internal connections of urban agglomerations, while network externalities involve cross-regional connections. It is worth mentioning that comparing the impact of an agglomeration economy and network externalities on urban economic growth at the urban agglomeration scale requires data verification in a large number of urban agglomeration areas. Limited by the availability of data, this paper only takes the YRD region as an example to carry out empirical analysis, and the conclusions obtained are only applicable to the region equivalent to the development stage of the YRD in China, so the above problems can only be partially analyzed. A more complete conclusion awaits regional data acquisition and corresponding empirical analysis at different development stages.
4. Results
4.1. Spatial Feature Analysis
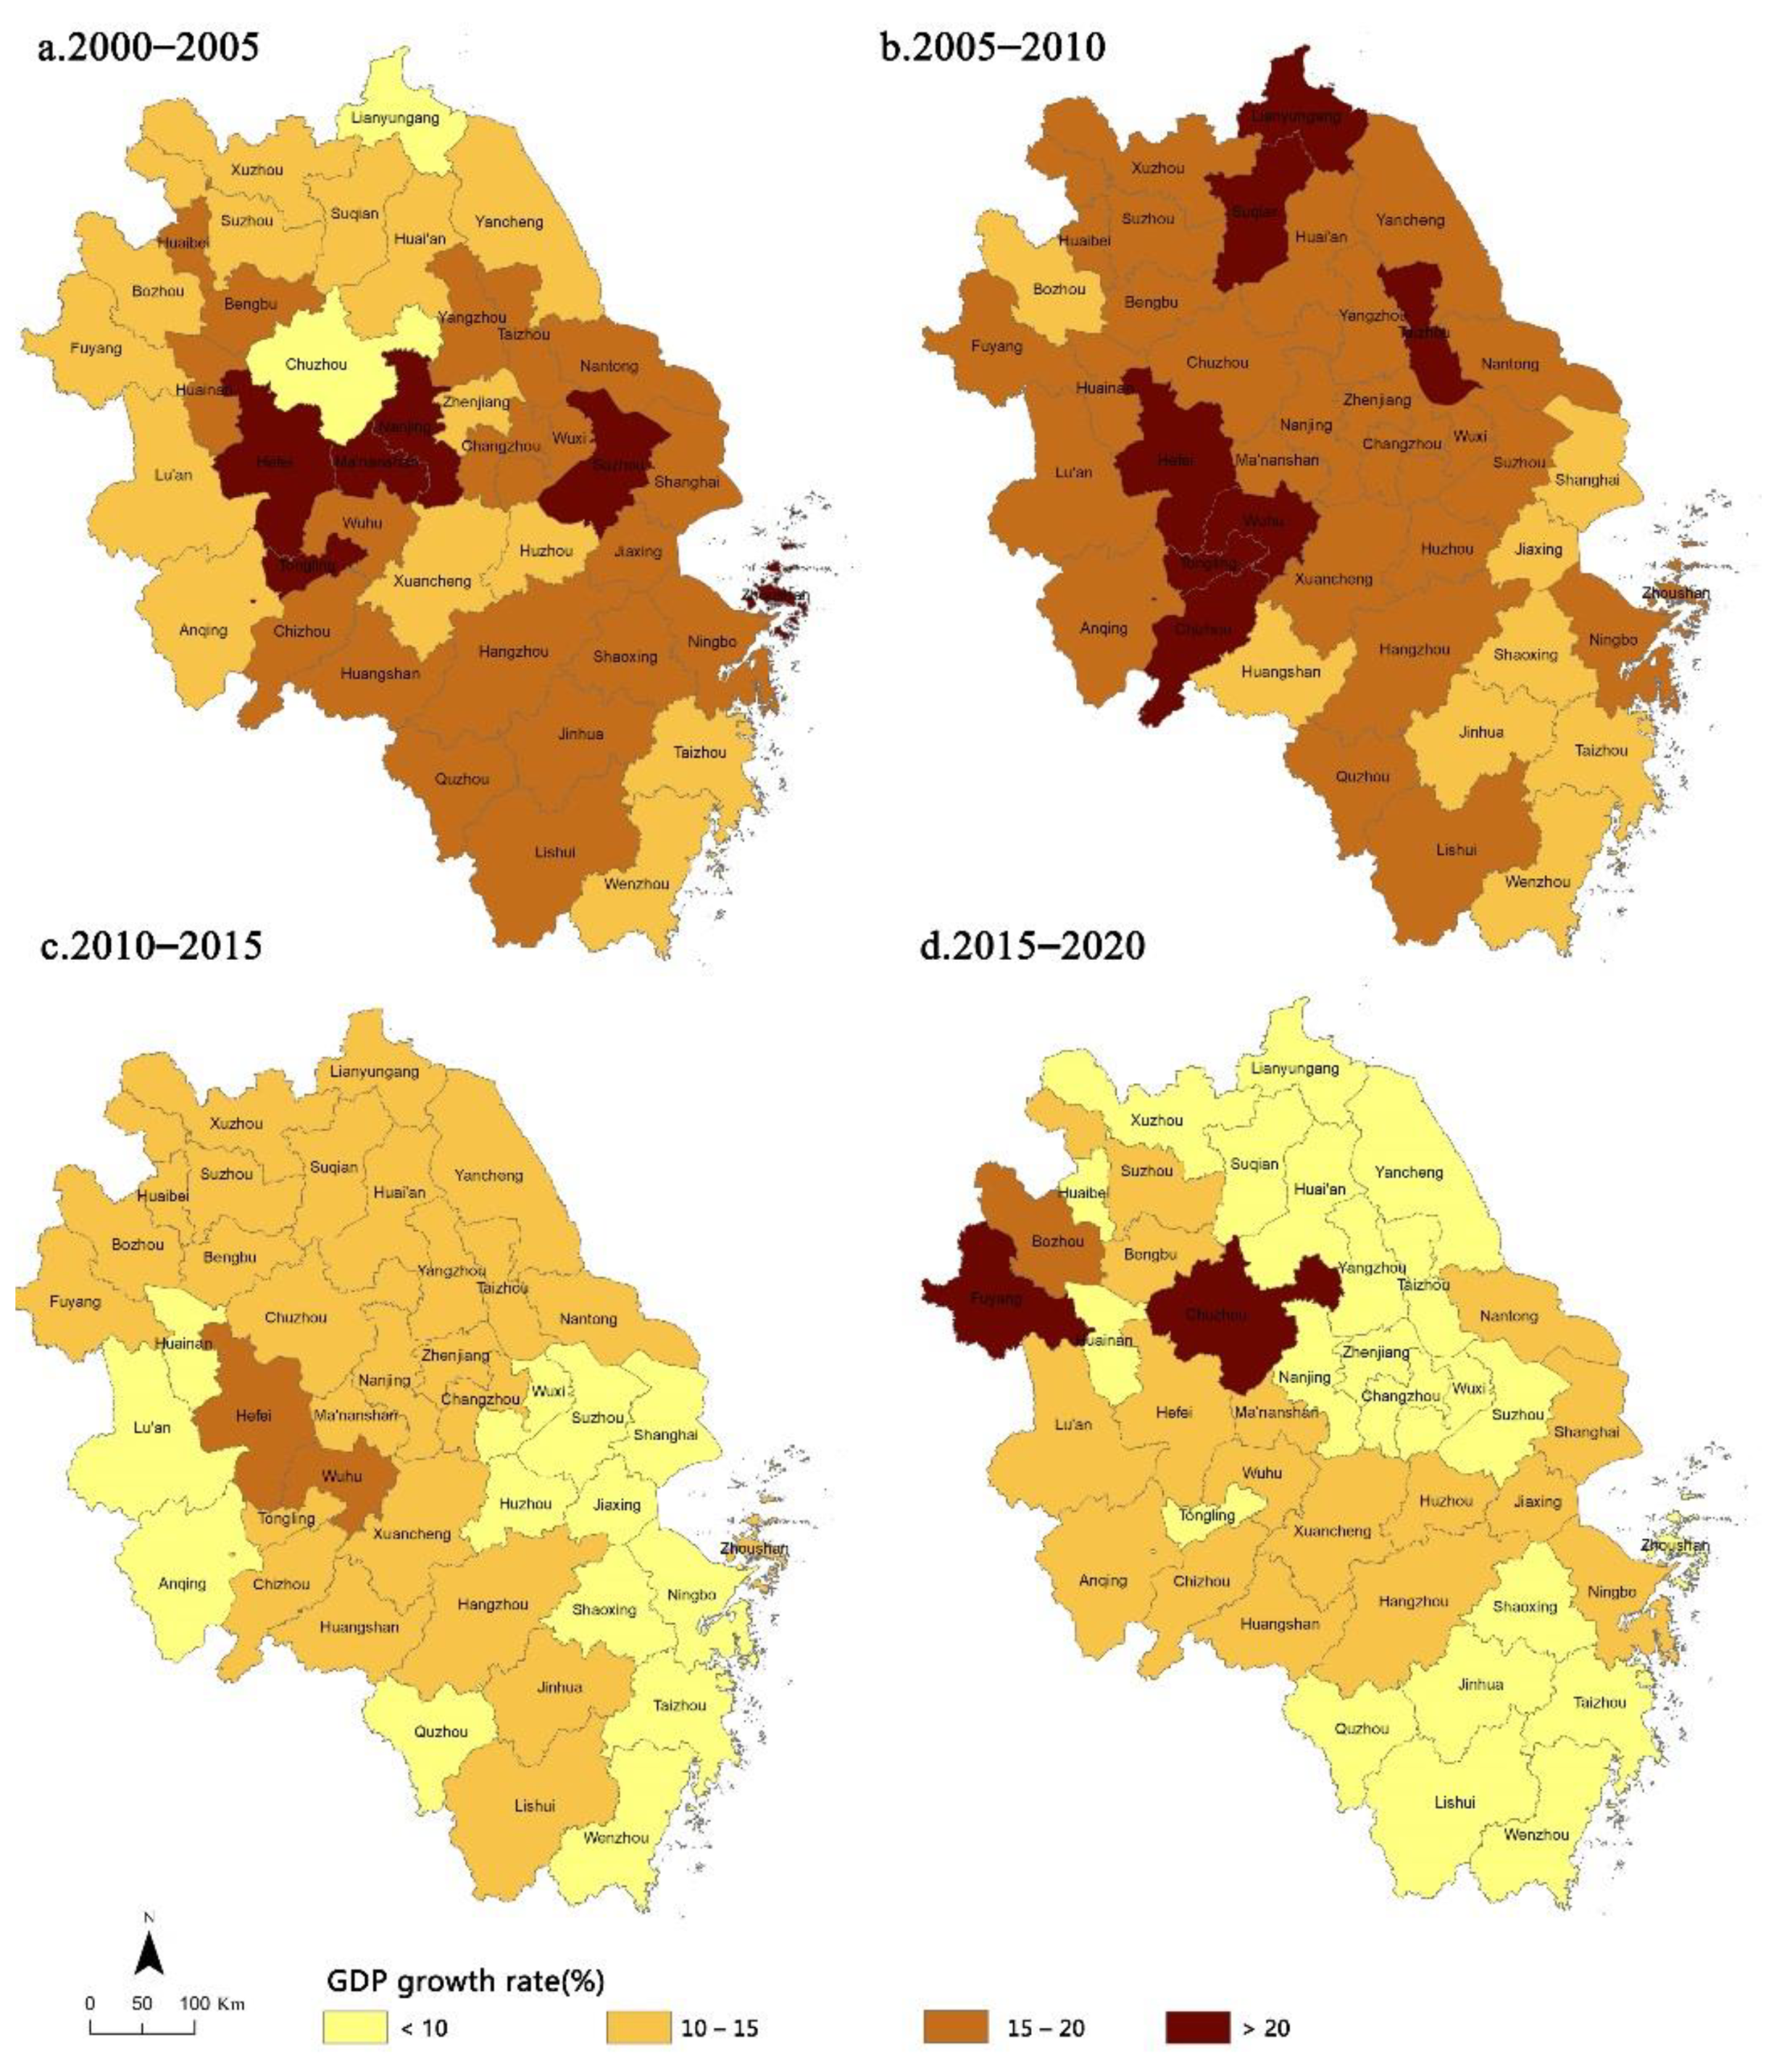
By linking the GDP growth rates of all cities in the YRD with the administrative data, we can see the spatial distribution characteristics (
Figure 3). Overall, the spatial differences in the GDP growth rates of cities in the YRD region in different periods are significant. From the perspective of the four periods, the average annual GDP growth rate of cities such as Hefei, Wuhu, and Ma’anshan in Anhui Province, Nantong in Jiangsu, and Hangzhou in Zhejiang was above 10%. From 2000 to 2010, the average GDP growth rate of cities in the YRD region exceeded 15%, showing an increasing trend. The growth rate started to slow after 2010 to around 10% during 2015–2020. From 2005 to 2010, the GDP of each city in the YRD region reached the fastest growth rate, with an average of over 17%. From the perspective of spatial distribution, the spatial pattern of urban economic growth in the YRD region shows an outward trend. In the early stage, cities with relatively fast growth rates were mainly concentrated in the core area formed by 16 cities including Shanghai. After 2010, the economic growth rate of northern Anhui cities, northern Jiangsu cities, and southern Zhejiang cities began to accelerate and entered a stage of rapid development. Specifically, from 2000 to 2005, the GDP growth rate of cities in southern Jiangsu, northern Zhejiang, and surrounding cities of Hefei was relatively high, especially in Ma’anshan, Hefei, Suzhou, Tongling, etc. From 2005 to 2010, the GDP of cities around Hefei, Lianyungang, and Suqian grew rapidly. After 2010, the GDP growth rate of cities in the YRD slowed down. The GDP of Hefei and Wuhu grew faster from 2010 to 2015. After 2015, cities in northern Anhui such as Fuyang and Chuzhou experienced rapid GDP growth.
From the growth rate of Shanghai’s investment in cities in the YRD (
Figure 4), the areas affected by Shanghai’s investment in the four periods were mainly concentrated in Hefei and Ma’anshan in Anhui, Lishui, and Jiaxing in Zhejiang, Nantong and Suqian in Jiangsu. The growth rate of Shanghai’s investment over the years had exceeded 20%. From the perspective of time, the growth rate of Shanghai’s investment in cities in the YRD from 2000 to 2020 showed a downward trend, from an average growth rate of about 40% in 2000–2005 to about 35% in 2015–2020. From the perspective of space, Shanghai’s investment in cities in the YRD showed a state of outward diffusion. The growth rate of Shanghai’s investment in surrounding cities was decreasing. On the contrary, the investment quota of other cities received outside the surrounding cities was gradually increasing. This may be related to the industrial transformation and upgrading as well as the economic radiation in the YRD region. With the acceleration of the integration process, other cities except the core area began to be affected by the radiation of Shanghai. Specifically, Shanghai’s investment in other cities increased rapidly from 2000 to 2005, and then began to slow down. Taking a longitudinal perspective, because Shanghai had a solid investment foundation in the core cities of the YRD, a large amount of investment had been completed from the reform and opening-up to 2000, so the growth rate was relatively slow; alternatively, for the cities in northern Anhui and northern Zhejiang, the investment of Shanghai was not large, but had grown rapidly over the years.
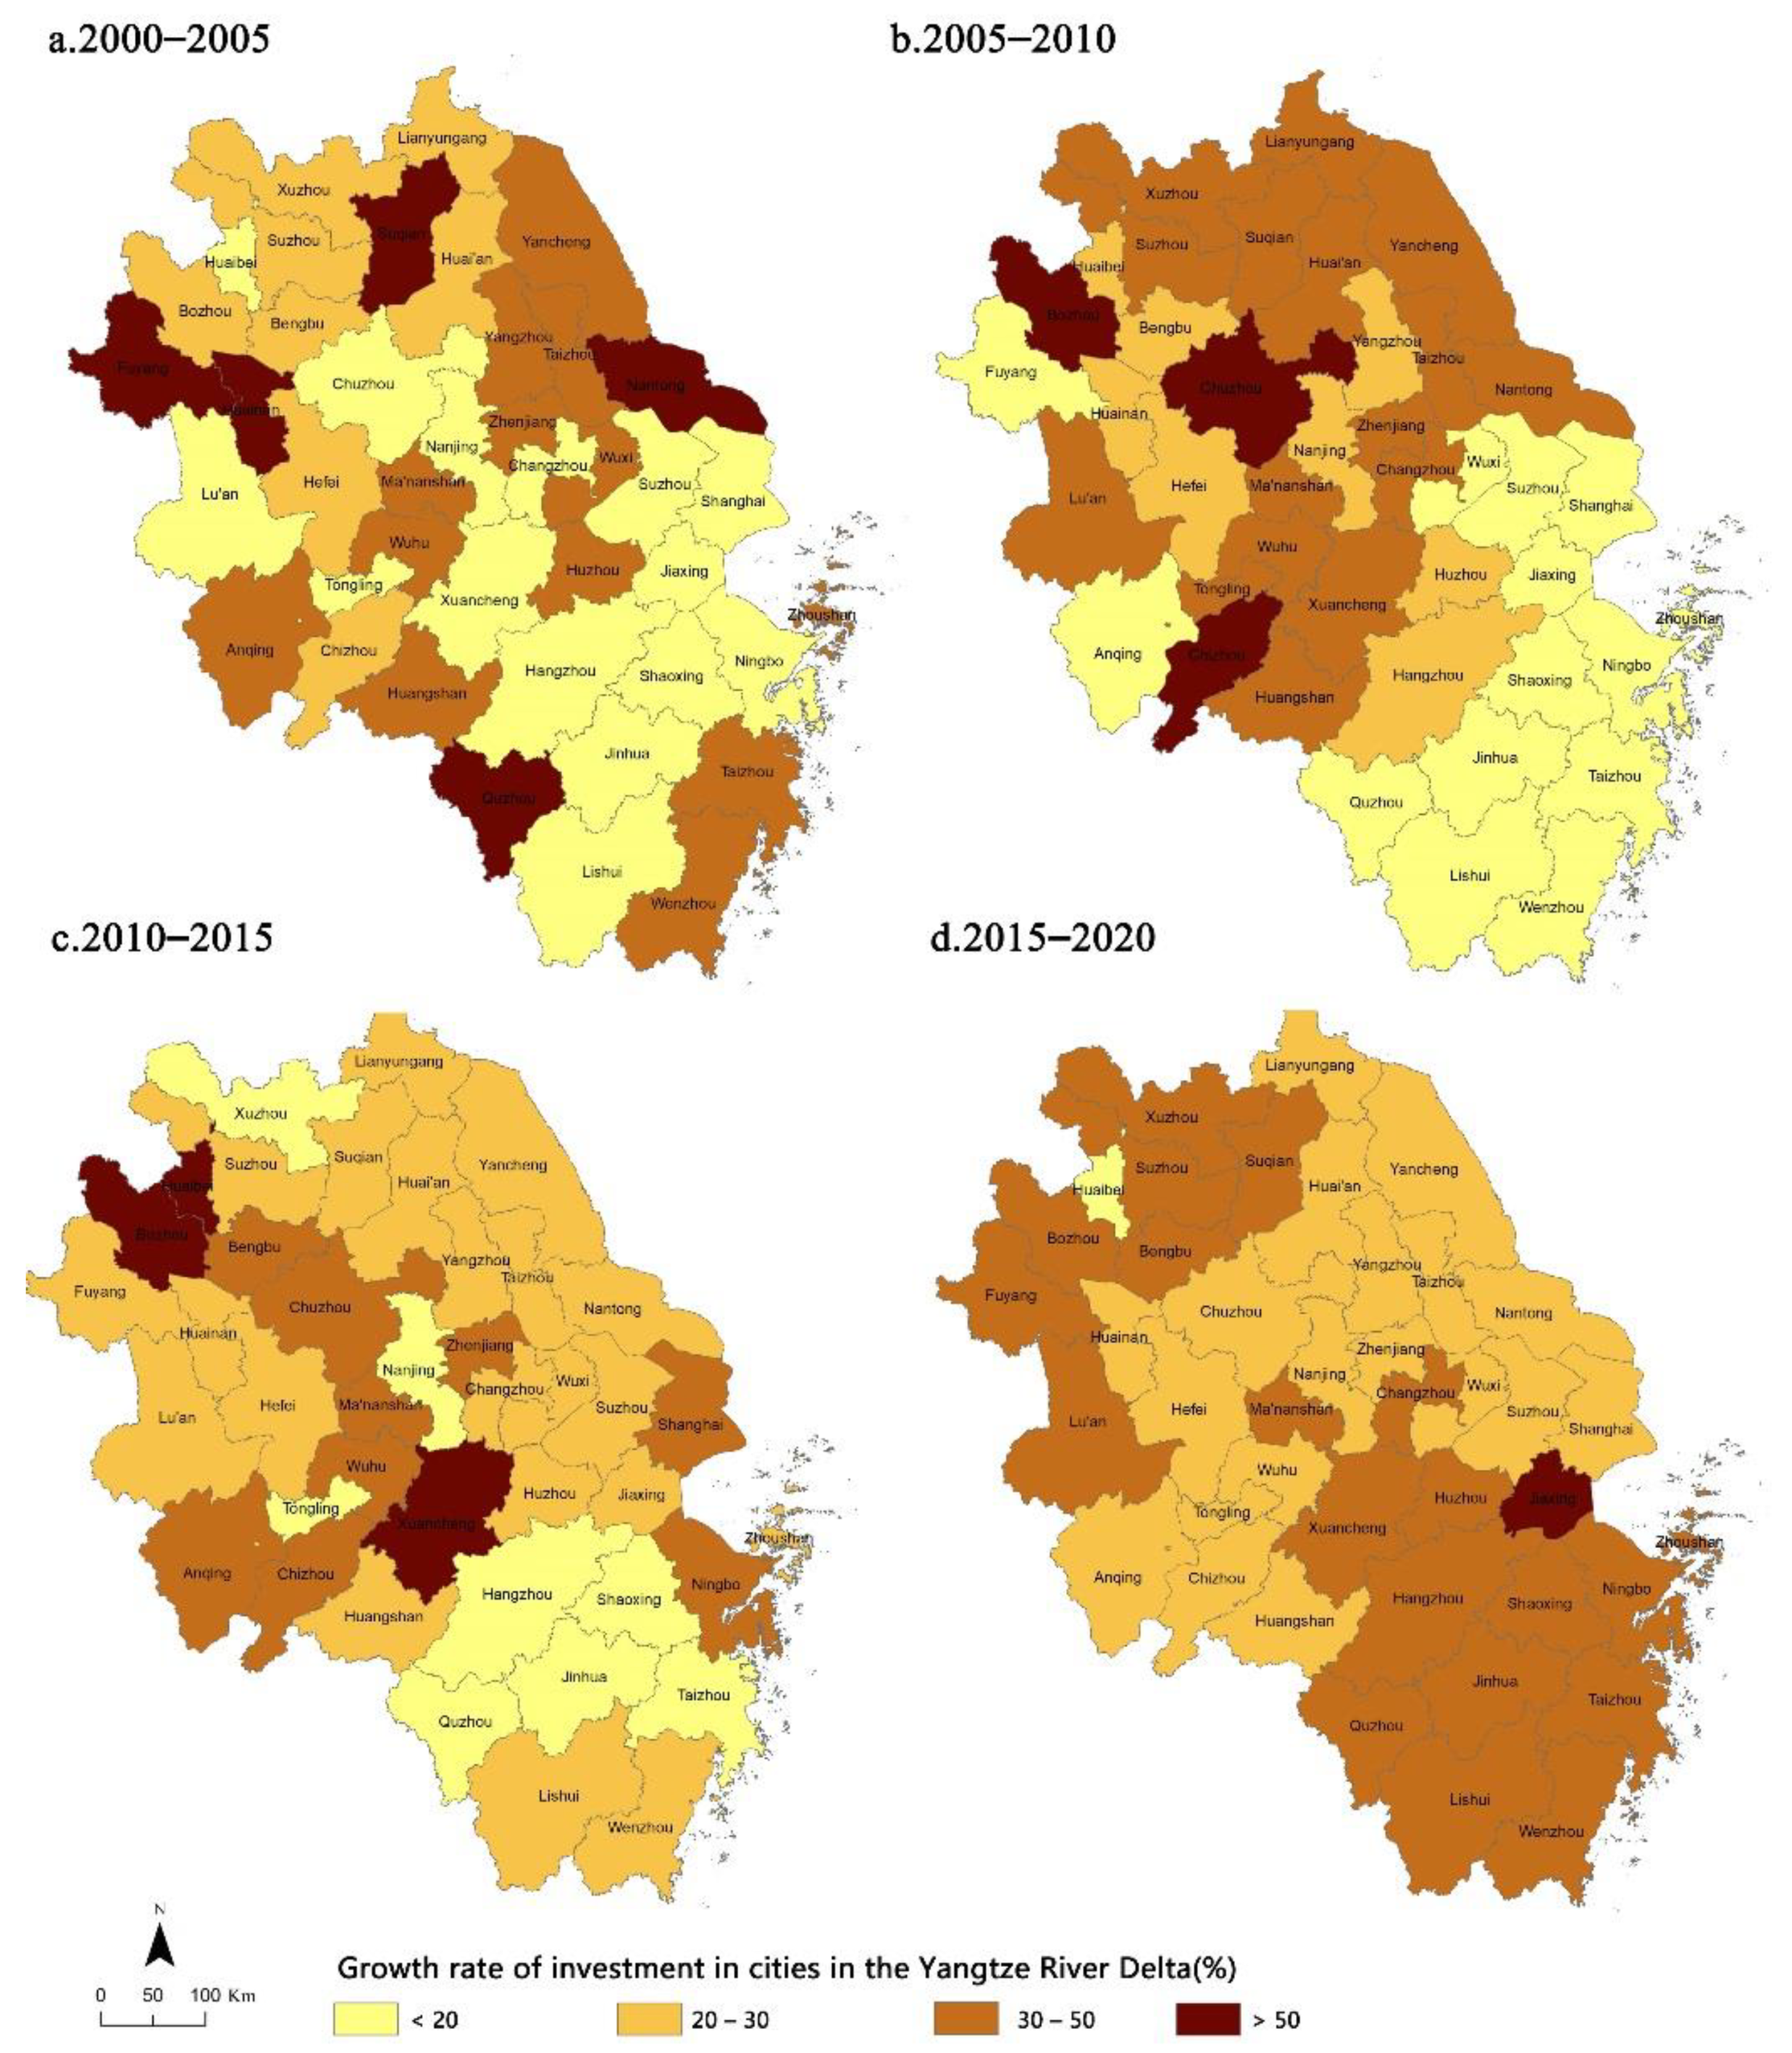
Figure 5 presents the spatial characteristics of the investment growth rate of the cities in the YRD. The areas with rapid investment growth in the YRD cities in the four periods were mainly concentrated in Hefei, Ma’anshan, and Wuhu in Anhui Province, Nantong and Suqian in Jiangsu Province, and Huzhou in Zhejiang Province. The growth rate of investment in cities in the YRD had exceeded 20% over the years. From the perspective of different periods, the growth rate of investment within the YRD region had slowed down from 2000 to 2015, from 30% in 2000–2005 to 27% in 2010–2015. The growth started after 2015, and the average growth rate in 2015–2020 was 31%, which exceeded the growth rate in the period of 2000 to 2005. This may be related to the strengthening of links between cities in the YRD region and the increase in investment intensity after 2015. Overall, the growth rate of urban investment in the YRD region turned from north to south. Since 2000, cities in the YRD with rapid investment growth were mainly in Jiangsu Province and Anhui Province, including Nantong, Huainan, Fuyang, and Suqian during 2000–2005, and Chizhou Bozhou and Chuzhou during 2005–2010. Since 2010, cities in Zhejiang Province had been greatly affected by investment in the YRD region, represented by Zhoushan, Hangzhou, and Taizhou, and the growth rate of investment quotas in cities in the YRD had begun to increase.
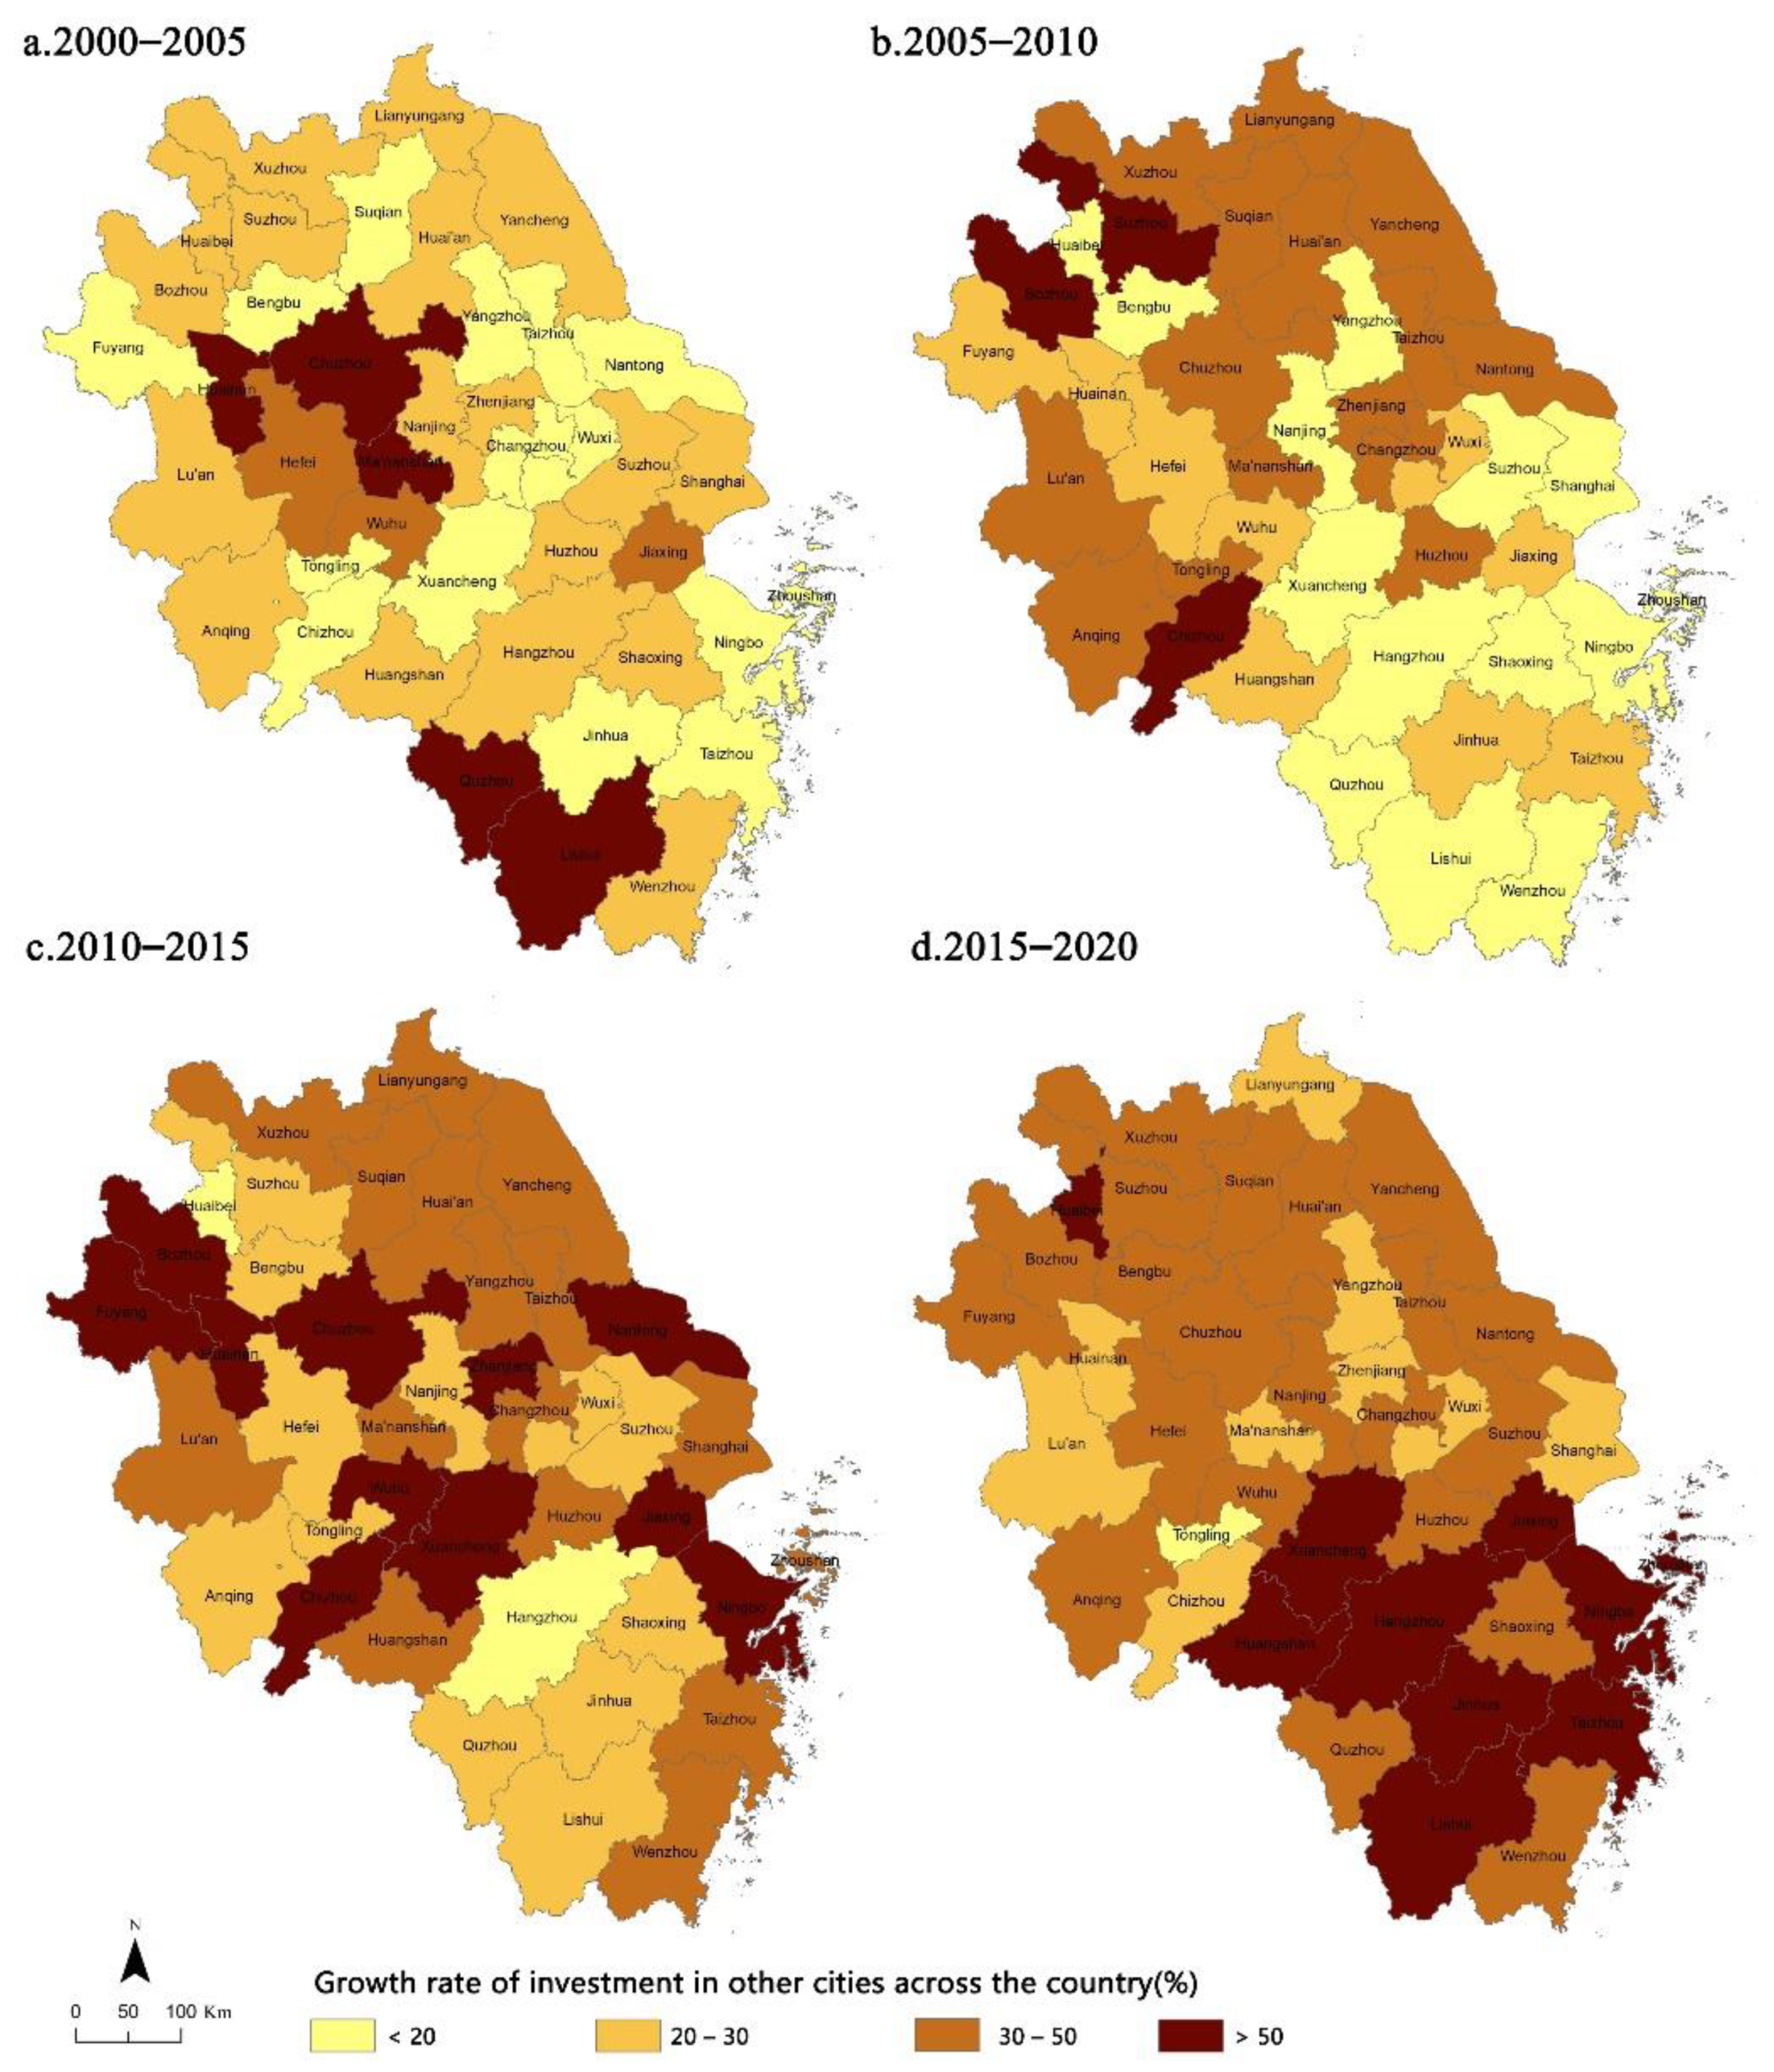
Figure 6 presents the investment growth rates of other cities across the country over the years. The regions with rapid investment growth in the four periods were mainly Hefei, Wuhu, and Ma’anshan in Anhui, Huai’an and Yancheng in Jiangsu, and Huzhou and Jiaxing in Zhejiang Province. From the perspective of different periods, the growth rate of investment from other cities in the country to cities in the YRD region had shown a continuous upward trend, from about 28% in 2000–2005 to about 40% in 2015–2020, which means that the investment intensity of other cities in the country in the YRD region was increasing, which was also closely related to the continuous improvement of the economic vitality of the YRD region. On the whole, the growth rate of investment in other cities across the country turned from northwest to southeast. From 2000 to 2005, the areas with higher growth rates were concentrated in Ma’anshan, Chuzhou, and other cities in the northwest of the YRD region. From 2015 to 2020, Hangzhou, Jiaxing, Ningbo, and other cities had higher investment growth rates. Specifically, before 2010, some cities in southern Zhejiang and northern Anhui, e.g., Maanshan, Chuzhou, Lishui, and Quzhou, received higher investment growth rates from other cities across the country. From 2010 to 2015, most cities in Anhui, e.g., Xuancheng, Huainan, and Wuhu, had a larger increase in investment from other cities across the country. After 2015, other cities across the country have increased the investment in cities to Zhejiang Province, including Hangzhou, Jiaxing, Zhoushan, etc.
4.2. Benchmark Regression Model Results
According to the set indicators, the relevant variables were brought into the formula, and then the panel model was used for estimation and calculation. The test found no multicollinearity and heteroscedasticity problems. A Hausman test was used to choose between a random-effect and fixed-effect model. The probability of the Hausman test was smaller than expected, so the fixed-effect model was adopted. Model (1) in
Table 2 was used to estimate the impact on urban economic growth when only adding investment growth in cities in the YRD. Model (2) was used to estimate the impact on urban economic growth when only adding investment growth in other cities across the country. Model (3) was used to estimate the impact on urban economic growth when only adding Shanghai’s investment growth. Models (4) to (6) combine investment growth in cities in the YRD, investment growth in other cities across the country, and Shanghai’s investment growth to estimate the impact of different combinations on urban economic growth. Model (7) comprehensively considers the investment growth of cities in the YRD, the investment growth of other cities in the country, and Shanghai’s investment growth, and estimates the impact on urban economic growth.
In general, after controlling other influencing factors, the growth of investment in cities both outside and within the urban agglomeration had a significant effect on economic growth. The faster the investment grows within and outside the urban agglomeration, the faster the economy grows. However, the coefficient of the investment growth rate within the urban agglomeration was larger, and compared with that outside the urban agglomeration, the promotion effect on urban economic growth was more obvious. In addition, the growth of urban investment of the core city (Shanghai) in the urban agglomeration did not significantly improve urban economic growth.
Specifically, the core explanatory variable of model (1) was the growth of urban investment within the urban agglomeration, and the result was positive and significant, indicating that, in general, the investment growth within the YRD region had driven the urban economic growth. The faster the investment grows within the urban agglomeration, the faster the urban economy grows. Models (2) and (3) test the investment growth in other cities across the country and the investment growth of Shanghai separately. The results showed that the investment growth variable in other cities across the country was significant, while the investment growth variable in Shanghai was not significant, and did not affect other variables significantly. The results showed that the investment growth in other cities outside the urban agglomeration had a significant impact on the urban economic growth, but the investment growth of the core city did not have a significant impact on the urban economic growth. Model (4) combined the investment growth of other cities in the country and the investment growth of Shanghai to test joint effects; Model (5) combined the investment growth of the YRD cities and the investment growth of Shanghai to test joint effects. The results showed that the investment growth of the YRD cities and the investment growth of other cities in the country were still positive and significant, and the variable of Shanghai’s investment growth was not significant, which further indicates that the investment growth of the core city cannot significantly improve economic growth in urban agglomerations. Model (6) was used to test the combined effect of the investment growth of other cities in the country and the investment growth within the YRD region. The results showed that both variables were positive and significant, with coefficients of 0.039 and 0.029, respectively, and the investment growth coefficient of the YRD cities was bigger than that of other cities in the country, indicating that the growth of internal investment in the YRD region had a bigger effect on urban economic growth, compared with the effect of investment growth in other cities across the country. Model (7) showed that when considering the growth of internal investment in the urban agglomeration, external investment, and investment growth of the core city at the same time, the driving function of internal investment growth in the YRD region and investment growth in other cities across the country was verified again, and the former exerted a more significant impact than the latter, and the coefficients of 0.053 and 0.032, respectively, passed the significance test at the level of 10% and 5%. In Model (1), R2 was improved to a certain extent. At this time, if the investment growth of cities in the YRD increases by 10%, the urban economy will grow by 0.53%; if the investment growth of other cities across the country increases by 10%, the urban economy will grow by 0.32%.
From the above analysis, it can be seen that the investment growth within the YRD region had a significant positive effect on urban economic growth, and the effect was greater than the investment growth of cities outside the urban agglomeration, which also showed that increasing urban connections and industries within the urban agglomeration investment could significantly drive urban economic growth. In addition to investment growth, the following table also measured the impact of other factors on urban economic growth. The initial economic development level was significant in the model, passed the significance test at the level of 1%, indicating that cities with lower initial economic development levels had faster economic growth, and there was a conditional convergence. The estimated coefficient of labor force was also significantly positive, indicating that the improvement of the labor factor had a greater contribution to the urban economic growth. Foreign direct investment not only brought employment opportunities to cities, but also facilitated technology spillovers, so it had a positive effect on urban economic growth. Fixed asset investment accounts for a relatively high proportion of GDP, which could drive the construction of various urban infrastructure and significantly promote economic growth. Other variables such as urbanization rate, public service quality, and human capital did not exert a significant impact on economic growth.
4.3. Robustness Test Results
The interaction between cities in the YRD region would have a certain spatial autocorrelation, so this paper adopted a spatial panel model for further analysis. On the one hand, the spatial panel model could solve the estimation bias caused by the fixed-effect model ignoring spatial correlation and omitting spatially correlated variables to a certain extent. On the other hand, the estimation results of the spatial panel model can also be regarded as the robustness of the previous two models’ test to verify whether the model estimation results and conclusions drawn in this paper were robust and reliable. By calculating the global Moran’s index of the four-period data and testing the Moran’s index, the paper found that the Moran’s index of the economic growth rate variable was positive in 2005–2010, 2010–2015, and 2015–2020, and the Moran’s index in 2005–2010 and 2010–2015 strongly rejected the null hypothesis of “no spatial autocorrelation”, which showed that there was spatial autocorrelation in the economic growth rate in a certain period. Therefore, the robustness test of the models in
Table 2 was carried out, and the results of the SAR model were found to be better after comparison, so this study adopted the results of the SAR model. Similarly, before the spatial regression analysis, it was necessary to perform the Hausman test to decide on the selected panel regression model. The Hausman test showed that a fixed-effects spatial error model should be used. Using Stata software, the spatial error model regression was performed on the data, and the results are shown in the following table.
Compared with
Table 2,
Table 3 showed that the results of the spatial econometric analysis were basically unchanged. The investment growth of cities in the YRD and across the country were still positive and significant to the GDP growth rate, and the coefficients 0.053 and 0.032, respectively, passed the significance test at the level of 5% and 1%, and the positive effect of investment growth of cities in the YRD was greater than the that of cities across the country. The initial economic level was negative and significant, and variables such as the proportion of labor force, the proportion of foreign direct investment, and the proportion of fixed-asset investment still had a positive and significant effect. From the above results, even considering the spatial interdependence between different cities, the growth of investment within the YRD region played a relatively stable role in the long-term economic growth process of a city.
5. Conclusions and Discussion
5.1. Conclusions
This paper discussed the impact and role of agglomeration externalities and network externalities on urban development. Taking 41 cities in the YRD region as the research object, it analyzed the spatial pattern of GDP growth rate of urban agglomeration cities, Shanghai’s investment growth rate, the investment growth rate of cities in the YRD, and the investment growth rate in other cities across the country, and examined the impact of both network externalities and agglomeration externalities on urban economic development at the scale of urban agglomerations. The results of this study show that:
From 2000 to 2010, the average GDP growth rate of cities in the YRD region showed a rapid growth trend, but it began to slow down after 2010. The economic growth of cities in the YRD region presents an outward spatial pattern. In the early stage, it was mainly concentrated in the core area formed by 16 cities including Shanghai. In 2010, the economic growth rate of cities in northern Anhui, northern Jiangsu, and southern Zhejiang began to accelerate, entering the stage of rapid development.
From 2000 to 2020, the growth rate of Shanghai’s investment to the cities in the YRD showed a downward trend and an outward spatial diffusion. The growth rate of Shanghai’s investment to its surrounding cities began to decrease. On the contrary, the investment quota from Shanghai outside the surrounding area had gradually increased. The growth rate of investment within the YRD region showed a slowing trend from 2000 to 2015, and increased after 2015, showing a spatial distribution from northwest to southeast. From 2000 to 2020, the growth rate of investment from other cities in the country to cities in the YRD region showed a continuous upward trend, and spatially formed a distribution characteristic from northwest to southeast.
From the perspective of long-term economic growth, the growth of internal investment in the YRD region and the growth of investment in other cities across the country could promote urban economic growth, and the growth of internal investment in the YRD region had a greater role in promoting economic growth than that of other cities across the country. Both “agglomeration externalities” and “network externalities” at the urban agglomeration scale promoted urban economic growth, but the role of “agglomeration externalities” within urban agglomerations were more obvious. The possible explanation was that a relatively complete regional division of labor network had basically been formed within the YRD, and the investment growth of other cities outside the urban agglomeration had a less obvious promoting effect on the urban economic growth than the investment growth within the urban agglomeration. The side confirmed that promoting the regional integration process of the YRD could promote the economic development of cities within the urban agglomeration. This provided economic scientific support for the integrated development strategy of the YRD region. It was necessary to continue to deepen the process of internal integration of the urban agglomeration. Through the mutual radiation function between cities, the agglomeration effect within the urban agglomeration could be exerted, and the economic growth of large, medium, and small cities within urban agglomerations could be promoted.
The investment of the core city, Shanghai, did not play a significant role in the long-term economic growth of other cities in the region. Regardless of whether the impact of the investment of the core city or that of other cities outside the urban agglomeration on urban economic growth were considered alone, and whether the role of several factors was collectively considered at the same time, the results only found that promoting effect of investment growth within the urban agglomeration and that of other cities outside the urban agglomeration on urban economic growth. The possible explanation for this was that the core city of Shanghai had a promotion effect on the economic radiation to its surrounding cities or cities within a certain distance, but from the YRD region as a whole, the economic radiation of Shanghai was limited.
Different from analyzing the impact of network externalities and agglomeration externalities at the urban scale, this paper further extends the urban scale analysis to the urban agglomeration scale analysis and tests the YRD region as an empirical object. The research results showed that both “network externalities” and “agglomeration externalities” at the scale of urban agglomerations could significantly promote urban economic growth, and the promoting role of urban investment within urban agglomerations was more obvious, which provided scientific support for the integrated development of the YRD region.
5.2. Discussion
With the continuous development of economic globalization and regional integration, urban agglomerations have become important spatial and regional units for countries to participate in global competition and international division of labor, and have profoundly affected the new political and economic pattern over the world. From the research results of the article, strengthening inter-city connections within urban agglomerations can promote urban economic development and help urban agglomerations become regional growth centers and innovation centers. In the future, in the process of regional integration in the YRD, it is necessary to strengthen the economic and social ties between the cities in the urban agglomeration, and improve the level of integrated development in the fields of deep industrial co-ordination, cultural system identification, infrastructure interconnection, ecological environmental protection, and public service sharing, and realize higher-quality integrated development of urban agglomerations.
Overall, this paper measures the impact of network externalities and agglomeration externalities on urban development at the scale of urban agglomeration, but further improvement could be conducted: (1) To expand the spatial dimension of the research samples. This paper selects the YRD region as the case, and the applicability to other urban agglomerations needs to be expanded. In the future, it is necessary to conduct extended research on a larger spatial scale to make up and improve the conclusions of this paper. (2) In this paper, only 41 prefecture-level cities within the urban agglomeration are selected for research. In the future, it will be considered at the county level. The results at the district and county levels need to be further verified. (3) This paper selects 2000–2020 as the research period, which may produce heterogeneous results upon different period selection. In the future, it is necessary to extend the research on longer time periods. (4) Since the YRD region is closely connected with other regions and cities in the world, the follow-up will obtain and use international investment data, incorporate international investment variables, and analyze its impact on urban economic development.


