Article

Spatiotemporal Dynamics of Grasslands Using Landsat Data in Livestock Micro-Watersheds in Amazonas (NW Peru)

by
Nilton Atalaya Marin
1,
Elgar Barboza
1,2,
Rolando Salas López
1,
Héctor V. Vásquez
1,2,
Darwin Gómez Fernández
1,
Renzo E. Terrones Murga
1,
Nilton B. Rojas Briceño
1,3,
Manuel Oliva-Cruz
1,
Oscar Andrés Gamarra Torres
1,
Jhonsy O. Silva López
1,* and
Efrain Turpo Cayo
4
1
Instituto de Investigación para el Desarrollo Sostenible de Ceja de Selva (INDES-CES), Universidad Nacional Toribio Rodríguez de Mendoza de Amazonas (UNTRM-A), Chachapoyas 01001, Peru
2
Dirección de Desarrollo Tecnológico Agrario, Instituto Nacional de Innovación Agraria (INIA), Av. La Molina 1981, Lima 15024, Peru
3
Instituto de Investigación en Ingeniería Ambiental (IIIA), Universidad Nacional Toribio Rodríguez de Mendoza de Amazonas (UNTRM-A), Chachapoyas 01001, Peru
4
Programa de Doctorado en Recursos Hídricos (PDRH), Universidad Nacional Agraria La Molina, Ave. La Molina, S.N., Lima 15012, Peru
*
Author to whom correspondence should be addressed.
Land 2022, 11(5), 674; https://doi.org/10.3390/land11050674
Submission received: 29 March 2022 / Revised: 27 April 2022 / Accepted: 27 April 2022 / Published: 1 May 2022

Abstract

:
In Peru, grasslands monitoring is essential to support public policies related to the identification, recovery and management of livestock systems. In this study, therefore, we evaluated the spatial dynamics of grasslands in Pomacochas and Ventilla micro-watersheds (Amazonas, NW Peru). To do this, we used Landsat 5, 7 and 8 images and vegetation indices (normalized difference vegetation index (NDVI), enhanced vegetation index (EVI) and soil adjusted vegetation index (SAVI). The data were processed in Google Earth Engine (GEE) platform for 1990, 2000, 2010 and 2020 through random forest (RF) classification reaching accuracies above 85%. The application of RF in GEE allowed surface mapping of grasslands with pressures higher than 85%. Interestingly, our results reported the increase of grasslands in both Pomacochas (from 2457.03 ha to 3659.37 ha) and Ventilla (from 1932.38 ha to 4056.26 ha) micro-watersheds during 1990–2020. Effectively, this study aims to provide useful information for territorial planning with potential replicability for other cattle-raising regions of the country. It could further be used to improve grassland management and promote semi-extensive livestock farming.

1. Introduction

Worldwide, there are more than 4.1 billion ha of grasslands, representing 40% of the Earth’s surface [1]. Grasslands are among the main terrestrial ecosystems that provide numerous ecosystem services [2,3]. Among them, these services include the capture of carbon dioxide (7.7 t CO2/ha) [4], maintenance of nutrient levels in the soil in the long term [5], protection against wind erosion, sand fixation and water conservation [6]. In addition, grasslands are the source of goods and services for the population and provide food, fodder and energy for livestock [7]. Pastures and similar plants are the dominant vegetation in all grasslands that provide a large amount of biomass underground [3].
The degradation of grassland vegetation during the last 50 years [8] has been related to the increase in the number of cattle that consume 3.9 billion ha of pasture [9]. It is estimated that in the next 10 years, the carrying capacity will vary from 2 to 0.5 cows/ha [10], which will contribute to the development of an important conflict between the area of pasture and the number of livestock [11]. However, the increase in livestock demands an increasing amount of new pasture plots that contribute to the loss of vegetation cover [12] and soil fertility [13]. Other factors, such as climate, forest fires and grazing, affect the composition, structure and functioning of grasslands [3]. In the Americas, approximately 1.5 million ha were lost from 2014 to 2015 [14] and 650 million ha have been degraded [10]. As less than 10% of grasslands are protected and have rarely been a target in international conservation agendas, they have been undervalued, and little has been invested to calculate the benefits they provide for people and nature [15].
Understanding the spatiotemporal dynamics of grasslands is important to promote better territorial governance, optimization of goods and services of regulation, support and provisioning [16]. The monitoring of grassland conditions through remote sensing data requires regularity and temporal quality to generate cartographic results of the vegetative development scenario affected by phenological dynamics and the long-term effects of global vegetation change trends [17,18]. In this sense, the use of remote sensing technologies is proving to be a promising tool to support the efficient management of permanent grasslands through the provision of information about the botanical composition, structure, phenology, quantity and quality [19,20,21]. In recent years, the increasing availability of satellite data, as well as the development of the new algorithms and cloud computing platforms used to analyze them, has allowed the generation of products that are capable of capturing more detail on a planetary scale [22,23]. For example, the use of sensors such as Advanced Very High Resolution Radiometer (AVHRR) and Moderate-Resolution Imaging Spectroradiometer (MODIS) have allowed the spatiotemporal analysis of large extensions of grasslands [24,25]. However, these products present limitations for evaluating small areas, due to their low spatial resolution (greater than 250 m) [26]. In this context, the processing of remote sensing data is an important requirement to generate specific spatial information with adequate scientific quality for medium- and long-term monitoring at different scales [27]. Additionally, the use of higher spatial resolution optical sensors such as Sentinel (~10 m) and Landsat (~30 m) are used to assess grasslands [28,29,30].
In the mapping of different grassland areas in the world, images from the Landsat sensor have been used through automated classification and in the cloud computing platform Google Earth Engine (GEE) [31,32]. Additionally, Sentinel satellite images have been used to evaluate the quality of pastures for management and conservation purposes using partial least squares (PLS) regression models [33]. Other studies applied the automatic classification method (random forest) of MODIS images for the evaluation of the spatial dynamics and occupation of grasslands [17,25].
In recent decades, the use of remotely sensed vegetation indices has been widely used for crop phenological assessment, vegetation classification, water resources and ecosystem monitoring [34,35,36,37]. Vegetation indices are the arithmetic combination of two or more bands of different reflectance of the red and near-infrared spectrum with various spectral resolutions [38]. The normalized difference vegetation index (NDVI) [39] is one of the most widely used indices worldwide. Among its advantages, it helps to reduce noise caused by changes in sun angles, topography, clouds or shadows, and atmospheric conditions [34,38]. However, this index is affected at higher biomass levels due to variations in canopy cover [40]. To overcome these drawbacks, alternative indices such as the Enhanced Vegetation Index (EVI) [41], and the Soil Adjusted Vegetation Index (SAVI) have been used [42]. The EVI reduces these errors and improves biomass estimation by correcting for the adverse effects of environmental factors, such as atmospheric conditions and soil background [38,43]. In addition, SAVI is used to correct for the influence of ground gloss in areas where vegetation cover is low, which improves the topographic effect [42].
The evaluation of the phenological response has been through the use of time series of Landsat, Sentinel and MODIS images through the application of spectral indices such as NDVI, EVI and SAVI. Likewise, several studies developed classification approaches to map pastures and other land uses using multiple sensors, platforms and automatic classification algorithms in different regions of the world, such as in Brazil [25,31], the United States [1] and other regions [22,44,45,46]. Despite some previous work in Peru [47,48,49,50] regarding livestock micro-watersheds, the absence of pasture maps limits the spatiotemporal analysis of pastures and their implications for territorial, economic and environmental dynamics.
Considering the dynamics of agricultural land use in Peru, grasslands are an important asset for the country, which covers 18 million ha of natural pastures and can be used as land reserves and as food for the 2.3 million agricultural units [51]. At the national level, more than 60% of high Andean grasslands are in the process of degradation [52] due to overgrazing, fires and inadequate management [53,54]. In this context, due to the importance of grasslands for the development of anthropogenic activities (livestock, poultry and others) and the ecosystem services they provide, grasslands represent a valuable resource for humans. Therefore, this study aimed to evaluate the spatial dynamics of grasslands in the livestock micro-watersheds of Pomacochas and Ventilla through the use of Landsat images in the GEE platform. Furthermore, and based on the results, inter-annual pasture maps are generated for two of the main micro-basins of the Amazon region with potential replicability for other cattle-raising regions of the country.

2. Materials and Methods

2.1. Study Area

Amazonas is located in northern Peru, with an approximate area of 39.25 km2 and an altitudinal gradient that extends from 120 to 4900 m.a.s.l. from north to south [27]. Four types of ecosystems can be identified: (i) lowland forest, (ii) tropical dry forest, (iii) Andean forests and grasslands and (iv) high forest or yunga, and these ecosystems are distributed from north to south with high biophysical diversity. Agriculture and livestock are the main economic activities and occupy 20.24% and 4.66% of the surface of the Amazon, respectively [55,56]. Four areas dedicated to livestock have been identified: (1) Pomacochas—Jumbilla (Bongará), (2) Molinopampa (Chachapoyas)—Mendoza (Rodríguez de Mendoza), (3) Leimebamba (Chachapoyas) and (4) Chiriaco. The first three are located in areas with a temperate climate at altitudes above 2000 m.a.s.l., where dairy cattle and improved breeds predominate [57]. In the last zone, cattle predominate and the climate is warm and humid [58].
The areas of Molinopampa and Pomacochas are located in the provinces of Chachapoyas and Bongará, respectively, where we find the livestock micro-watersheds of Ventilla (Molinopampa) and Pomacochas (Figure 1). Livestock feeding is based on managed grasslands (combined with silvopastoral systems and forages) and natural grasslands, and there is an open field and semi-intensive rearing system [56,59,60]. Natural grasslands are intended for grazing and have been formed on areas of open primary forest to install crops [47]. However, as a result of poor agricultural practices, deforestation, infrastructure construction and overgrazing, these ecosystems are being degraded [27,47,56,60]. To date, neither the exact surface extent of the grasslands of these micro-watersheds nor their spatiotemporal dynamics are known; therefore, the present study was developed.

2.2. Methodological Design

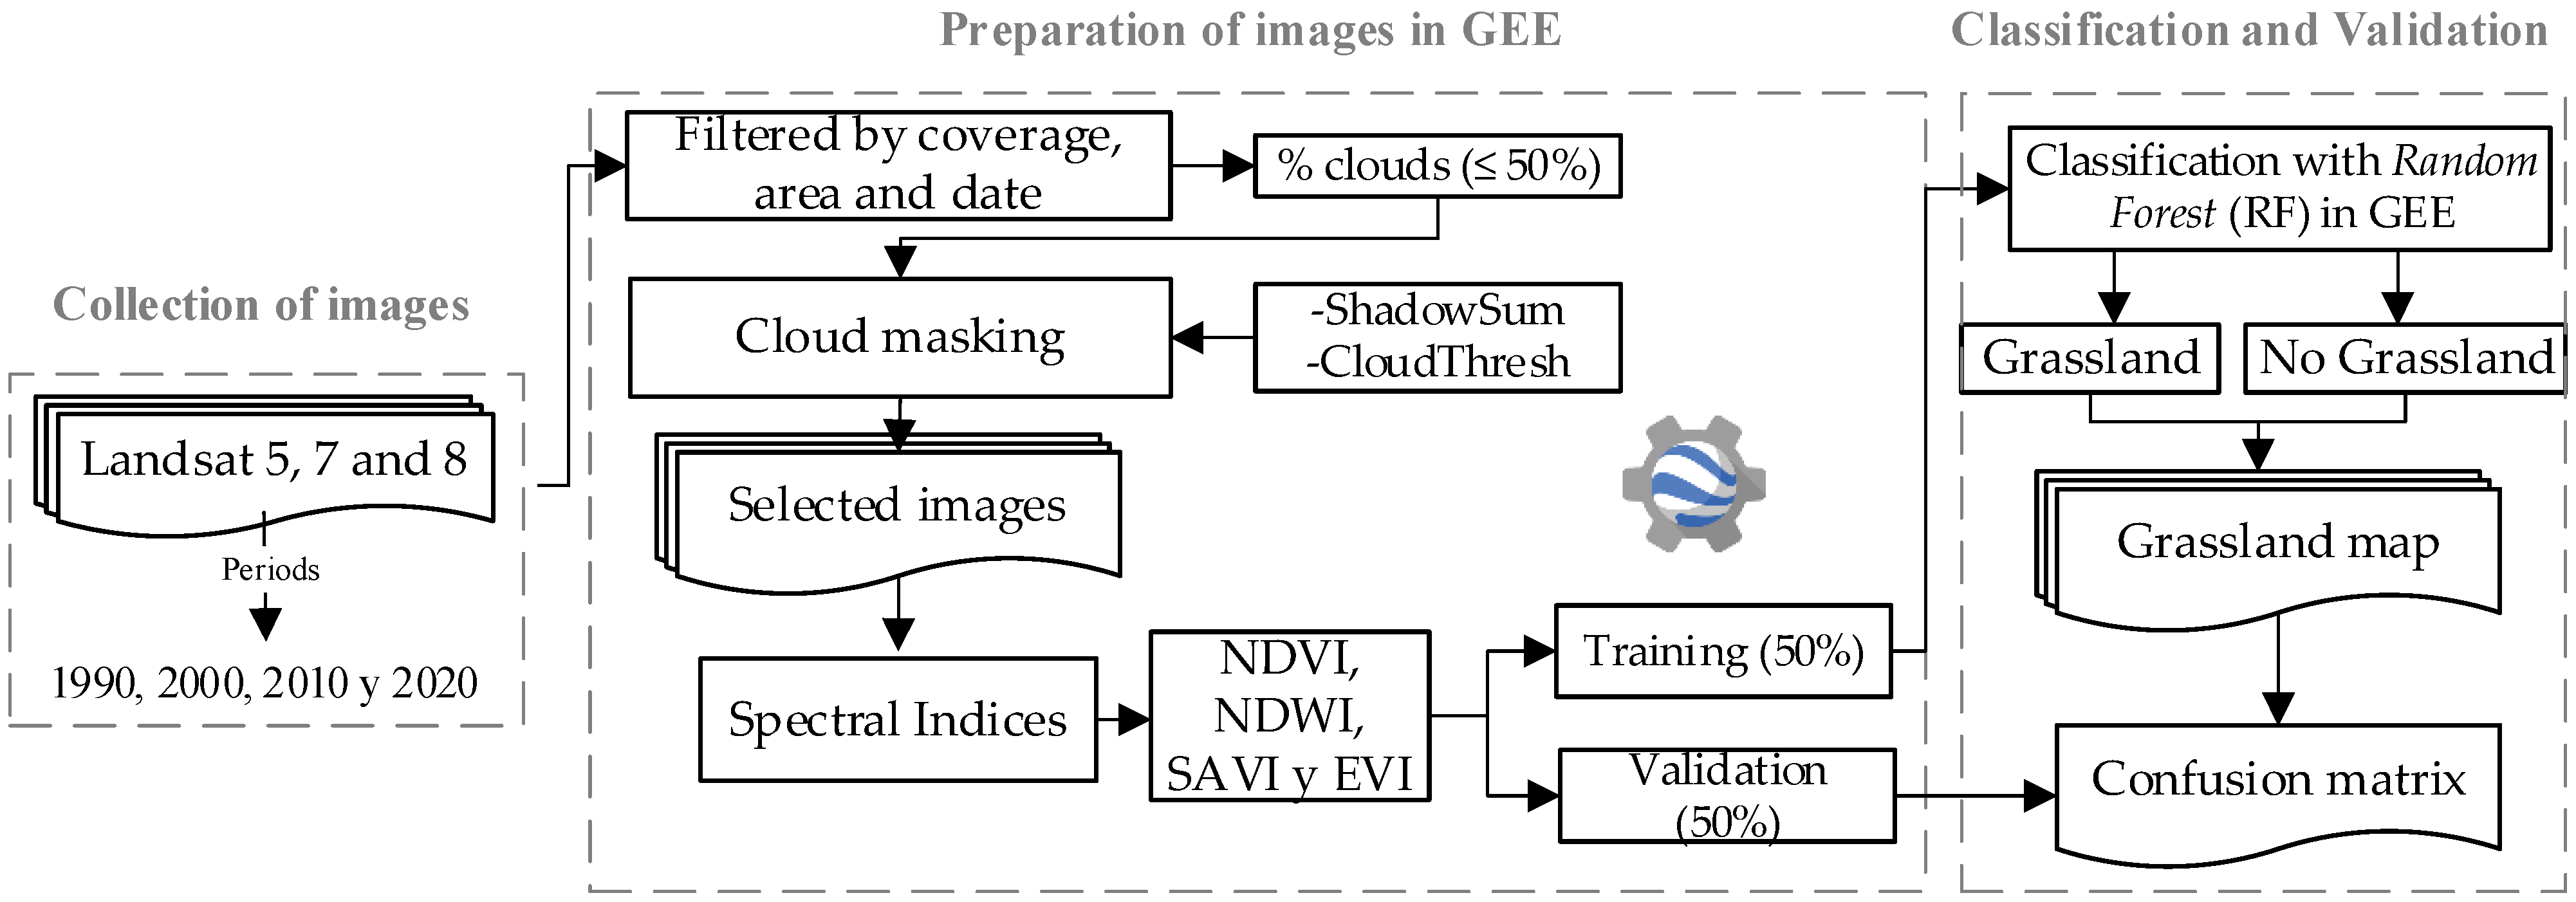
Figure 2 shows the flow diagram used to evaluate the spatial dynamics of grasslands using Landsat data in the livestock micro-watersheds of Amazonas (Peru). In summary, the temporality of the satellite images was determined, and then the images were processed using Remote Sensing (RS) and Geographic Information Systems (GIS). The thematic accuracy and intensity of changes were evaluated in different evaluation periods. Subsequently, in a GIS environment, the areas of loss and increase of grasslands in the study area were identified.

2.3. Spatial Input Data

There are several products available that enable the identification of grasslands for different areas of the world. In this study, we used optical data available on the GEE platform. Among them, the multispectral Landsat images available from the Center for Geological Studies of the USA (USGS) of Landsat 5, 7 and 8 that cover the study area from 1984 to date were compiled on the GEE platform [46]. Landsat Collection 1 Level 1 and Tier 1 are surface reflectance (SR) products with orthorectification and 30 m spatial resolution in spectral bands are suitable for comparison and multitemporal detection of changes [61,62]. The acquisition of the images included the mosaic of the years 1990, 2000, 2010 and 2020. The annual collections had a spatial resolution of 30 m (Table 1), a maximum cloudiness of 50% and spectral bands [63].

2.4. Preprocessing

The first processing step was to build annual mosaics of cloudless Landsat images. For this purpose, cloud mask were applied using the C Mask function (CFMASK) Algorithm [64], Temporal Dark Outlier Mask (TDOM) [65], cloud masking and Band Quality Assessment (BQA) information available in the Landsat Collection. Annual mosaics of images were then generated by applying statistical reducers using mathematical functions in GEE such as median, maximum and minimum [63]. Subsequently, three vegetation indices were applied based on reflectance data of the Near-Infrared (NIR), red, blue and green bands (Table 2). Specifically, the NDVI, SAVI and EVI are related to the greenness of the vegetation and help identify the vegetation cover [46]. In addition, the index NDWI [66] was used to delineate the characteristics of the water bodies present in the study area.
The first processing step was to build annual mosaics of cloudless Landsat images. To do this, cloud masks were applied using the C Function Mask (CFMASK) algorithm [48] and applied the Temporary Dark Outlier Mask (TDOM) cloud masking and Band Quality Assessment (BQA) information available in the Landsat Collection. Annual mosaics of images were then generated by applying statistical reducers using mathematical functions in GEE such as median, maximum and minimum.
The NDVI defines the vegetation cover with the difference in visible and near-infrared reflectance and is widely used for the monitoring of vegetation dynamics at different scales [67,68]. Again, the EVI was developed to optimize the vegetation signal with improvements in sensitivity in regions with high biomass and vegetation, which allows the monitoring of vegetation and reduces the atmospheric influence [69]. Additionally, SAVI is applied in the analysis of the vegetation in stages of initial growth or dispersed vegetation with exposure of the terrestrial surface [70,71].

2.5. Classification of Satellite Images

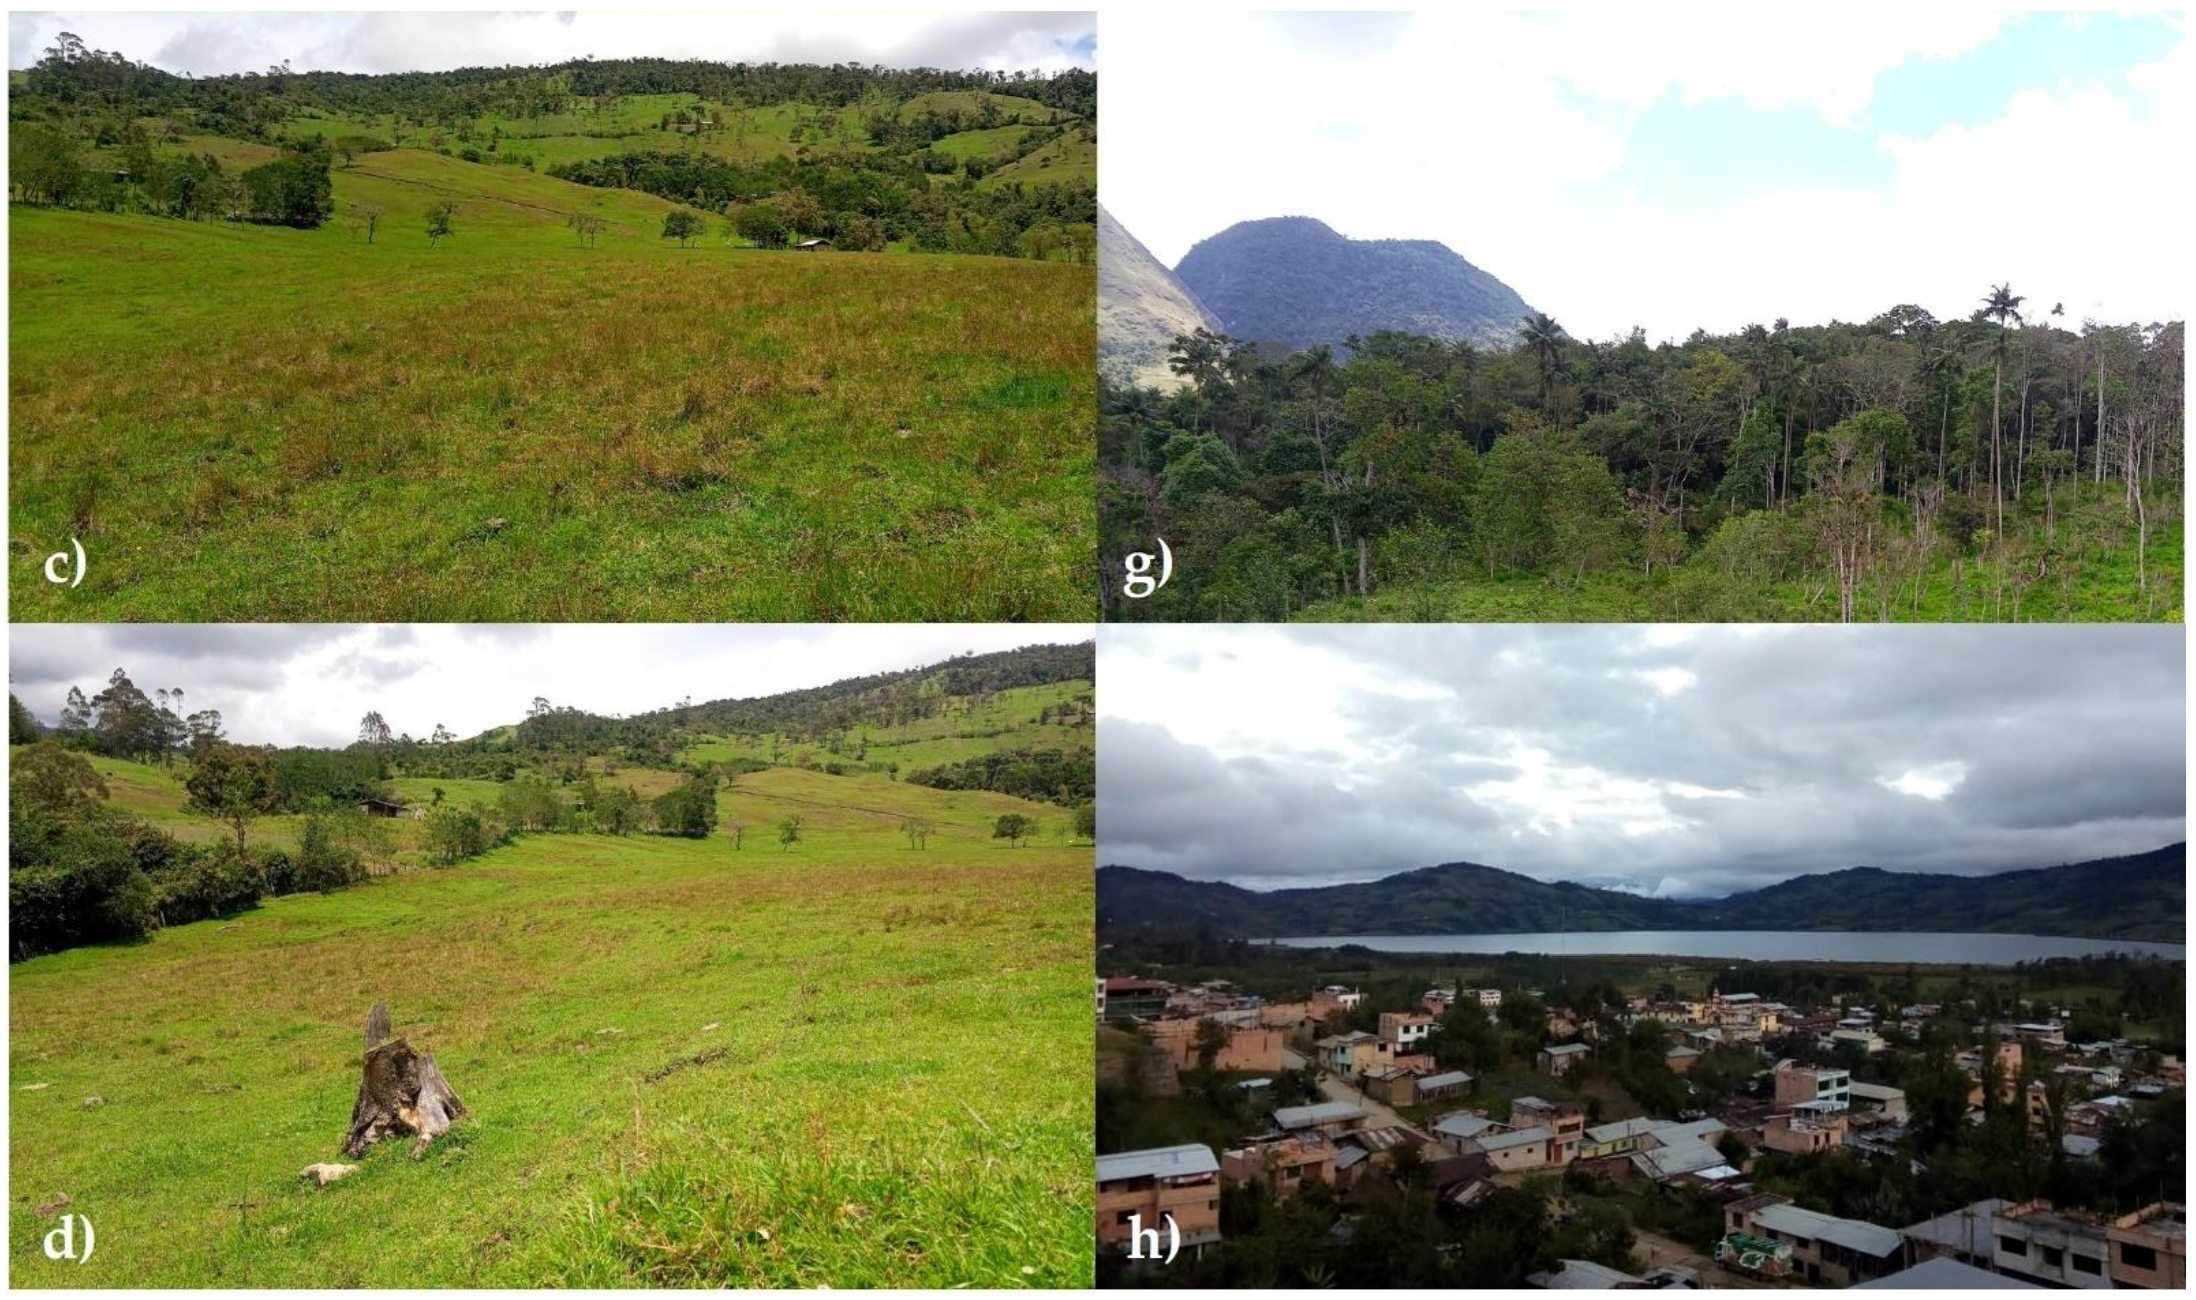
For the classification, field training data were collected from the “grassland” and “non-grassland” classes through the use of a Global Navigation Satellite System (GNSS) receiver and photographic records (Figure 3) [46,62]. The grassland mapping was based in annual mosaics and the application of supervised classification. The approach used several spectral responses during one year and the best images were considered (without clouds and without cloud shadows) [25].
The classification approach used random forest (RF), an algorithm that considers the combination of predictors of decision trees based on a majority vote to choose a final class [72]. Multiband images were created that included the NDVI, SAVI and EVI that improved the performance of the image classification algorithms by identifying the grassland and non-grassland classes in GEE [73]. The results of the classification, with the probability per pixel of the grassland and non-grassland classes, were exported to Google Drive. These data were downloaded to a local workstation and combined to produce interannual grassland maps for the two micro-watersheds. To improve the classified maps, the images were visually compared in RGB combination with the classified map of each year of analysis [74]. The pixels of date one were considered as a reference to correct the pixels in date 2, in addition to identifying possible classification errors and discarding pixels in bodies of water and other uses. Finally, for all grassland maps, a minimum mappable area of 0.5 ha was used [75].
The final maps of pastures were evaluated using 3648 points randomly distributed equally in the classes of pastures and non-pastures assuming a precision error of 2% within a confidence interval of 96% [62,75]. The points were visually inspected for each year. The use of these points allowed calculation of the User Accuracy (UA), which corresponds to commission errors (from the user’s perspective), and the Producer’s Accuracy (PA), which is associated with omission errors (from the producer’s perspective) (Tables S1 and S2). In addition, the Global Accuracy (GA) and the Kappa index (k) were estimated [62,76].

2.6. Intensity of Changes and Transition Matrices

The intensity of the changes in each class was determined for each period analyzed (1990–2000, 2000–2010 and 2010–2020) [77], and cross-tabulation matrices were constructed to quantify the loss or gain of each class [62,78]. Finally, the annual rate of change proposed by the FAO (2001) was calculated in Equation (1):
s = ( S 2 S 1 ) 1 t 2 t 1 1

3. Results

3.1. Grassland and Non-Grassland Maps

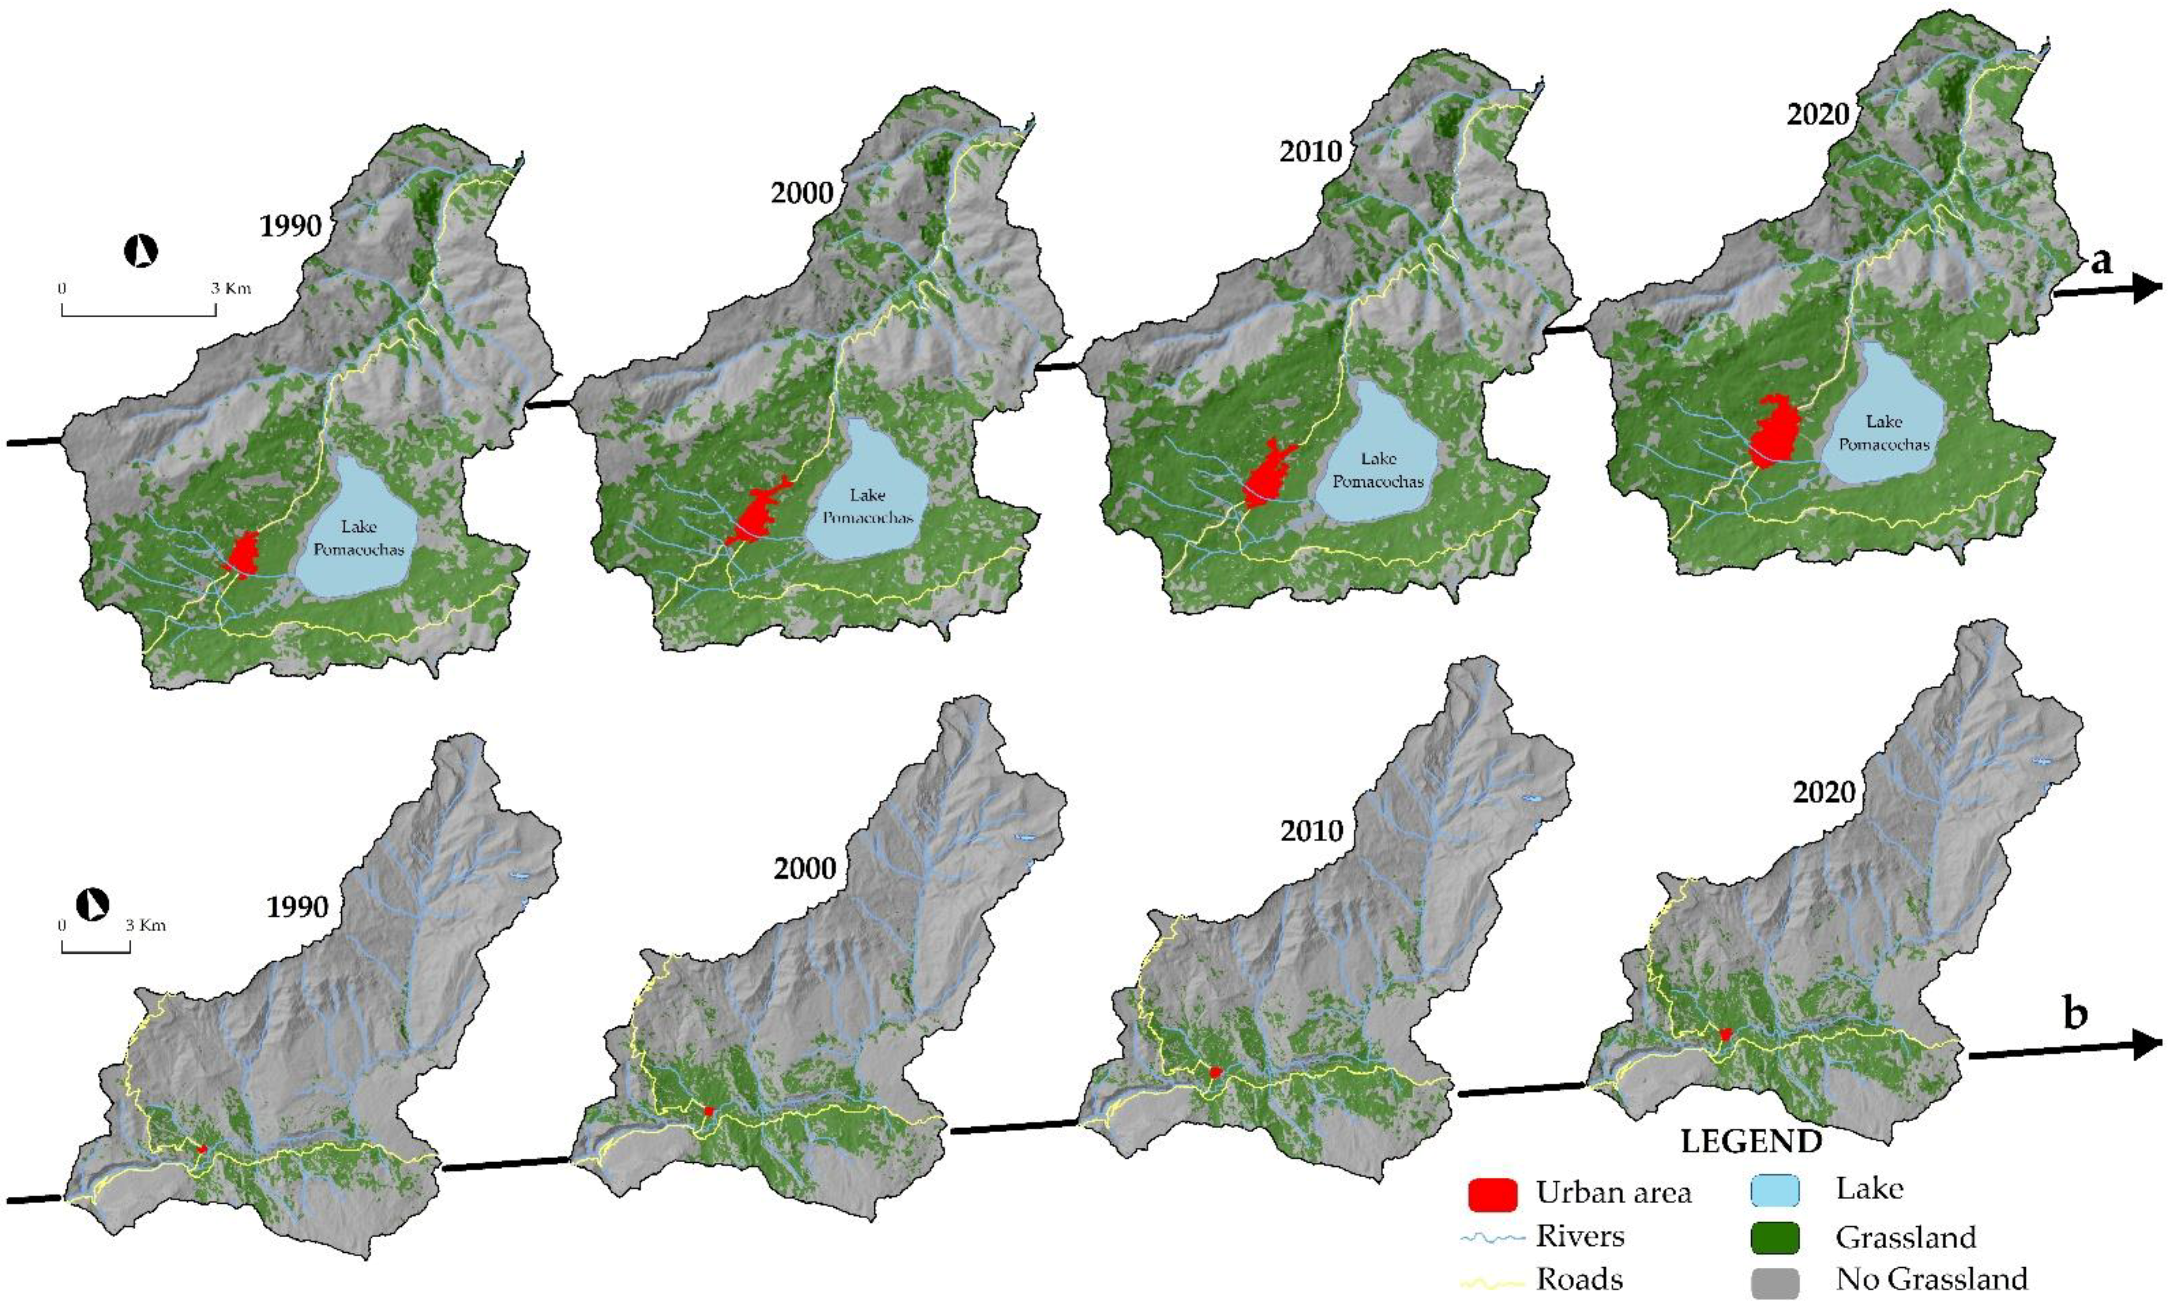
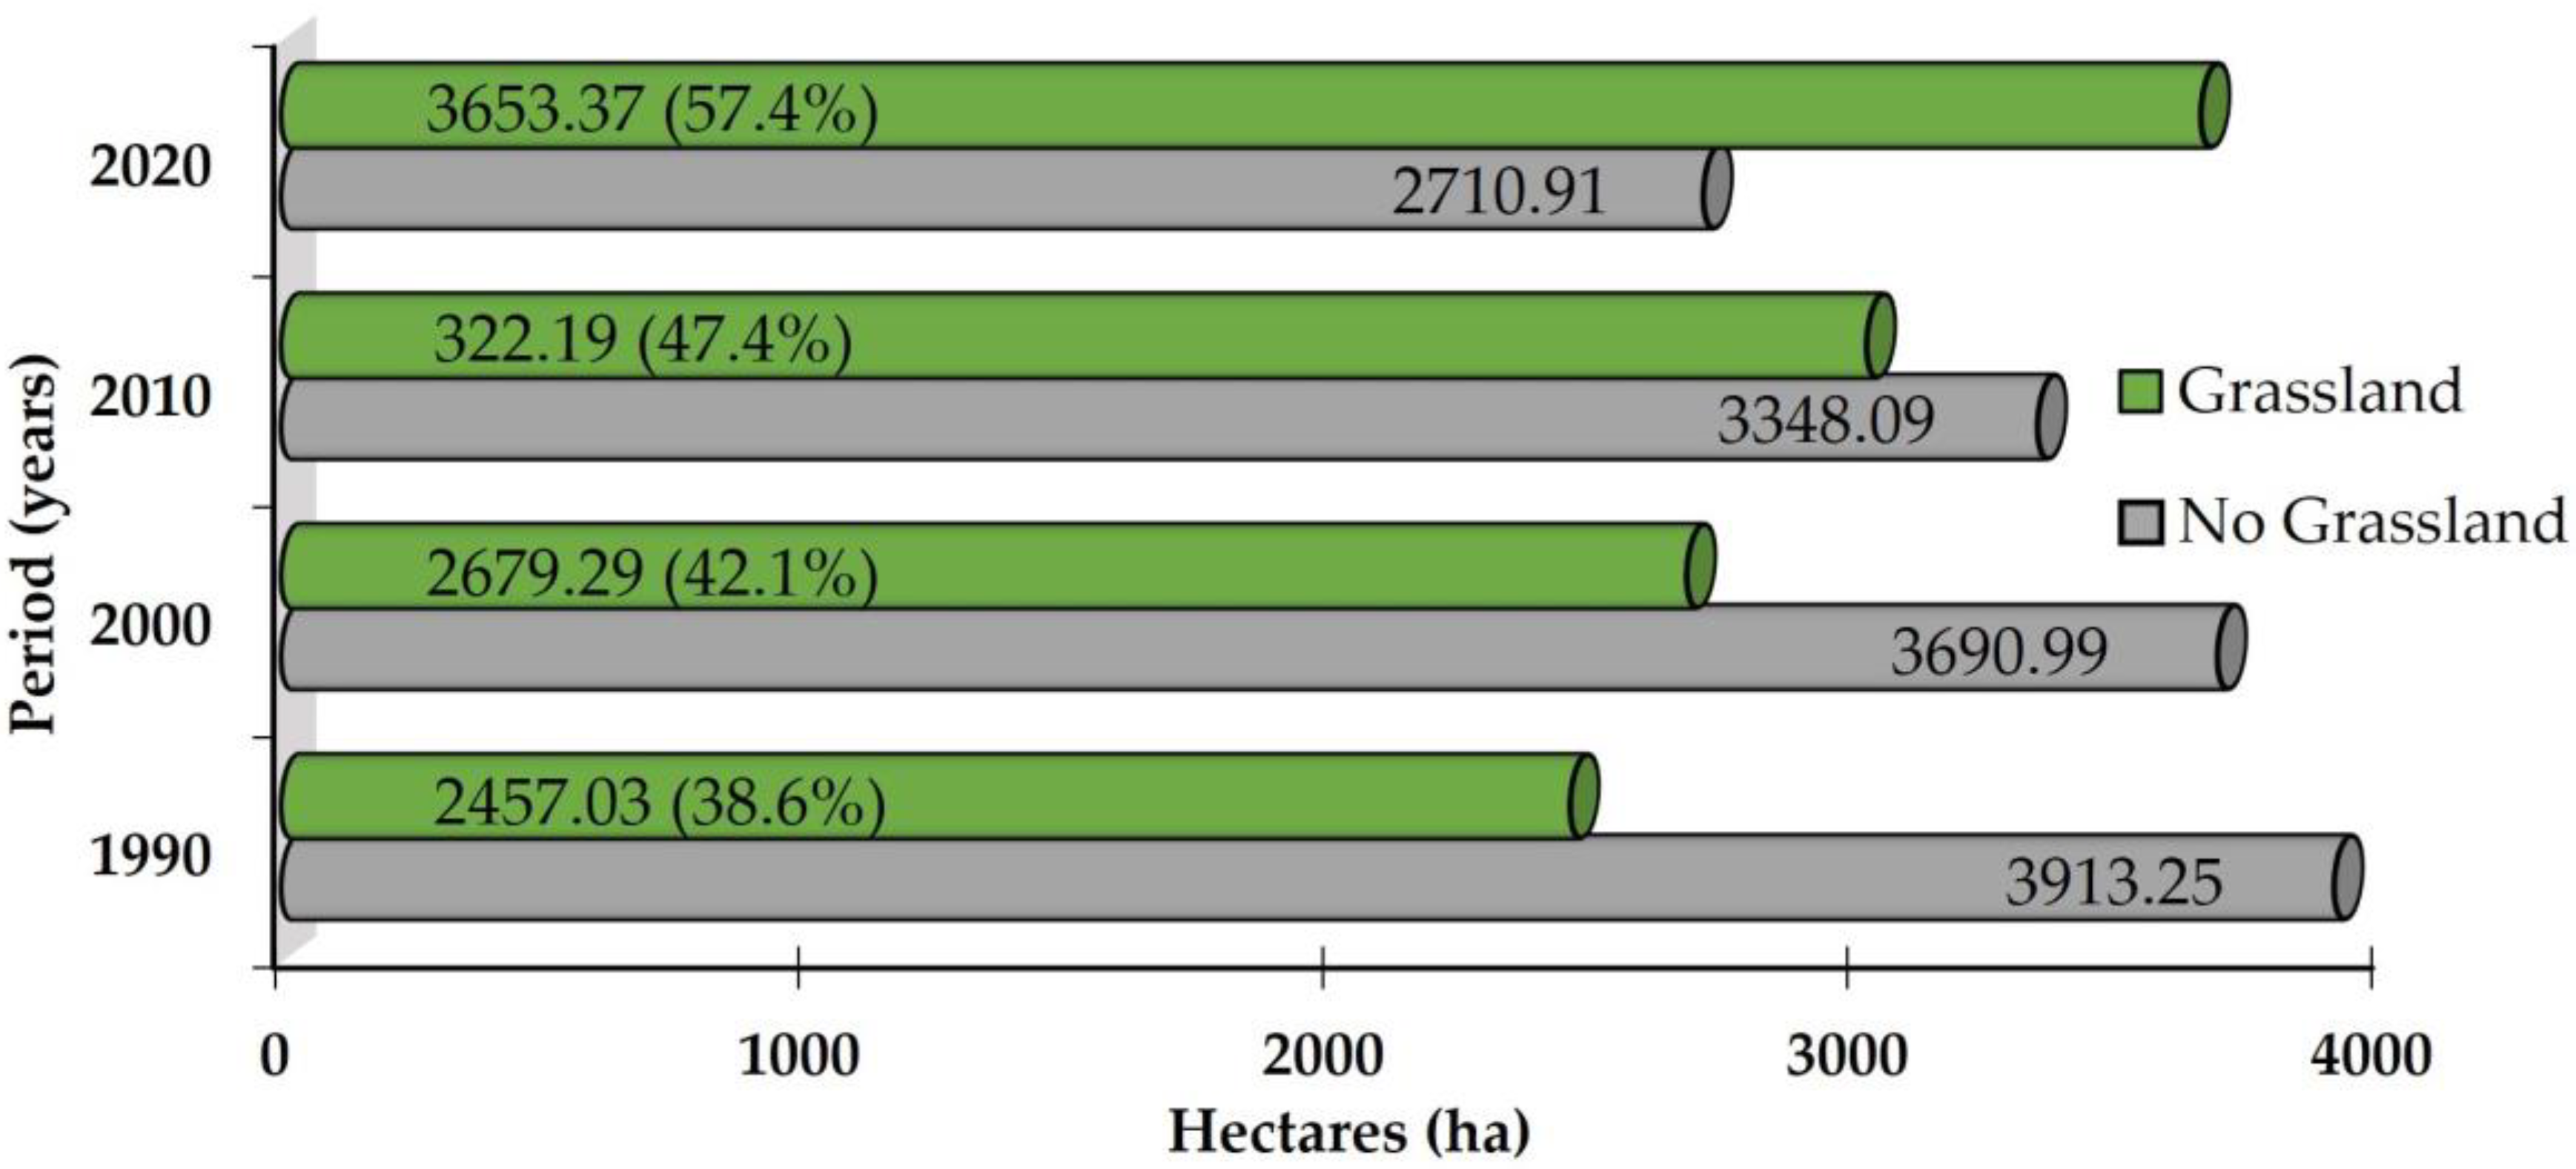
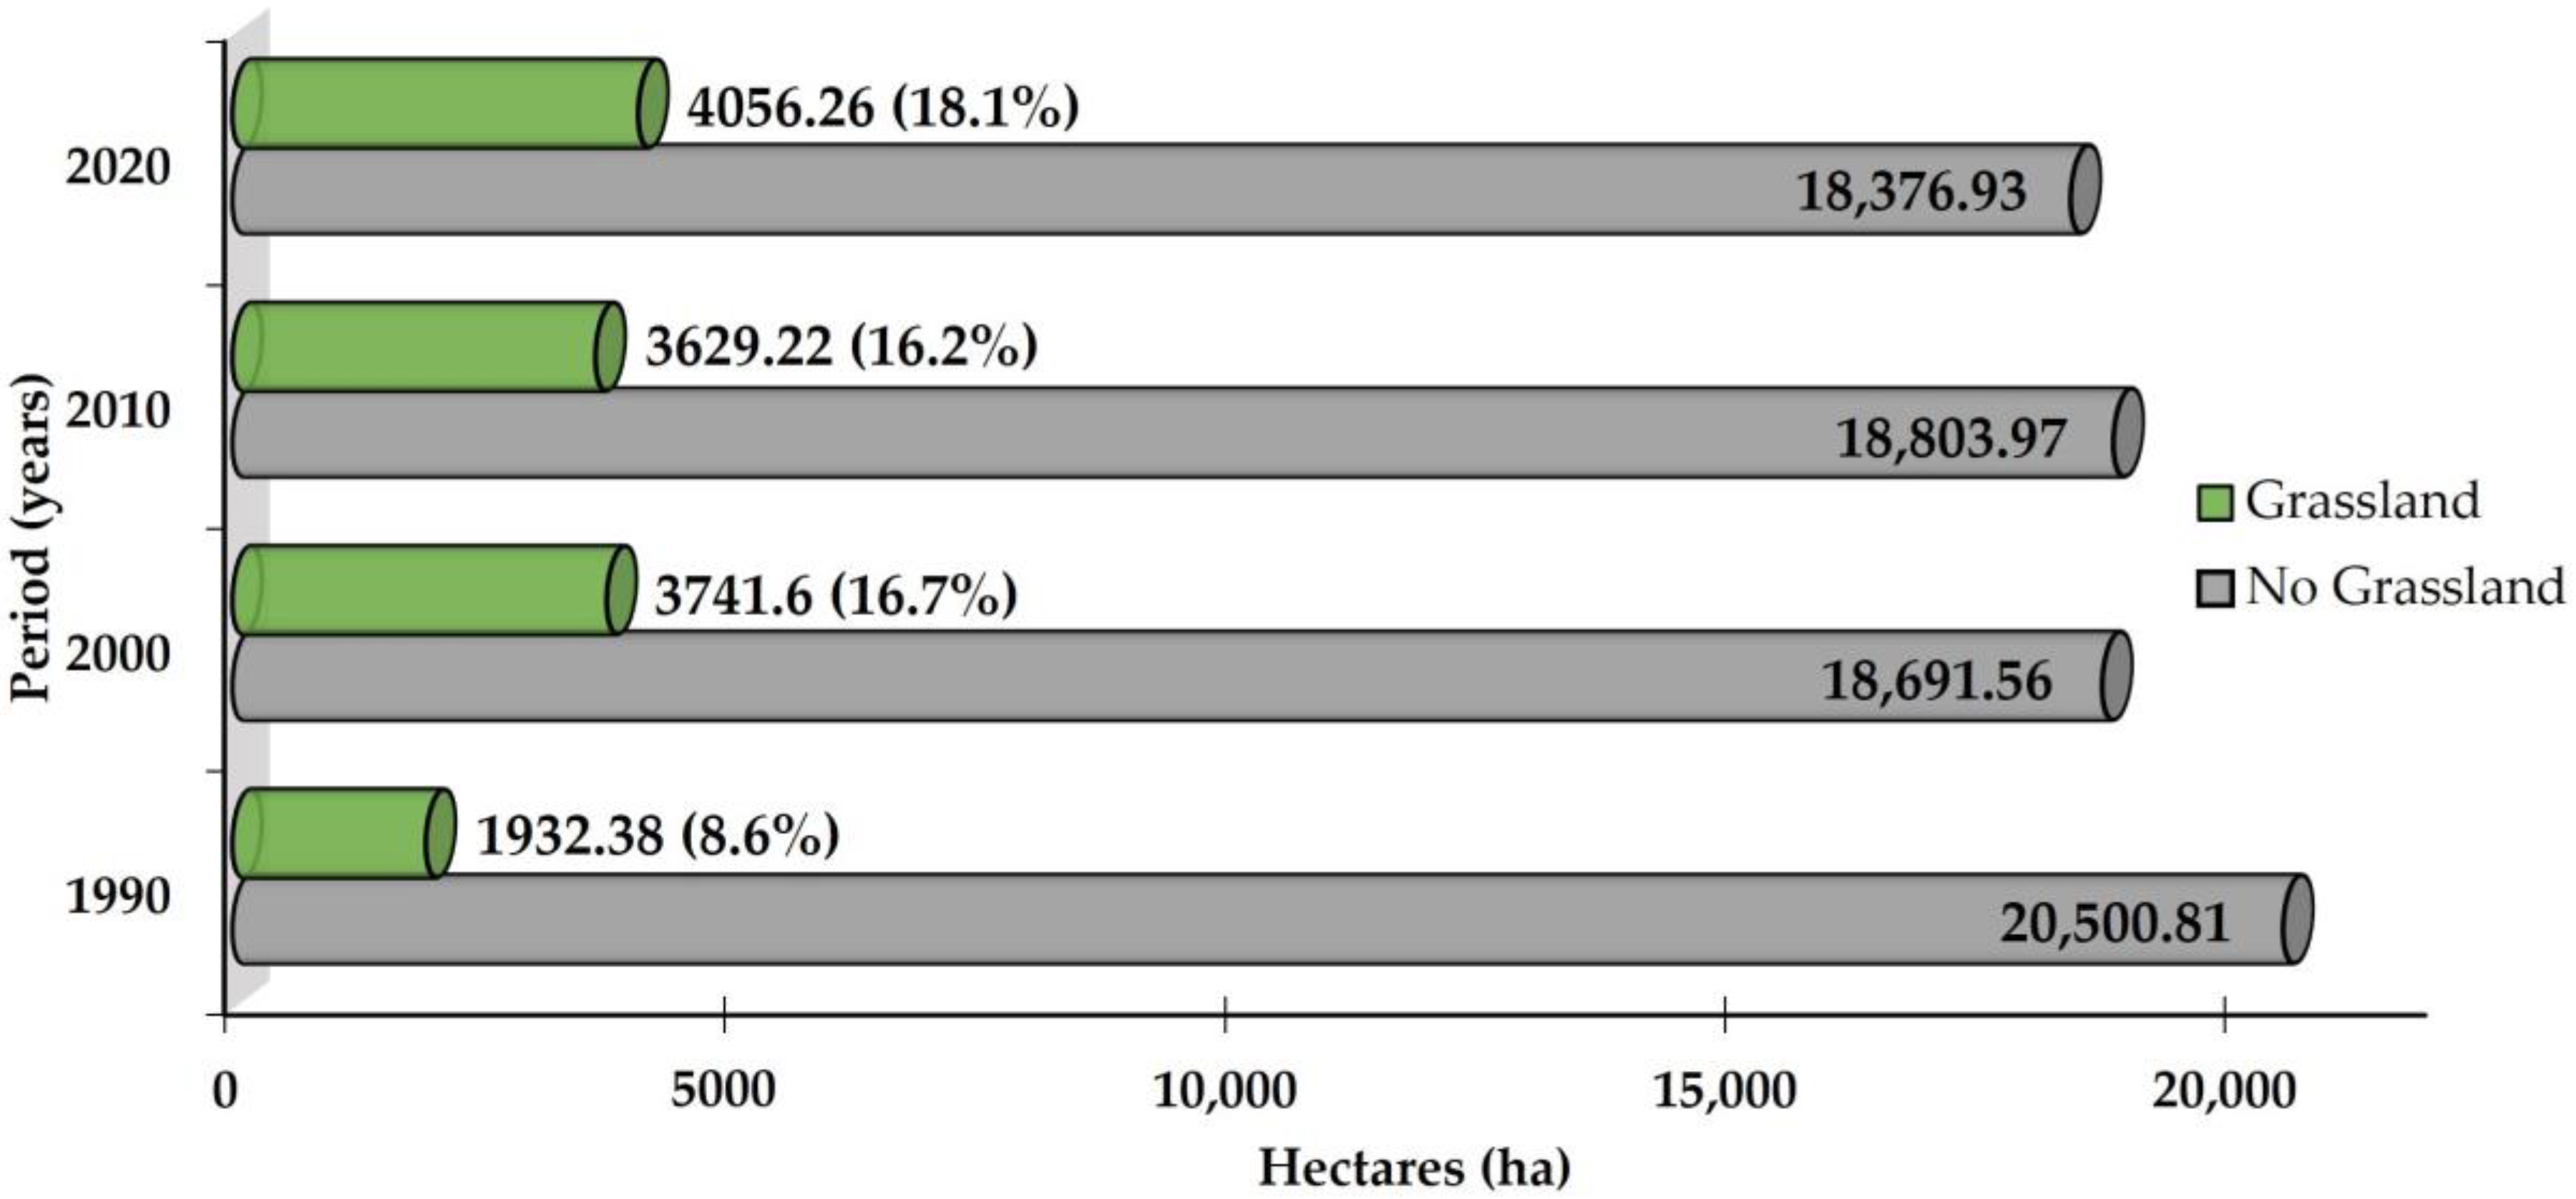
The grassland class for the last 30 years showed an increase in the Pomacochas and Ventilla watersheds. In the Pomacochas micro-watershed, the area of grassland was 38.6% (2457.03 ha) in 1990; however, by 2020, the area increased to 57.4% (3659.37 ha). In turn, the Ventilla micro-basin reported a grassland area of 8.6% (1932.38 ha) in 1990, and by 2020, the area increased to 18.1% (4056.26 ha) (Table 3).
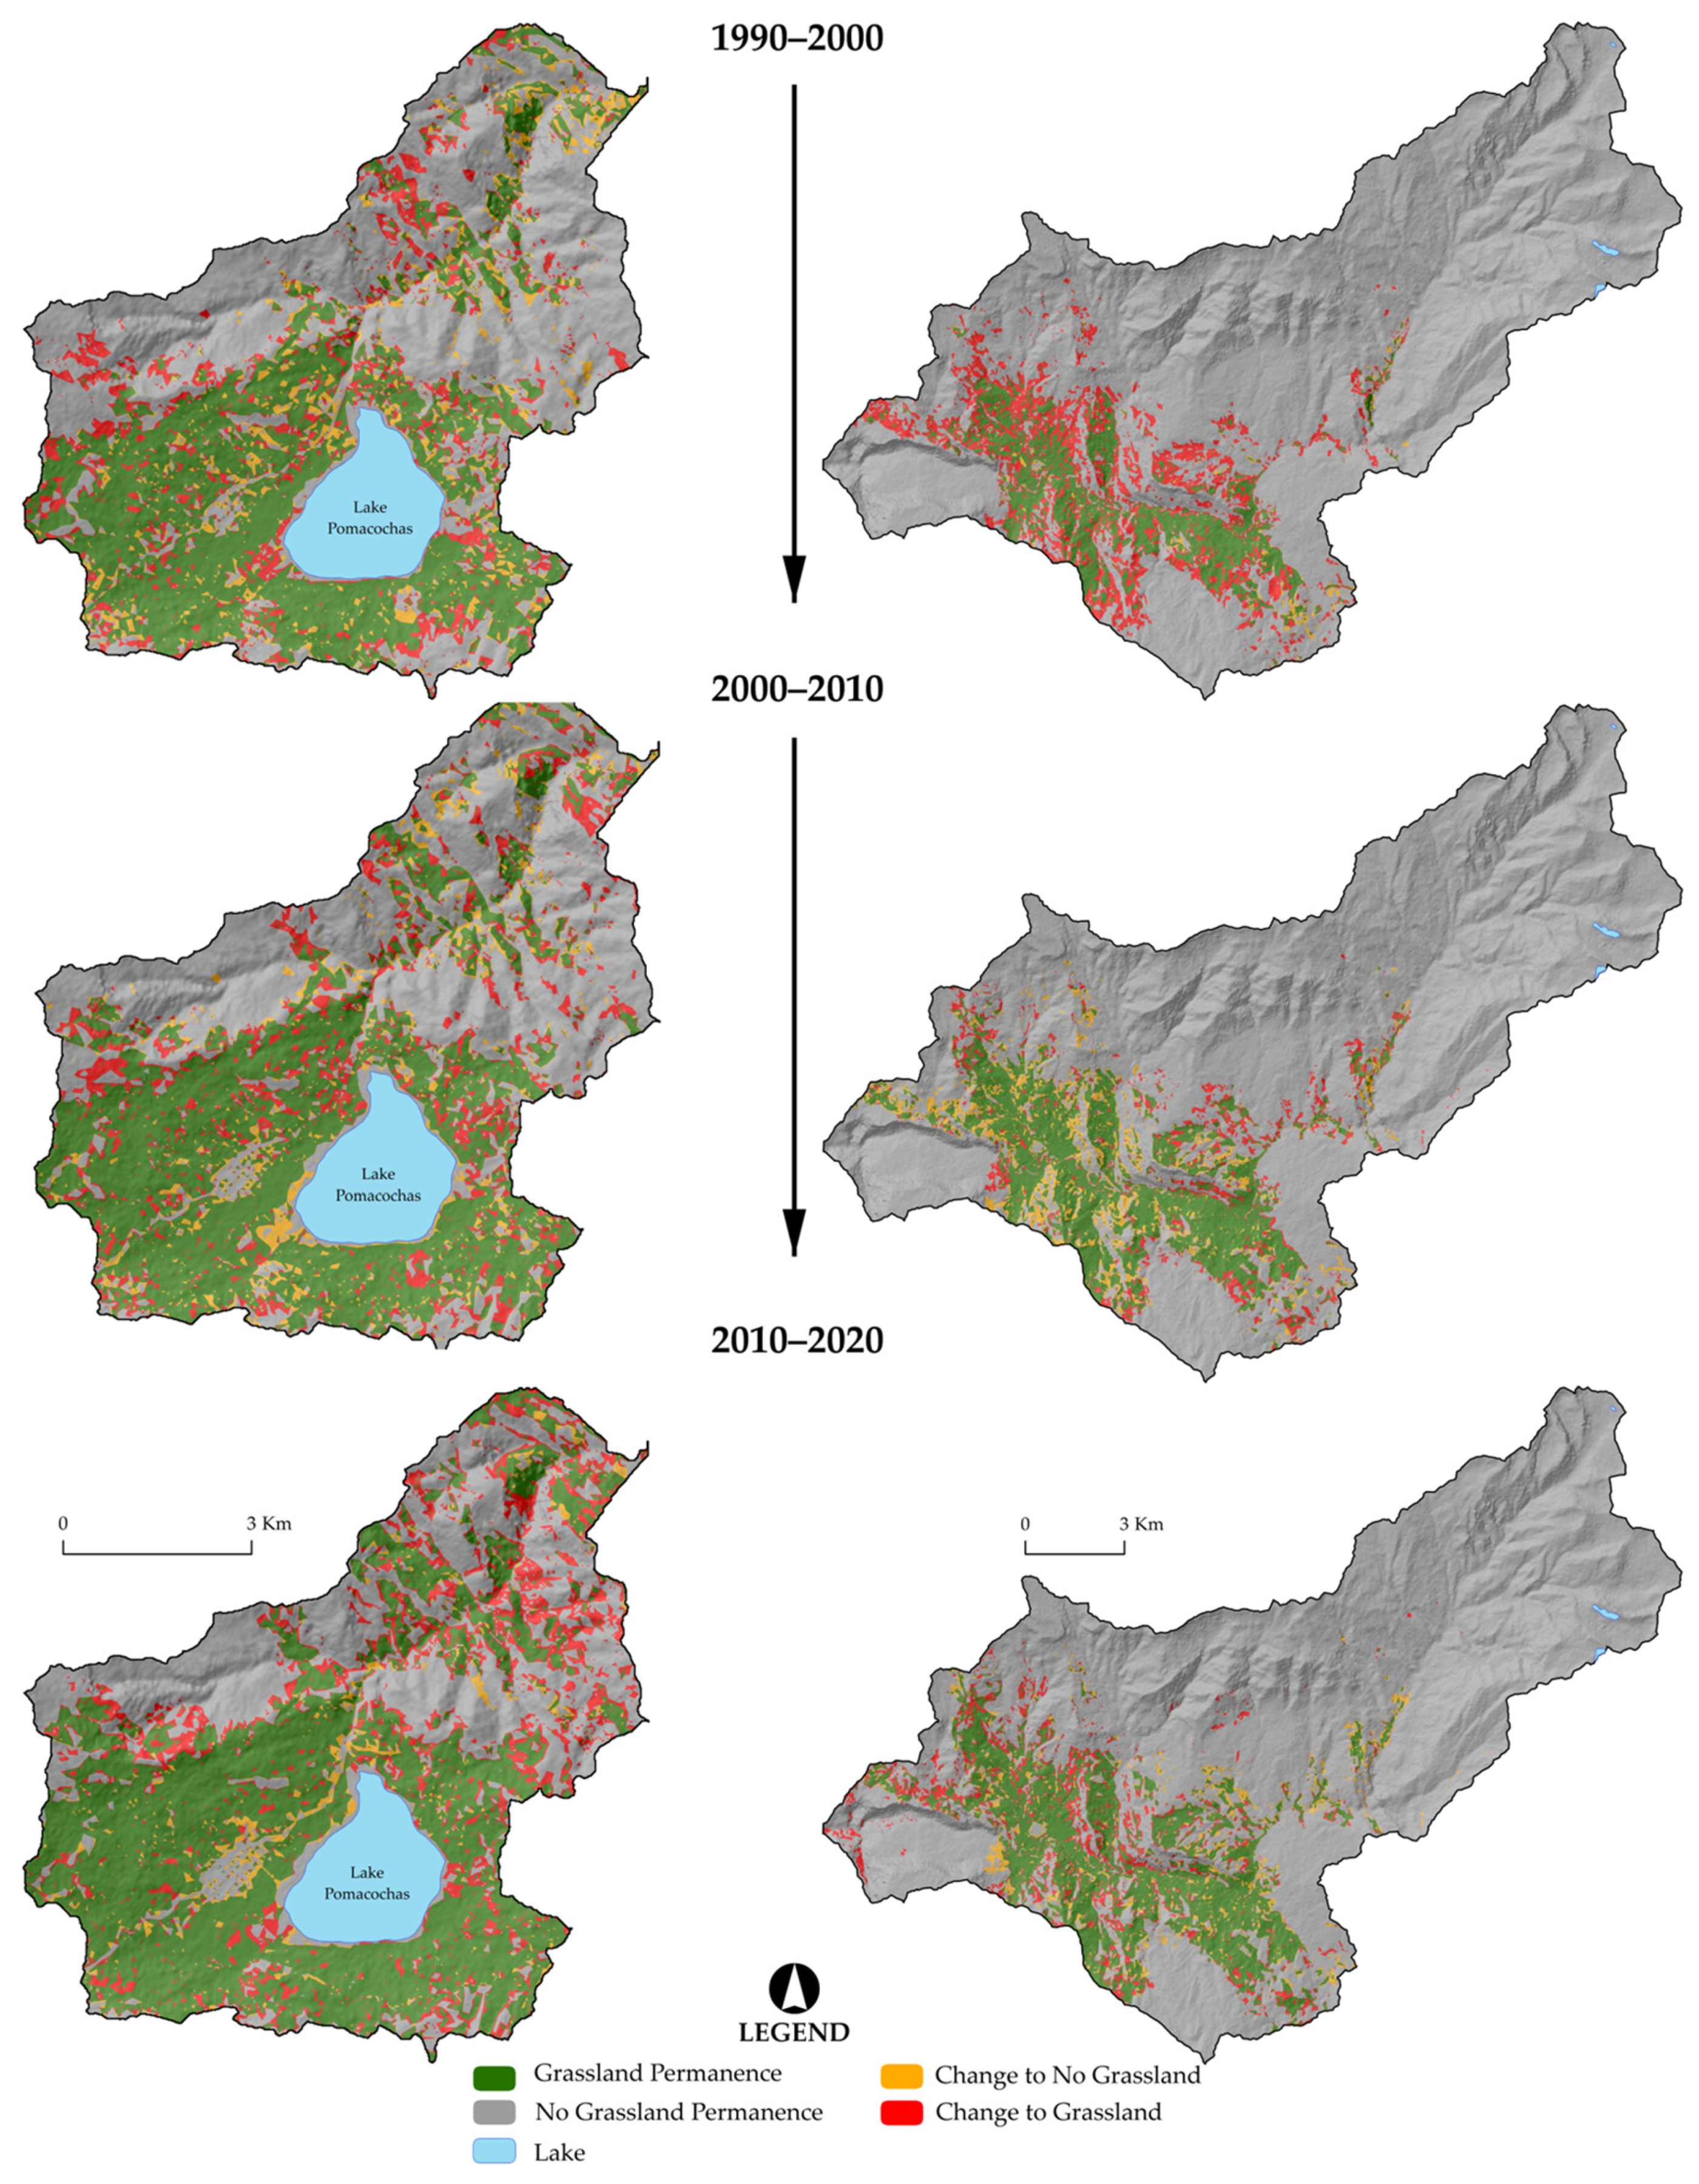
The spatial distribution of the grasslands in the Pomacochas micro-basin increased to the southwest and northeast of the micro-watersheds, especially in areas near Lake Pomacochas, Florida city and along the roads and highways. Likewise, in the Ventilla micro-watershed, the increase in grasslands was greater and was distributed to the southwest on both banks of the lower course of the Ventilla River, near the city of Molinopampa (Figure 4).
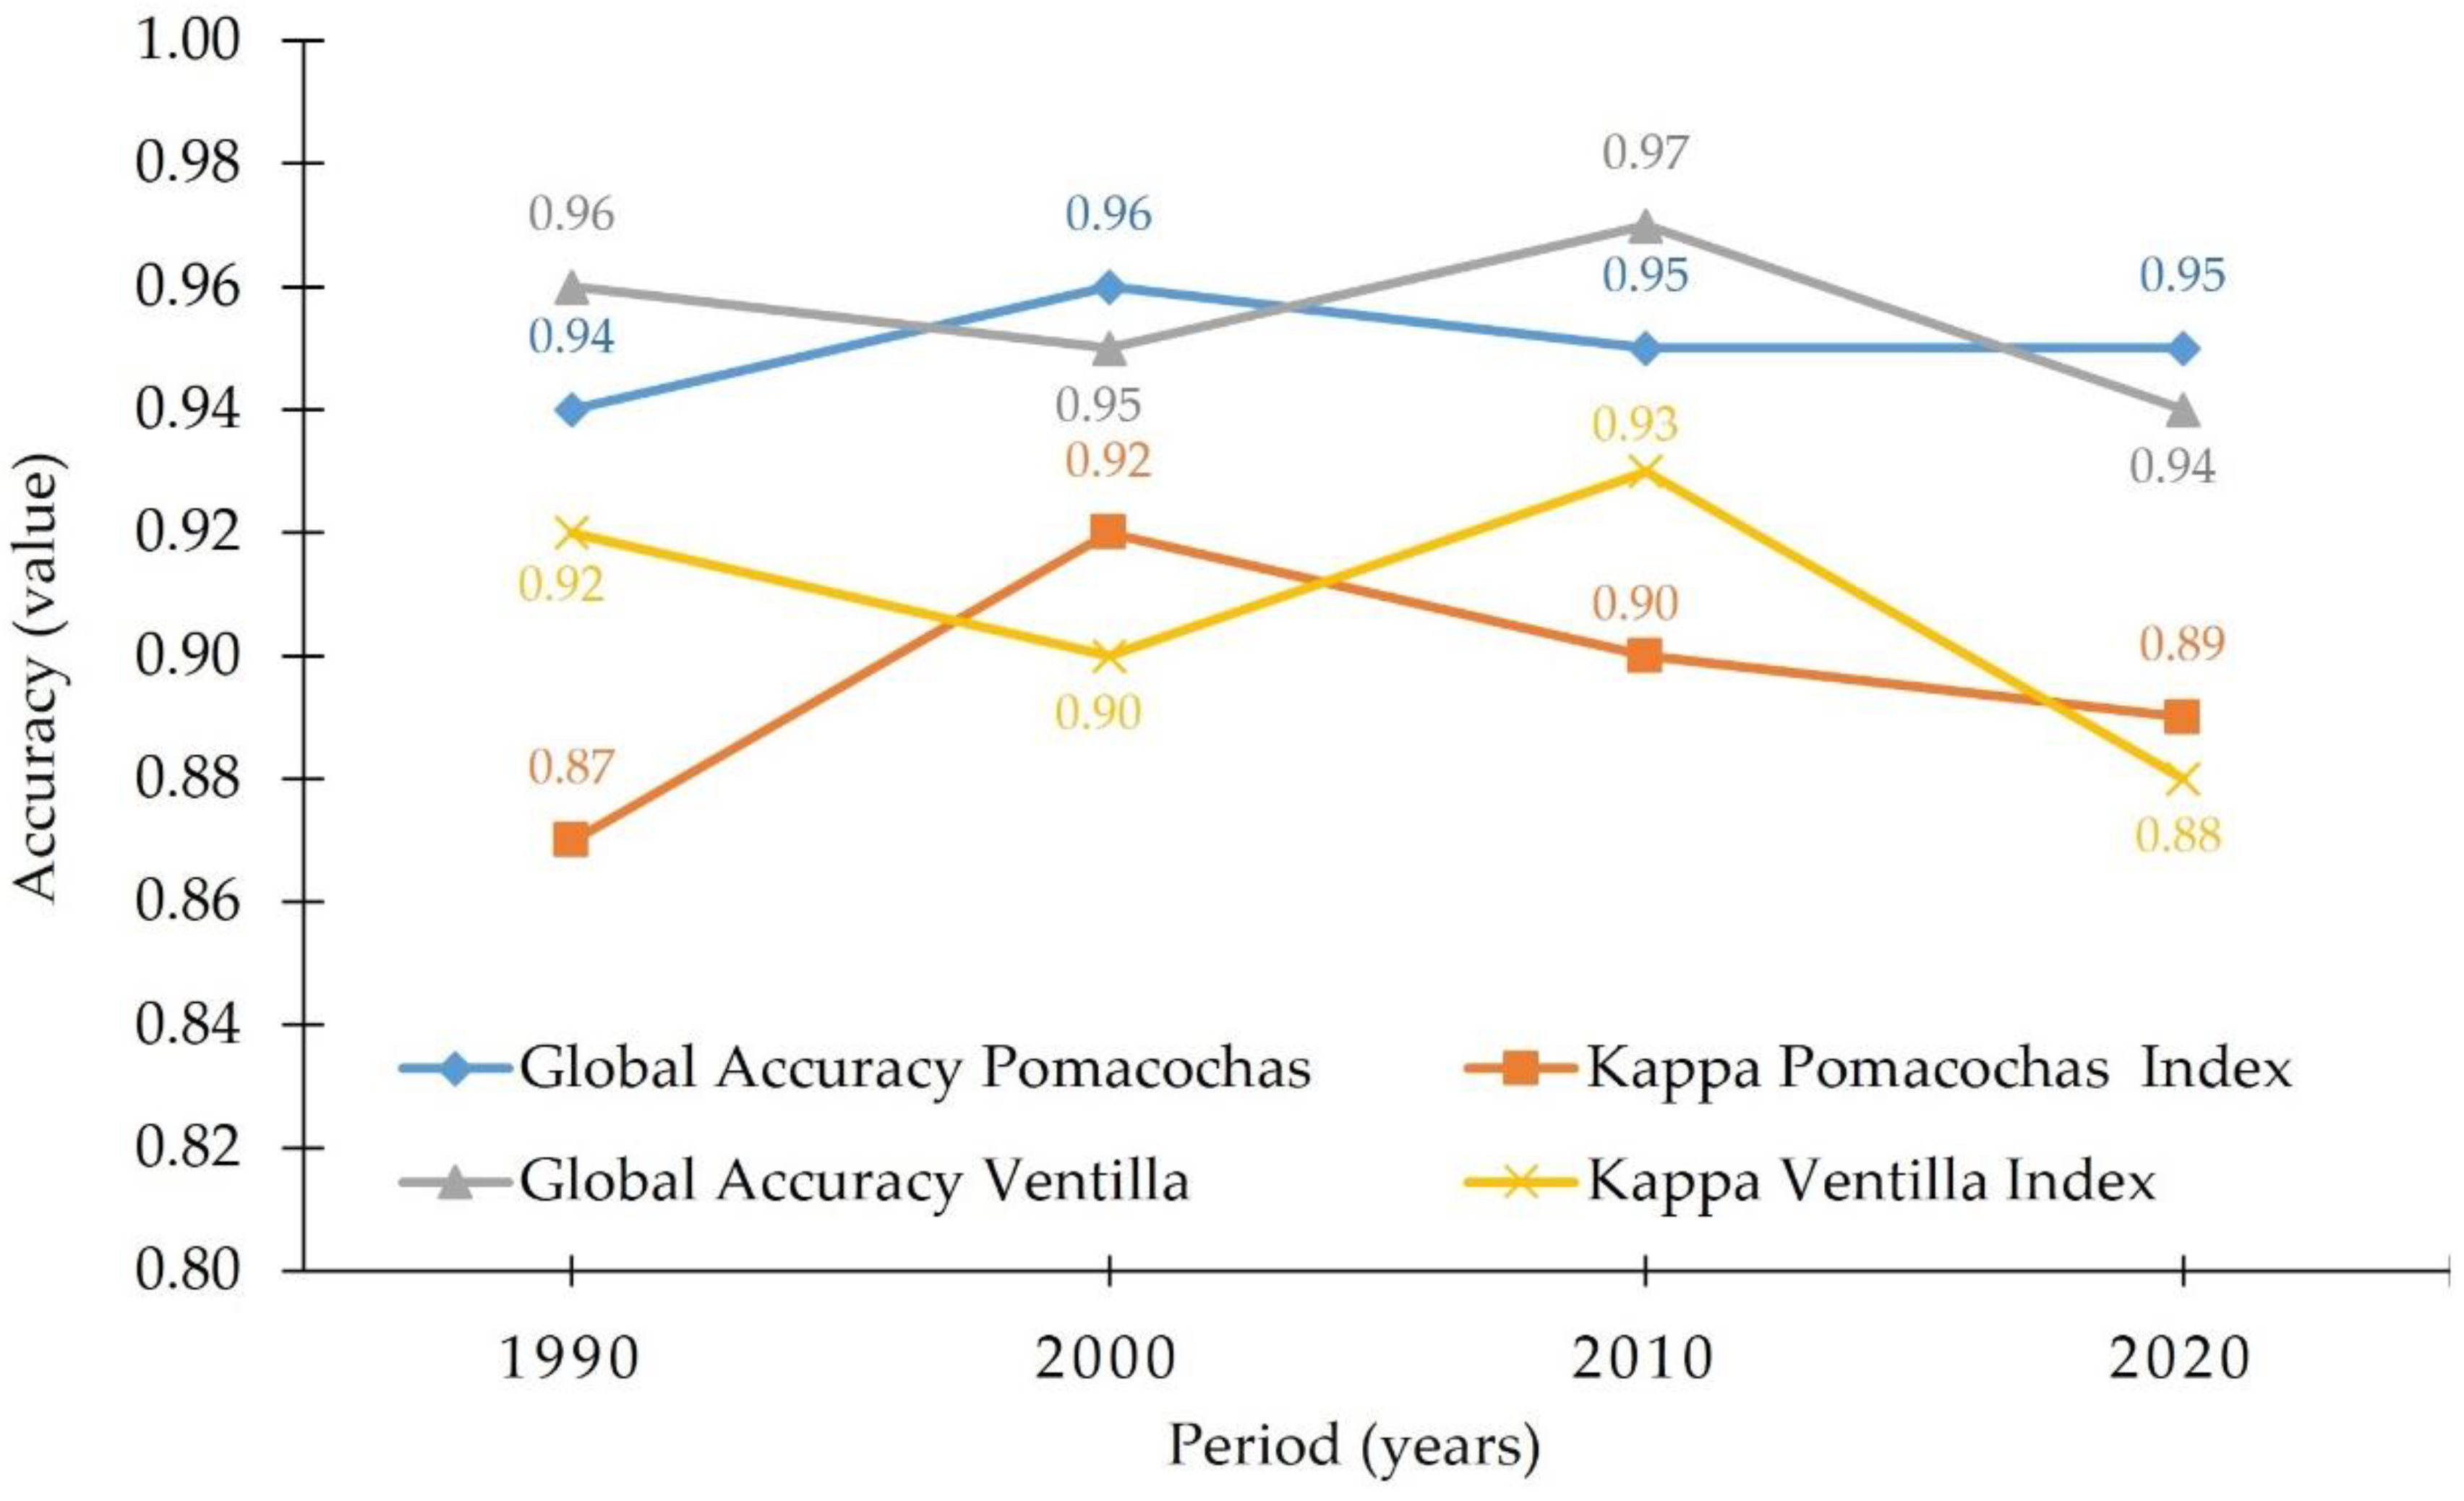
Statistical validation of the maps generated was achieved based on validation points for each micro-watershed, which allowed comparison of GA and Kappa (Figure 5). The GA obtained for the Pomacochas micro-watershed in 1990, 2000, 2010 and 2020 was between 0.94 and 0.96 and Kappa varied between 0.87 and 0.92; while the Ventilla micro-watershed presented GA between 0.94 and 0.97 for 1990, 2000, 2010 and 2020, with kappa values ranging between 0.88 and 0.93.

3.2. Exchange Rates (s)

The spatiotemporal dynamics of grassland and non-grassland for the Pomacochas micro-basin showed an increase of 18.8% (1202.34 ha) (Figure 6). However, for the last two years (2010 and 2020), the largest increase in grassland was recorded at 10.0% (637.18 ha).
In this study, it was deduced that the rates estimated for the periods P1 (1990–2000), P2 (2000–2010) and P3 (2010–2020) in the Pomacochas micro-basin presented marked changes between grassland (increase) and no-grassland (decrease). The changes that were made in P1 included an increase in grassland (0.87%) and a reduction in no-grassland (−0.58%). In P2, grassland increased by 1.21% and non-grassland decreased by −0.97%. Similarly, P3 followed the same patterns as P1 and P2, increasing in grassland by 1.93% and declining in non-grassland by −2.09% (Table 4).
The spatiotemporal dynamics of the grassland and no-grassland classes for the Ventilla micro-basin showed similar patterns to those of the Pomacochas micro-watershed (Figure 7). In the last two years of evaluation, the grassland increased in its extension, reducing the class of no-grassland that could be deduced in the vegetation cover to agricultural uses or increases in the urban area.
In this study, it was deduced that the rates estimated for the periods P1 (1990–2000), P2 (2000–2010) and P3 (2010–2020) presented marked change dynamics between grassland and no-grassland. The changes that were made in P1 included the increase in grassland (6.83%) and the reduction in no-grassland (−0.92%). This behavior showed the increase in grassland with respect to the reduction in non-grassland in the Ventilla micro-watershed. However, in P2, there was a −0.30% reduction in grassland and a 0.06% increase in no-grassland. P3 followed the same patterns as P1, increasing by 1.12% and decreasing by −0.23% for grassland and no-grassland, respectively (Table 5).

3.3. Evaluation of Changes from Grassland to Non-Grassland by Period

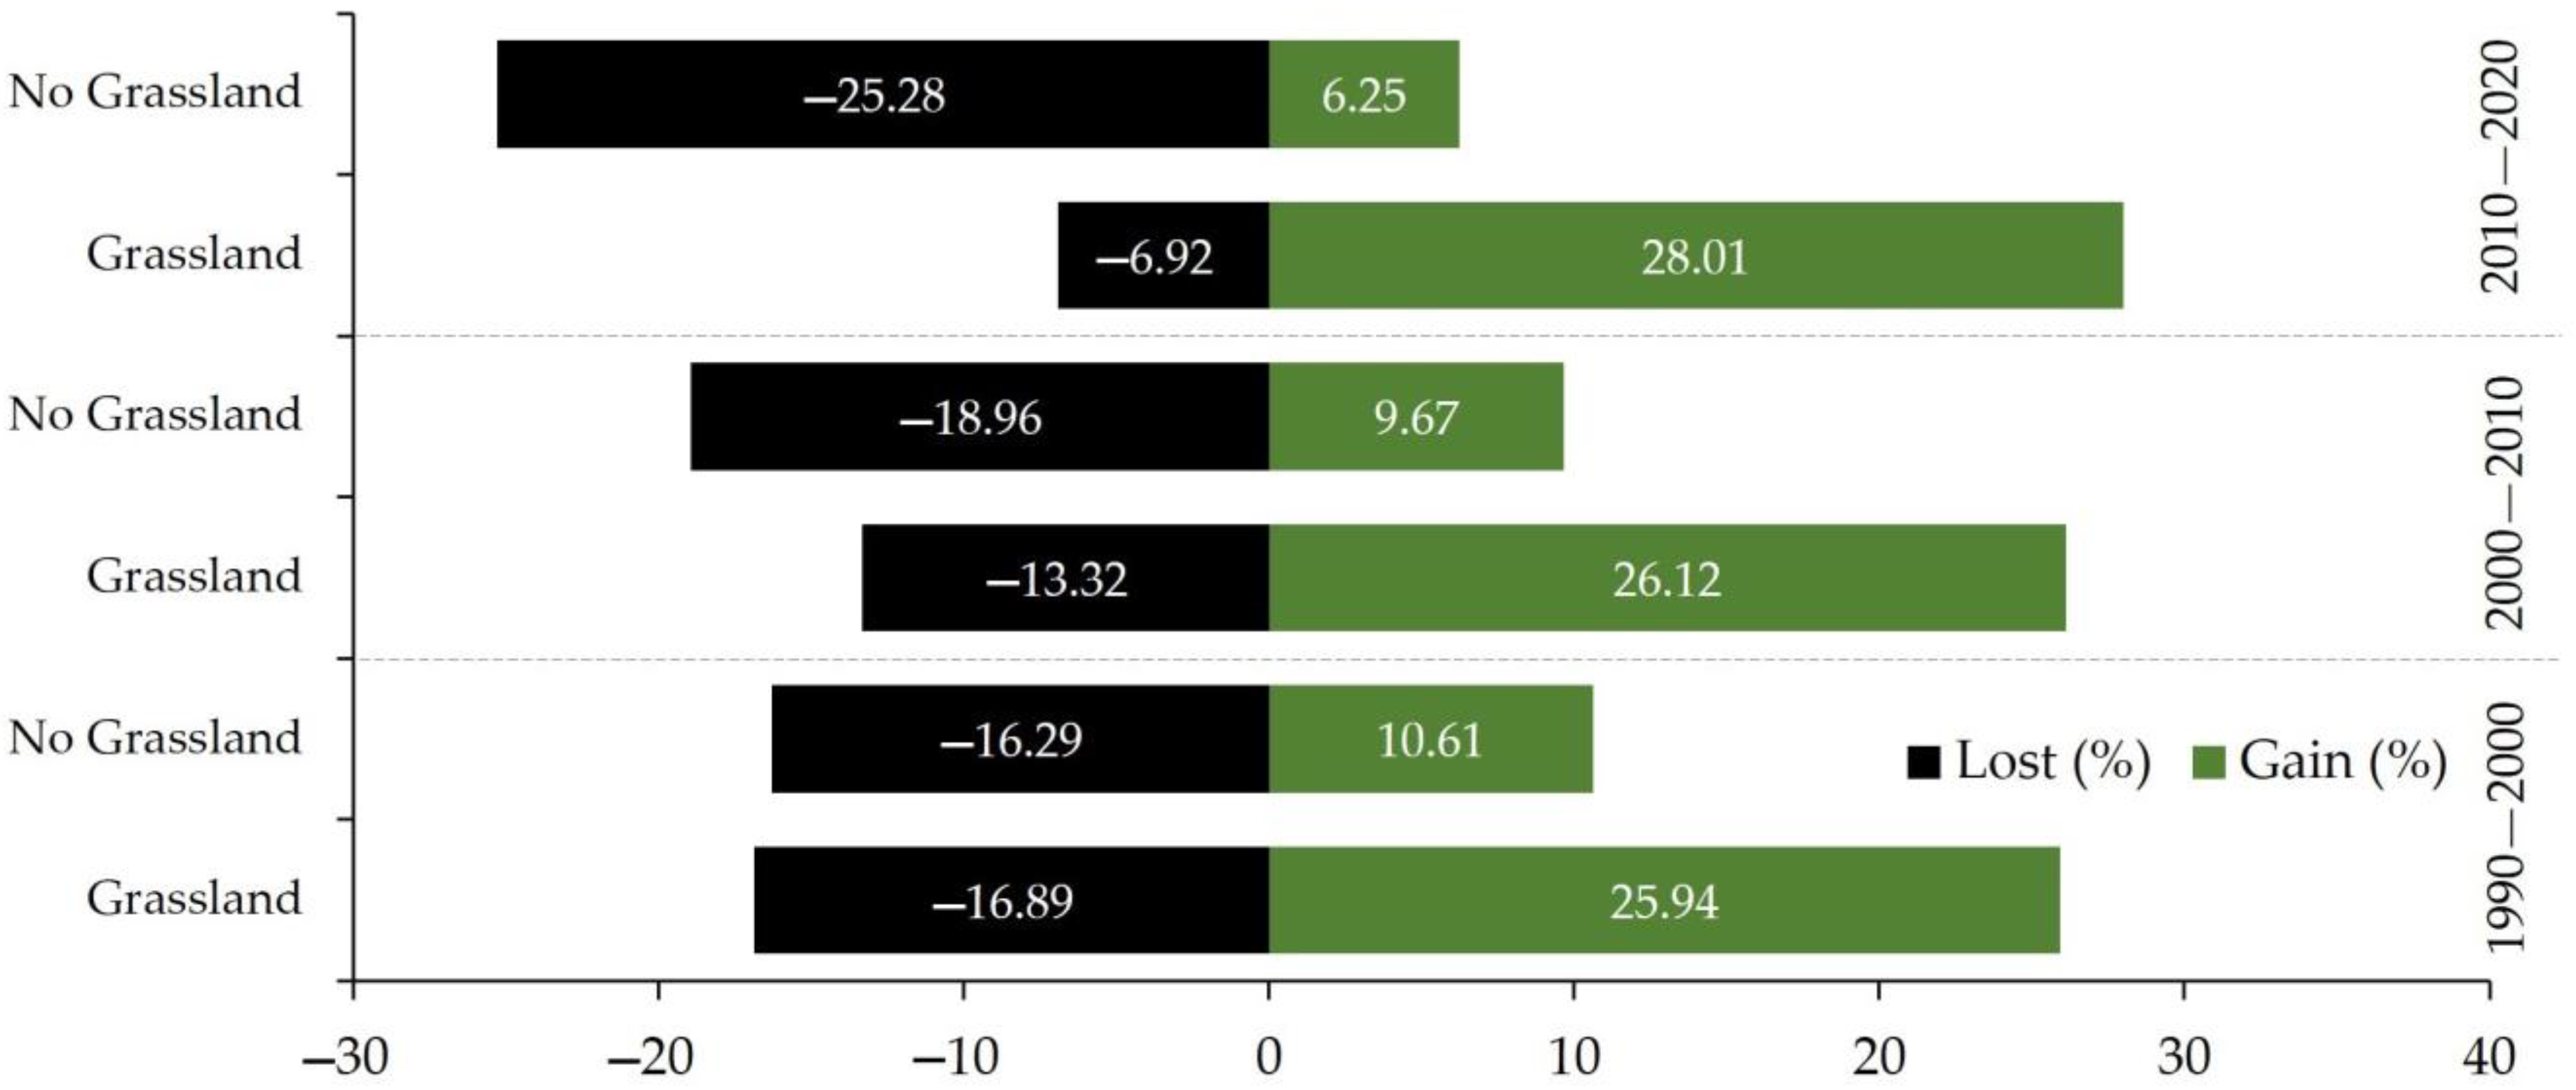
The “grasslands” maintained a greater surface change in the Pomacochas micro-watershed (net change) (9.05%, 12.80% and 21.08% for P1, P2 and P3, respectively) (Table 4). With gains in area of 25.94%, 26.12% and 28.01% for P1, P2 and P3, respectively (Figure 8). Similarly, the “no-grassland” class presented net changes of 5.68, 9.29 and 19.03% in the three periods, respectively, with losses ranging from 16.29 to 25.28% (Figure 8). This result could be related to the loss of vegetation cover and land use change as a result of the opening of new pasture plots within the micro-watershed.
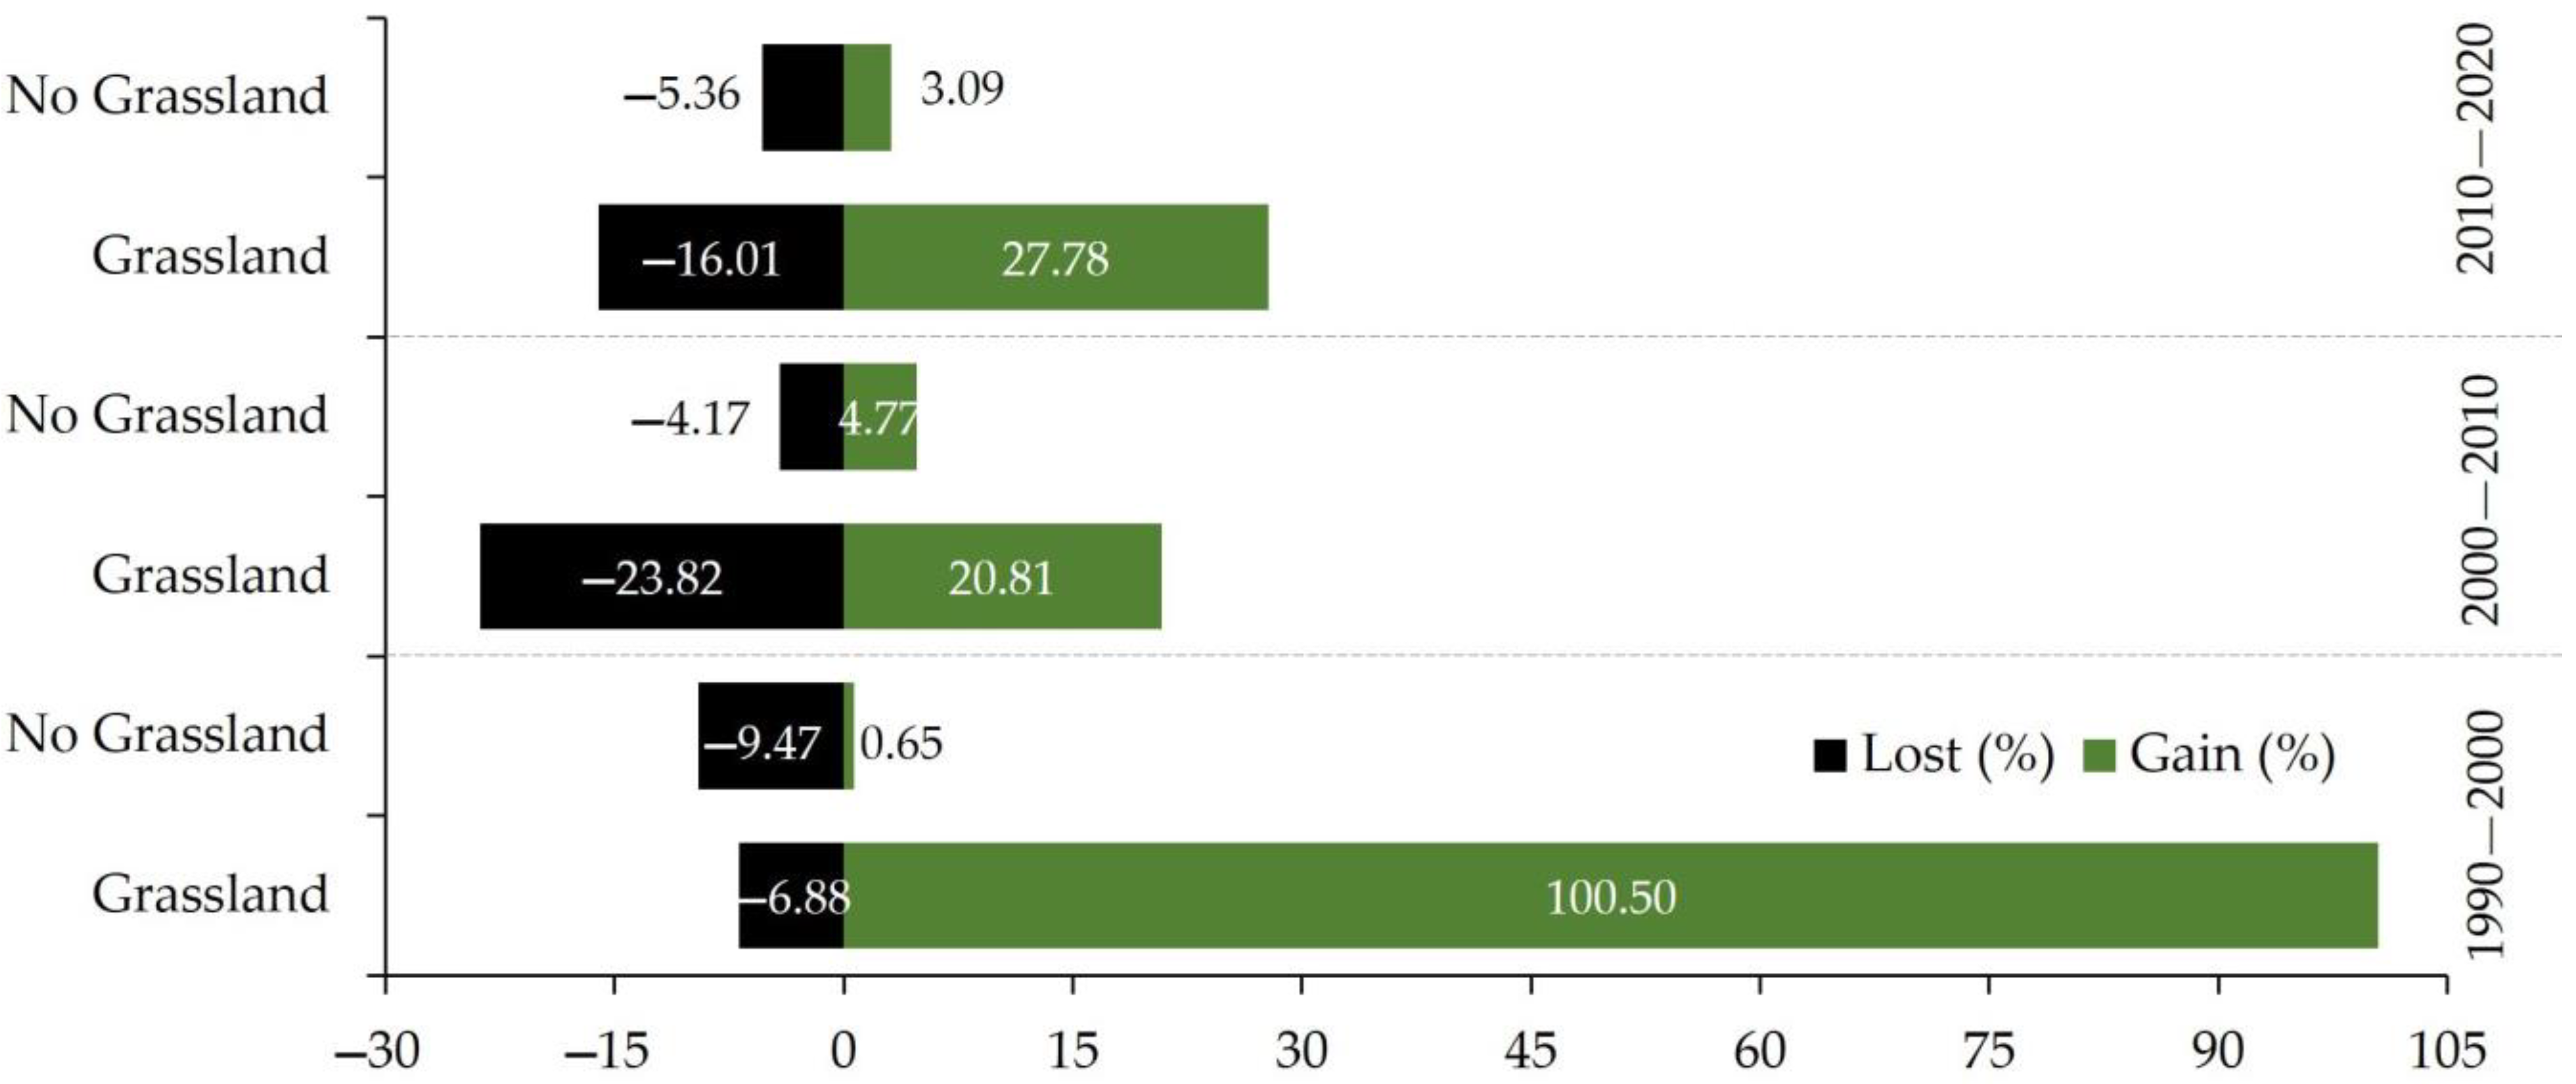
In the Ventilla micro-watershed, the “grassland” class presented the greatest surface change (net change) (93.63%, 3% and 11.77% for P1, P2 and P3, respectively)) (Table 5), with gains in area of 100.5%, 20.81% and 27.78% for P1, P2 and P3, respectively (Figure 9). However, the “no-grassland” class presented net changes of 8.83%, 0.60% and 2.27% for the periods of analyses P1, P2 and P3, respectively. In turn, the loss of grassland area ranged from −4.17 to −9.47%. Indeed, this reduction in the grassland class could be due to the transition from livestock to agricultural activities within the micro-watershed.
Figure 10 shows the changes produced according to the spatiotemporal analysis for each micro-watershed. Therefore, the changes produced in the non-grassland are colored orange and the changes in the grasslands are colored in red, showing a gradual increase in the use of grasslands in both micro-watersheds from 1990 to 2020.

4. Discussion

The thematic accuracy of the generated maps presented acceptable precision values; in particular, they indicated that the applied methodology is capable of generating comparable maps presenting spatial and temporal coherence. However, Parente and Ferreira [25] considered that the generated maps were subject to errors of commission and omission. In our study, commission errors were minimized through the application of vegetation indices. The NDVI is an index that can assess changes in vegetation cover [79,80,81] and chlorophyll concentration in plant leaves [82]. However, an inadequate use of NDVI carries inherent risks related to aspects of: atmospheric effect, saturation phenomenon and factors of the sensor used [83]. In this study, the additional use of SAVI and EVI were considered for the spatiotemporal analysis of grassland. In addition, the use of masks for water bodies, clouds and cloud shadows [42,64,66,68,69] were used to eliminate misclassified pixels. Additionally, the errors of omission were related to the spatial resolution, where the grassland class was underestimated with other land uses (no-grassland), such as agriculture [25]. In addition, to obtain the land use and cover maps for a specific year considering all available images, it was decided to use surface reflectance data from Landsat 5, 7 and 8 (https://developers.google.com/earth-engine/datasets/catalog/landsat, accessed on 18 November 2021), available in GEE, but not MODIS [84] and/or AVHRR [85] data, due to their low spatial resolution, which is limited for evaluating small areas [86]. Therefore, Landsat images were used because of the spatial and temporal resolution available.
The results generated in this study reported two important periods in terms of the increase in grasslands in the Pomacochas and Ventilla micro-watersheds. Between 1990 and 2000, a process of occupation of the territory was generated, and this result was supported by the opening of new grazing areas, as a result of forests’ clearance and migratory movements of inhabitants from the regions of San Martín and Cajamarca [87,88]. From 2010 to 2020, livestock activity intensified in both micro-watersheds, which increased the production and carrying capacity per ha, which was corroborated by the reports of Oliva et al. [89] on the increase of the number of ranchers in the Pomacochas (773 ranchers) and Ventilla (1131 ranchers) micro-watersheds.
Grasslands are important in animal feeding and are the most economical food source for ruminants, which forces researchers to look for highly nutritious, digestible forage species with high biomass yields [48]. In this sense, the prevalence of grasslands for the Pomacochas and Ventilla micro-watersheds is reflected in a gain of 28.01% and 27.78%, respectively, for the 2010–2020 period (Figure 8 and Figure 9). This is related to market demand, infrastructure aspects and productive needs of the region and population [90,91]. In this context, rangelands are still vulnerable to the processes of urbanization, industrial development, intensive management practices and effects of climate change [92,93,94].
Thirty-nine percent of grasslands worldwide experience degradation due to frequent anthropogenic activity [95]. These human activities, together with unfavorable environmental conditions, are the main causes of changes in the productivity of rangelands and an increase in carbon emissions [20,96]. In the study area, degraded pastures were located in areas close to urbanized land (city and roads). Among the possible causes of degradation are the installation of crops (maize, tubers and Andean crops), overgrazing [97] and poor livestock practices and lack of programs for the recovery of degraded areas. In Peru, agriculture has replaced the Jalca, especially in the Andean zones [98] this is reflected in the dynamics of the land use and cover for the Pomacochas and Ventilla micro-watersheds.
The monitoring of grasslands through remote sensing allows us to know the current state of the grassland and the physical conditions of the climate, soil and human activities [20]. In recent years, new remote sensing technologies, such as GEE, radar images and the use of Remotely Piloted Aircraft System (RPAS) equipped with hyperspectral cameras and machine learning algorithms, have allowed more accurate predictions of grassland quality. Grassland mapping allows distinguishing different grassland ecologies that influence management practices, degradation and productivity over time [99,100,101]. In our study, multitemporal images were analyzed that allowed us to monitor the dynamics of the grasslands in the study area, reporting consistent accuracies and demonstrating the increase in the grasslands in both micro-watersheds. In fact, this study lays the groundwork for subsequent studies: evaluation of grassland degradation through satellite remote sensing and/or RPAS, recovery plans for degraded areas and management programs for silvopastoral systems, among others.

5. Conclusions

In this study, a semi-automated methodological approach for Landsat image processing using GEE was applied during three periods from 1990 to 2020 to evaluate the spatiotemporal dynamics of grasslands in two main cattle micro-watersheds in Amazonas region. The interannual maps reported accuracies higher than 0.85 (85%), with areas ranging from 2457.03 to 3659.37 ha for Pomacochas and from 1932.38 to 4056.26 ha for Ventilla. The analysis of the maps revealed a strong increase in pasture area during the third period (2010–2020) and showed a pattern of increase in the cattle herd due to the conversion and opening of new pasture areas. The assessment of rangeland dynamics presented in this study can be promoted as a management tool to identify rangelands and design strategies for sustainable cattle farming.

Supplementary Materials

The following are available online at https://www.mdpi.com/article/10.3390/land11050674/s1, Table S1: User precision error and producer precision error for the Pomacochas micro-watershed, Table S2: User precision error and producer precision error for the Ventilla micro-watershed.

Author Contributions

Conceptualization, N.A.M., E.B., H.V.V., R.E.T.M. and J.O.S.L.; Data curation, N.A.M., E.B., J.O.S.L. and E.T.C.; Formal analysis, E.B., H.V.V., D.G.F. and R.E.T.M.; Funding acquisition, M.O.-C.; Investigation, N.A.M., R.S.L., H.V.V. and J.O.S.L.; Methodology, N.A.M., E.B., D.G.F., N.B.R.B. and E.T.C.; Project administration, R.S.L. and H.V.V.; Resources, H.V.V. and M.O.-C.; Software, N.A.M., E.B., D.G.F. and E.T.C.; Supervision, R.S.L.; Visualization, R.S.L., R.E.T.M., N.B.R.B., M.O.-C. and O.A.G.T.; Writing—original draft, N.A.M., E.B. and J.O.S.L.; Writing—review and editing, E.B., R.S.L., H.V.V., N.B.R.B., M.O.-C., O.A.G.T., J.O.S.L. and E.T.C. All authors have read and agreed to the published version of the manuscript.

Funding

This research was carried out and financed mainly by the subproject “Development of a methodology based on drones and high-resolution multispectral images for the identification and monitoring of degraded grasslands due to the effect of extensive cattle ranching as a mitigation strategy for climate change in the livestock micro-basins of Pomacochas and Molinopampa, Amazonas-RPAStures”, co-financed by contract No. 444-2019-FONDECYT, established by the Fondo Nacional de Desarrollo Científico, Tecnológico y de Innovación (FONDECYT). In addition, by the Dirección de Desarrollo Tecnológico Agrario, Instituto Nacional de Innovación Agraria (INIA) and the SNIP Project No. 312235 “Creation of a Geomatics and Remote Sensing Laboratory Service at the Universidad Nacional Toribio Rodríguez, Amazonas region”—GEOMÁTICA, which was financed by the National System of Public Investment (SNIP) of the Ministry of Economy and Finance (MEF) of Peru.

Institutional Review Board Statement

Not applicable.

Informed Consent Statement

Not applicable.

Data Availability Statement

Not applicable.

Acknowledgments

The authors appreciate and acknowledge the support of the Research Institute for the Sustainable Development of the Eyebrow of the Jungle (INDES-CES) of the National University Toribio Rodriguez de Amazonas (UNTRM). We also thank Mirtha M. Huamán Puscán for her collaboration in the field work.

Conflicts of Interest

The authors declare no conflict of interest.

References

  1. Wang, J.; Xiao, X.; Bajgain, R.; Starks, P.; Steiner, J.; Doughty, R.B.; Chang, Q. Estimating leaf area index and aboveground biomass of grazing pastures using sentinel-1, sentinel-2 and landsat images. ISPRS J. Photogramm. Remote Sens. 2019, 154, 189–201. [Google Scholar] [CrossRef] [Green Version]
  2. Umuhoza, J.; Jiapaer, G.; Yin, H.; Mind’je, R.; Gasirabo, A.; Nzabarinda, V.; Umwali, E.D. The analysis of grassland carrying capacity and its impact factors in typical mountain areas in central asia—A case of Kyrgyzstan and Tajikistan. Ecol. Indic. 2021, 131, 108129. [Google Scholar] [CrossRef]
  3. Blair, J.; Nippert, J.; Briggs, J. Grassland Ecology; Springer: Berlin/Heidelberg, Germany, 2014; ISBN 9781461475019. [Google Scholar]
  4. Flores, M. Captura de Dióxido de Carbono (CO2) en la “Chillihua” (Festuca Dolichophylla Presl) de los Pastizales del CIP-Illpa-Puno; Universidad Nacional del Altiplano Facultad de Ciencias Agrarias: Puno, Peru, 2017. [Google Scholar]
  5. Rebollo, S.; Gómez, A. Aprovechamiento Sostenible de los Pastizales. Ecosistemas 2003, 12, 7. Available online: https://www.revistaecosistemas.net/index.php/ecosistemas/article/view/231 (accessed on 6 November 2021).
  6. Lyu, X.; Li, X.; Dang, D.; Dou, H.; Xuan, X.; Liu, S. A new method for grassland degradation monitoring by vegetation species composition using hyperspectral remote sensing. Ecol. Indic. 2020, 114, 106310. [Google Scholar] [CrossRef]
  7. CONYCET. La Importancia de la Conservación de Pastizales. Available online: https://www.conicet.gov.ar/la-importancia-de-la-conservacion-de-pastizales/ (accessed on 21 December 2021).
  8. Cuesta, F.; Muriel, P.; Beck, S.; Meneses, R.I.; Halloy, S.; Salgado, S.; Ortiz, E.; Becerra, M.T. Biodiversidad y cambio climático en los andes tropicales. Rev. Virtual REDESMA 2012, 6, 180. [Google Scholar]
  9. Pérez, R. El lado oscuro de la ganadería. Probl. Desarro. 2008, 39, 217–227. [Google Scholar]
  10. Padilla, C.; Crespo, G.; Sardiñas, Y. Degradación y recuperación de pastizales. Rev. Cuba. Cienc. Agríc. 2009, 43, 351–354. [Google Scholar]
  11. Wang, M.P.; Zhao, C.Z.; Long, R.J.; Yang, Y.H. Rangeland governance in China: Overview, impacts on Sunan County in Gansu Province and future options. Rangel. J. 2010, 32, 155–163. [Google Scholar] [CrossRef]
  12. Mamani, S.J.; Servan, L.N. Evaluación Multitemporal de la Deforestación en El Distrito de Molinopampa, Provincia de Chachapoyas Departamento Amazonas 2015; Universidad Nacional Toribio Rodriguez de Mendoza de Amazonas: Chachapoyas, Peru, 2018. [Google Scholar]
  13. Chen, L.; Ma, Z.; Zhao, T. Modeling and analysis of the potential impacts on regional climate due to vegetation degradation over arid and semi-arid regions of China. Clim. Change 2017, 144, 461–473. [Google Scholar] [CrossRef]
  14. IPBES. Plataforma Intergubernamental Científico Normativa sobre Diversidad Biológica y Servicios de los Ecosistemas: Informe y Resumen para Tomadores de Decisiones de las Evaluaciones Regionales: África, América, Asia Pacífico, Europa y Asia Central; IPBES: Bonn, Germany, 2018. [Google Scholar]
  15. Bolt, C. Nuevo Atlas de Pastizales Revela la Importancia de los Pastizales Saludables Para la Vida Silvestre y Los Seres Humanos|Historias|Descubre WWF. Available online: https://www.worldwildlife.org/descubre-wwf/historias/nuevo-atlas-de-pastizales-revela-la-importancia-de-los-pastizales-saludables-para-la-vida-silvestre-y-los-seres-humanos (accessed on 17 September 2021).
  16. Zeme, S.; Entraigas, I.; Varni, M. Análisis de los servicios ecosistémicos en un pastizal natural de la pampa deprimida bonaerense. Contrib. Científicas GÆA 2015, 27, 161–174. [Google Scholar]
  17. Hott, M.C.; Carvalho, L.M.T.; Antunes, M.A.H.; Resende, J.C.; Rocha, W.S.D. Analysis of grassland degradation in Zona da Mata, MG, Brazil, based on NDVI time series data with the integration of phenological metrics. Remote Sens. 2019, 11, 2956. [Google Scholar] [CrossRef] [Green Version]
  18. Lu, H.; Raupach, M.R.; McVicar, T.R.; Barrett, D.J. Decomposition of vegetation cover into woody and herbaceous components using AVHRR NDVI time series. Remote Sens. Environ. 2003, 86, 1–18. [Google Scholar] [CrossRef]
  19. Fauvel, M.; Lopes, M.; Dubo, T.; Rivers-Moore, J.; Frison, P.L.; Gross, N.; Ouin, A. Prediction of plant diversity in grasslands using Sentinel-1 and -2 satellite image time series. Remote Sens. Environ. 2020, 237, 111536. [Google Scholar] [CrossRef]
  20. Ali, I.; Cawkwell, F.; Dwyer, E.; Barrett, B.; Green, S. Satellite remote sensing of grasslands: From observation to management. J. Plant Ecol. 2016, 9, 649–671. [Google Scholar] [CrossRef] [Green Version]
  21. Wachendorf, M.; Fricke, T.; Möckel, T. Remote sensing as a tool to assess botanical composition, structure, quantity and quality of temperate grasslands. Grass Forage Sci. 2018, 73, 1–14. [Google Scholar] [CrossRef]
  22. Gorelick, N.; Hancher, M.; Dixon, M.; Ilyushchenko, S.; Thau, D.; Moore, R. Google earth engine: Planetary-scale geospatial analysis for everyone. Remote Sens. Environ. 2017, 202, 18–27. [Google Scholar] [CrossRef]
  23. Tamiminia, H.; Salehi, B.; Mahdianpari, M.; Quackenbush, L.; Adeli, S.; Brisco, B. Google Earth Engine for geo-big data applications: A meta-analysis and systematic review. ISPRS J. Photogramm. Remote Sens. 2020, 164, 152–170. [Google Scholar] [CrossRef]
  24. Yu, R.; Yao, Y.; Wang, Q.; Wan, H.; Xie, Z.; Tang, W.; Zhang, Z.; Yang, J.; Shang, K.; Guo, X.; et al. Satellite-derived estimation of grassland aboveground biomass in the three-river headwaters region of China during 1982–2018. Remote Sens. 2021, 13, 2993. [Google Scholar] [CrossRef]
  25. Parente, L.; Ferreira, L. Assessing the spatial and occupation dynamics of the Brazilian Pasturelands based on the automated classification of MODIS images from 2000 to 2016. Remote Sens. Environ. 2018, 10, 606. [Google Scholar] [CrossRef] [Green Version]
  26. Peng, D.; Zhang, X.; Zhang, B.; Liu, L.; Liu, X.; Huete, A.R.; Huang, W.; Wang, S.; Luo, S.; Zhang, X.; et al. Scaling effects on spring phenology detections from MODIS data at multiple spatial resolutions over the contiguous United States. ISPRS J. Photogramm. Remote Sens. 2017, 132, 185–198. [Google Scholar] [CrossRef]
  27. Barboza, E.; Turpo Cayo, E.Y.; De Almeida, C.M.; Salas, R.; Rojas Briceño, N.B.; Silva López, J.O.; Barrena, M.Á.; Oliva, M.; Espinoza-Villar, R. Monitoring wildfires in the northeastern peruvian amazon using landsat-8 and sentinel-2 imagery in the GEE platform. ISPRS Int. J. Geo-Inf. 2020, 9, 564. [Google Scholar] [CrossRef]
  28. Amies, A.C.; Dymond, J.R.; Shepherd, J.D.; Pairman, D.; Hoogendoorn, C.; Sabetizade, M.; Belliss, S.E. National mapping of new zealand pasture productivity using temporal sentinel-2 data. Remote Sens. 2021, 13, 1481. [Google Scholar] [CrossRef]
  29. Serrano, J.; Shahidian, S.; Paixão, L.; Marques da Silva, J.; Morais, T.; Teixeira, R.; Domingos, T. Spatiotemporal patterns of pasture quality based on ndvi time-series in mediterranean montado ecosystem. Remote Sens. 2021, 13, 3820. [Google Scholar] [CrossRef]
  30. Tangud, T.; Nasahara, K.; Borjigin, H.; Bagan, H. Land-cover change in the Wulagai grassland, Inner Mongolia of China between 1986 and 2014 analysed using multi-temporal Landsat images. Geocarto Int. 2019, 34, 1237–1251. [Google Scholar] [CrossRef]
  31. Parente, L.; Mesquita, V.; Miziara, F.; Baumann, L.; Ferreira, L. Assessing the pasturelands and livestock dynamics in brazil, from 1985 to 2017: A novel approach based on high spatial resolution imagery and google earth engine cloud computing. Remote Sens. Environ. 2019, 232, 111301. [Google Scholar] [CrossRef]
  32. Fassnacht, F.E.; Li, L.; Fritz, A. Mapping degraded grassland on the Eastern Tibetan Plateau with multi-temporal Landsat 8 data —Where do the severely degraded areas occur? Int. J. Appl. Earth Obs. Geoinf. 2015, 42, 115–127. [Google Scholar] [CrossRef]
  33. Fernández-Habas, J.; García Moreno, A.M.; Hidalgo-Fernández, M.T.; Leal-Murillo, J.R.; Abellanas Oar, B.; Gómez-Giráldez, P.J.; González-Dugo, M.P.; Fernández-Rebollo, P. Investigating the potential of Sentinel-2 configuration to predict the quality of Mediterranean permanent grasslands in open woodlands. Sci. Total Environ. 2021, 791, 148101. [Google Scholar] [CrossRef]
  34. Matsushita, B.; Yang, W.; Chen, J.; Onda, Y.; Qiu, G. Sensitivity of the enhanced vegetation index (EVI) and normalized difference vegetation index (NDVI) to topographic effects: A case study in high-density cypress forest. Sensors 2007, 7, 2636–2651. [Google Scholar] [CrossRef] [Green Version]
  35. Elbeltagi, A.; Aslam, M.R.; Malik, A.; Mehdinejadiani, B.; Srivastava, A.; Bhatia, A.S.; Deng, J. The impact of climate changes on the water footprint of wheat and maize production in the Nile Delta, Egypt. Sci. Total Environ. 2020, 743, 140770. [Google Scholar] [CrossRef]
  36. La Cecilia, D.; Toffolon, M.; Woodcock, C.E.; Fagherazzi, S. Interactions between river stage and wetland vegetation detected with a seasonality index derived from LANDSAT images in the Apalachicola delta, Florida. Adv. Water Resour. 2016, 89, 10–23. [Google Scholar] [CrossRef] [Green Version]
  37. Cord, A.F.; Brauman, K.A.; Chaplin-Kramer, R.; Huth, A.; Ziv, G.; Seppelt, R. Priorities to advance monitoring of ecosystem services using earth observation. Trends Ecol. Evol. 2017, 32, 416–428. [Google Scholar] [CrossRef] [PubMed]
  38. Huete, A.R.; Didan, K.; Van Leeuwen, W. Modis vegetation index. Veg. Index Phenol. Lab 1999, 3, 129. [Google Scholar]
  39. Rouse, J.W.; Hass, R.H.; Schell, J.A.; Deering, D.W. Monitoring Vegetation Systems in the Great Plains with ERTS. In Proceedings of the Third Earth Resources Technology Satellite-1 Symposium, Washington, DC, USA, 10–14 December 1973; Volume 1, pp. 309–317. [Google Scholar]
  40. Gao, X.; Huete, A.R.; Ni, W.; Miura, T. Optical-biophysical relationships of vegetation spectra without background contamination. Remote Sens. Environ. 2000, 74, 609–620. [Google Scholar] [CrossRef]
  41. Gao, X.; Huete, A.R.; Didan, K. Multisensor comparisons and validation of MODIS vegetation indices at the semiarid jornada experimental range. IEEE Trans. Geosci. Remote Sens. 2003, 41, 2368–2381. [Google Scholar] [CrossRef]
  42. Huete, A.R. A soil-adjusted vegetation index (SAVI). Remote Sens. Environ. 1988, 25, 295–309. [Google Scholar] [CrossRef]
  43. Kumari, N.; Srivastava, A.; Dumka, U.C. A long-term spatiotemporal analysis of vegetation greenness over the himalayan region using google earth engine. Climate 2021, 9, 109. [Google Scholar] [CrossRef]
  44. Edirisinghe, A.; Clark, D.; Waugh, D. Spatio-temporal modelling of biomass of intensively grazed perennial dairy pastures using multispectral remote sensing. Int. J. Appl. Earth Obs. Geoinf. 2012, 16, 5–16. [Google Scholar] [CrossRef]
  45. Shelestov, A.; Lavreniuk, M.; Kussul, N.; Novikov, A.; Skakun, S. Exploring google earth engine platform for big data processing: Classification of multi-temporal satellite imagery for crop mapping. Front. Earth Sci. 2017, 5, 17. [Google Scholar] [CrossRef] [Green Version]
  46. Wang, J.; Xiao, X.; Qin, Y.; Dong, J.; Geissler, G.; Zhang, G.; Cejda, N.; Alikhani, B.; Doughty, R.B. Mapping the dynamics of eastern redcedar encroachment into grasslands during 1984–2010 through PALSAR and time series landsat images. Remote Sens. Environ. 2017, 190, 233–246. [Google Scholar] [CrossRef] [Green Version]
  47. Oliva, M.; Collazos, R.; Vásquez, H.; Rubio, K.; Maicelo, J.L. Floristic composition of herbaceous forage species in natural prairies of the main livestock watersheds of the Amazon region. Sci. Agropecu. 2019, 10, 109–117. [Google Scholar] [CrossRef]
  48. Manuel, O.; Diórman, R.; Antonio, M.; Carmen, O.; Mario, A.O. Nutritional content, digestibility and performance of native grasses biomass that dominate livestock Molinopampa, Pomacochas and Leymebamba basins, Amazonas, Peru. Sci. Agropecu. 2015, 6, 211–215. [Google Scholar] [CrossRef] [Green Version]
  49. Caro, C.; Sánchez, E.; Quinteros, Z.; Castañeda, L. Respuesta de los pastizales altoandinos a la perturbación generada por extracción mediante la actividad de “Champeo” en los terrenos de la comunidad campesina Villa De Junín, Perú. Ecol. Apl. 2014, 13, 85. [Google Scholar] [CrossRef] [Green Version]
  50. Tovar, O. Estudio florístico de los pastizales de la costa Norte Del Perú. Rev. Peru. Biol. 2005, 12, 397–416. [Google Scholar] [CrossRef]
  51. MINAGRI. Plan Nacional de Desarrollo Ganadro 2017–2027; Lima, Perú. 2017. Available online: https://www.midagri.gob.pe/portal/download/pdf/dg-ganaderia/plan-nacional-ganadero-2017-2027.pdf (accessed on 25 November 2021).
  52. Estrada Zuñiga, A.C.; Zapana Pari, J.G. Capacidad de carga de pastos de puna húmeda en un contexto de cambio climático. Rev. Investig. Altoandinas J. High Andean Res. 2018, 20, 361–379. [Google Scholar] [CrossRef]
  53. Pasricha, N.S.; Ghosh, P.K. Soil organic carbon dynamics in tropical and subtropical grassland ecosystem. In Carbon Management in Tropical and Sub-Tropical Terrestrial Systems; Springer: Singapore, 2019; pp. 283–297. [Google Scholar] [CrossRef]
  54. Rolando, J.L.; Dubeux, J.C.B.; Ramirez, D.A.; Ruiz-Moreno, M.; Turin, C.; Mares, V.; Sollenberger, L.E.; Quiroz, R. Land use effects on soil fertility and nutrient cycling in the peruvian high-andean puna grasslands. Soil Sci. Soc. Am. J. 2018, 82, 463–474. [Google Scholar] [CrossRef]
  55. Rodríguez, A.F.; Limachi, H.L.; Reátegui, R.F.; Escobedo, T.R.; Ramírez, B.J.; Encarnación, C.F.; Maco, G.J.; Guzman, C.W.; Castro, M.W.; Fachin, M.L.; et al. Zonificación Ecológica y Económica (ZEE) del Departamento de Amazonas; Instituto de Investigaciones de la Amazonía Peruana: Iquitos, Peru, 2010; Available online: https://alicia.concytec.gob.pe/vufind/Record/IIAP_9c9763ff6479f6a1b3956d99a0fb6b7e (accessed on 2 February 2022).
  56. Briceño, N.B.R.; Castillo, E.B.; Torres, O.A.G.; Oliva, M.; Tafur, D.L.; Gurbillón, M.Á.B.; Corroto, F.; López, R.S.; Rascón, J. Morphometric prioritization, fluvial classification, and hydrogeomorphological quality in high Andean livestock micro-watersheds in northern Peru. ISPRS Int. J. Geo-Inf. 2020, 9, 305. [Google Scholar] [CrossRef]
  57. Ruiz, R.E.; Saucedo-Uriarte, J.A.; Portocarrero-Villegas, S.M.; Quispe-Ccasa, H.A.; Cayo-Colca, I.S. Zoometric characterization of creole cows from the Southern Amazon region of Peru. Diversity 2021, 13, 510. [Google Scholar] [CrossRef]
  58. Ramírez, J.M. Uso Actual de la Tierra, Informe Temático. Proyecto Zonificación Ecológica y Económica del Departamento de Amazonas; Iquitos, Peru, 2010. Available online: http://terra.iiap.gob.pe/assets/files/macro/zee-amazonas/02_Geologia_2010.pdf (accessed on 15 February 2022).
  59. Murga, L.; Vásquez, H.; Bardales, J. Caracterización de los sistemas de producción de ganado bovino en las cuencas ganaderas de Ventilla, Florida y Leyva -región Amazonas. Rev. Científica UNTRM Cienc. Nat. Ing. 2019, 1, 28–37. [Google Scholar] [CrossRef]
  60. Vásquez, H.V.; Valqui, L.; Castillo, M.S.; Alegre, J.; Gómez, C.A.; Bobadilla, L.G.; Maicelo, J.L. Caracterización de sistemas silvopastoriles en la cuenca ganadera de molinopampa, zona noroccidental del Perú. Temas Agrar. 2020, 25, 23–34. [Google Scholar] [CrossRef]
  61. Masek, J.G.; Vermote, E.F.; Saleous, N.E.; Wolfe, R.; Hall, F.G.; Huemmrich, K.F.; Gao, F.; Kutler, J.; Teng-Kui, L. A landsat surface reflectance dataset for North America, 1990–2000. IEEE Geosci. Remote Sens. Lett. 2006, 3, 68–72. [Google Scholar] [CrossRef]
  62. Chuvieco, E. Fundamentals of Satellite Remote Sensing. An Environmental Approach, 2nd ed.; CRC Press: Boca Raton, FL, USA, 2016; ISBN 9781498728072. [Google Scholar]
  63. Souza, C.M.; Shimbo, J.Z.; Rosa, M.R.; Parente, L.L.; Alencar, A.A.; Rudorff, B.F.T.; Hasenack, H.; Matsumoto, M.; Ferreira, L.G.; Souza-Filho, P.W.M.; et al. Reconstructing three decades of land use and land cover changes in brazilian biomes with landsat archive and earth engine. Remote Sens. 2020, 12, 2735. [Google Scholar] [CrossRef]
  64. Foga, S.; Scaramuzza, P.L.; Guo, S.; Zhu, Z.; Dilley, R.D.; Beckmann, T.; Schmidt, G.L.; Dwyer, J.L.; Joseph Hughes, M.; Laue, B. Cloud detection algorithm comparison and validation for operational Landsat data products. Remote Sens. Environ. 2017, 194, 379–390. [Google Scholar] [CrossRef] [Green Version]
  65. Housman, I.W.; Chastain, R.A.; Finco, M.V. An evaluation of forest health insect and disease survey data and satellite-based remote sensing forest change detection methods: Case studies in the United States. Remote Sens. 2018, 10, 1184. [Google Scholar] [CrossRef] [Green Version]
  66. McFeeters, S.K. The use of the normalized difference water index (NDWI) in the delineation of open water features. Int. J. Remote Sens. 1996, 17, 1425–1432. [Google Scholar] [CrossRef]
  67. Zhu, Z.; Bi, J.; Pan, Y.; Ganguly, S.; Anav, A.; Xu, L.; Samanta, A.; Piao, S.; Nemani, R.R.; Myneni, R.B. Global data sets of vegetation leaf area index (LAI)3g and fraction of photosynthetically active radiation (FPAR)3g derived from global inventory modeling and mapping studies (GIMMS) normalized difference vegetation index (NDVI3G) for the period 1981 to 2. Remote Sens. 2013, 5, 927–948. [Google Scholar] [CrossRef] [Green Version]
  68. Tucker, C.J. Red and photographic infrared linear combinations for monitoring vegetation. Remote Sens. Environ. 1979, 8, 127–150. [Google Scholar] [CrossRef] [Green Version]
  69. Huete, A.; Didan, K.; Miura, T.; Rodriguez, E..; Gao, X.; Ferreira, L. Overview of the radiometric and biophysical performance of the MODIS vegetation indices. Remote Sens. 2002, 83, 1967. [Google Scholar] [CrossRef]
  70. Ren, H.; Zhou, G.; Zhang, F. Using negative soil adjustment factor in soil-adjusted vegetation index (SAVI) for aboveground living biomass estimation in arid grasslands. Remote Sens. Environ. 2018, 209, 439–445. [Google Scholar] [CrossRef]
  71. Rhyma, P.P.; Norizah, K.; Hamdan, O.; Faridah-Hanum, I.; Zulfa, A.W. Integration of normalised different vegetation index and Soil-Adjusted Vegetation Index for mangrove vegetation delineation. Remote Sens. Appl. Soc. Environ. 2020, 17, 100280. [Google Scholar] [CrossRef]
  72. Breiman, L.E.O. Random forests. Mach. Learn. 2001, 45, 5–32. [Google Scholar] [CrossRef] [Green Version]
  73. Tsai, Y.H.; Stow, D.; Chen, H.L.; Lewison, R.; An, L.; Shi, L. Mapping vegetation and land use types in Fanjingshan National Nature Reserve using google earth engine. Remote Sens. 2018, 10, 927. [Google Scholar] [CrossRef] [Green Version]
  74. FAO. Global Forest Resources Assessment 2000 Main Report; FAO: Rome, Italy, 2001. [Google Scholar]
  75. MINAM. Protocolo: Evaluacion de la Exactitud Tematica del Mapa de Deforestación; MINAM: Lima, Perú, 2014. [Google Scholar]
  76. Padilla, M.; Stehman, S.V.; Chuvieco, E. Validation of the 2008 MODIS-MCD45 global burned area product using strati fi ed random sampling. Remote Sens. Environ. 2014, 144, 187–196. [Google Scholar] [CrossRef]
  77. Rojas, N.B.; Castillo, E.B.; Quintana, J.L.M.; Cruz, S.M.O.; López, R.S. Deforestation in the peruvian Amazon: Indexes of land cover/land use (LC/LU) changes based on GIS. Boletín De La Asociación De Geógrafos Españoles. 2019, 81, 1–34. [Google Scholar] [CrossRef]
  78. Pontius, R.G.; Shusas, E.; McEachern, M. Detecting important categorical land changes while accounting for persistence. Agric. Ecosyst. Environ. 2004, 101, 251–268. [Google Scholar] [CrossRef]
  79. Pettorelli, N.; Vik, J.O.; Mysterud, A.; Gaillard, J.M.; Tucker, C.J.; Stenseth, N.C. Using the satellite-derived NDVI to assess ecological responses to environmental change. Trends Ecol. Evol. 2005, 20, 503–510. [Google Scholar] [CrossRef] [PubMed]
  80. Chávez, R.O.; Clevers, J.G.P.W.; Decuyper, M.; de Bruin, S.; Herold, M. 50 years of water extraction in the Pampa del Tamarugal basin: Can prosopis tamarugo trees survive in the hyper-arid Atacama Desert (Northern Chile)? J. Arid Environ. 2016, 124, 292–303. [Google Scholar] [CrossRef]
  81. Gitelson, A.A. Wide dynamic range vegetation index for remote quantification of biophysical characteristics of vegetation. J. Plant Physiol. 2004, 161, 165–173. [Google Scholar] [CrossRef] [PubMed] [Green Version]
  82. Guzman, J.; Atkinson, P.M.; Dash, J.; Rioja-Nieto, R. Spatiotemporal variation in mangrove chlorophyll concentration using Landsat 8. Remote Sens. 2015, 7, 14530–14558. [Google Scholar] [CrossRef] [Green Version]
  83. Huang, S.; Tang, L.; Hupy, J.P.; Wang, Y.; Shao, G. A commentary review on the use of normalized difference vegetation index (NDVI) in the era of popular remote sensing. J. For. Res. 2020, 32, 2719. [Google Scholar] [CrossRef]
  84. NASA. MODIS Land Cover Type/Dynamics. Available online: https://modis.gsfc.nasa.gov/data/dataprod/mod12.php (accessed on 18 November 2021).
  85. EUMETSAT. AVHRR Advanced Very High Resolution Radiometer. Available online: https://www.eumetsat.int/avhrr (accessed on 25 December 2021).
  86. Wu, G.; De Leeuw, J.; Skidmore, A.; Prins, H.; Liu, Y. Comparison of MODIS and Landsat TM5 images for mapping tempo-spatial dynamics of Secchi disk depths in Poyang Lake National Nature Reserve, China. Int. J. Remote Sens. 2008, 29, 2183–2198. [Google Scholar] [CrossRef]
  87. Salas, R.; Barboza, E.; Oliva, S.M. Dinámica multitemporal de índices de deforestación en el distrito de Florida, departamento de Amazonas, Perú. INDES Rev. Investig. Desarro. Sustent. 2016, 2, 18–27. [Google Scholar] [CrossRef]
  88. Oliva, M.; Maicelo Quintana, J.L.; Torres Guzmán, C.; Bardales Escalante, W. Propiedades fisicoquímicas del suelo en diferentes estadios de la agricultura migratoria en el Área de Conservación Privada “Palmeras de Ocol”, distrito de Molinopampa, provincia de Chachapoyas (departamento de Amazonas). Rev. Investig. Agroproducc. Sustent. 2017, 1, 9–21. [Google Scholar] [CrossRef]
  89. Oliva, M.; Oliva, C.; Rojas, D.; Oliva, M.; Morales, A. Botanical identification of native species most important of dairy basins molinopampa, pomacochas and leymebamba, amazonas, Peru. Sci. Agropecu. 2015, 6, 125–129. [Google Scholar] [CrossRef] [Green Version]
  90. Smith, P.; Gregory, P.J.; Van Vuuren, D.; Obersteiner, M.; Havlík, P.; Rounsevell, M.; Woods, J.; Stehfest, E.; Bellarby, J. Competition for land. Philos. Trans. R. Soc. B Biol. Sci. 2010, 365, 2941–2957. [Google Scholar] [CrossRef] [Green Version]
  91. Alkimim, A.; Sparovek, G.; Clarke, K.C. Converting Brazil’s pastures to cropland: An alternative way to meet sugarcane demand and to spare forestlands. Appl. Geogr. 2015, 62, 75–84. [Google Scholar] [CrossRef]
  92. Thorvaldsson, G.; Bjornsson, H.; Hermannsson, J. The influence of weather on early growth rate of grasses. Búvísindi 2005, 9, 65–73. [Google Scholar]
  93. Han, G.; Hao, X.; Zhao, M.; Wang, M.; Ellert, B.H.; Willms, W.; Wang, M. Effect of grazing intensity on carbon and nitrogen in soil and vegetation in a meadow steppe in Inner Mongolia. Agric. Ecosyst. Environ. 2008, 125, 21–32. [Google Scholar] [CrossRef]
  94. Wang, Y.; Zhou, G.; Jia, B. Modeling SOC and NPP responses of meadow steppe to different grazing intensities in Northeast China. Ecol. Model. 2008, 217, 72–78. [Google Scholar] [CrossRef]
  95. Liu, Y.; Zhang, Z.; Tong, L.; Khalifa, M.; Wang, Q.; Gang, C.; Wang, Z.; Li, J.; Sun, Z. Assessing the effects of climate variation and human activities on grassland degradation and restoration across the globe. Ecol. Indic. 2019, 106, 105504. [Google Scholar] [CrossRef]
  96. Xu, B.; Yang, X.C.; Tao, W.G.; Qin, Z.H.; Liu, H.Q.; Miao, J.M.; Bi, Y.Y. Modis-based remote sensing monitoring of grass production in China. Int. J. Remote Sens. 2008, 29, 5313–5327. [Google Scholar] [CrossRef]
  97. Contreras, J.R.; Volke, V.; Oropeza, J.L.; Rodriguez, C.; Martínez, T.; Martínez, A. Estado actual y causas de la degradación de los agostaderos en el municipio deYanhuitlán, Oaxaca. Terra Latinoam. 2003, 21, 427–435. [Google Scholar]
  98. Tovar, C.; Seijmonsbergen, A.C.; Duivenvoorden, J.F. Monitoring land use and land cover change in mountain regions: An example in the Jalca grasslands of the Peruvian Andes. Landsc. Urban Plan. 2013, 112, 40–49. [Google Scholar] [CrossRef]
  99. Opazo, S.; Garay, E.; Muñoz, R.; López-Saldaña, G.; Aguilar, R.; Radic, S. Desarrollo de una plataforma web sig para el monitoreo dinámico de pastizales en magallania. An. Inst. Patagon. 2014, 42, 39–51. [Google Scholar] [CrossRef] [Green Version]
  100. Zhao, W.; Luo, T.; Wei, H.; Zhang, L. Relative impact of climate change and grazing on NDVI changes in grassland in the Mt. Qomolangma nature reserve and adjacent regions during 2000–2018. Diversity 2022, 14, 171. [Google Scholar] [CrossRef]
  101. Li, Q.; Wang, J.; Xie, H.; Ochir, A. Applicability of grassland production estimation using remote sensing for the Mongolian Plateau by comparing typical regions in China and Mongolia. Sustainability 2022, 14, 3122. [Google Scholar] [CrossRef]
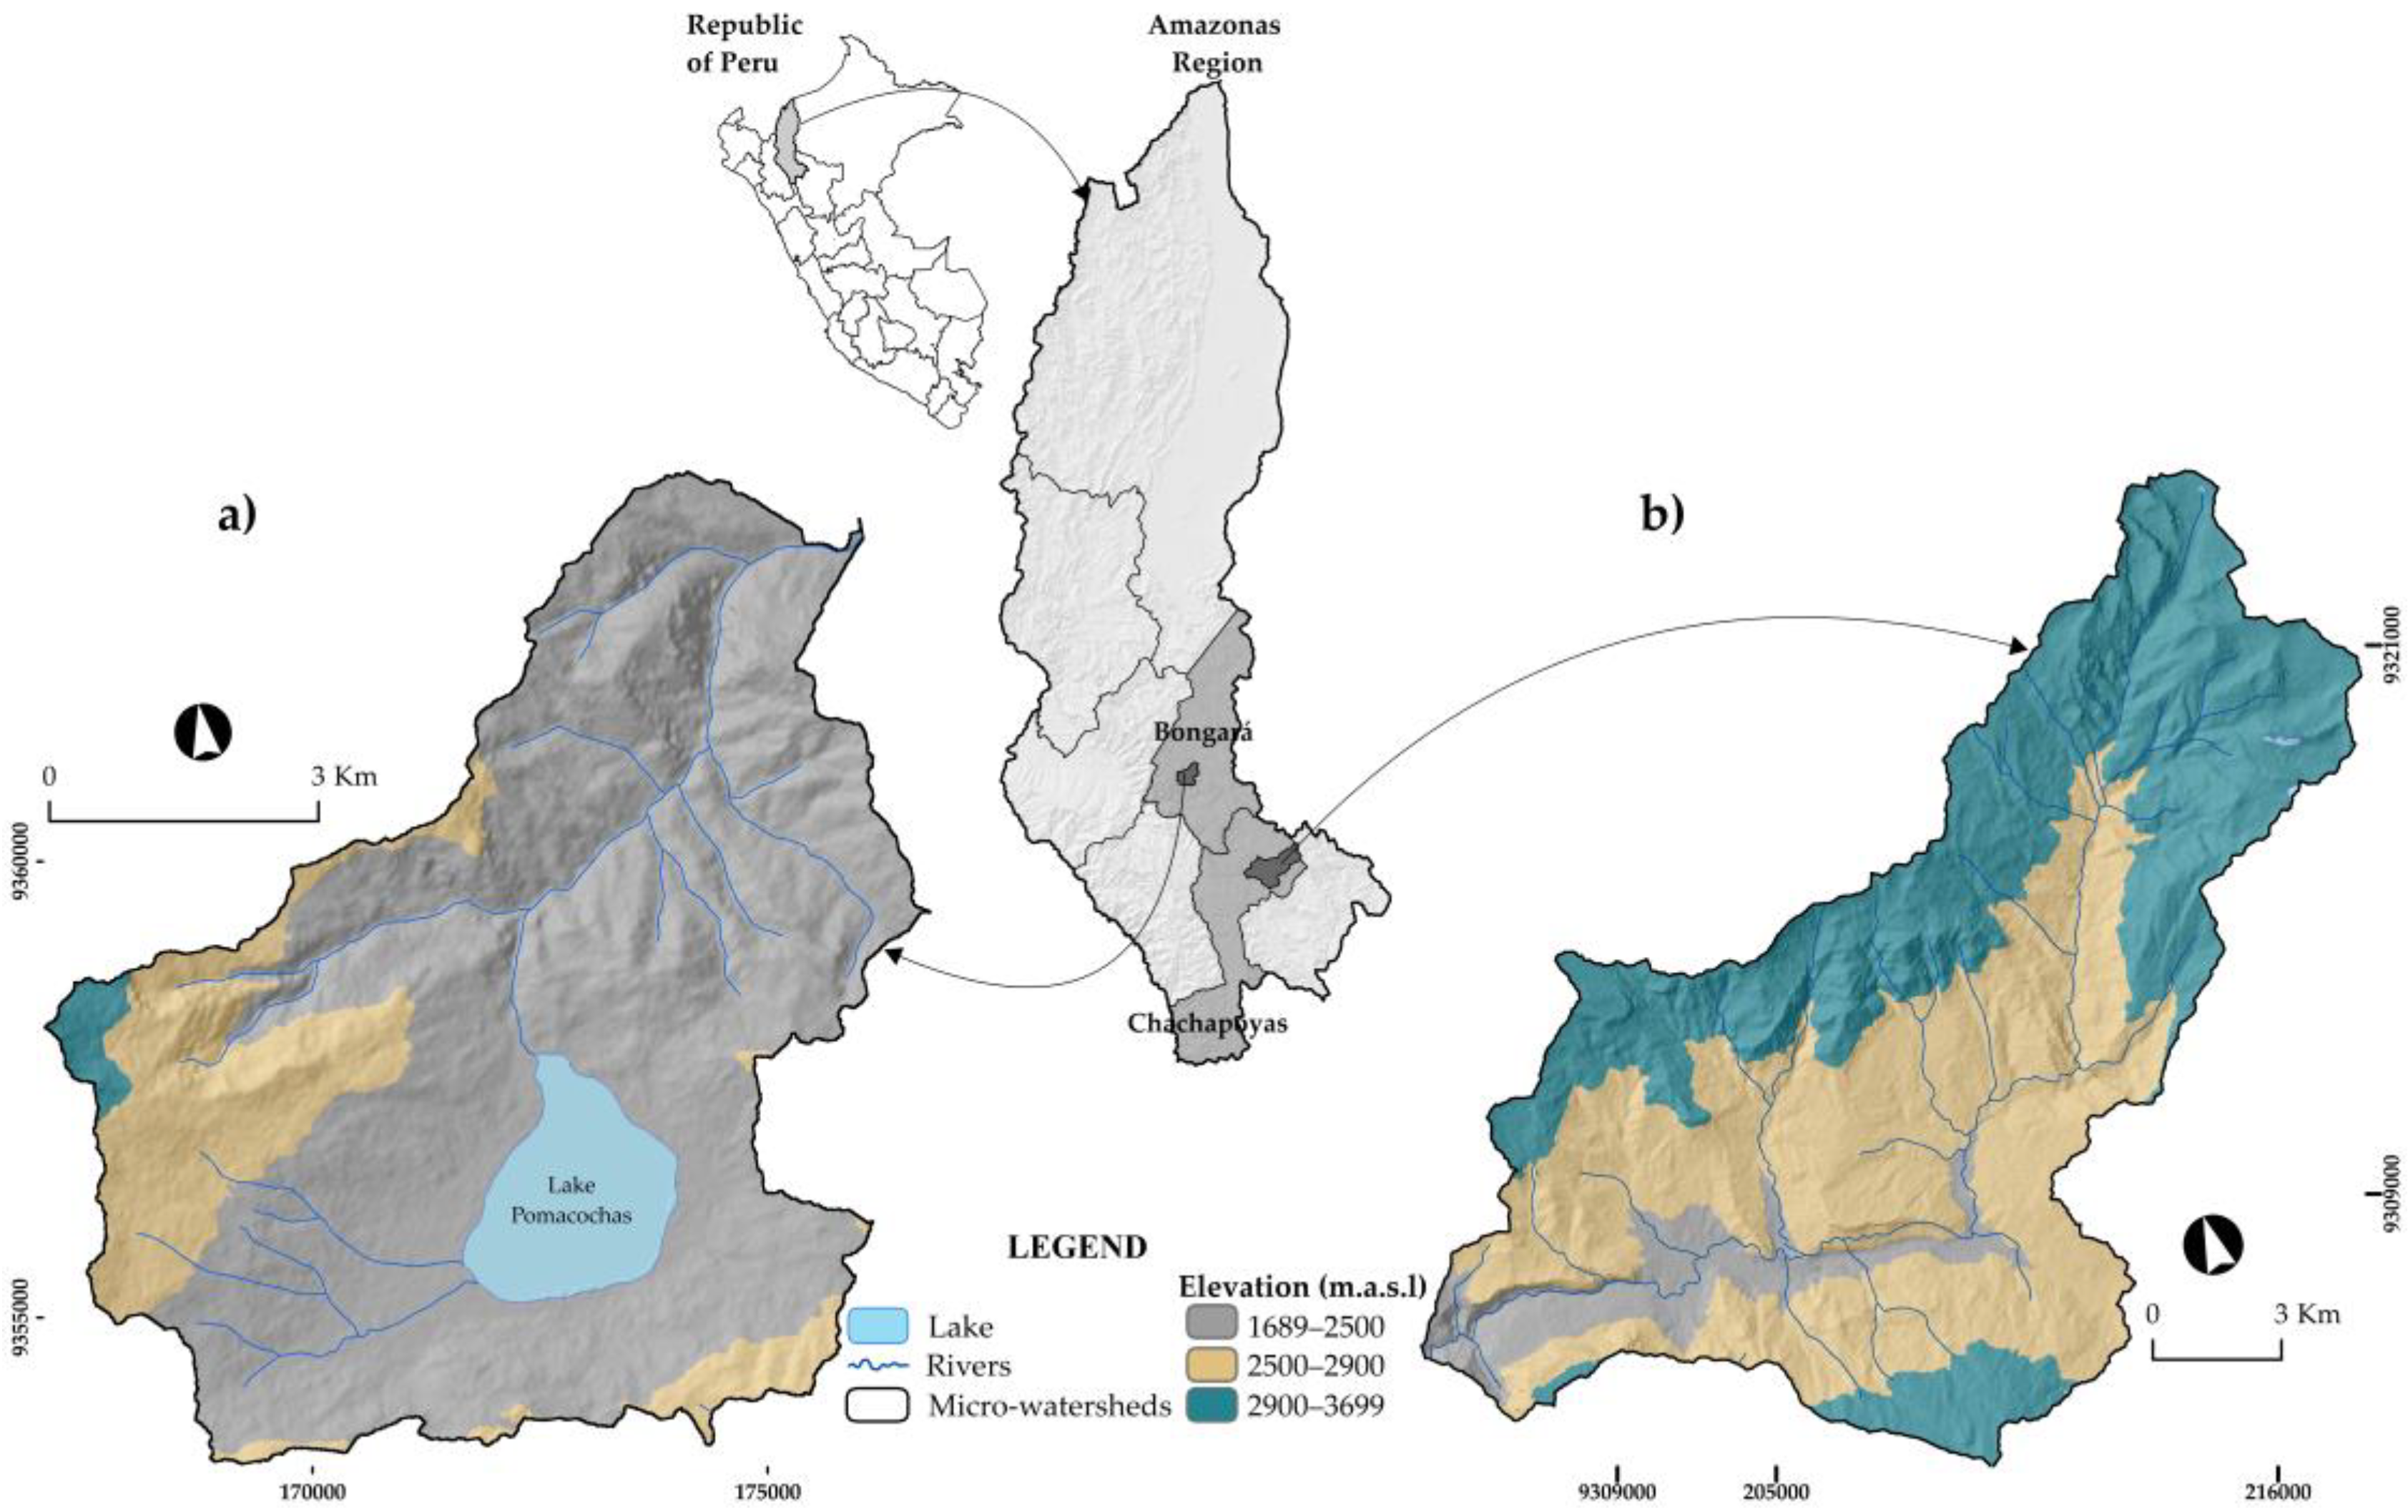
Figure 1. Location of the study area in the Amazon region: (a) the Pomacochas micro-watershed in the province of Bongará and (b) the Ventilla micro-watershed in the province of Chachapoyas.
Land 11 00674 g001
Figure 2. Methodological flowchart used to evaluate the spatial dynamics of grasslands using Landsat data in livestock micro-watersheds of Amazonas (Peru).
Land 11 00674 g002
Figure 3. Training data collection using the GPS receiver in the Pomacochas and Ventilla micro-watersheds. Photos (ad) show grasslands of intensive use in different stages, and photos (eh) show non-grasslands, including andean grassland/scrubs, water, forest and urban areas, respectively.
Land 11 00674 g003aLand 11 00674 g003b
Figure 4. Maps of grassland dynamics from 1990 to 2020: (a) Pomacochas micro-watershed and (b) Ventilla micro-watershed.
Land 11 00674 g004
Figure 5. Global precision values and Kappa index for the Pomacochas and Ventilla micro-watershed.
Land 11 00674 g005
Figure 6. Area of grassland and non-grassland in 1990, 2000, 2010 and 2020 in the Pomacochas micro-watershed.
Land 11 00674 g006
Figure 7. Area of grassland and no-grassland in 1990, 2000, 2010 and 2020 in the Ventilla micro-watershed.
Land 11 00674 g007
Figure 8. Gains and losses in hectares of grassland and non-grassland for each of the periods of analysis in the Pomacochas micro-watershed.
Land 11 00674 g008
Figure 9. Gains and losses in hectares of grassland and no-grassland for each of the periods of analysis in the Ventilla micro-watershed.
Land 11 00674 g009
Figure 10. Maps of the processes of change and stability that occurred between 1990–2000, 2000–2010 and 2010–2020 in the micro-watersheds of Pomacochas and Ventilla.
Land 11 00674 g010
Table 1. Spatial and spectral general characteristics and number of images per year for the Landsat 5, 7 and 8 collections.
CollectionNo. of Images * (Cloud Cover < 50%)
Ventilla Micro-Watershed **Pomacochas Micro-Watershed **
19002000201020201900200020102020
LANDSAT/LT05/C01/T1_SR734 222
LANDSAT/LE07/C01/T1_SR 23
LANDSAT/LC08/C01/T1_SR 12 3
* Total number of mosaic images for the study area. ** Path: 9 and Row: 64.
Table 2. Spectral indices used for estimation.
NameAbbreviationFormulaSource
Normalized Difference Vegetation IndexNDVI N D V I = ( N I R R e d N I R + R e d ) [39]
Enhanced Vegetation IndexEVI E V I = 2.5   N I R R e d   ×   1.5 ( N I R 6   ×   R e d + 7.5   ×   B l u e ) + 1 [41]
Soil-Adjusted Vegetation IndexSAVI S A V I = ( N I R R e d )   ×   1.5 ( N I R + R e d + 0.5 ) [42]
Normalized Difference Water IndexNDWI N D W I = ( G r e e n N I R G r e e n + N I R ) [66]
Table 3. Area (in ha) of grassland and no-grassland in 1990, 2000, 2010 and 2020 in the micro-watersheds of Pomacochas and Ventilla.
Class19902000201020201990–2020
ha%ha%ha%ha%ha%
Pomacochas
Grassland2457.0338.62679.2942.13022.1947.43659.3757.41202.3448.9
No-grassland3913.2561.43690.9957.93348.0952.62710.9142.6−1202.34−30.7
Total6370.281006370.281006370.281006370.28100
Ventilla
Grassland1932.388.63741.6316.73629.2216.24056.2618.12123.88109.9
No-grassland20,500.8191.418,691.5683.318,803.9783.818,376.9381.9−2123.88−10.4
Total22,433.1910022,433.1910022,433.1910022,433.19100
Table 4. Matrix of cross-tabulation, rate of change and indices of changes for grassland and non-grassland in the Pomacochas micro-watershed during three periods of analysis (area in ha and %).
PeriodYear 1Year 2Total Year 2 (ha)Exchange Rate (s)LossTotal ChangeNet ChangeExchange
(Year 1–Year 2)GrasslandNo-GrasslandPercentage (%)
1990–2000Grassland2042.01415.022457.030.8716.8942.839.0533.78
No-grassland637.283275.973913.25−0.5816.2926.895.6821.21
Total Year 1 (ha)2679.293690.996370.28
Gain (%)25.9410.61
2000–2010Grassland2322.37356.922679.291.2113.3239.4412.8026.64
No-grassland699.822991.173690.99−0.9718.9628.639.2919.34
Total Year 1 (ha)3022.193348.096370.28
Gain (%)26.129.67
2010–2020Grassland2812.93209.263022.191.936.9234.9321.0813.85
No-grassland846.452501.643348.09−2.0925.2831.5319.0312.50
Total Year 1 (ha)3659.382710.906370.28
Gain (%)28.016.25
Table 5. Matrix of cross-tabulation, rate of change and indices of changes for grassland and non-grassland in the Ventilla micro-watershed during three periods of analysis (area in ha and %).
PeriodYear 1Year 2Total Year 2 (ha)Exchange Rate (s)LossTotal ChangeNet ChangeExchange
(Year 1–Year 2)GrasslandNo-GrasslandPercentage (%)
1990–2000Grassland1799.53132.861932.396.836.88107.3893.6313.75
No-grassland1942.1018,558.7020,500.80−0.929.4710.128.831.30
Total Year 1 (ha)3741.6318,691.5622,433.19
Gain (%)100.500.65
2000–2010Grassland2850.42891.213741.63−0.3023.8244.633.0041.63
No-grassland778.8017,912.7618,691.560.064.178.930.608.33
Total Year 1 (ha)3629.2218,803.9722,433.19
Gain (%)20.814.77
2010–2020Pasture3048.12581.113629.231.1216.0143.7911.7732.02
No-grassland1008.1417,795.8218,803.96−0.235.368.452.276.18
Total Year 1 (ha)4056.2618,376.9322,433.19
Gain (%)27.783.09
Publisher’s Note: MDPI stays neutral with regard to jurisdictional claims in published maps and institutional affiliations.