Investment Promotion, Tax Competition, and Industrial Land Price in China—Evidence from the Corporate Tax Collection Reform
Abstract
:1. Introduction
2. Policy Background and Literature Review
2.1. Policy Background
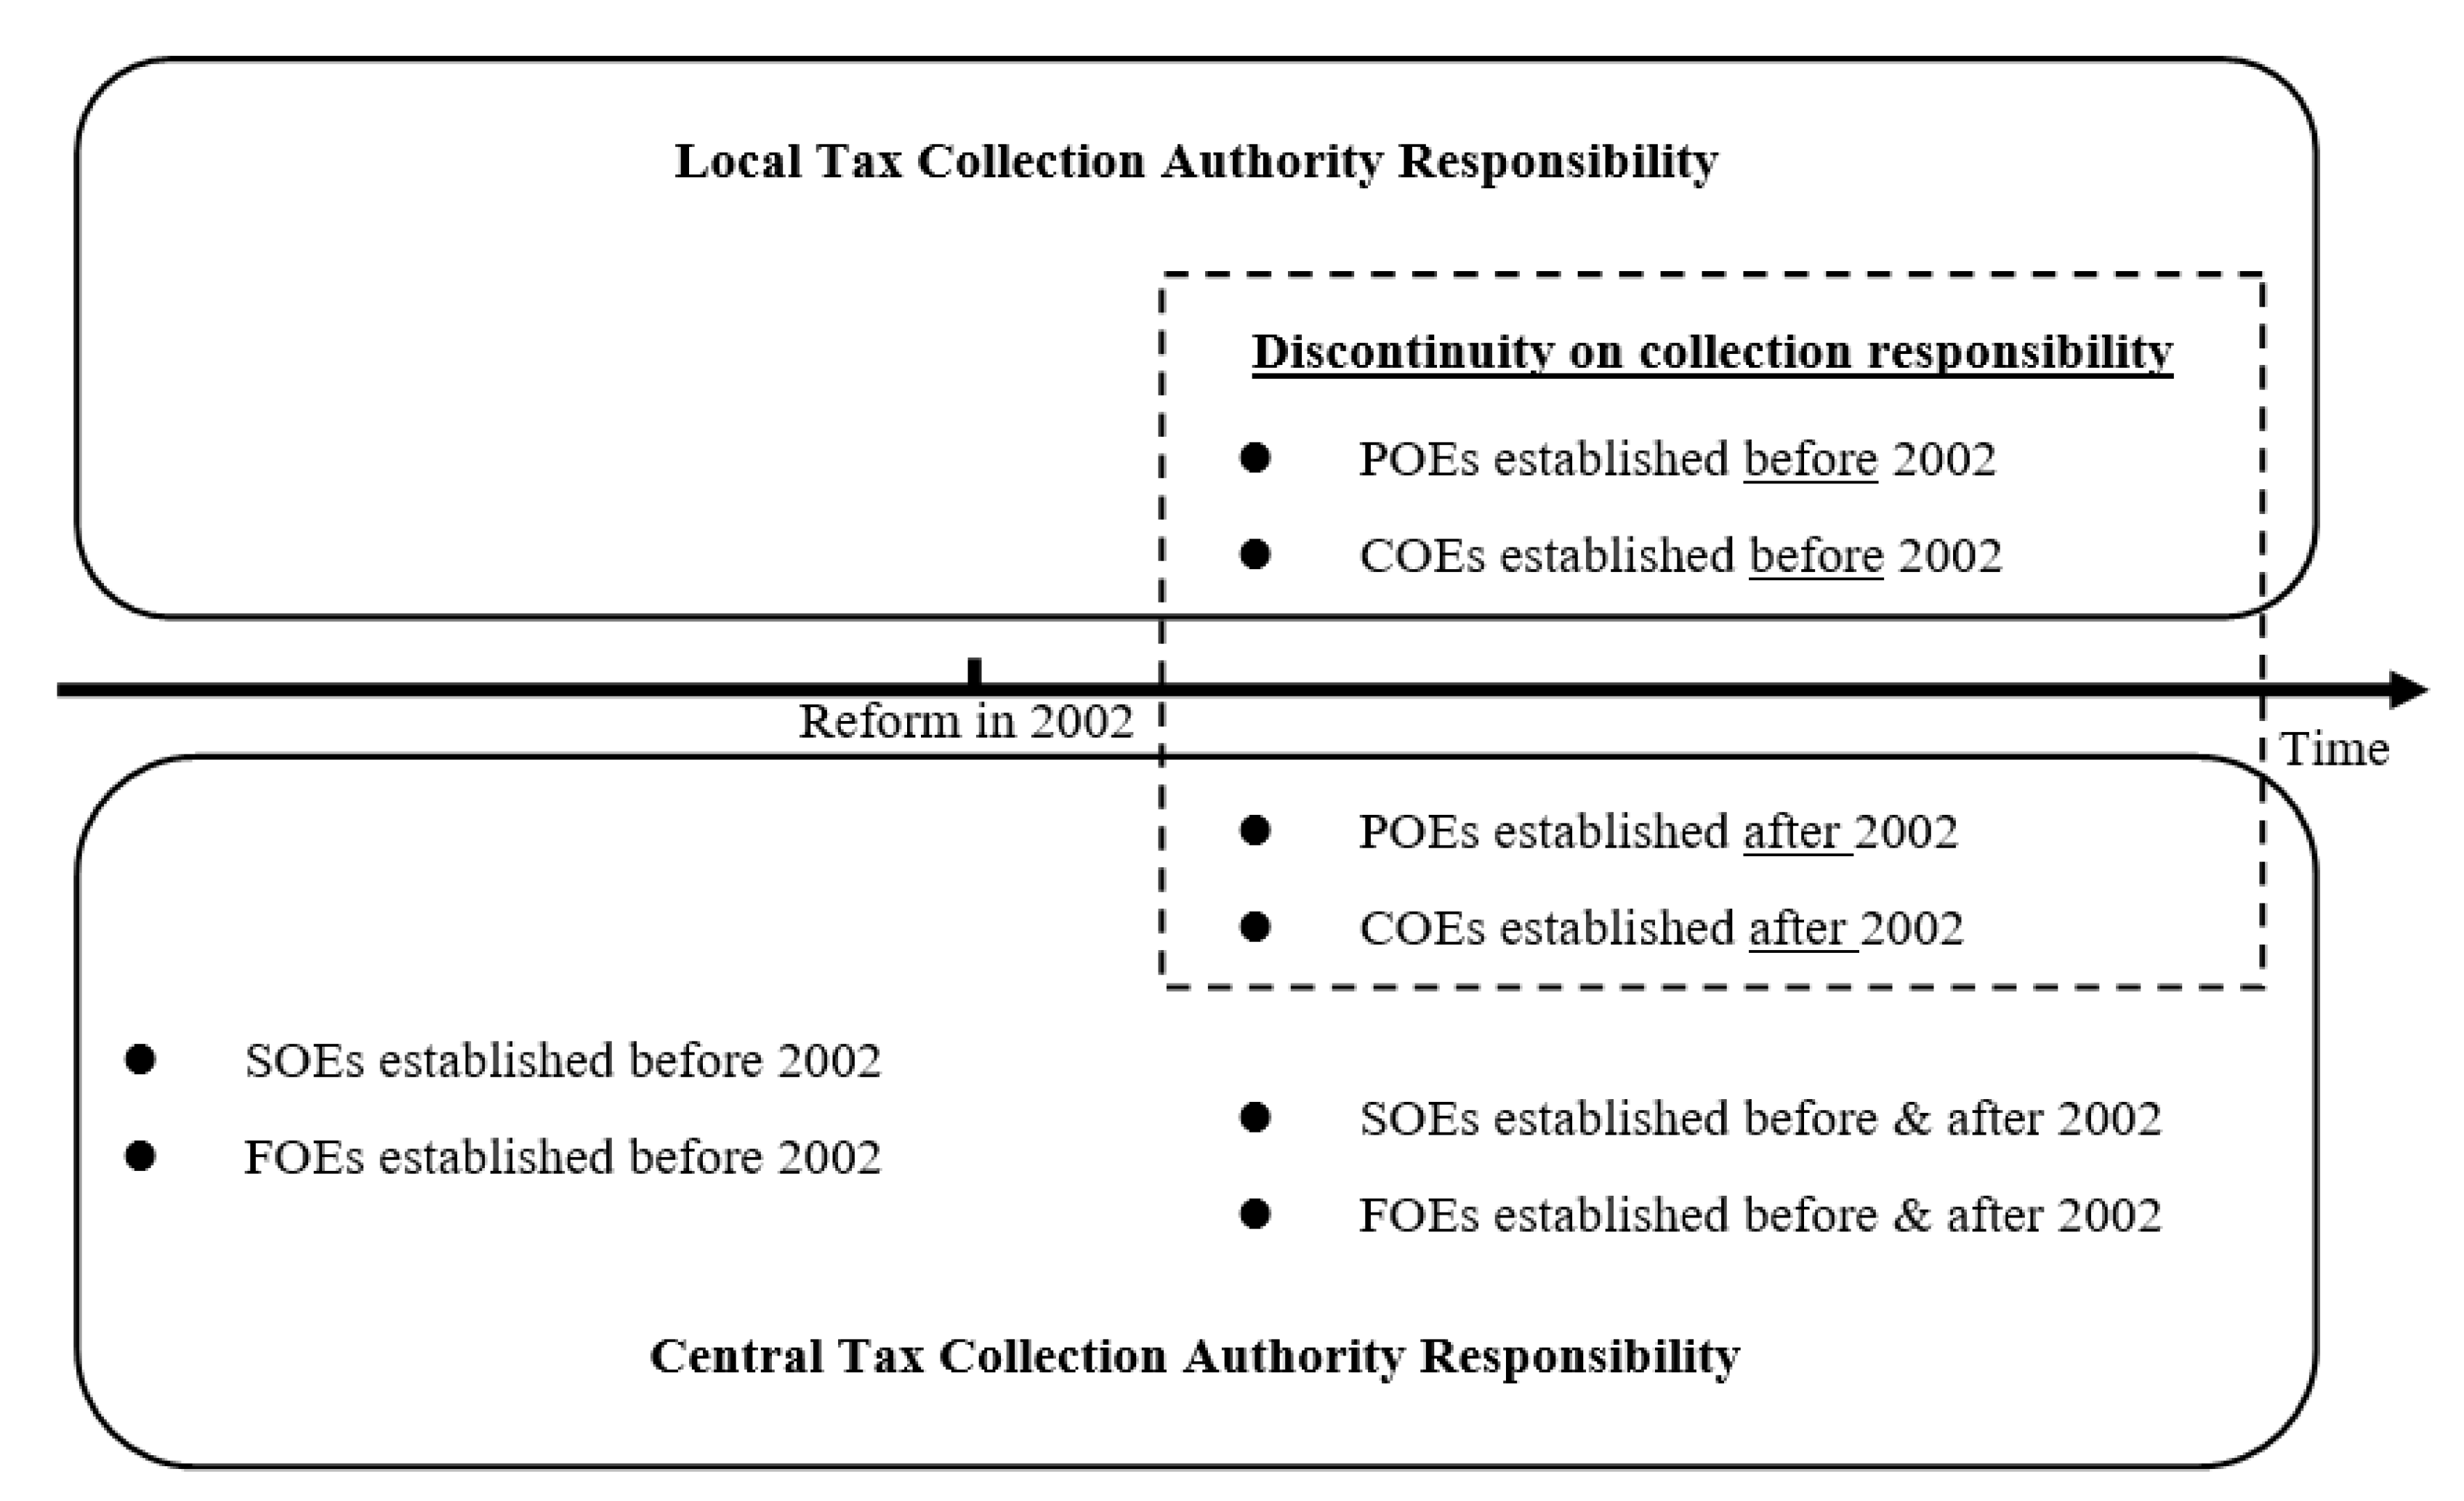
2.1.1. China’s Fiscal System and Tax Collection System Reform
2.1.2. Industrial Land Market and Local Government Strategic Choice
2.2. Literature Review
3. Model Specification and Data
3.1. Data and Sample
3.2. Model Specification
4. Empirical Analysis and the Impact Mechanism
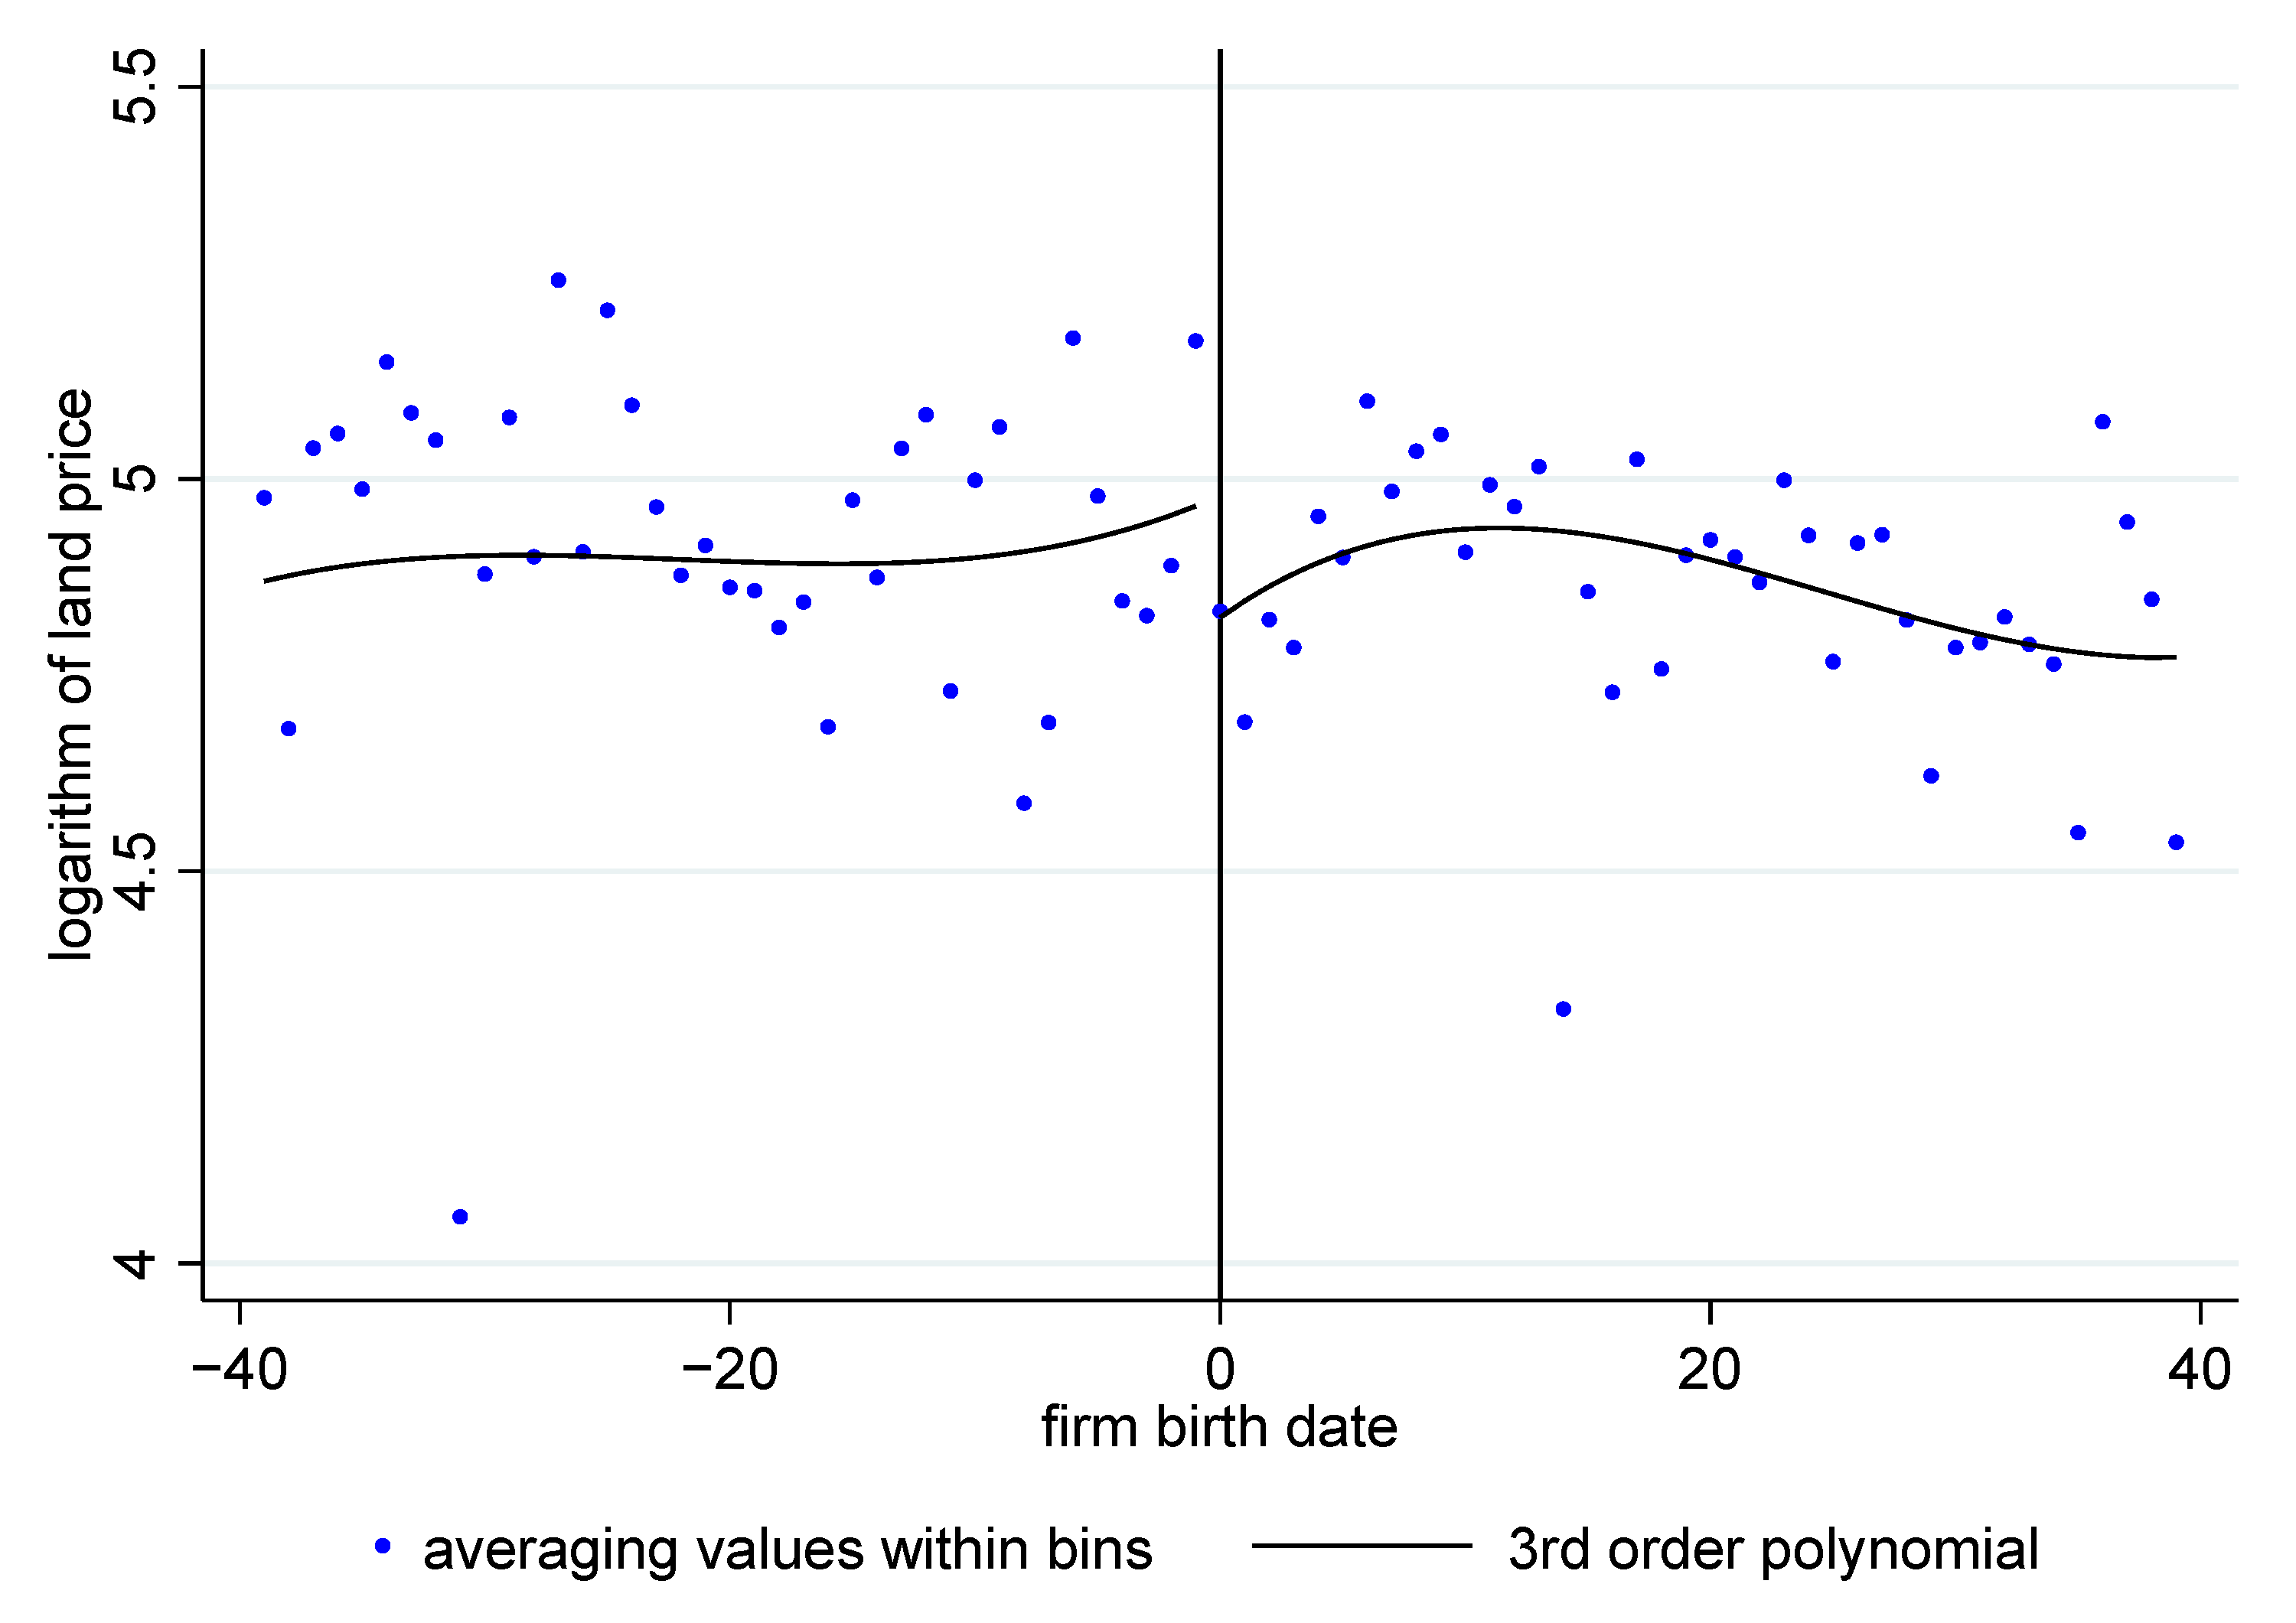
4.1. The Graphical Evidence
4.2. The Baseline Result
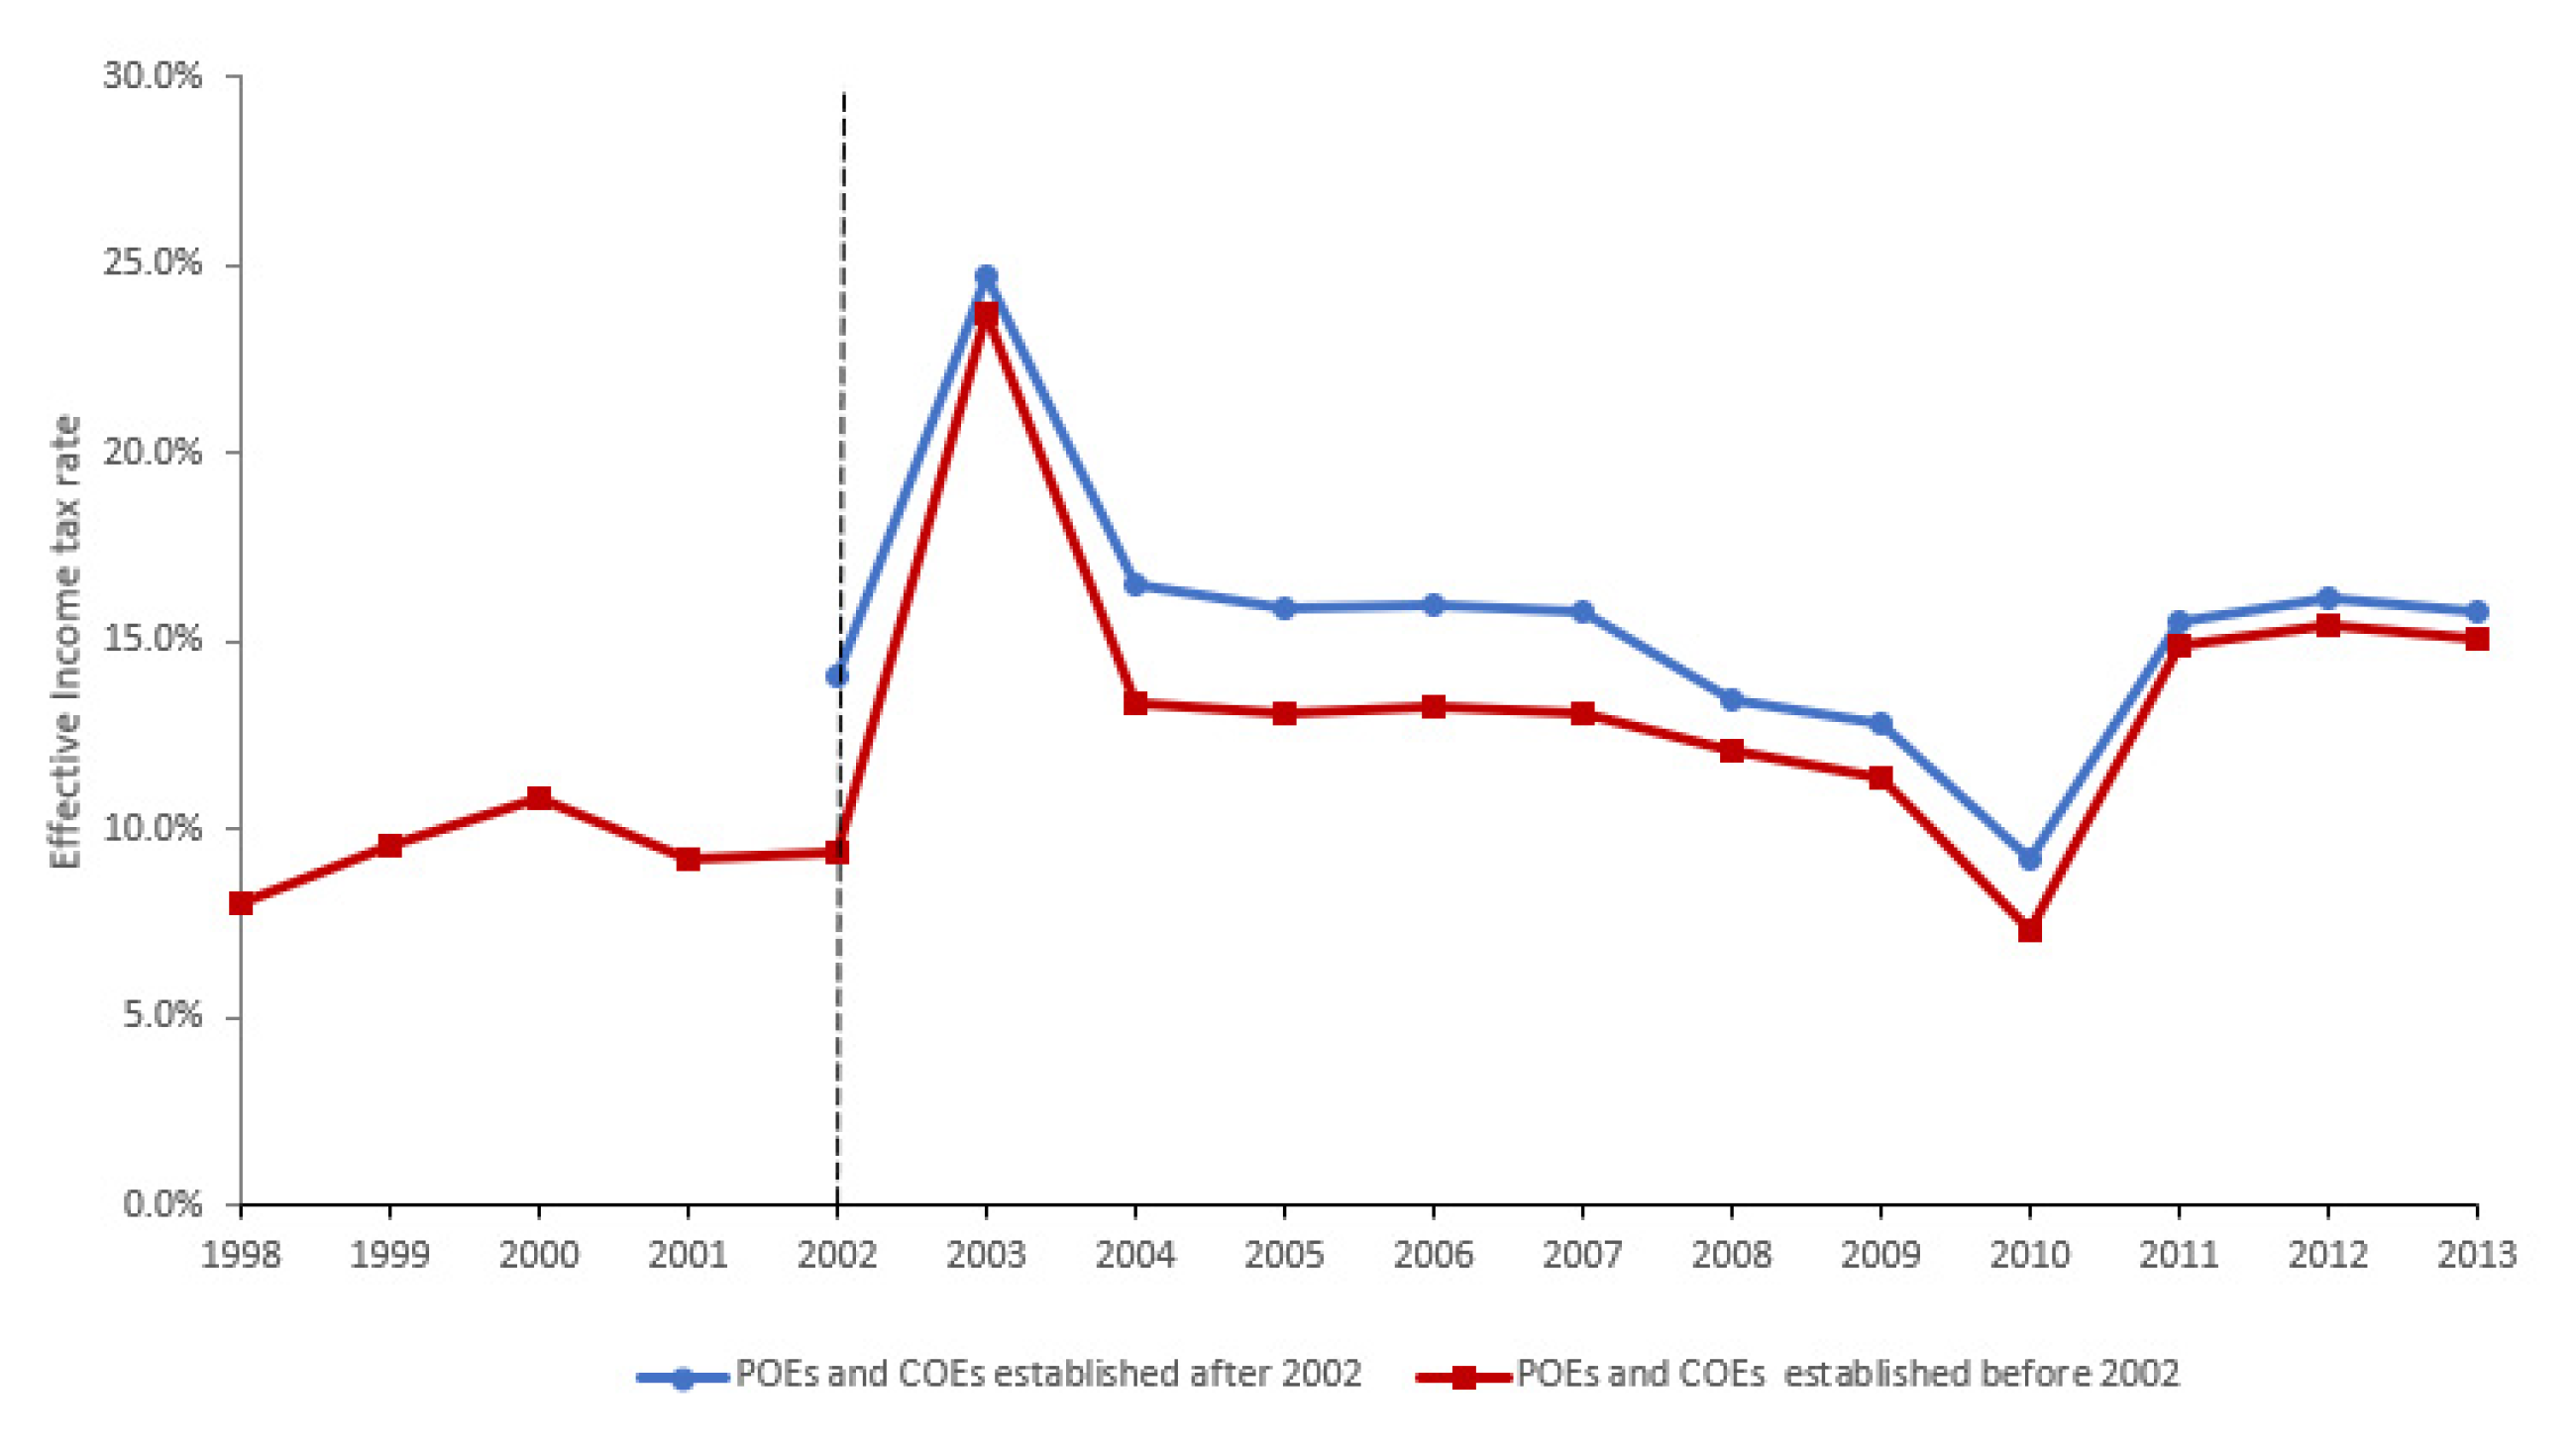
4.3. The Mechanism
5. Robustness
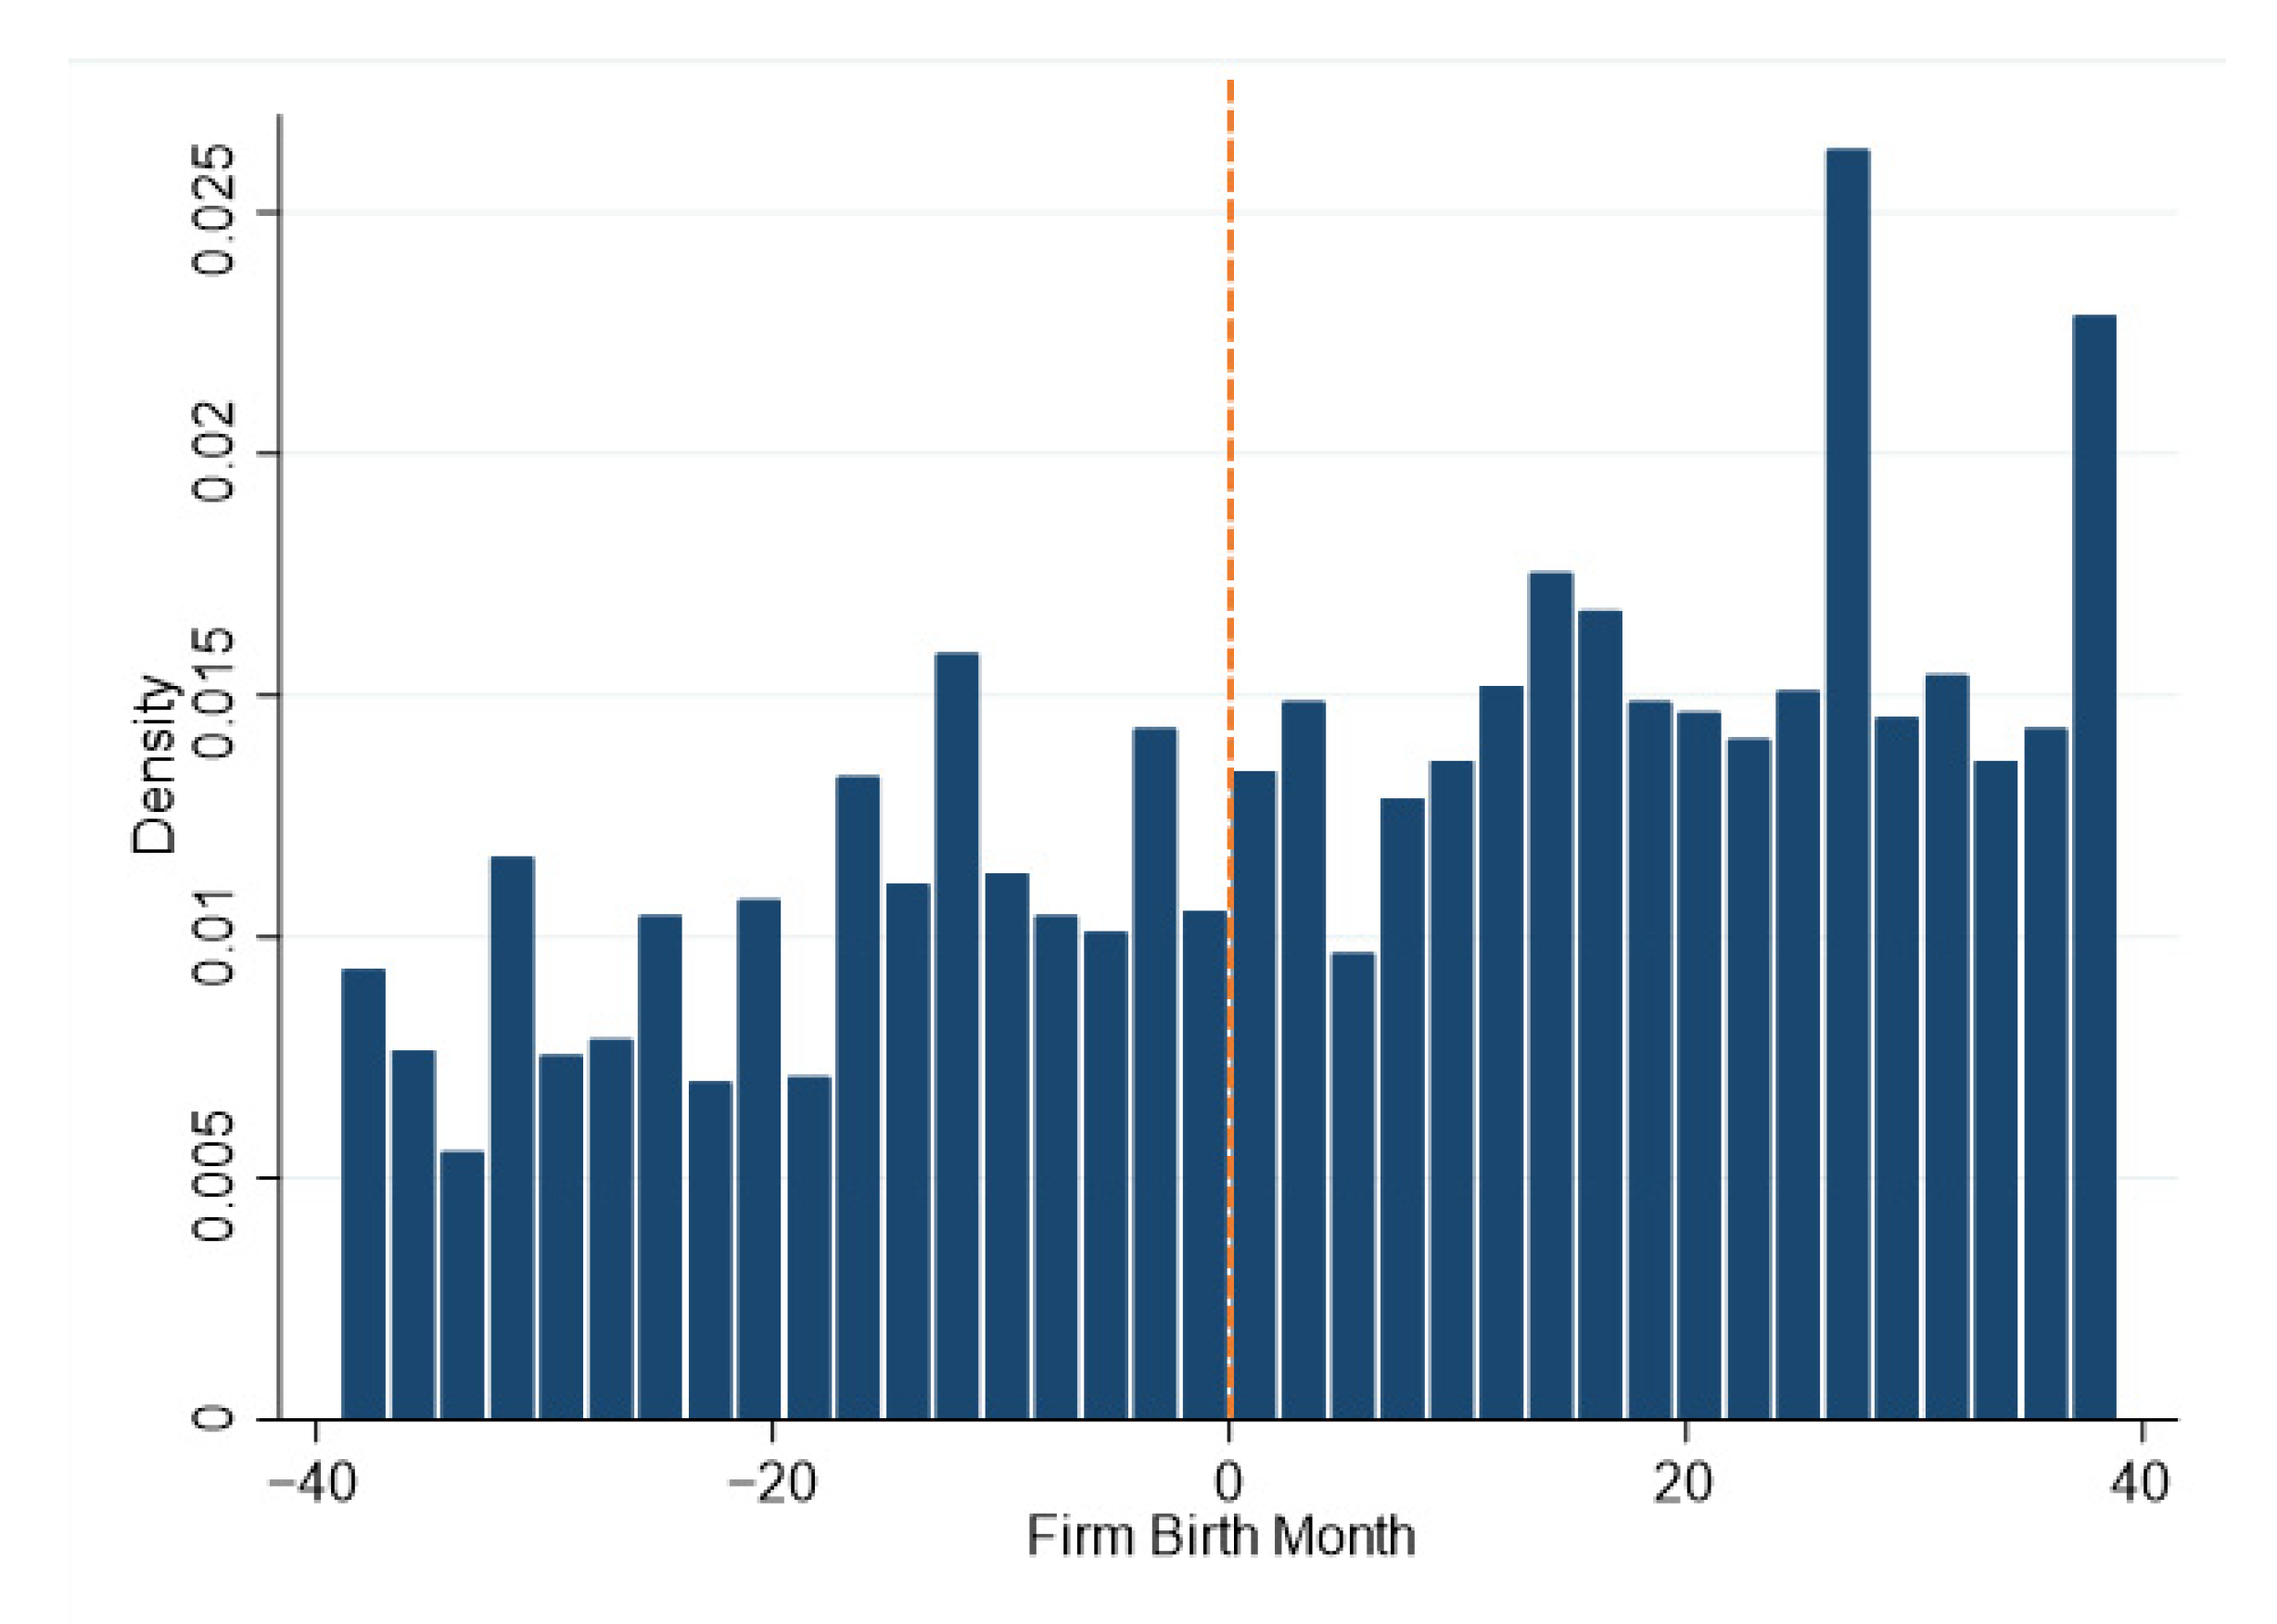
5.1. Identification Check on the Number of Entrants
5.2. Identification Check on Covariates
5.3. The Placebo Test
5.3.1. The Placebo Test on SOEs and FOEs
5.3.2. The Placebo Test on the Cut-Off Date
5.4. Alternative Specifications: Parametric Estimation
5.5. Alternative Explanation
5.5.1. Addressing the Concern of Joining the WTO
5.5.2. Addressing the Concern That Financial Constraints
6. Conclusions
Author Contributions
Funding
Institutional Review Board Statement
Informed Consent Statement
Data Availability Statement
Conflicts of Interest
Appendix A
| Variables | (1) | (2) | (3) | (4) | (5) | (6) | (7) | (8) | (9) | (10) | (11) | (12) | (13) | (14) |
|---|---|---|---|---|---|---|---|---|---|---|---|---|---|---|
| (1) shock | 1.000 | |||||||||||||
| (2) land price | −0.048 | 1.000 | ||||||||||||
| (3) outputvlue | −0.268 | −0.009 | −0.268 | |||||||||||
| (4) Age | 0.603 | −0.038 | −0.432 | 1.000 | ||||||||||
| (5) CIT value | −0.251 | 0.001 | 0.806 | −0.348 | 1.000 | |||||||||
| (6) VAT value | −0.307 | −0.024 | 0.873 | −0.464 | 0.786 | 1.000 | ||||||||
| (7) CIT rate | −0.036 | 0.017 | −0.033 | 0.016 | 0.242 | 0.014 | 1.000 | |||||||
| (8) VAT rate | −0.079 | 0.014 | 0.01 | −0.081 | 0.103 | 0.274 | 0.056 | 1.000 | ||||||
| (9) export | −0.147 | 0.078 | 0.343 | −0.17 | 0.287 | 0.28 | 0.012 | −0.025 | 1.000 | |||||
| (10) ROA | 0.019 | −0.037 | 0.123 | −0.005 | 0.199 | 0.116 | −0.033 | −0.056 | 0.018 | 1.000 | ||||
| (11) SA | −0.436 | −0.026 | 0.814 | −0.763 | 0.688 | 0.798 | 0.001 | 0.09 | 0.316 | −0.092 | 1.000 | |||
| (12) Sales margin | −0.088 | −0.005 | 0.21 | −0.123 | 0.406 | 0.275 | 0.054 | −0.018 | 0.048 | 0.454 | 0.102 | 1.000 | ||
| (13) debt | −0.034 | 0.027 | 0.052 | −0.051 | −0.026 | 0.037 | −0.007 | 0.061 | −0.002 | −0.038 | 0.087 | −0.120 | 1.000 | |
| (14) ltdebt | −0.09 | −0.069 | 0.273 | −0.189 | 0.239 | 0.287 | −0.018 | 0.072 | 0.061 | −0.073 | 0.422 | 0.019 | 0.262 | 1.000 |
| 1 | The tax authority (local or central) responsible for collecting a company is unlikely to change in most cases. Even if the following situations occur, the authority responsible for tax collection will not change: (a) relocating; (b) merging another firm that is collected by the same authority; (c) changing to the type of firm collected by the same tax collection authority. |
| 2 | The Ministry of Land and Resources of the People’s Republic of China also publishes the consolidated land transaction data. |
| 3 | This reform has profoundly influenced China’s fiscal system by changing the way value-added tax is administrated. |
| 4 | Hahn et al. provided a derivation of the systematic bias in kernel regression estimation, and suggested running local linear regression to reduce the bias [40]. |
| 5 | The average price of the land is 203.88 yuan/sqm; the average cost of the land is 5,694,900 yuan per parcel. |
| 6 | In comparison, Wu et al. (2012) found that state-owned enterprises have a 27.4% price discount in Beijing. Chen and Kung conclude that the princeling firms (firms that have political connections) can obtain price discounts ranging from 55.4% to 59.9% [44]. |
| 7 | We choose these bandwidths because the bandwidths selected by the nonparametric estimation are 1.9, 3.8, and 5.7, respectively. |
References
- Wu, Y.; Zhang, X.; Skitmore, M.; Song, Y.; Hui, E.C.M. Industrial Land Price and Its Impact on Urban Growth: A Chinese Case Study. Land Use Policy 2014, 36, 199–209. [Google Scholar] [CrossRef] [Green Version]
- Stehfest, E.; van Zeist, W.-J.; Valin, H.; Havlik, P.; Popp, A.; Kyle, P.; Tabeau, A.; Mason-D’Croz, D.; Hasegawa, T.; Bodirsky, B.L.; et al. Key Determinants of Global Land-Use Projections. Nat. Commun. 2019, 10, 2166. [Google Scholar] [CrossRef] [PubMed] [Green Version]
- Hertel, T.W. Land Use in the 21st Century: Contributing to the Global Public Good. Rev. Dev. Econ. 2017, 21, 213–236. [Google Scholar] [CrossRef]
- Fan, J.; Zhou, L. Three-Dimensional Intergovernmental Competition and Urban Sprawl: Evidence from Chinese Prefectural-Level Cities. Land Use Policy 2019, 87, 104035. [Google Scholar] [CrossRef]
- Chen, T.; Kung, J.K.-S. Do Land Revenue Windfalls Create a Political Resource Curse? Evidence from China. J. Dev. Econ. 2016, 123, 86–106. [Google Scholar] [CrossRef]
- Fan, X.; Qiu, S.; Sun, Y. Land Finance Dependence and Urban Land Marketization in China: The Perspective of Strategic Choice of Local Governments on Land Transfer. Land Use Policy 2020, 99, 105023. [Google Scholar] [CrossRef]
- Xu, Z.; Huang, J.; Jiang, F. Subsidy Competition, Industrial Land Price Distortions and Overinvestment: Empirical Evidence from China’s Manufacturing Enterprises. Appl. Econ. 2017, 49, 4851–4870. [Google Scholar] [CrossRef]
- Li, H.; Zhou, L.-A. Political Turnover and Economic Performance: The Incentive Role of Personnel Control in China. J. Public Econ. 2005, 89, 1743–1762. [Google Scholar] [CrossRef]
- Cai, M.; Fan, J.; Ye, C.; Zhang, Q. Government Debt, Land Financing and Distributive Justice in China. Urban Stud. 2021, 58, 2329–2347. [Google Scholar] [CrossRef]
- Zhong, T.; Zhang, X.; Huang, X.; Liu, F. Blessing or Curse? Impact of Land Finance on Rural Public Infrastructure Development. Land Use Policy 2019, 85, 130–141. [Google Scholar] [CrossRef]
- Slemrod, J. Tax Compliance and Enforcement. J. Econ. Lit. 2019, 57, 904–954. [Google Scholar] [CrossRef]
- Stowhase, S.; Traxler, C. Tax Evasion and Auditing in a Federal Economy. Int. Tax Public Financ. 2005, 12, 515–531. [Google Scholar] [CrossRef] [Green Version]
- Chen, S.X. The Effect of a Fiscal Squeeze on Tax Enforcement: Evidence from a Natural Experiment in China. J. Public Econ. 2017, 147, 62–76. [Google Scholar] [CrossRef]
- Maria Duran-Cabre, J.; Esteller-More, A.; Salvadori, L. Empirical Evidence on Horizontal Competition in Tax Enforcement. Int. Tax Public Financ. 2015, 22, 834–860. [Google Scholar] [CrossRef] [Green Version]
- Tang, T.; Mo, P.L.L.; Chan, K.H. Tax Collector or Tax Avoider? An Investigation of Intergovernmental Agency Conflicts. Account. Rev. 2016, 92, 247–270. [Google Scholar] [CrossRef]
- Cai, J.; Chen, Y.; Wang, X. The Impact of Corporate Taxes on Firm Innovation: Evidence from the Corporate Tax Collection Reform in China; Social Science Research Network: Rochester, NY, USA, 2018. [Google Scholar]
- Clarke Annez, P.; Peterson, G.E. Financing Cities: Fiscal Responsibility and Urban Infrastructure in Brazil, China, India, Poland and South Africa; World Bank: Washington, DC, USA, 2007. [Google Scholar]
- Wang, W.; Ye, F. The Political Economy of Land Finance in China. Public Budg. Financ. 2016, 36, 91–110. [Google Scholar] [CrossRef]
- Tang, P.; Feng, Y.; Li, M.; Zhang, Y. Can the Performance Evaluation Change from Central Government Suppress Illegal Land Use in Local Governments? A New Interpretation of Chinese Decentralisation. Land Use Policy 2021, 108, 105578. [Google Scholar] [CrossRef]
- Han, L.; Kung, J.K.-S. Fiscal Incentives and Policy Choices of Local Governments: Evidence from China. J. Dev. Econ. 2015, 116, 89–104. [Google Scholar] [CrossRef]
- Ahmad, E.; Keping, L.; Richardson, T.J.; Singh, R. Recentralization in China? Social Science Research Network: Rochester, NY, USA, 2002. [Google Scholar]
- Yang, Z. Tax Reform, Fiscal Decentralization, and Regional Economic Growth: New Evidence from China. Econ. Model. 2016, 59, 520–528. [Google Scholar] [CrossRef]
- Shen, C.; Jin, J.; Zou, H. Fiscal Decentralization in China: History, Impact, Challenges and Next Steps. Ann. Econ. Financ. 2012, 13, 1–51. [Google Scholar]
- Loo, B.P.Y.; Chow, S.Y. China’s 1994 Tax-Sharing Reforms: One System, Differential Impact. Asian Surv. 2006, 46, 215–237. [Google Scholar] [CrossRef]
- Cai, H.; Henderson, J.V.; Zhang, Q. China’s Land Market Auctions: Evidence of Corruption? RAND J. Econ. 2013, 44, 488–521. [Google Scholar] [CrossRef] [PubMed] [Green Version]
- Wang, Y.; Hui, E.C. Are Local Governments Maximizing Land Revenue? Evidence from China. China Econ. Rev. 2017, 43, 196–215. [Google Scholar] [CrossRef]
- Wang, L.; Yang, Y. Political Connections in the Land Market: Evidence from China’s State-Owned Enterprises. Real Estate Econ. 2021, 49, 7–35. [Google Scholar] [CrossRef]
- Wilson, J.D. Theories of Tax Competition. Natl. Tax J. 1999, 52, 269–304. [Google Scholar] [CrossRef]
- Hynes, K.; Liu, Y.; Ma, J.; Wooton, I. Tax Competition for FDI: China’s Exceptional Approach. Int. Tax Public Financ. 2021. [Google Scholar] [CrossRef]
- Cai, H.; Liu, Q. Competition and Corporate Tax Avoidance: Evidence from Chinese Industrial Firms*. Econ. J. 2009, 119, 764–795. [Google Scholar] [CrossRef]
- Shevlin, T.; Shivakumar, L.; Urcan, O. Macroeconomic Effects of Corporate Tax Policy. J. Account. Econ. 2019, 68, 101233. [Google Scholar] [CrossRef]
- Xu, W.; Zeng, Y.; Zhang, J. Tax Enforcement as a Corporate Governance Mechanism: Empirical Evidence from China. Corp. Gov. 2011, 19, 25–40. [Google Scholar] [CrossRef]
- He, C.; Huang, Z.; Wang, R. Land Use Change and Economic Growth in Urban China: A Structural Equation Analysis. Urban Stud. 2014, 51, 2880–2898. [Google Scholar] [CrossRef]
- Han, W.; Zhang, X.; Zheng, X. Land Use Regulation and Urban Land Value: Evidence from China. Land Use Policy 2020, 92, 104432. [Google Scholar] [CrossRef]
- Zhou, L.; Tian, L.; Gao, Y.; Ling, Y.; Fan, C.; Hou, D.; Shen, T.; Zhou, W. How Did Industrial Land Supply Respond to Transitions in State Strategy? An Analysis of Prefecture-Level Cities in China from 2007 to 2016. Land Use Policy 2019, 87, 104009. [Google Scholar] [CrossRef]
- Liu, J.; Jiang, Z.; Chen, W. Land Misallocation and Urban Air Quality in China. Environ. Sci. Pollut. Res. 2021, 28, 58387–58404. [Google Scholar] [CrossRef] [PubMed]
- Ma, A.; He, Y.; Tang, P. Understanding the Impact of Land Resource Misallocation on Carbon Emissions in China. Land 2021, 10, 1188. [Google Scholar] [CrossRef]
- Zhang, J.; Shi, Z.; Chu, X.; Shen, Y. The Effect of the Spatial Misallocation of Land Supply on Entrepreneurial Activity. Appl. Econ. Lett. 2021, 28, 949–953. [Google Scholar] [CrossRef]
- Imbens, G.W.; Lemieux, T. Regression Discontinuity Designs: A Guide to Practice. J. Econom. 2008, 142, 615–635. [Google Scholar] [CrossRef] [Green Version]
- Hahn, J.; Todd, P.; Van der Klaauw, W. Identification and Estimation of Treatment Effects with a Regression-Discontinuity Design. Econometrica 2001, 69, 201–209. [Google Scholar] [CrossRef]
- Saez, E.; Matsaganis, M.; Tsakloglou, P. Earnings Determination and Taxes: Evidence from a Cohort-Based Payroll Tax Reform in Greece. Q. J. Econ. 2012, 127, 493–533. [Google Scholar] [CrossRef] [Green Version]
- Hadlock, C.J.; Pierce, J.R. New Evidence on Measuring Financial Constraints: Moving Beyond the KZ Index. Rev. Financ. Stud. 2010, 23, 1909–1940. [Google Scholar] [CrossRef]
- Imbens, G.; Kalyanaraman, K. Optimal Bandwidth Choice for the Regression Discontinuity Estimator. Rev. Econ. Stud. 2012, 79, 933–959. [Google Scholar] [CrossRef]
- Chen, T.; Kung, J.K. Busting the “Princelings”: The Campaign against Corruption in China’s Primary Land Market*. Q. J. Econ. 2019, 134, 185–226. [Google Scholar] [CrossRef] [Green Version]
- Wu, J.; Gyourko, J.; Deng, Y. Evaluating Conditions in Major Chinese Housing Markets. Reg. Sci. Urban Econ. 2012, 42, 531–543. [Google Scholar] [CrossRef] [Green Version]
- Gourdon, J.; Monjon, S.; Poncet, S. Trade Policy and Industrial Policy in China: What Motivates Public Authorities to Apply Restrictions on Exports? China Econ. Rev. 2016, 40, 105–120. [Google Scholar] [CrossRef] [Green Version]
- Chen, Z.; Poncet, S.; Xiong, R. Inter-Industry Relatedness and Industrial-Policy Efficiency: Evidence from China’s Export Processing Zones. J. Comp. Econ. 2017, 45, 809–826. [Google Scholar] [CrossRef] [Green Version]
- Goh, B.W.; Lee, J.; Lim, C.Y.; Shevlin, T.J. The Effect of Corporate Tax Avoidance on the Cost of Equity; Social Science Research Network: Rochester, NY, USA, 2013. [Google Scholar]


| Variable | Definition | Obs. | Mean | S.D. | Min. | Max. |
|---|---|---|---|---|---|---|
| shock | POEs or COEs established after 1 January 2002 equals to 1, equals to 0 otherwise | 12,531 | 0.539 | 0.499 | 0 | 1 |
| land price | The logarithm of land price (Yuan/sqm) | 12,531 | 4.913 | 0.915 | 1.763 | 8.499 |
| outputvlue | The logarithm of firm total output value | 12,439 | 11.486 | 1.674 | 8.826 | 16.887 |
| Age | Land acquisition date minus establishment date | 12,531 | 4.430 | 4.176 | 0 | 17 |
| CIT value | The logarithm of corporate income tax’s revenue | 10,214 | 6.564 | 2.445 | 2.334 | 11.978 |
| VAT value | The logarithm of revenue of value added tax | 10,959 | 7.623 | 2.134 | 3.753 | 14.156 |
| CIT rate | Effective corporate income tax rates | 11,961 | 0.167 | 0.152 | 0.068 | 0.383 |
| VAT rate | Effective value-added tax rates | 9351 | 0.112 | 0.110 | 0.023 | 0.274 |
| export | Equals 1 if the firm exports, equals to 0 otherwise | 12,531 | 0.389 | 0.488 | 0 | 1 |
| ROA | Return on Assets: Net profit divided by total asset | 11,761 | 0.114 | 0.154 | −0.044 | 0.552 |
| SA | Size-age index: −0.737 × log(Asset) + 0.043 × [log(Asset)]2 − 0.04 × life [42] | 11,784 | −2.591 | 0.484 | −3.109 | −1.328 |
| Sales margin | Net profit divided by revenue | 12,455 | 0.056 | 0.071 | −0.066 | 0.225 |
| debt | Total liabilities divided by total assets | 11,781 | 0.620 | 0.295 | 0.096 | 1.168 |
| ltdebt | Long-term liabilities divided by total assets | 10,325 | 0.074 | 0.130 | 0 | 0.443 |
| (1) | (2) | (3) | (4) | |
|---|---|---|---|---|
| Land Price | Land Price | Land Price | Land Price | |
| Bandwidth 1 (BW = 1.9) | −0.345 * | −0.357 * | −0.485 ** | −0.467 * |
| (0.187) | (0.190) | (0.243) | (0.245) | |
| Bandwidth 2 (BW = 3.8) | −0.551 ** | −0.486 ** | −0.591 ** | −0.505 ** |
| (0.231) | (0.235) | (0.283) | (0.291) | |
| Bandwidth 3 (BW = 5.7) | −0.431 ** | −0.344 * | −0.584 ** | −0.475 ** |
| (0.181) | (0.185) | (0.228) | (0.235) | |
| Outputvlue | No | Yes | No | Yes |
| Age | No | Yes | No | Yes |
| CIT value | No | No | Yes | Yes |
| VAT value | No | No | Yes | Yes |
| N | 9891 | 9891 | 9891 | 9891 |
| (1) | (2) | (3) | (4) | (5) | (6) | |
|---|---|---|---|---|---|---|
| Land Price | Land Price | Land Price | Land Price | Land Price | Land Price | |
| Second stage regression | ||||||
| CIT rates | −1.738 * | −3.494 *** | −2.732 *** | |||
| (1.017) | (1.011) | (0.989) | ||||
| VAT rates | −7.673 | −2.553 | −5.116 | |||
| (6.121) | (5.405) | (5.592) | ||||
| Outputvlue | −0.076 | −0.165 *** | −0.135 *** | −0.488 | −0.206 | −0.347 |
| (0.047) | (0.047) | (0.048) | (0.342) | (0.302) | (0.321) | |
| Age | −0.029 *** | −0.031 *** | −0.028 *** | −0.030 *** | −0.023 *** | −0.019 *** |
| (0.003) | (0.004) | (0.003) | (0.007) | (0.006) | (0.006) | |
| Constants | 5.757 *** | 6.825 *** | 5.679 *** | 8.269 *** | 6.561 *** | 6.148 *** |
| (0.498) | (0.49) | (0.553) | (2.191) | (1.902) | (1.996) | |
| Time fixed effect | No | Yes | Yes | No | Yes | Yes |
| Industry fixed effect | No | No | Yes | No | No | Yes |
| First stage regression | ||||||
| shock | 0.031 *** | 0.034 *** | 0.033 *** | −0.011 ** | −0.011 ** | −0.011 ** |
| (0.0044) | (0.0045) | (0.0045) | (0.0050) | (0.0050) | (0.0051) | |
| (1) | (2) | (3) | (4) | |
|---|---|---|---|---|
| Bandwidth | Outputvlue | Age | VAT Value | CIT Value |
| Bandwidth = 1.9 | −0.360 | 0.007 | -- | −0.930 |
| (0.544) | (0.119) | -- | (1.034) | |
| Bandwidth = 3.8 | −0.133 | 0.128 | −0.447 | −0.639 |
| (0.347) | (0.194) | (0.485) | (0.630) | |
| Bandwidth = 5.7 | −0.008 | 0.299 * | −0.256 | −0.508 |
| (0.278) | (0.157) | (0.390) | (0.482) |
| (1) | (2) | (3) | (4) | (5) | (6) | (7) | (8) | (9) | (10) | |
|---|---|---|---|---|---|---|---|---|---|---|
| SOE and FOE | +4 Months | +3 Months | +2 Months | +1 Month | −1 Month | −2 Months | −3 Months | −4 Months | ||
| Bandwidth = 1.9 | 0.434 | 0.085 | 0.117 | −0.149 | 0.222 | 0.084 | 0.217 | 0.214 | 0.129 | −0.311 |
| (0.367) | (0.470) | (0.208) | (0.537) | (0.337) | (0.278) | (0.225) | (0.24) | (0.222) | (0.239) | |
| Bandwidth = 3.8 | 0.304 | 0.341 | 0.199 | 0.099 | 0.244 | −0.225 | 0.245 | 0.294 | 0.039 | −0.316 |
| (0.281) | (0.402) | (0.17) | (0.337) | (0.223) | (0.202) | (0.169) | (0.183) | (0.178) | (0.167) | |
| Bandwidth = 5.7 | 0.327 | 0.396 | 0.243 | 0.220 | 0.087 | −0.277 | 0.118 | 0.139 | −0.049 | −0.180 |
| (0.228) | (0.337) | (0.151) | (0.245) | (0.182) | (0.173) | (0.147) | (0.155) | (0.151) | (0.144) | |
| (1) | (2) | (3) | (4) | (5) | (6) | (7) | (8) | (9) | |
|---|---|---|---|---|---|---|---|---|---|
| 2 Months | 4 Months | 6 Months | 2 Months | 4 Months | 6 Months | 2 Months | 4 Months | 6 Months | |
| shock | −0.440 *** | −0.404 * | −0.372 ** | −0.583 * | −0.658 * | −0.525 * | −0.786 ** | −0.812 ** | −0.502 * |
| (0.155) | (0.216) | (0.162) | (0.344) | (0.363) | (0.272) | (0.368) | (0.375) | (0.284) | |
| |month| | 0.161 | −0.063 | −0.014 | 0.258 | −0.005 | 0.022 | 0.060 | −0.046 | −0.013 |
| (0.134) | (0.044) | (0.025) | (0.191) | (0.057) | (0.032) | (0.208) | (0.061) | (0.034) | |
| shock*|month| | 0.108 | 0.077 | 0.001 | 0.055 | 0.074 | 0.079 | |||
| (0.097) | (0.049) | (0.121) | (0.061) | (0.127) | (0.064) | ||||
| Outputvlue | −0.086 | −0.028 | −0.022 | −0.184 | −0.002 | −0.009 | |||
| (0.119) | (0.069) | (0.053) | (0.122) | (0.072) | (0.055) | ||||
| Age | 0.115 | 0.395 | 0.154 | 0.378 | 0.448 | 0.112 | |||
| (0.325) | (0.259) | (0.2) | (0.368) | (0.274) | (0.208) | ||||
| VAT value | −0.031 | −0.068 | −0.055 | −0.013 | −0.054 | −0.027 | |||
| (0.082) | (0.051) | (0.04) | (0.093) | (0.057) | (0.043) | ||||
| CIT value | 0.051 | 0.032 | 0.027 | 0.092 | 0.039 | 0.038 | |||
| (0.06) | (0.037) | (0.029) | (0.062) | (0.039) | (0.031) | ||||
| Constants | 4.969 *** | 5.065 *** | 5.012 *** | 5.935 *** | 7.075 *** | 6.352 *** | 6.848 *** | 6.214 *** | 5.136 *** |
| (0.096) | (0.085) | (0.074) | (1.478) | (1.097) | (0.983) | (1.663) | (1.183) | (1.045) | |
| Year Dummy | No | No | No | Yes | Yes | Yes | Yes | Yes | Yes |
| Industry Dummy | No | No | No | No | No | No | Yes | Yes | Yes |
| R-squared | 0.037 | 0.016 | 0.009 | 0.112 | 0.112 | 0.092 | 0.448 | 0.264 | 0.187 |
| (1) | (2) | (3) | (4) | |
|---|---|---|---|---|
| Land Price | Land Price | Land Price | Land Price | |
| Shock | −0.151 *** | −0.163 *** | −0.141 *** | −0.154 *** |
| (0.031) | (0.031) | (0.031) | (0.03) | |
| Export | 0.042 | 0.068 | 0.009 | 0.033 |
| (0.043) | (0.043) | (0.043) | (0.042) | |
| Export*shock | 0.017 | −0.035 | 0.022 | −0.032 |
| (0.054) | (0.053) | (0.053) | (0.052) | |
| Constants | 5.246 *** | 6.111 *** | 4.096 *** | 4.394 *** |
| (0.104) | (0.896) | (0.144) | (0.876) | |
| Controls | Yes | Yes | Yes | Yes |
| Time fixed effect | No | Yes | No | Yes |
| Industry fixed effect | No | No | Yes | Yes |
| Obs. | 5503 | 5503 | 5503 | 5503 |
| R-squared | 0.008 | 0.048 | 0.074 | 0.117 |
| (1) | (2) | (3) | (4) | (5) | |
|---|---|---|---|---|---|
| Bandwidth | ROA | SA | Sales Margin | Liability Rate | Long-Term Liability Rate |
| Bandwidth = 1.9 | −0.046 | −0.149 | −0.085 | 0.038 | −0.019 |
| (0.073) | (0.133) | (0.102) | (0.22) | (0.072) | |
| Bandwidth = 3.8 | −0.053 | −0.005 | 0.002 | -- | 0.025 |
| (0.046) | (0.082) | (0.062) | (--) | (0.046) | |
| Bandwidth = 5.7 | −0.043 | −0.046 | −0.033 | −0.066 | 0.001 |
| (0.054) | (0.103) | (0.078) | (0.154) | (0.055) |
Publisher’s Note: MDPI stays neutral with regard to jurisdictional claims in published maps and institutional affiliations. |
© 2022 by the authors. Licensee MDPI, Basel, Switzerland. This article is an open access article distributed under the terms and conditions of the Creative Commons Attribution (CC BY) license (https://creativecommons.org/licenses/by/4.0/).
Share and Cite
Song, H.; Sun, G. Investment Promotion, Tax Competition, and Industrial Land Price in China—Evidence from the Corporate Tax Collection Reform. Land 2022, 11, 682. https://doi.org/10.3390/land11050682
Song H, Sun G. Investment Promotion, Tax Competition, and Industrial Land Price in China—Evidence from the Corporate Tax Collection Reform. Land. 2022; 11(5):682. https://doi.org/10.3390/land11050682
Chicago/Turabian StyleSong, Huasheng, and Guili Sun. 2022. "Investment Promotion, Tax Competition, and Industrial Land Price in China—Evidence from the Corporate Tax Collection Reform" Land 11, no. 5: 682. https://doi.org/10.3390/land11050682
APA StyleSong, H., & Sun, G. (2022). Investment Promotion, Tax Competition, and Industrial Land Price in China—Evidence from the Corporate Tax Collection Reform. Land, 11(5), 682. https://doi.org/10.3390/land11050682


