Abstract
Drastic land pattern change has taken place in the northeast region of China, which may have a significant impact on landscape and ecosystem service. Up to now, insufficient renewal of land use patterns may limit the latest assessment of landscape transition and ecosystem service value. Meanwhile, the adaptive ecosystem service value improvement method should be established. To solve this issue, the integrated methodology of land-use change monitoring—landscape analysis—the promoted ecosystem service measurement is established. Results show that: (1) New evidence is observed that the cultivated land in Northeast China has been reduced, with 309,610.33 km2 in 2010 and 309,417.52 km2 in 2020, showing a net change area of −192.82 km2. This is the opposite of the increase of cultivated land compared to the past. (2) Shannon’s diversity index displays an upward trend, with the richer landscape types and higher fragmentation in the whole region. In addition, the contagion index reduced, with a total decrease of 1.93, indicating that the patches distribute intermittently and the agglomeration degree of these patches is weakened. (3) More precise ecosystem service value is assessed, from 2868.39 billion yuan in 2000 to 2814.06 billion yuan in 2020, and the hydrological regulation, climate regulation, and soil conservation play a dominant role in these functions in 2020. The spatial pattern of ecosystem service value is high-rank in the Northwest and Southeast, and low-rank in other directions. This study provides the new results on land change and landscape pattern and creates an improved ecosystem service value assessment method in Northeast China, to provide a more suitable ecosystem assessment application for Northeast China.
1. Introduction
Land-use change has a significant impact on the landscape and ecosystem service [,]. Since entering the 21st century, China’s economic development has entered a stage of rapid development [,]. In this process, the Chinese government has implemented a series of policies on land use, to achieve sustainable development of the economy, food, environment, and ecology [,,,]. This has led to a drastic change in China’s land use since 2000 []. The change in land use often brings about the evolution of landscape patterns, along with the spatial distribution and reconfiguration of different landscape sizes and shapes [,,], which can reflect the spatial characteristic of landscape heterogeneity. The spatial heterogeneity of landscape is always an indirect indicator of the quality and vulnerability of regional ecological environments [,,]. Moreover, ecosystem, such as ecological structure and function [,], is closely related to human settlements and ecological health. It also provides ecosystem service for the focused issues such as climate warming [], carbon cycle [], and hydrological process [], which has become one of the scientific research objectives concerned by the scholars [,].
The spatial-temporal pattern of land use mainly depends on land products’ classification system and resolution [,]. Relatively coarse resolution of early land products, such as 1 km MODIS [] and 300 m European Space Agency (ESA) land cover data in the period of 1992–2015 [] may not be accurate enough for the evaluation of regional-scale land area. With the popularization of remote sensing technology and big data platform, more land products are used to describe the change, such as global 30 m [,], 10 m products [], and high-resolution image products [,]. In China, considering the multi-phases of land-use products and the improvement of the classification system, the national resource and environment remote sensing data (i.e., vector format) advocated by the Chinese Academy of Sciences, with multi-phases of the 1980s–2020 and classification system of 25 secondary land types [,,], has been widely used in scientific investigation, showing good performance at national, regional, and local scales, and this land use data is applied this study area. Taking the land use pattern and its evolutionary process as the basic carrier, the spatiotemporal difference and ecological meaning of landscape index are always described through the urban, watershed, and regional scales [,]. Research on ecosystem service value, Daily [] provides the early concept and framework, which lays the foundation for the follow-up research. Like, the ecosystem service value is monetized [], and the annual average ecosystem service value is calculated quantitatively []. Moreover, the ecosystem service is usually seen as the benefits obtained by human beings from the ecosystem, including supply service (i.e., providing food and water), regulation service (i.e., controlling floods and diseases), cultural service (i.e., spiritual, entertainment, and cultural benefits), and support service (i.e., maintaining the nutrient cycle of the earth’s living environment). These ecosystem services not only provide human beings with raw materials for production and life such as food and medicine but also create and maintain the life support system of the earth and form the necessary environmental conditions for human survival. At the same time, it also provides leisure, entertainment, and aesthetic enjoyment for human life [,,]. In China, the most commonly used ecosystem accounting method is the equivalent factor method proposed by Xie Gaodi [,], which fully considers the situation of China’s ecosystem and gives different equivalent factors/values through the combination of different ecological conditions and land use/cover changes, but in this method, construction land is used as bare land. In view of the deficiency that the construction land is regarded as bare land in this method, we improve a new calculation method, to present the more real ecosystem service as well as its change.
In the early days, Northeast China was called the “Northern Wilderness”, which was sparsely populated, backward economy, and most of the undeveloped natural environment. Later, it became “Beidacang”, China’s grain base, and one of China’s heavy industry centers. In the process of economic development, especially since 2000, significant land changes have taken place in regional ecosystem services, such as the loss of a large number of natural wetlands. The study of ecosystem service value in this region plays an important role in analyzing the natural supply, ecological regulation and service, culture. Moreover, as the base of the agricultural and ecological environment, the northeast region of China acts as an essential role in currently Chinese socio-economic development and ecological environment protection []. At present, the latest land change and its impact on landscape and ecosystem service value in Northeast China are still lacking. Therefore, the goals of this study are below: (1) to analyze the current land use and its spatial pattern in the period 2000–2020, and to provide the new land change phenomena, which is found according to the latest land-use monitoring; (2) to describe the change characteristic of the landscape at the type scale and at the landscape scale through landscape indicators in the period of 2000–2020; and (3) to establish the improved method and to calculate the value, function and spatial change pattern of the assessed ecosystem service during the studied period. Finally, we discuss the new findings in land use, landscape, and ecosystem service effects.
2. Methods
2.1. Study Area
Northeast China locates in the Northeast Plain, including the provinces of Heilongjing, Jilin, and Liaoning (Figure 1), with a total area of 793,571.98 km2. The terrain in the region is mainly plain (i.e., Northeast Plain). A large number of rivers pass through the central region, with the main name of Heilongjiang, Songhua, and Wusuli. From the south to the north, this region is featured by the middle temperate zone and sub-cold zone, along with the humid and semi-humid regions, which form a region featured by the temperate monsoon climate. The land-use types are diverse. By 2020, the forest land area has reached 409,400 km2, accounting for 12.65% of China’s forest land, indicating a significant role in the timber and ecological environment base of China. According to statistics [], the forestry coverage rate of the whole region is 41.50%, which is much higher than the national scale. Meanwhile, the surface soil is mainly black soil, meadow soil, chernozem, and albic soil, which is mostly distributed in the northeast of Songnen Plain, Sanjiang Plain, and Songliao plain. The total area of cultivated land in the whole region accounts for 20.7% of the whole country. This makes Northeast China become a production base of commercial grain. According to statistics, the grain output of Northeast China in 2020 is 138.83 million tons, which accounts for over one-fifth of the country’s total grain output. In 2020, “one core (i.e., high-quality development) and five strategies (i.e., national defense, grain, ecology, energy, and industry)” are focused on Northeast China, which pays attention to the protection of grassland, forest, soil, and wetland, and gives full play to ecological benefits and ecological security, for building the food and ecological security barriers in China.
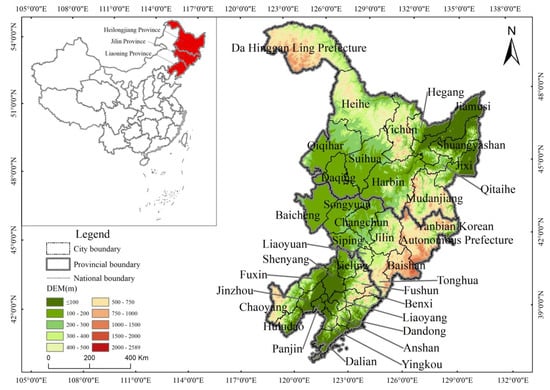
Figure 1.
Location map of the study area.
2.2. Framework of the Method
To explore the latest land use pattern and its accurate ecosystem service value in Northeast China, land-use change detection technology is first calculated the land-use change from 2000 to 2020 and analyzed the new land cover phenomenon of these changes in this region. Then, landscape index changes are guided by as few ecological indexes as possible to fully express the change of landscape at the different levels. Finally, a new ecosystem service value calculation of construction land is created according to the internal land cover of construction land in Northeast China, which is used to make up for the current underestimation of the ecosystem service value of construction land in this region. Please see the following section for a detailed method.
2.2.1. Data Sources
The adopted data in this investigation mainly contains the land use product and statistical yearbooks. Among them, the land-use dataset comes from the data center of resources and environment, the science of the Chinese Academy of Sciences. Moreover, we are the member of data products that the data is first used (i.e., the land use data in the year 2020). The land classification system includes six first types, namely, cultivated land, forest land, grassland, water area, construction land, and unused land. Then, the six first types are further divided into 25 secondary types. We apply the corresponding data for the ten-year interval from 2000 to 2020, because we participate in the data production of 2010 and 2020 on the basis of obtaining the basic data of 2000, along with the verification accuracy of over 90% []. The data of grain sown area and grain net profit required for the study area are from the statistical yearbook of each province from 2000 to 2020 and from the Compilation of cost-benefit data of national agricultural products.
2.2.2. Land-Use Change Detection Technology
By interpreting the land use data of different time phases in the same area, the pattern of land use can intuitively see the change in its types, but it can not comprehensively describe the location and quantity of change between land-use types. On the basis of ensuring that the land use data are processed with the same classification system, the land use dynamic analysis technology [,] uses the form of the two-dimensional table to track the change trajectory between various classes at the beginning year and at the ending year, for making a quantitative analysis on the transfer of land-use types in different periods. This approach can obtain the dynamic change information of land use types in the study area more effectively. In this study, the ArcGIS platform is used to monitor and analyze the spatial scale change of land data in 2000, 2010, and 2020 through the spatial analysis module (Formula (1)).
where: is the land area converted from the i type at the beginning year to the j type at the ending year.
2.2.3. Landscape Pattern Analysis
The landscape index is applied to describe the effect of landscape patterns on ecological process []. Through the quantitative analysis of the landscape index, we can observe the dynamic change of various landscape elements in space and time. Generally, the landscape survey is divided into three different scales, and the patch level is often overlooked when land-use dynamics are analyzed. The calculation of the landscape pattern index mainly uses the landscape analysis software fragstats4.2. Based on the user guide document, we comprehensively analyze the features of the landscape dominance, diversity, and fragmentation from the view of the area/side length, shape, aggregation/distribution, connectivity, and diversity of land use pattern in each period from the type level and from landscape level, a total of seven indicators are selected. When we select these indexes, we fully consider the relevance of the landscape index, too many indexes always lead to redundancy, and the single landscape index can not comprehensively summarize the landscape pattern of the study area [,]. We use as few indexes as possible to fully express the change of landscape according to the user guide document and the meaning of landscape ecological indexes. These selected indexes are shown in Table 1, including the names, abbreviations, formulas, and meanings.

Table 1.
Landscape index formula and ecological meaning [].
2.2.4. Ecosystem Service Value Assessment
Determination of Equivalent Factors of Ecosystem Service Value
The accounting method of ecosystem service value refers to the equivalent factor method proposed by Xie Gaodi [,,] and Costanza []. However, in their ecosystem value assessment from previous literature, construction land, including urban, rural land, and industrial and mining land, is treated as bare land, which often leads to underestimation. By investigating the land cover distributions within construction land in Northeast China, we provide a new ecosystem service value calculation of construction land. In the actual survey, the impervious surface land of the construction land is about two-thirds, the other one-third consists of the equal woodland and grassland, and the water body can be basically ignored. Therefore, from the perspective of land cover, we put forward a new method to calculate the ecosystem service value of construction land in Northeast China, that is, the calculation of construction land is 4/6 bare soil (impervious surface land) + 1/6 grassland + 1/6 forest land. Through integration of the equivalent table in Northeast China and the land use classification system, the one-to-one correspondence of the land classification system from the Chinese Academy of Sciences and the ecological classification system for the northeast region of China are executed, to realize the transformation from land-use type to ecosystem service type. Then, we get the adjusted ecosystem service value equivalence factor, which is provided below (Table 2).
Table 2.
Equivalent factors of ecosystem service value.
Determination of Ecosystem Service Value Coefficient
Then, we take the suitable value of the net profit of grain production per unit area to evaluate the equivalent weight factor of ecosystem service in the light of the ecosystem situation in Northeast China, so that it can match with the ecosystem assessment in Northeast China. In the process of ecosystem value matching, we have made full use of the statistical data of grain sown area and grain net profit in Northeast China from 2000 to 2020, considering that rice, soybean, corn, and wheat are the main food crops in Northeast China and the regional background of land changes in sowing areas. The value of ecosystem service in Northeast China is shown below, as well as the diverse types of land use for the carriers of ecosystem service (Table 3).
Table 3.
Coefficient tables of ecosystem service value in the study area (Unit: Chinese yuan (RMB)/ha).
Calculation of Ecosystem Service Value
The ecosystem service value (ESV) in the study area can be calculated according to the determined ecosystem service value coefficient table and the area of each land-use type. The specific formula is as follows (Formulas (2) and (3)):
where Ai is the area from land-use type i, VCi is the ESV coefficient of land use type i, ESVf is the value coefficient (VC) of the ecosystem service function of land use type f. VCif is the value coefficient of ecosystem service function i of land use type f.
Sensitivity Analysis of Ecosystem
The coefficient of sensitivity (CS) is applied to calculate the response of ESV to the change of VC, and finally determine the dependence of ESV on the improved VC []. When CS > 1, it means that the ESV is elastic, the accuracy of the result is low; When CS < 1, it indicates that the result of the ecosystem is credible (Formula 4) []:
where is the total ESV in the initial stage, is the total ESV adjusted by the value coefficient of land types, is the initial value coefficient of land type i, is the adjusted value coefficient of the land type i.
Pattern of ecosystem service value in the study area during the period of 2000–2020 is processed. We divide the ecosystem service values into five levels by the numerical equivalence method, namely, low-value region (I), sub-low value region (II), median value region (III), sub-high value region (IV), and high-value region (V), to reflect the different levels of ecosystem service values in different regions in the study area in the studied years of 2000, 2010, and 2020, respectively.
3. Results
3.1. Analysis of Temporal and Spatial Features Regarding the Land Use Evolution during 2000–2020
From 2000 to 2020, the land use in the study area has undergone a drastic change in land type and spatial pattern. As China’s grain planting base, the cultivated land change pattern in the study area has always been concerned, with the total area of cultivated land of 300,491.83 km2, 309,610.33 km2, and 309,417.52 km2, in the years 2000, 2010, and 2020, and net change area of 9118.50 km2 and −192.82 km2 in the period of 2000–2010 and 2010–2020, respectively. These data show that the change of cultivated land has displayed the characteristic of first increasing and then decreasing over the studied period, with net areas of 8925.68 km2. Therefore, new evidence is observed that the cultivated land has been reduced in 2020 compared with the initial cultivated land in 2010. For the change in cultivated land structure, paddy fields continue to increase, reaching 56,196.38 km2 in 2020. However, upland crops show a significant reduction trend, with changes of 8289.47 km2 from 2000–2010 and −11,590.95 km2 from 2010–2020, respectively. Similarly, forest land, grassland, water area, and unused land all show the characteristic of decreasing trend, with the change of 1747.52 km2, −2171.66 km2, −1050.71 km2, and −4537.51 km2 from 2000–2020. On the contrary, construction land shows an increasing trend, with values of 4617.43 km2. Specifically, rapid urbanization, and industrial and mining expansion have promoted the increase of construction land, however, the area of rural land has decreased 372.50 km2 from 2010 to 2020 under the background of “withdrawing small villages and moving to big villages”. Therefore, in the assessment and analysis of land-use area in 2000–2020, we find two pieces of evidence of land-use change different from the past, including both the reduction in areas in cultivated land and rural land.
For the spatial pattern of land transition in the study area in the period of 2000–2020 (Figure 2), cultivated land, especially paddy fields, presents a focused expansion to the directions of the north and east. Construction land, mainly urban, is expanding in a divergent way with the original as the center. However, in addition to several important cities (i.e., provincial administrative centers and sub-provincial cities), including the Harbin, Changchun, Shenyang, and Dalian, the expansion of other cities have been significantly slow in 2010–2020. The spatial pattern of other land-use types shows a scattered spatial change pattern during 2000–2020.
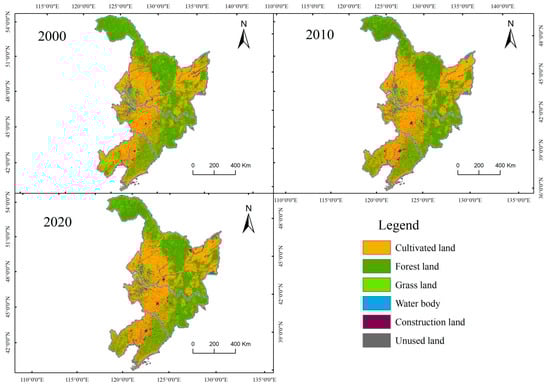
Figure 2.
Spatial pattern of land transition in the period of 2000–2020.
3.2. Analysis of Landscape Change Trend at Landscape and at Type Scales during 2000–2020
At the landscape scale, it can be seen from the figure (Figure 3) that, from 2000 to 2020, the landscape shape index (LSI) increases significantly, showing the landscape irregularity of land use shape in the study area continued to deepen. Besides, the contagion index reduces, from 55.21 in 2000 to 54.16 in 2010, and then to 53.28 in 2020, with a total decrease of 1.93, indicating that there are more small landscape patches, along with intermittently distributed patches as well as the weakened agglomeration degree among them. Meanwhile, Shannon’s diversity index (SHDI) is basically maintained between 1.27–1.30, with an upward trend from 2000–2020, indicating that the landscape types are richer, the degree of fragmentation is higher, and the stability of the land ecosystem is weakened in the year of 2020, compared to the values of these indicators in 2000. Moreover, the dispersion and juxtaposition index (IJI) showed an increasing trend with the values of 3.63 during 2000–2020, combined with the reduced aggregation index (AI: −1.07 during 2000–2020), showing that the connectivity between patches of various landscape types is increasing, but the aggregation degree of various landscape types is decreasing. Therefore, the spatiotemporal heterogeneity of land-use change brings complex landscape evolution process over the studied period.
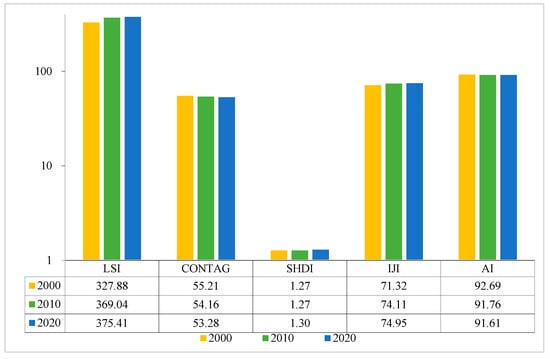
Figure 3.
Landscape change trend in landscape-level during the period of 2000–2020. Note: The left axis is a dimensionless unit.
At the land type scale (Table 4), for cultivated land, the largest patch index (LPI) of cultivated land decreased first and then increased, and the final change is −2.54%. Under the strong interference of human activities, the LSI increases and reaches the maximum at the end year, namely, 397.47 in 2000, 424.56 in 2010, and 438.57 in 2020, while the AI decreases all the time (i.e., 92.77, 92.40, 92.01), considering the increasingly divided cultivated land patterns in paddy field and upland crops. For forest land, the remarkable feature of forest landscape is the dominance of the LPI, although this value decreased from 16.89% in 2000 to 12.49% in 2020. Compared with other land use types, forest land is still the highest, showing that forest land is the dominant land type in the study area from 2000–2020, along with the better connectivity, stronger aggregation, and complex patch shape. For construction land, the AI of urban, industrial, and mining lands has increased all the time since the beginning year, with the values of 75.61, 75.95, and 76.22, respectively. Moreover, other landscape indexes also show an increasing trend in this land type from 2000–2020. This shows that the urban, industrial, and mining lands experienced the process of rapid expansion, along with the more complex LSI, IJI, and NP, respectively. The socio-economic development of Northeast China has a great impact on the landscape of urban, industrial, and mining lands. For the unused land, the AI decreases by 2.57 and the IJI increases by 2.83, showing that the fragmentation of unused land has increased slightly, the patches tend to be irregular, the aggregation has an obvious downward trend, and the connection has also become low in the period of 2000–2020 under the interference of human activities.
Table 4.
Variation characteristics of land type-level during 2000–2020.
3.3. Ecosystem Services Analysis of Northeast China from 2000–2020
3.3.1. Sensitivity Analysis of Ecosystem Service Value during the Period of 2000–2020
The results (Figure 4) in the study area during the period of 2000–2020 show that the sensitivity index of ecosystem service value (ESV) to the valuation coefficient (VC) of all land use types is less than 1, and ESV is inelastic to VC, so the research results are credible. From 2000 to 2020, the sensitivity value follows by forest land > water area > wetland > cultivated land > grassland > construction land > other land. The sensitivity index of forest land is 51.03–51.73%. That means that a total value increases by 51.03–51.73% when the ecological value coefficient from the land type of forest land increases by only 1%. Considering the large area of forest land resources such as Daxinganling and Xiaoxinganling exists, forest land displays an essential effect on the total value of ecosystem service in the study area. In addition, water area and wetland are also sensitive to the change of ecosystem service value, at about 21.48% and 10.25%, respectively.
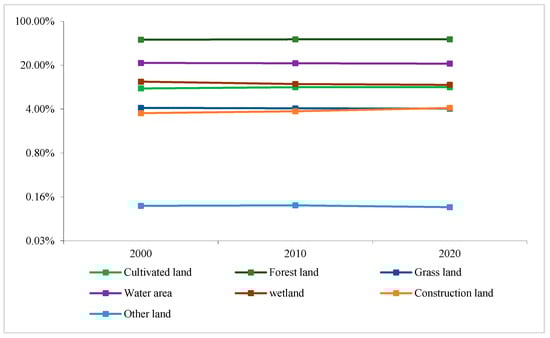
Figure 4.
Changes in ecosystem service value sensitivity during 2000–2020.
3.3.2. Analysis of the Characteristics of Ecosystem Service Function during 2000–2020
Overall, ecosystem service value in the study area reduced from 2868.39 billion yuan in 2000 to 2814.06 billion yuan in 2020, with a reduction of 54.32 billion yuan, showing the negative impact on environments (Figure 5).
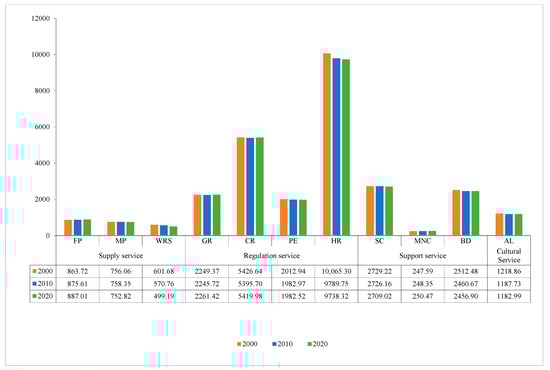
Figure 5.
Value changes of ecosystem services during 2000–2020. Note: Unit on the left axis 108 yuan.
In the regulation service function, the value of climate regulation and hydrological regulation function accounts for 53.88% of the study area, which makes a great contribution to the total value of ecosystem service. During 2000–2020, both indicators show a descending trend. Specifically, the ESV of climate regulation decreases by 0.67 billion yuan, although it increased by 2.43 billion yuan from 2010 to 2020; And, hydrological regulation finally decreases by 32.70 billion yuan, from 1006.53 billion yuan in the initial year to 973.83 billion yuan in the last year, which is the type of ecological service with the largest decrease among all regulation service function. The changing trend of the purified environment is similar to hydrological regulation, with net changes of −3.04 billion yuan. Moreover, the increase of the gas regulation is by 1.21 billion yuan. Thus, most indicators show positive responses to ecosystem services.
In supporting service function, soil conservation and biodiversity account for more than 95.43%. Such as soil conservation, biodiversity, and maintaining nutrient cycle only change by −2.02 billion yuan, −5.56 billion yuan, and by 0.29 billion yuan during 2000–2020, respectively, showing the great differences among these indicators.
In the supply service function, all service function indicators, such as grain production, raw material production, and water resources supply, show a different trend from the initial year to the final year, and these indicators are accompanied by different results. Specifically, food production increased by 2.33 billion yuan, on the contrary, raw material production and water resources supply decreased by 0.32 billion yuan and 10.25 billion yuan, respectively. This shows that the supply of ecosystem services in the study area shows a different trend. As for the cultural service function, the reduction is 3.59 billion yuan over the studied period.
3.3.3. Distributions of Ecosystem Service Value during 2000–2020
In general (Figure 6, Table 5), the ecosystem service value presents the distribution characteristic of high rank in the Northwest and Southeast and low rank in other regions. Specifically, the distribution range of V and III is wide and concentrated, the small range of I and II is concentrated in the west, south, and northeast, and the distribution of IV is relatively scattered.
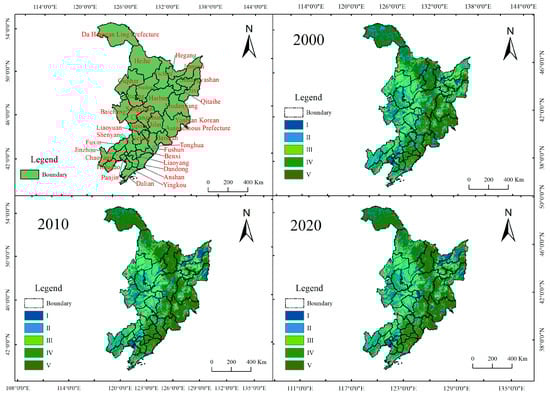
Figure 6.
Spatial distribution of ecosystem service value during 2000–2020. For the explanation of legend, I, II, III, IV, and V represent the different levels in the ecosystem service values, with low-value region, sub-low value region, median value region, sub-high value region, and high-value region, respectively.
Table 5.
Statistics of ecosystem classification at urban scale in the year 2020.
From the perspective of ecosystem service pattern evolution characteristics during 2000–2020, class I and class II are increasing, mainly due to the continuous increase of construction land. Class III, IV, and V show a significant decrease, which is mainly due to the reduction of the area of upland crops, wetland, woodland. By 2020, from the perspective of administrative division, the mountains of Daxinganling, Xiaoxinganling, and Changbai extend from northwest to southeast, passing through the cities of Da Hinggan Ling Prefecture, Heihe, Yichun, Hegang, Jixi, Harbin, Mudanjiang, Jilin, Yanbian Korean Autonomous Prefecture, Baishan, Tonghua, Fushun, Benxi, Liaoyang, Dandong, Anshan and Yingkou, and thus, most of the ecosystem service is V in these cities. III is widely distributed on its east and west sides, including the cities of Qiqihar, Suihua, Jiamusi, Shuangyashan, Qitaihe, Daqing, Baicheng, Songyuan, Changchun, Siping, Liaoyuan, Tieling, Shenyang, Fuxin, Jinzhou, Dalian, and Huludao.
4. Discussion
4.1. The Reduction of Cultivated Land Area Is Revealed in Northeast China
The area of cultivated land begins to decrease. As many scholars know, the northeast region of China acts as an essential role in Chinese grain safety, and thus, this region is the commodity grain production base in China now []. In the past three centuries, the spatial evolution of cultivated land area in the study area has been increasing []. In the latest century that has just passed, the spatial evolution of large-scale cultivated land areas has moved from Songnen plain to Sanjiang Plain []. Since 2000, paddy fields in the study area, especially in Sanjiang Plain, have begun to expand significantly, along with the massive loss of upland crops and unused land [,]. At the same time, the pattern of paddy field expansion in the north of Sanjiang Plain and Songnen Plain appeared []. In the stereotype, the spatial evolution of the cultivated land has been increasing continuously [,]. However, when we use the latest cultivated land data for analysis, we find that the cultivated land in the study area begins to decrease after 2010. Between 2010 and 2020, our study showed that the net change area of cultivated land decreases by 192.82 km2. In terms of cultivated land structure, the paddy field is still increasing, but upland crops continue to decrease. The possible reason for the decreased area of cultivated land is the expansion of urban and industrial lands during 2010–2020. Another finding is the reduction of the total rural land area. The area of rural land has decreased with a net change area of 372.50 km2 from 2010 to 2020 under the background engineering of “withdrawing small villages and moving to big villages”. Further, other land changes from 2000 to 2020 are evaluated, along with the new landscape pattern change such as the index of LPI, AI, ISI, which provides an important reference for the terrestrial landscape investigation.
4.2. The Comparison Comes from the Improved Method in This Study and the Conventional Method
This study not only provides new research results on land change and landscape pattern but also provides the improved method of ecosystem service value in Northeast China. In previous relevant studies, the conventional method usually chooses to ignore the ecosystem service value of construction land (i.e., set as 0 value) and rely on the change of the ecological value of dominant land cover, such as the ecosystem value evaluation of Sanjiang Plain in Northeast China []. Moreover, some other scholars also ignore this problem [,]. In the previous literature, construction land [], including urban, rural land, and industrial and mining land, is always treated as bare land, which often leads to the underestimation of the ecosystem service value in Northeast China. In the contexts of large-scale construction land expansion, ecological elastic cities, livable cities, and rural revitalization policies [,] have helped to increase the vegetation within the construction land area. Moreover, the impact of construction land on regional ecological functions such as purified environment, biodiversity, and aesthetic landscape, needs the ecosystem value assessment. Therefore, by investigating the land cover distributions within construction land in Northeast China, we provide a new ecosystem service value calculation of construction land. In the actual survey, the impervious surface land of the construction land is about two-thirds, the other one-third consists of the equal woodland and grassland, and the water body can be basically ignored []. Therefore, from the perspective of land cover, we put forward a new method to calculate the ecosystem service value of construction land in Northeast China, that is, the calculation of construction land is 4/6 bare soil (impervious surface land) + 1/6 grassland + 1/6 forest land. This means that we consider the vegetation factors inside the construction land, to make the ecosystem assessment more accurate. In addition to the comparison between the method in this study and the traditional method, we also conduct comparative experiments in the study area according to these two methods. We find that: the total ecosystem service value in Northeast China was 2774.99 billion yuan, 2725.57 billion yuan, and 2702.96 billion yuan in 2000, 2010, and 2020 from the conventional method, respectively, while our method obtain more ecosystem service, with more values of 93.39 billion yuan, 98.59 billion yuan and 111.10 billion yuan in 2000, 2010 and 2020. Therefore, our research can obtain more accurate results compared to the traditional method in Northeast China.
4.3. The Shortcomings of This Study and the Plan for the Next Step
Our results show that the value of ecosystem services in Northeast China shows a decreasing trend during the study period, with the values of 2868.39 billion yuan in 2000 to 2814.06 billion yuan in 2020 (Figure 5). This result is mainly due to the loss of forest land and grassland with high ecosystem services and the expansion of urban, rural, industrial, and mining land with low ecosystem services (Figure 2). Our results have similar trends to the previous literature, namely, the value of ecosystem services in most regions of China has decreased under the background of construction land expansion since 2000. Moreover, according to the land dynamic change, this paper studies the landscape pattern and ecosystem service value in the period 2000–2020 in Northeast China. We provide the new results on land change and landscape patterns and create an improved ecosystem service value assessment method to provide a more suitable ecosystem assessment application for Northeast China. However, the monetary values are displayed in the Chinese yuan. Perhaps the monetary value in USD increases the visibility of the paper. Considering the fluctuation and uncertainty of RMB and US dollar exchange rate from 2000 to 2020 [], this study uses the Chinese yuan. Moreover, we will overcome the exchange rate problem between RMB and the US dollar in future research and change it to the US dollar. Furthermore, we focus on the impact of land transition on landscape and ecosystem service value in the northeast region of China from 2000–2020. Land-use change also brings biogeochemical and biogeochemical cycle processes such as surface hydrological process, groundwater change, evapotranspiration [], surface radiation energy balance [], carbon cycle, and local climate change []. We will conduct more extensive research in the future.
5. Conclusions
This study explores the new spatiotemporal characteristics of land transition using the national resources and environmental remote sensing data during the period 2000–2020. Further, we analyze the landscape pattern and ecosystem service value under the background of land use/cover change according to the landscape indicator platform and ecosystem equivalent factor method.
The new evidence is observed that the cultivated land in the study area has been increased in the last year compared with 2010, with 309,610.33 km2 and 309,417.52 km2 in the years 2010 and 2020, respectively, showing that the change of cultivated land has entered a new inflection point. Moreover, we find a downward trend in the rural land, and the rural land has decreased by 372.50 km2 from 2010 to 2020 under the background of “withdrawing small villages and living in big villages together”. Therefore, the study provided the new findings on land-use change different from the past.
The landscape shape index (LSI) in the study area increases significantly, indicating that the irregularity of landscape shape of land use continues to deepen. In addition, the contagion index reduces, with a total decrease of 1.93, indicating that there are more small landscape patches, along with intermittently distributed patches as well as the weakened agglomeration degree among them. Meanwhile, SHDI displays an upward trend from 2000–2020, with the richer landscape types and higher fragmentation. At the land type scale, cultivated land and forest land have more advantages in the landscape than other land-use types.
During 2000–2020, ecosystem service value is assessed, with a reduced value of 54.32 billion yuan, showing the negative impact on the environment. For different land-use types, forest land, water area, and wetland are the most sensitive to the service value of the ecosystem. The functions of regulation service, supporting service, supply service, and cultural service, are further analyzed in this study. Hydrological regulation, climate regulation, and soil conservation play a dominant role in these functions in 2020, while the first three indicators with the most changes are hydrological regulation, water resources supply, and biodiversity. Moreover, the ecosystem service value presents the distribution characteristic of high rank in the northwest and Southeast and low rank in other regions.
Overall, this study provides land change, landscape pattern, and ecosystem service value assessment in the period of 2000–2020. These three aspects can bring relevant applications in Northeast China. The finding of the reduction of cultivated land area from 2010–2020 provides temporal and spatial data for regional cultivated land protection and food security. The landscape pattern change is conducive to the study of landscape ecological corridor and residential ecological environment in this region. The change of ecosystem service value is beneficial for the assessment of natural environment quality such as the cultural service (i.e., spiritual, entertainment, and cultural benefits) and support service (i.e., maintaining the nutrient cycle of the earth’s living environment). Therefore, this study provides a more suitable ecosystem assessment utility for Northeast China.
Author Contributions
Conceptualization, X.W. (Xinqing Wang) and T.P.; methodology, T.P.; software, X.W. (Xinqing Wang); formal analysis, X.W. (Xiaoyu Wang), R.P., W.C., C.M. and T.P.; writing—original draft preparation, X.W. (Xinqing Wang) and T.P.; writing—review and editing, X.W. (Xinqing Wang), W.C., C.M., T.P., R.P., L.N., X.W. (Xiaoyu Wang) and J.Z. All authors have read and agreed to the published version of the manuscript.
Funding
This project is funded by the Humanity and Social Science Youth Foundation of the Ministry of Education of China (21YJCZH111).
Institutional Review Board Statement
Not applicable.
Informed Consent Statement
Not applicable.
Data Availability Statement
Not applicable.
Conflicts of Interest
The authors declare no conflict of interest.
References
- Bai, Y.; Ochuodho, T.O.; Yang, J. Impact of land use and climate change on water-related ecosystem services in Kentucky, USA. Ecol. Indic. 2019, 102, 51–64. [Google Scholar] [CrossRef]
- Zhao, Q.; Wen, Z.; Chen, S.; Ding, S.; Zhang, M. Quantifying land use/land cover and landscape pattern changes and impacts on ecosystem services. Int. J. Environ. Res. Public Health 2020, 17, 126. [Google Scholar] [CrossRef] [Green Version]
- Liu, J.; Zhang, Z.; Xu, X.; Kuang, W.; Zhou, W.; Zhang, S.; Li, R.; Yan, C.; Yu, D.; Wu, S. Spatial patterns and driving forces of land use change in China during the early 21st century. J. Geogr. Sci. 2010, 20, 483–494. [Google Scholar] [CrossRef]
- Liu, C.; Cai, W.; Zhai, M.; Zhu, G.; Zhang, C.; Jiang, Z. Decoupling of wastewater eco-environmental damage and China′s economic development. Sci. Total Environ. 2021, 789, 147980. [Google Scholar] [CrossRef] [PubMed]
- Zhou, Y.; Huang, X.; Chen, Y.; Zhong, T.; Xu, G.; He, J.; Xu, Y.; Meng, H. The effect of land use planning (2006–2020) on construction land growth in China. Cities 2017, 68, 37–47. [Google Scholar] [CrossRef]
- Li, C.; Gao, X.; He, B.-J.; Wu, J.; Wu, K. Coupling coordination relationships between urban-industrial land use efficiency and accessibility of highway networks: Evidence from Beijing-Tianjin-Hebei urban agglomeration, China. Sustainability 2019, 11, 1446. [Google Scholar] [CrossRef] [Green Version]
- Dean, R.; Damm-Luhr, T. A Current review of chinese land-use law and policy: A breakthrough in rural reform. Pac. Rim L. Pol’y J. 2010, 19, 121. [Google Scholar]
- Janeczko, E.; Dąbrowski, R.; Budnicka-Kosior, J.; Woźnicka, M. Influence of Urbanization Processes on the Dynamics and Scale of Spatial Transformations in the Mazowiecki Landscape Park. Sustainability 2019, 11, 3007. [Google Scholar] [CrossRef] [Green Version]
- Liu, Y.; Fang, F.; Li, Y. Key issues of land use in China and implications for policy making. Land Use Policy 2014, 40, 6–12. [Google Scholar] [CrossRef]
- Jia, Y.; Tang, L.; Xu, M.; Yang, X. Landscape pattern indices for evaluating urban spatial morphology-A case study of Chinese cities. Ecol. Indic. 2019, 99, 27–37. [Google Scholar] [CrossRef]
- Wu, Y.; Li, S.; Yu, S. Monitoring urban expansion and its effects on land use and land cover changes in Guangzhou city, China. Environ. Monit. Assess. 2016, 188, 1–15. [Google Scholar] [CrossRef] [PubMed]
- Yushanjiang, A.; Zhang, F.; Yu, H. Quantifying the spatial correlations between landscape pattern and ecosystem service value: A case study in Ebinur Lake Basin, Xinjiang, China. Ecol. Eng. 2018, 113, 94–104. [Google Scholar] [CrossRef]
- Peng, J.; Xie, P.; Liu, Y.; Ma, J. Urban thermal environment dynamics and associated landscape pattern factors: A case study in the Beijing metropolitan region. Remote Sens. Environ. 2016, 173, 145–155. [Google Scholar] [CrossRef]
- Jiang, P.; Li, M.; Lv, J. The causes of farmland landscape structural changes in different geographical environments. Sci. Total Environ. 2019, 685, 667–680. [Google Scholar] [CrossRef]
- Deng, L.; Li, X.; Luo, H.; Fu, E.-K.; Ma, J.; Sun, L.-X.; Huang, Z.; Cai, S.-Z.; Jia, Y. Empirical study of landscape types, landscape elements and landscape components of the urban park promoting physiological and psychological restoration. Urban For. Urban Green. 2020, 48, 126488. [Google Scholar] [CrossRef]
- Qian, Y.; Zhou, W.; Pickett, S.T.; Yu, W.; Xiong, D.; Wang, W.; Jing, C. Integrating structure and function: Mapping the hierarchical spatial heterogeneity of urban landscapes. Ecol. Process. 2020, 9, 1–11. [Google Scholar] [CrossRef]
- Xu, J.; Wang, J.; Xiong, N.; Chen, Y.; Sun, L.; Wang, Y.; An, L. Analysis of Ecological Blockage Pattern in Beijing Important Ecological Function Area, China. Remote Sens. 2022, 14, 1151. [Google Scholar] [CrossRef]
- Stige, L.C.; Kvile, K.Ø. Climate warming drives large-scale changes in ecosystem function. Proc. Natl. Acad. Sci. USA 2017, 14, 12100–12102. [Google Scholar] [CrossRef] [Green Version]
- Xiao, J.; Chevallier, F.; Gomez, C.; Guanter, L.; Hicke, J.A.; Huete, A.R.; Ichii, K.; Ni, W.; Pang, Y.; Rahman, A.F. Remote sensing of the terrestrial carbon cycle: A review of advances over 50 years. Remote Sens. Environ. 2019, 233, 111383. [Google Scholar] [CrossRef]
- Cong, W.; Sun, X.; Guo, H.; Shan, R. Comparison of the SWAT and InVEST models to determine hydrological ecosystem service spatial patterns, priorities and trade-offs in a complex basin. Ecol. Indic. 2020, 112, 106089. [Google Scholar] [CrossRef]
- Wang, K.; Zhang, C.; Chen, H.; Yue, Y.; Zhang, W.; Zhang, M.; Qi, X.; Fu, Z. Karst landscapes of China: Patterns, ecosystem processes and services. Landsc. Ecol. 2019, 34, 2743–2763. [Google Scholar] [CrossRef] [Green Version]
- Arunrat, N.; Sereenonchai, S.; Wang, C. Carbon footprint and predicting the impact of climate change on carbon sequestration ecosystem services of organic rice farming and conventional rice farming: A case study in Phichit province, Thailand. J. Environ. Manag. 2021, 289, 112458. [Google Scholar] [CrossRef] [PubMed]
- Deng, Z.; Zhu, X.; He, Q.; Tang, L. Land use/land cover classification using time series Landsat 8 images in a heavily urbanized area. Adv. Space Res. 2019, 63, 2144–2154. [Google Scholar] [CrossRef]
- Li, H.; Wu, Y.; Huang, X.; Sloan, M.; Skitmore, M. Spatial-temporal evolution and classification of marginalization of cultivated land in the process of urbanization. Habitat Int. 2017, 61, 1–8. [Google Scholar] [CrossRef] [Green Version]
- Justice, C.; Townshend, J.; Vermote, E.; Masuoka, E.; Wolfe, R.; Saleous, N.; Roy, D.; Morisette, J. An overview of MODIS Land data processing and product status. Remote Sens. Environ. 2002, 83, 3–15. [Google Scholar] [CrossRef]
- Li, W.; MacBean, N.; Ciais, P.; Defourny, P.; Lamarche, C.; Bontemps, S.; Houghton, R.A.; Peng, S. Gross and net land cover changes in the main plant functional types derived from the annual ESA CCI land cover maps (1992–2015). Earth Syst. Sci. Data 2018, 10, 219–234. [Google Scholar] [CrossRef] [Green Version]
- Chen, J.; Chen, J.; Liao, A.; Cao, X.; Chen, L.; Chen, X.; He, C.; Han, G.; Peng, S.; Lu, M. Global land cover mapping at 30 m resolution: A POK-based operational approach. ISPRS J. Photogramm. Remote Sens. 2015, 103, 7–27. [Google Scholar] [CrossRef] [Green Version]
- Zhang, X.; Liu, L.; Chen, X.; Gao, Y.; Xie, S.; Mi, J. GLC_FCS30: Global land-cover product with fine classification system at 30 m using time-series Landsat imagery. Earth Syst. Sci. Data 2021, 13, 2753–2776. [Google Scholar] [CrossRef]
- Chen, B.; Xu, B.; Zhu, Z.; Yuan, C.; Suen, H.P.; Guo, J.; Xu, N.; Li, W.; Zhao, Y.; Yang, J. Stable classification with limited sample: Transferring a 30-m resolution sample set collected in 2015 to mapping 10-m resolution global land cover in 2017. Sci. Bull. 2019, 64, 370–373. [Google Scholar]
- Gong, P.; Marceau, D.J.; Howarth, P.J. A comparison of spatial feature extraction algorithms for land-use classification with SPOT HRV data. Remote Sens. Environ. 1992, 40, 137–151. [Google Scholar] [CrossRef]
- Lu, D.; Hetrick, S.; Moran, E. Land cover classification in a complex urban-rural landscape with QuickBird imagery. Photogramm. Eng. Remote Sens. 2010, 76, 1159–1168. [Google Scholar] [CrossRef] [PubMed] [Green Version]
- Jiyuan, L.; Mingliang, L.; Xiangzheng, D.; Dafang, Z.; Zengxiang, Z.; Di, L. The land use and land cover change database and its relative studies in China. J. Geogr. Sci. 2002, 12, 275–282. [Google Scholar] [CrossRef]
- Ning, J.; Liu, J.; Kuang, W.; Xu, X.; Zhang, S.; Yan, C.; Li, R.; Wu, S.; Hu, Y.; Du, G. Spatiotemporal patterns and characteristics of land-use change in China during 2010–2015. J. Geogr. Sci. 2018, 28, 547–562. [Google Scholar] [CrossRef] [Green Version]
- Kuang, W. National urban land-use/cover change since the beginning of the 21st century and its policy implications in China. Land Use Policy 2020, 97, 104747. [Google Scholar] [CrossRef]
- Rodríguez-Loinaz, G.; Alday, J.G.; Onaindia, M. Multiple ecosystem services landscape index: A tool for multifunctional landscapes conservation. J. Environ. Manag. 2015, 147, 152–163. [Google Scholar] [CrossRef]
- McGarigal, K.; Compton, B.W.; Plunkett, E.B.; DeLuca, W.V.; Grand, J.; Ene, E.; Jackson, S.D. A landscape index of ecological integrity to inform landscape conservation. Landsc. Ecol. 2018, 33, 1029–1048. [Google Scholar] [CrossRef] [Green Version]
- Daily, G.C. Introduction: What are ecosystem services. In Nature’s Services: Societal Dependence on Natural Ecosystems; Island Press: Washington, DC, USA, 1997; Volume 1. [Google Scholar]
- Pan, N.; Guan, Q.; Wang, Q.; Sun, Y.; Li, H.; Ma, Y. Spatial differentiation and driving mechanisms in ecosystem service value of arid region: A case study in the middle and lower reaches of Shule River Basin, NW China. J. Clean. Prod. 2021, 319, 128718. [Google Scholar] [CrossRef]
- Li, J.; Liang, J.; Wu, Y.; Yin, S.; Yang, Z.; Hu, Z. Quantitative evaluation of ecological cumulative effect in mining area using a pixel-based time series model of ecosystem service value. Ecol. Indic. 2021, 120, 106873. [Google Scholar] [CrossRef]
- Morano, P.; Guarini, M.R.; Sica, F.; Anelli, D. Ecosystem Services and Land Take. A Composite Indicator for the Assessment of Sustainable Urban Projects. In Proceedings of the International Conference on Computational Science and Its Applications, ICCSA, Cagliari, Italy, 13–16 September 2021; pp. 210–225. [Google Scholar]
- Ding, X.H.; Zhao, W.; Zhong, W.Z.; Xing, Z.B. Assessing the impacts of urbanization on the ecosystem services of city in northwestern China: Case study of Xi′an. Adv. Mater. Res. 2014, 864, 1070–1077. [Google Scholar] [CrossRef]
- Daily, G.C. What Are Ecosystem Services; Island Press: Washington, DC, USA, 2003; pp. 227–231. [Google Scholar]
- Zhang, B.; Li, W.; Xie, G. Ecosystem services research in China: Progress and perspective. Ecol. Econ. 2010, 69, 1389–1395. [Google Scholar] [CrossRef]
- Gaodi, X.; Yili, Z.; Chunxia, L.; Du, Z.; Shengkui, C. Study on valuation of rangeland ecosystem services of China. J. Nat. Resour. 2001, 16, 47–53. [Google Scholar]
- Song, F.; Su, F.; Mi, C.; Sun, D. Analysis of driving forces on wetland ecosystem services value change: A case in Northeast China. Sci. Total Environ. 2021, 751, 141778. [Google Scholar] [CrossRef] [PubMed]
- Li, H.; Zhu, H.; Qiu, L.; Wei, X.; Liu, B.; Shao, M. Response of soil OC, N and P to land-use change and erosion in the black soil region of the Northeast China. Agric. Ecosyst. Environ. 2020, 302, 107081. [Google Scholar] [CrossRef]
- Liu, F.; Qin, T.; Girma, A.; Wang, H.; Weng, B.; Yu, Z.; Wang, Z. Dynamics of land-use and vegetation change using NDVI and transfer matrix: A case study of the Huaihe River Basin. Pol. J. Environ. Stud. 2018, 28, 213–223. [Google Scholar] [CrossRef]
- Pan, T.; Zhang, C.; Kuang, W.; De Maeyer, P.; Kurban, A.; Hamdi, R.; Du, G. Time tracking of different cropping patterns using Landsat images under different agricultural systems during 1990–2050 in Cold China. Remote Sens. 2018, 10, 2011. [Google Scholar] [CrossRef] [Green Version]
- Gustafson, E.J. How has the state-of-the-art for quantification of landscape pattern advanced in the twenty-first century? Landsc. Ecol. 2019, 34, 2065–2072. [Google Scholar] [CrossRef]
- Fragstats v4: Spatial Pattern Analysis Program for Categorical and Continuous Maps. Available online: http://www.umass.edu/landeco/research/fragstats/fragstats.html (accessed on 18 February 2022).
- Xie, G.; Zhang, C.; Zhen, L.; Zhang, L. Dynamic changes in the value of China’s ecosystem services. Ecosyst. Serv. 2017, 26, 146–154. [Google Scholar] [CrossRef]
- Costanza, R.; De Groot, R.; Sutton, P.; Van der Ploeg, S.; Anderson, S.J.; Kubiszewski, I.; Farber, S.; Turner, R.K. Changes in the global value of ecosystem services. Glob. Environ. Chang. 2014, 26, 152–158. [Google Scholar] [CrossRef]
- Wang, P.; Zeng, C.; Song, Y.; Guo, L.; Liu, W.; Zhang, W. The Spatial Effect of Administrative Division on Land-Use Intensity. Land 2021, 10, 543. [Google Scholar] [CrossRef]
- Sánchez-Canales, M.; Benito, A.L.; Passuello, A.; Terrado, M.; Ziv, G.; Acuña, V.; Schuhmacher, M.; Elorza, F.J. Sensitivity analysis of ecosystem service valuation in a Mediterranean watershed. Sci. Total Environ. 2012, 440, 140–153. [Google Scholar] [CrossRef]
- Hou, M.; Deng, Y.; Yao, S. Spatial agglomeration pattern and driving factors of grain production in China since the reform and opening up. Land 2020, 10, 10. [Google Scholar] [CrossRef]
- Ye, Y.; Fang, X.; Khan, A.U. Migration and reclamation in Northeast China in response to climatic disasters in North China over the past 300 years. Reg. Environ. Chang. 2012, 12, 193–206. [Google Scholar] [CrossRef]
- Zhang, B.; Cui, H.-s.; Yu, L.; He, Y.-f. Land reclamation process in northeast China since 1900. Chin. Geogr. Sci. 2003, 13, 119–123. [Google Scholar] [CrossRef]
- Pan, T.; Zhang, C.; Kuang, W.; Luo, G.; Du, G.; DeMaeyer, P.; Yin, Z. A large-scale shift of cropland structure profoundly affects grain production in the cold region of China. J. Clean. Prod. 2021, 307, 127300. [Google Scholar] [CrossRef]
- Liu, Y.; Liu, X.; Liu, Z. Effects of climate change on paddy expansion and potential adaption strategies for sustainable agriculture development across Northeast China. Appl. Geogr. 2022, 141, 102667. [Google Scholar] [CrossRef]
- Zhou, Y.; Hartemink, A.E.; Shi, Z.; Liang, Z.; Lu, Y. Land use and climate change effects on soil organic carbon in North and Northeast China. Sci. Total Environ. 2019, 647, 1230–1238. [Google Scholar] [CrossRef]
- Yan, F.; Zhang, S.; Liu, X.; Chen, D.; Chen, J.; Bu, K.; Yang, J.; Chang, L. The effects of spatiotemporal changes in land degradation on ecosystem services values in Sanjiang Plain, China. Remote Sens. 2016, 8, 917. [Google Scholar] [CrossRef] [Green Version]
- Tianhong, L.; Wenkai, L.; Zhenghan, Q. Variations in ecosystem service value in response to land use changes in Shenzhen. Ecol. Econ. 2010, 69, 1427–1435. [Google Scholar] [CrossRef]
- Su, S.; Xiao, R.; Jiang, Z.; Zhang, Y. Characterizing landscape pattern and ecosystem service value changes for urbanization impacts at an eco-regional scale. Appl. Geogr. 2012, 34, 295–305. [Google Scholar] [CrossRef]
- Pan, T.; Kuang, W.; Pan, R.; Niu, Z.; Dou, Y. Hierarchical Urban Land Mappings and Their Distribution with Physical Medium Environments Using Time Series of Land Resource Images in Beijing, China (1981–2021). Remote Sens. 2022, 14, 580. [Google Scholar] [CrossRef]
- Yin, Z.; Kuang, W.; Bao, Y.; Dou, Y.; Chi, W.; Ochege, F.U.; Pan, T. Evaluating the Dynamic Changes of Urban Land and Its Fractional Covers in Africa from 2000–2020 Using Time Series of Remotely Sensed Images on the Big Data Platform. Remote Sens. 2021, 13, 4288. [Google Scholar] [CrossRef]
- Kuang, W.; Hou, Y.; Dou, Y.; Lu, D.; Yang, S. Mapping Global Urban Impervious Surface and Green Space Fractions Using Google Earth Engine. Remote Sens. 2021, 13, 4187. [Google Scholar] [CrossRef]
- Funke, M.; Gronwald, M. The undisclosed Renminbi basket: Are the markets telling us something about where the Renminbi–US dollar exchange rate is going? World Econ. 2008, 31, 1581–1598. [Google Scholar] [CrossRef] [Green Version]
- Liang, J.; Yang, Z.; Lin, P. Systematic hydrological evaluation of the Noah-MP land surface model over China. Adv. Atmos. Sci. 2019, 36, 1171–1187. [Google Scholar] [CrossRef]
- Du, J.; Song, K.; Wang, Z.; Zhang, B.; Liu, D. Evapotranspiration estimation based on MODIS products and surface energy balance algorithms for land (SEBAL) model in Sanjiang Plain, Northeast China. Chin. Geogr. Sci. 2013, 23, 73–91. [Google Scholar] [CrossRef]
Publisher’s Note: MDPI stays neutral with regard to jurisdictional claims in published maps and institutional affiliations. |
© 2022 by the authors. Licensee MDPI, Basel, Switzerland. This article is an open access article distributed under the terms and conditions of the Creative Commons Attribution (CC BY) license (https://creativecommons.org/licenses/by/4.0/).