Article

Multi-Time Scale Analysis of Urbanization in Urban Thermal Environment in Major Function-Oriented Zones at Landsat-Scale: A Case Study of Hefei City, China

1
School of Resources and Environmental Engineering, Hefei University of Technology, Hefei 230009, China
2
Engineering Center for Geographic Information of Anhui Province, School of Resources and Environmental Engineering, Anhui University, Hefei 230601, China
3
Information Materials and Intelligent Sensing Laboratory of Anhui Province, Anhui University, Hefei 230601, China
4
Anhui Province Key Laboratory of Wetland Ecosystem Protection and Restoration, School of Resources and Environmental Engineering, Anhui University, Hefei 230601, China
*
Author to whom correspondence should be addressed.
Land 2022, 11(5), 711; https://doi.org/10.3390/land11050711
Submission received: 29 March 2022 / Revised: 3 May 2022 / Accepted: 6 May 2022 / Published: 9 May 2022
(This article belongs to the Section Land–Climate Interactions)

Abstract

:
Urbanization and increasing demand for natural resources and land have affected the urban thermal environment. This is an important hot topic in urban climate research. In this study, we obtained multi-time scale land surface temperatures (LST) at the Landsat scale in Hefei, China, from 2011 to 2020. The evolution of the surface urban heat island (SUHI) was analyzed, and the contribution index (CI), urban thermal field variation index (UTFVI), and landscape pattern were evaluated to analyze the thermal environment mechanism of a major function-oriented zone (MFOZ). In addition, we explored the role and mechanism of different MFOZs in a thermal environment. Our results show that the multi-time scale differences in the SUHI were obvious, with the phenomenon of heat islands being concentrated in the main city zone. There are significant multi-time scale differences in the CI of different landscapes under the MFOZ. The UTFVI analysis of the MFOZ shows that the livability of the cities in the core optimization zone (COZ) and modern urbanization and industrialization cluster development zone (IDZ) is poor. MFOZ planning moderately alleviated the urban thermal environment of the entire study area, especially in the agricultural development zone (ADZ) and ecological conservation zone (ECZ). This study can guide the planning of the MFOZ and guide decision-makers in selecting governance zones when planning policies or dividing the key restoration areas of the thermal environment.

1. Introduction

Urbanization in China has accelerated in recent decades. By the end of 2020, the urbanization rate of China’s resident population exceeded 60% [1]. Urbanization has reshaped the local geometry and ecological characteristics of urban environments [2]. Among these, land surface change is one of the most direct results of urbanization. One of the direct changes in land conditions due to urbanization is radiative forcing with the alteration of land cover and surface albedo [3]. Changes in land use and cover formation, along with urban canopy structure, usually lead to an increase in urban heat storage and heat within the atmosphere [4], which shapes the local climate and results in the surface urban heat island effect (SUHI).
The SUHI effect was discovered in the early nineteenth century [5]. Subsequently, many researchers have studied this by observing the air temperatures of urban and suburban areas in cities of different latitudes and types [6]. With the development of remote sensing technology, SUHI effects are typically estimated from thermal infrared remote sensing techniques [7,8]. In general, current research mainly studies the impact of urbanization on SUHI from the aspects of surface biophysical parameters, socio-economic factors and landscape components, diversity, and configuration factors [9]. SUHI analysis helps rethink urban planning and execution based on observable environmental indices [10]. This could enlighten us to leverage these legacies and contribute to sustainable and harmonious future planning [11]. Owing to the high heterogeneity of urban areas, it is difficult to capture the representative values of urban temperature using standard weather stations [12]. In addition, dense meteorological networks, which are rarely available in cities, are necessary to capture intra-urban temperature variability, which affects heat exposure [13,14]. Land surface temperatures derived from satellite thermal infrared sensors have the advantages of high efficiency, low cost, and broad spatial coverage that traditional field measurement methods do not provide [15,16]. Therefore, this method has been used to explore urban thermal environment variations on regional and global scales. Previous studies have clarified the typical research methods of urban thermal environment research as follows [17]: (1) the direct observation of the temporal and spatial evolution of land surface temperature (LST) to study the problems of surface urban heat islands (SUHI) [18,19]; (2) the analysis of the direct spatial relationship between various factors from the perspective of vertical dimensions and models [20,21,22], mainly including LST, the relationship between specific land use types [23], normalized difference vegetation index (NDVI) [24], normalized difference built-up index (NDBI) [25], socio-economic factors [26], and meteorological factors [27]; and (3) research on the thermal environment and the relationship between urban land system architecture, such as the shape, size, and pattern of local climate zones (LCZs), and connectivity [28,29,30,31]. Recently, attention has been paid to urban forms, such as the 2D/3D urban morphology [32] and spatial patterns [33] of SUHIs, concerning possible mitigation strategies.
In summary, the existing research has fully explored the urban thermal environment, and research methods are increasingly varied, providing many useful ideas for an in-depth understanding of the evolution of the thermal environment and an exploration of the response factors [34,35]. Many methods for the quantitative assessment of urban thermal environments across varying spatial or temporal scales have been rapidly developed with the availability of thermal infrared remote sensing data from satellites. However, the trade-off between the spatial and temporal resolutions of TIR sensors limits the study of urban thermal environments in both spatial and temporal domains [36,37]. Moreover, owing to the failure to fully consider the spatial functional differences in the study areas within the scope of implementation, the prevention and control effects of policies are often limited [38,39]. Major function-oriented zone (MFOZ) planning with spatial governance as the basic concept can fully consider the spatial differences in the thermal environment, emphasize the spatial and overall nature of prevention and control, and provide a way to accurately control the thermal environment effect through differentiated policies. A better understanding and monitoring of the thermal environment effect of urban functional zones is critically important in improving the quality of life and the environment of urban residential areas and could also help achieve sustainable development goals, especially “sustainable cities and communities” [39,40]. To fulfill these research goals, we used the spatiotemporal reconstruction and fusion method used in our previous study [41] to obtain a multi-time scale (interannual, seasonal, and diurnal) LST at the Landsat scale. Using the time series, Landsat-scale LST derived from MODIS and Landsat to simulate the urban thermal environment of the MFOZ, diurnal and seasonal changes and spatial details can be captured by partially compensating for different data availability. Then, the contribution index (CI), the urban thermal field variation index (UTFVI), and landscape patterns were used to analyze the multi-time scale evaluation of the long-term thermal environmental effects on the MFOZ scale during urbanization.
The city of Hefei, China, was chosen as a representative case study because of its thermal environmental changes due to urbanization. We believe Hefei could become a representative case, considering that it is a comprehensive national science center in conjunction with Shanghai and Beijing, a strategic dual-node city of “One Belt One Road” [42] and in the “Yangtze River Economic Belt” [43]. By 2020, the resident population of Hefei exceeded 9 million, the city’s GDP was 1004.572 billion CNY, and the urbanization rate of the resident population had reached 76%, making it a regional megacity with a strong influence on the Yangtze River Economic Belt [43]. In this assessment, we aimed to (1) reveal the diurnal and seasonal spatiotemporal evolution characteristics of the SUHI effect in Hefei, (2) analyze the evolution characteristics of spatial details of CI and estimation of UTFVI under different MFOZs to understand the regulatory role of the urban thermal environment in the process of urbanization, (3) analyze the influence of landscape patterns under different MFOZs on the urban thermal environment and explore effective ways to alleviate urban heat islands in the process of rapid urbanization, and (4) explore the impact of MFOZ planning on the urban thermal environment and provide theoretical guidance for future MFOZ planning schemes. The results from this study provide crucial feedback to urban thermal environment investigations, especially long-term trends, and help develop urban thermal environment strategies under different MFOZs.

2. Study Area

The study was conducted in Hefei, the capital city of Anhui Province, with a geographic location of 116°41′–117°58′ E and 30°57′–32°37′ N (Figure 1). It has a subtropical humid monsoon climate, with distinct monsoons and four distinct seasons. The average annual temperature is 15.7 °C. The temperature is higher in June, July, and August and lower in December, January, and February. The average temperature in July is the highest, about 28.1 °C, and the temperature in January is the lowest, at approximately 2.6 °C. The average annual precipitation is approximately 1000 mm. The month with the highest precipitation is July, with an average precipitation of approximately 174 mm. The month with the least precipitation is January, with an average precipitation of approximately 25 mm. Precipitation during spring, summer, autumn, and winter accounts for 25%, 44%, 20%, and 11% of the total annual precipitation, respectively. The major types of vegetation are evergreen and deciduous forests, shrubs, and short grass. The main cultivated land types are rice, wheat fields, rape, and cotton. Most of the built areas do not use space heating for winter but cool it for summer. Hefei comprises four counties (Feidong, Feixi, Changfeng, and Lujiang), one county-level city (Chaohu), and four districts (Yaohai, Luyang, Shushan, and Baohe). According to the statistical data of climate resources released by the Hefei Meteorological Bureau, the seasons are defined as spring (March, April, and May), summer (June, July, and August), autumn (September, October, and November), and winter (December, January, and February).
According to the differences between resource and environment carrying capacity, resource endowment, development foundation and development potential, and considering the strategic pattern of urban space, agricultural space, and ecological space into an overall consideration, the MFOZ planning of Hefei divides the land space into five MFOZs: the core optimization zone (COZ), new-type urbanization and industrialization cluster development zone (IDZ), agricultural development zone (ADZ), ecological conservation zone (ECZ), and prohibited development zone. The prohibited development zone consists of 123 broken patches, which are difficult to count. Therefore, the map of Hefei’s MFOZ planning in the official documents includes only four MFOZs, as shown in Figure 1. A map of the prohibited development zones is provided separately. This study did not explore prohibited development zones.

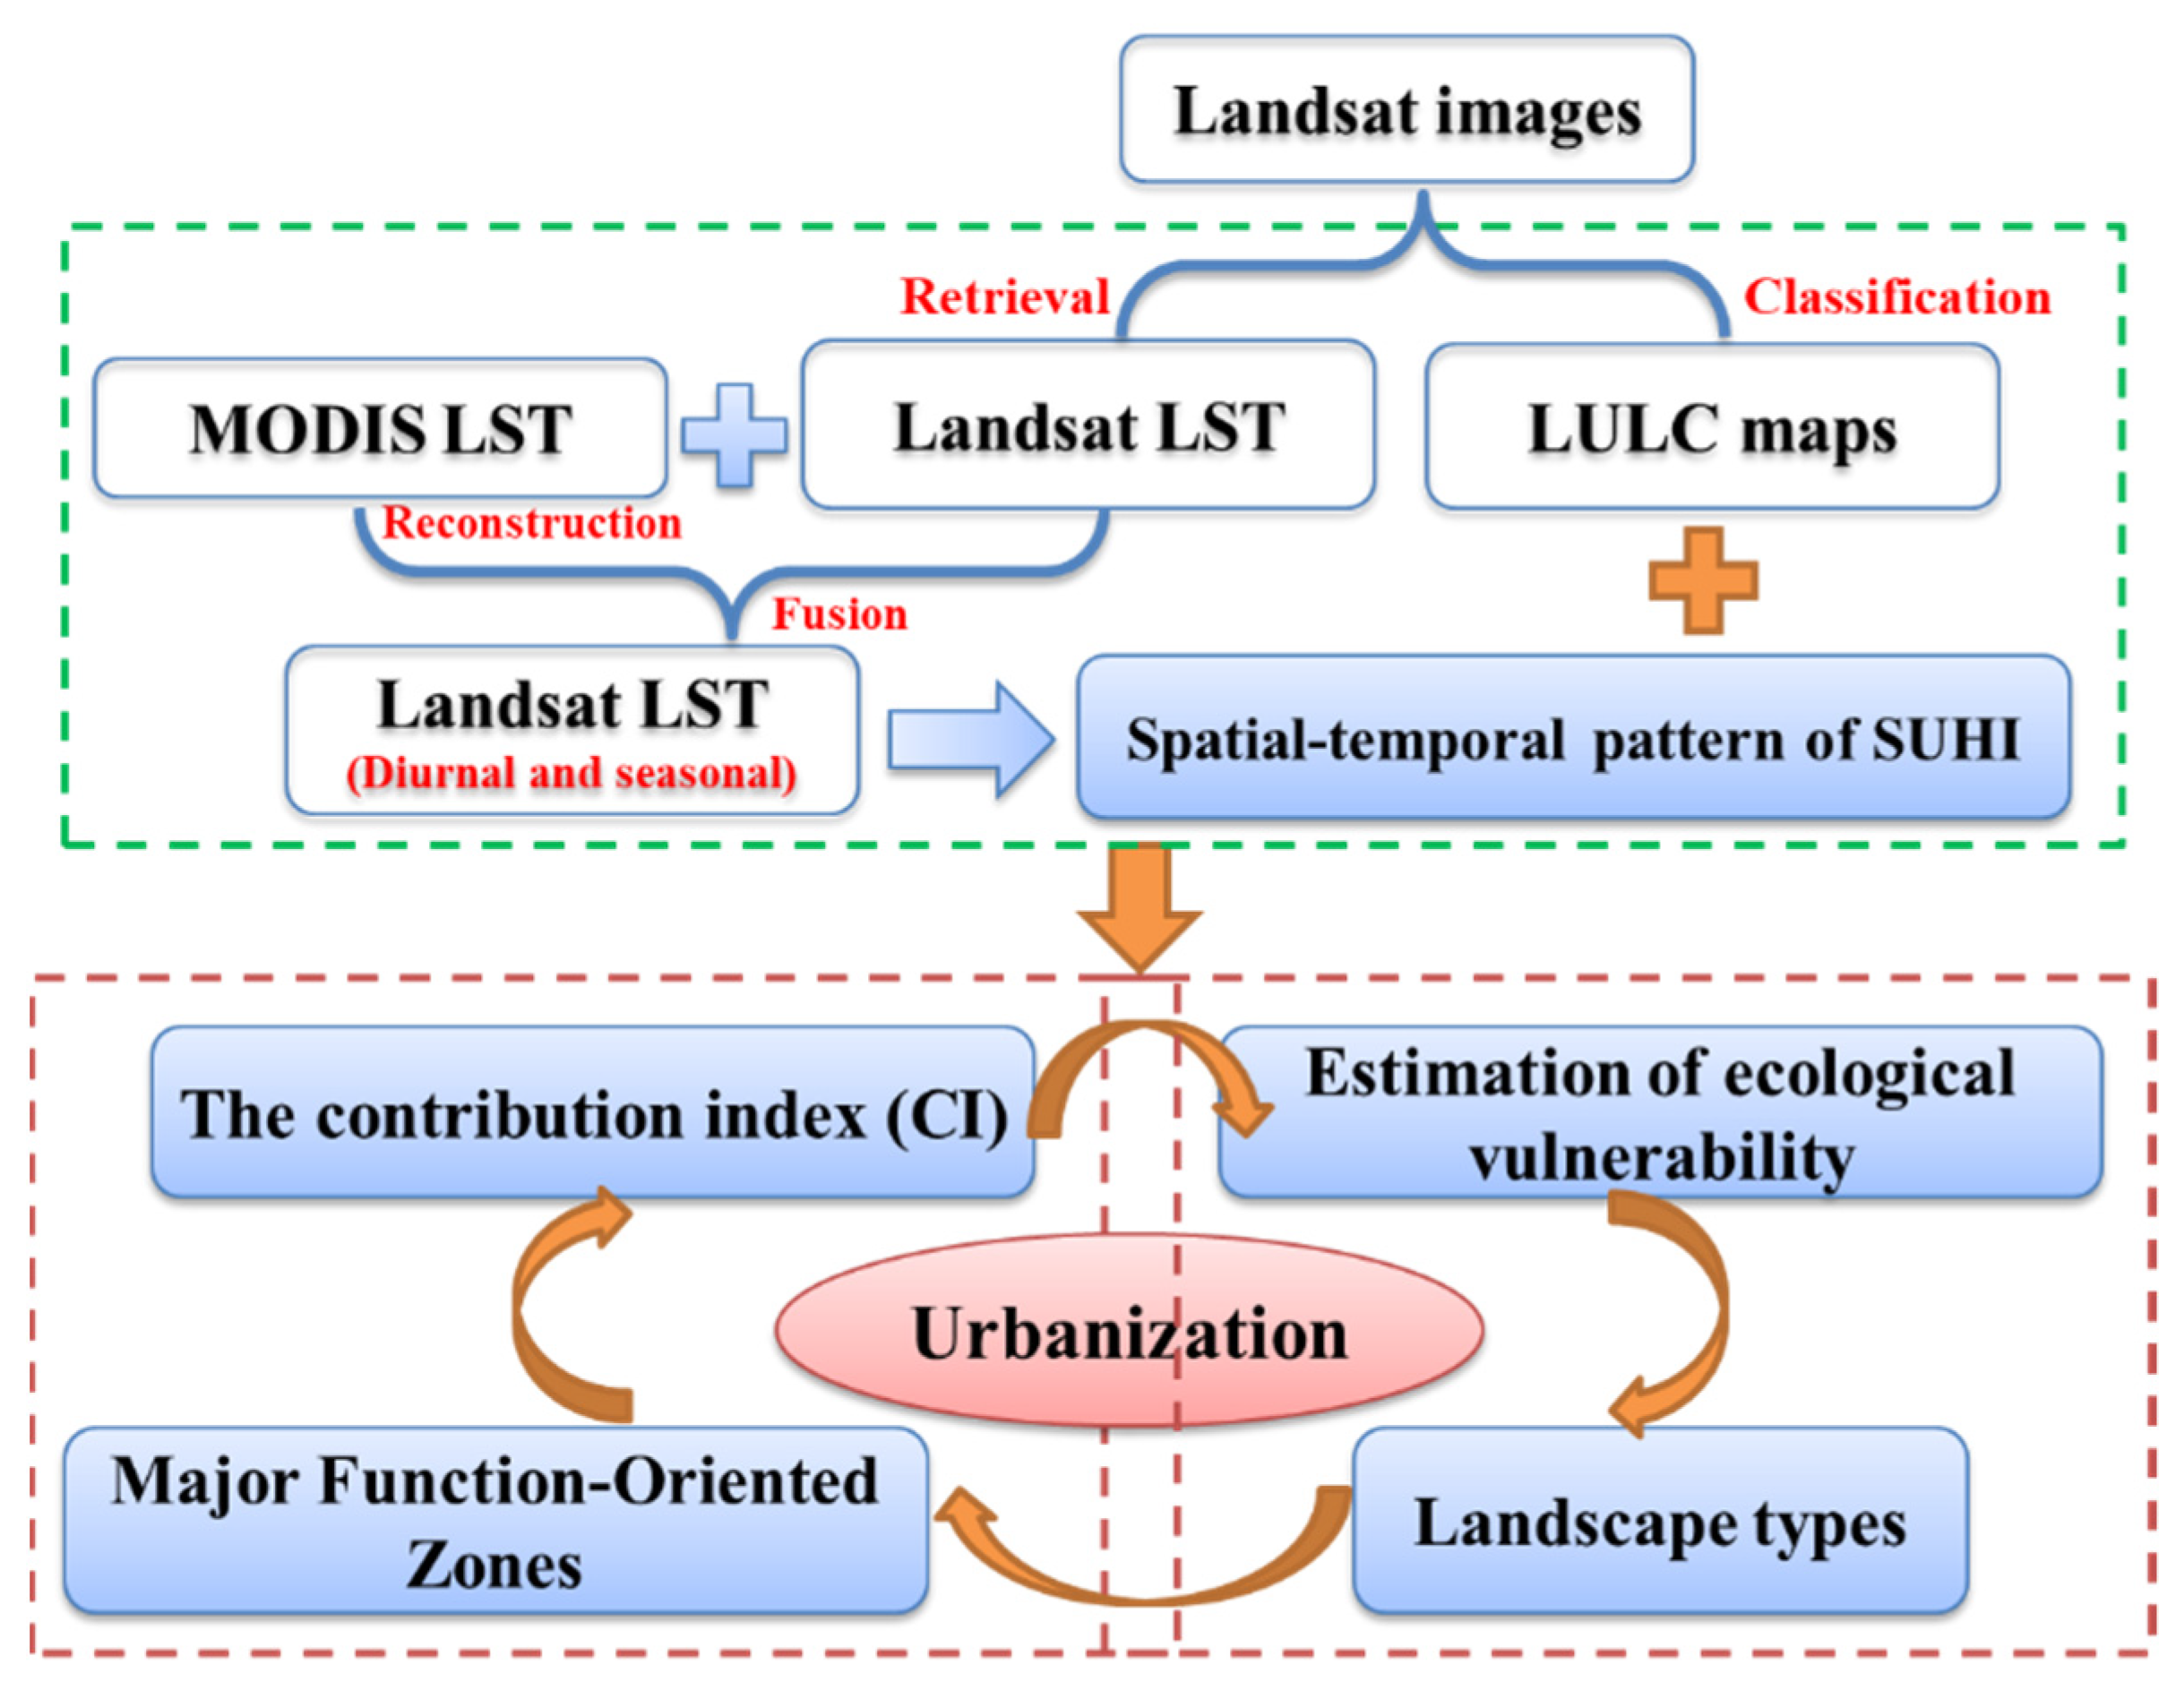
3. Materials and Methods

The methods used in this study comprised several elements, including Landsat and MODIS LST processing, UHI intensity, the land-use/land-cover (LULC) interpretation, contribution index, and the urban thermal field variation index. The general approach is summarized in the flowchart shown in Figure 2.

3.1. Satellite Data Acquisition and Pre-Processing

Cloud-free Landsat images (Landsat 5/7/8) covering Hefei were obtained from 2011 to 2020 (the acquisition time of Landsat was approximately 10:30 a.m. local time) from the official website, USGS GLOVIS (http://glovis.usgs.gov/, accessed in 12 May 2021). The spatial resolutions for the different Landsat thermal bands were 120 m (Landsat-5 thematic mapper TM), 60 m (Landsat-7 enhanced thematic mapper plus ETM+), and 100 m (Landsat-8 thermal infrared sensor TIRS). The radiative transfer equation (RTE) method [44,45] was applied for LST retrieval using these images. A series of diurnal MODIS LST products (MODIS/Terra LST/Emissivity Daily L3 Global 1 km SIN Grid V006; MOD11A1) from 2011 to 2020 were obtained from the USGS (acquisition times of MOD11A1 were approximately 10:30 am and 10:15 pm local time). The Landsat and MODIS data were projected onto the Universal Transverse Mercator (zone 50N) projection system and resampled to a spatial resolution of 30 m. Diurnal and seasonal Landsat-scale LSTs were obtained using the spatiotemporal reconstruction and fusion method used in our previous study [41]. The data are presented in Table 1.

3.2. Intensity of Surface Urban Heat Island

The average standard deviation method uses a combination of the average surface temperature and different standard deviation multiples to segment the surface temperature field to effectively describe the urban heat island [46]. In the evolution of SUHI in different phases, it can avoid the time phase difference to a certain extent [47]. This method indicates that areas with above-average temperatures are more likely to be classified as urban heat islands [47]. We divided the LSTs into five categories using the mean standard deviation method: high-temperature, sub-high-temperature, medium-temperature, sub-medium-temperature, and low-temperature zones (Table 2). The high-temperature and sub-high-temperature zones are urban heat island zones.
The intensity of surface urban heat islands (SUHII) [48,49] is calculated as follows:
SUHII = TH − TO
where TH is the average temperature of the heat island zone, and TO is the average temperature corresponding to the other temperature levels, except for the heat island zone.

3.3. The Contribution Index (CI) of MFOZ

The COZ is the most densely populated area in Hefei. The IDZ has obvious location and transportation advantages and a good industrial foundation, as it is the main manufacturing agglomeration zone in the city. The ADZ has a good foundation for agricultural development and is an important grain, cotton, and oil-producing region. The ECZ is an important ecological barrier and ecological product supply area in the city. The ecological environment of the ECZ is fragile and sensitive. In this study, a contribution index [38,39,50] was used to quantify the contribution of each MFOZ or landscape to the regional thermal environment. The contribution index is calculated as follows:
CI = (Ta − TAvg) × (Sa/S)
where CI is the contribution of the MFOZ or landscape to the regional LST, Ta is the average surface temperature of zone a or landscape a, TAvg is the average surface temperature of the region, Sa is the area of zone a, and S is the area of the region.

3.4. The Urban Thermal Field Variation Index

The urban thermal field variation index (UTFVI) was used to evaluate the effect of the SUHI considering the ecological aspects of the municipality, according to the methodology proposed by Zhang [51]. The retrieved surface temperature was used to calculate the UTFVI [52]. The UTFVI can be calculated using Equation (3) as follows:
UTFVI = (Ts − Tm)/Tm
where UTFVI is the urban thermal field variation index, Ts is the temperature of a pixel in the study area, and Tm is the average temperature over the entire study area.
The UTFVI was used to quantitatively describe the urban heat island effect [51]. In this study, we used the UTFVI as an ecological indicator to evaluate the urban environmental quality [53]. To intuitively describe the change in the urban thermal field, the threshold method was used to divide the urban thermal field into six levels [53]. The threshold divisions of the ecological indicators and their corresponding ecological significance levels are presented in Table 3.

4. Results and Analysis

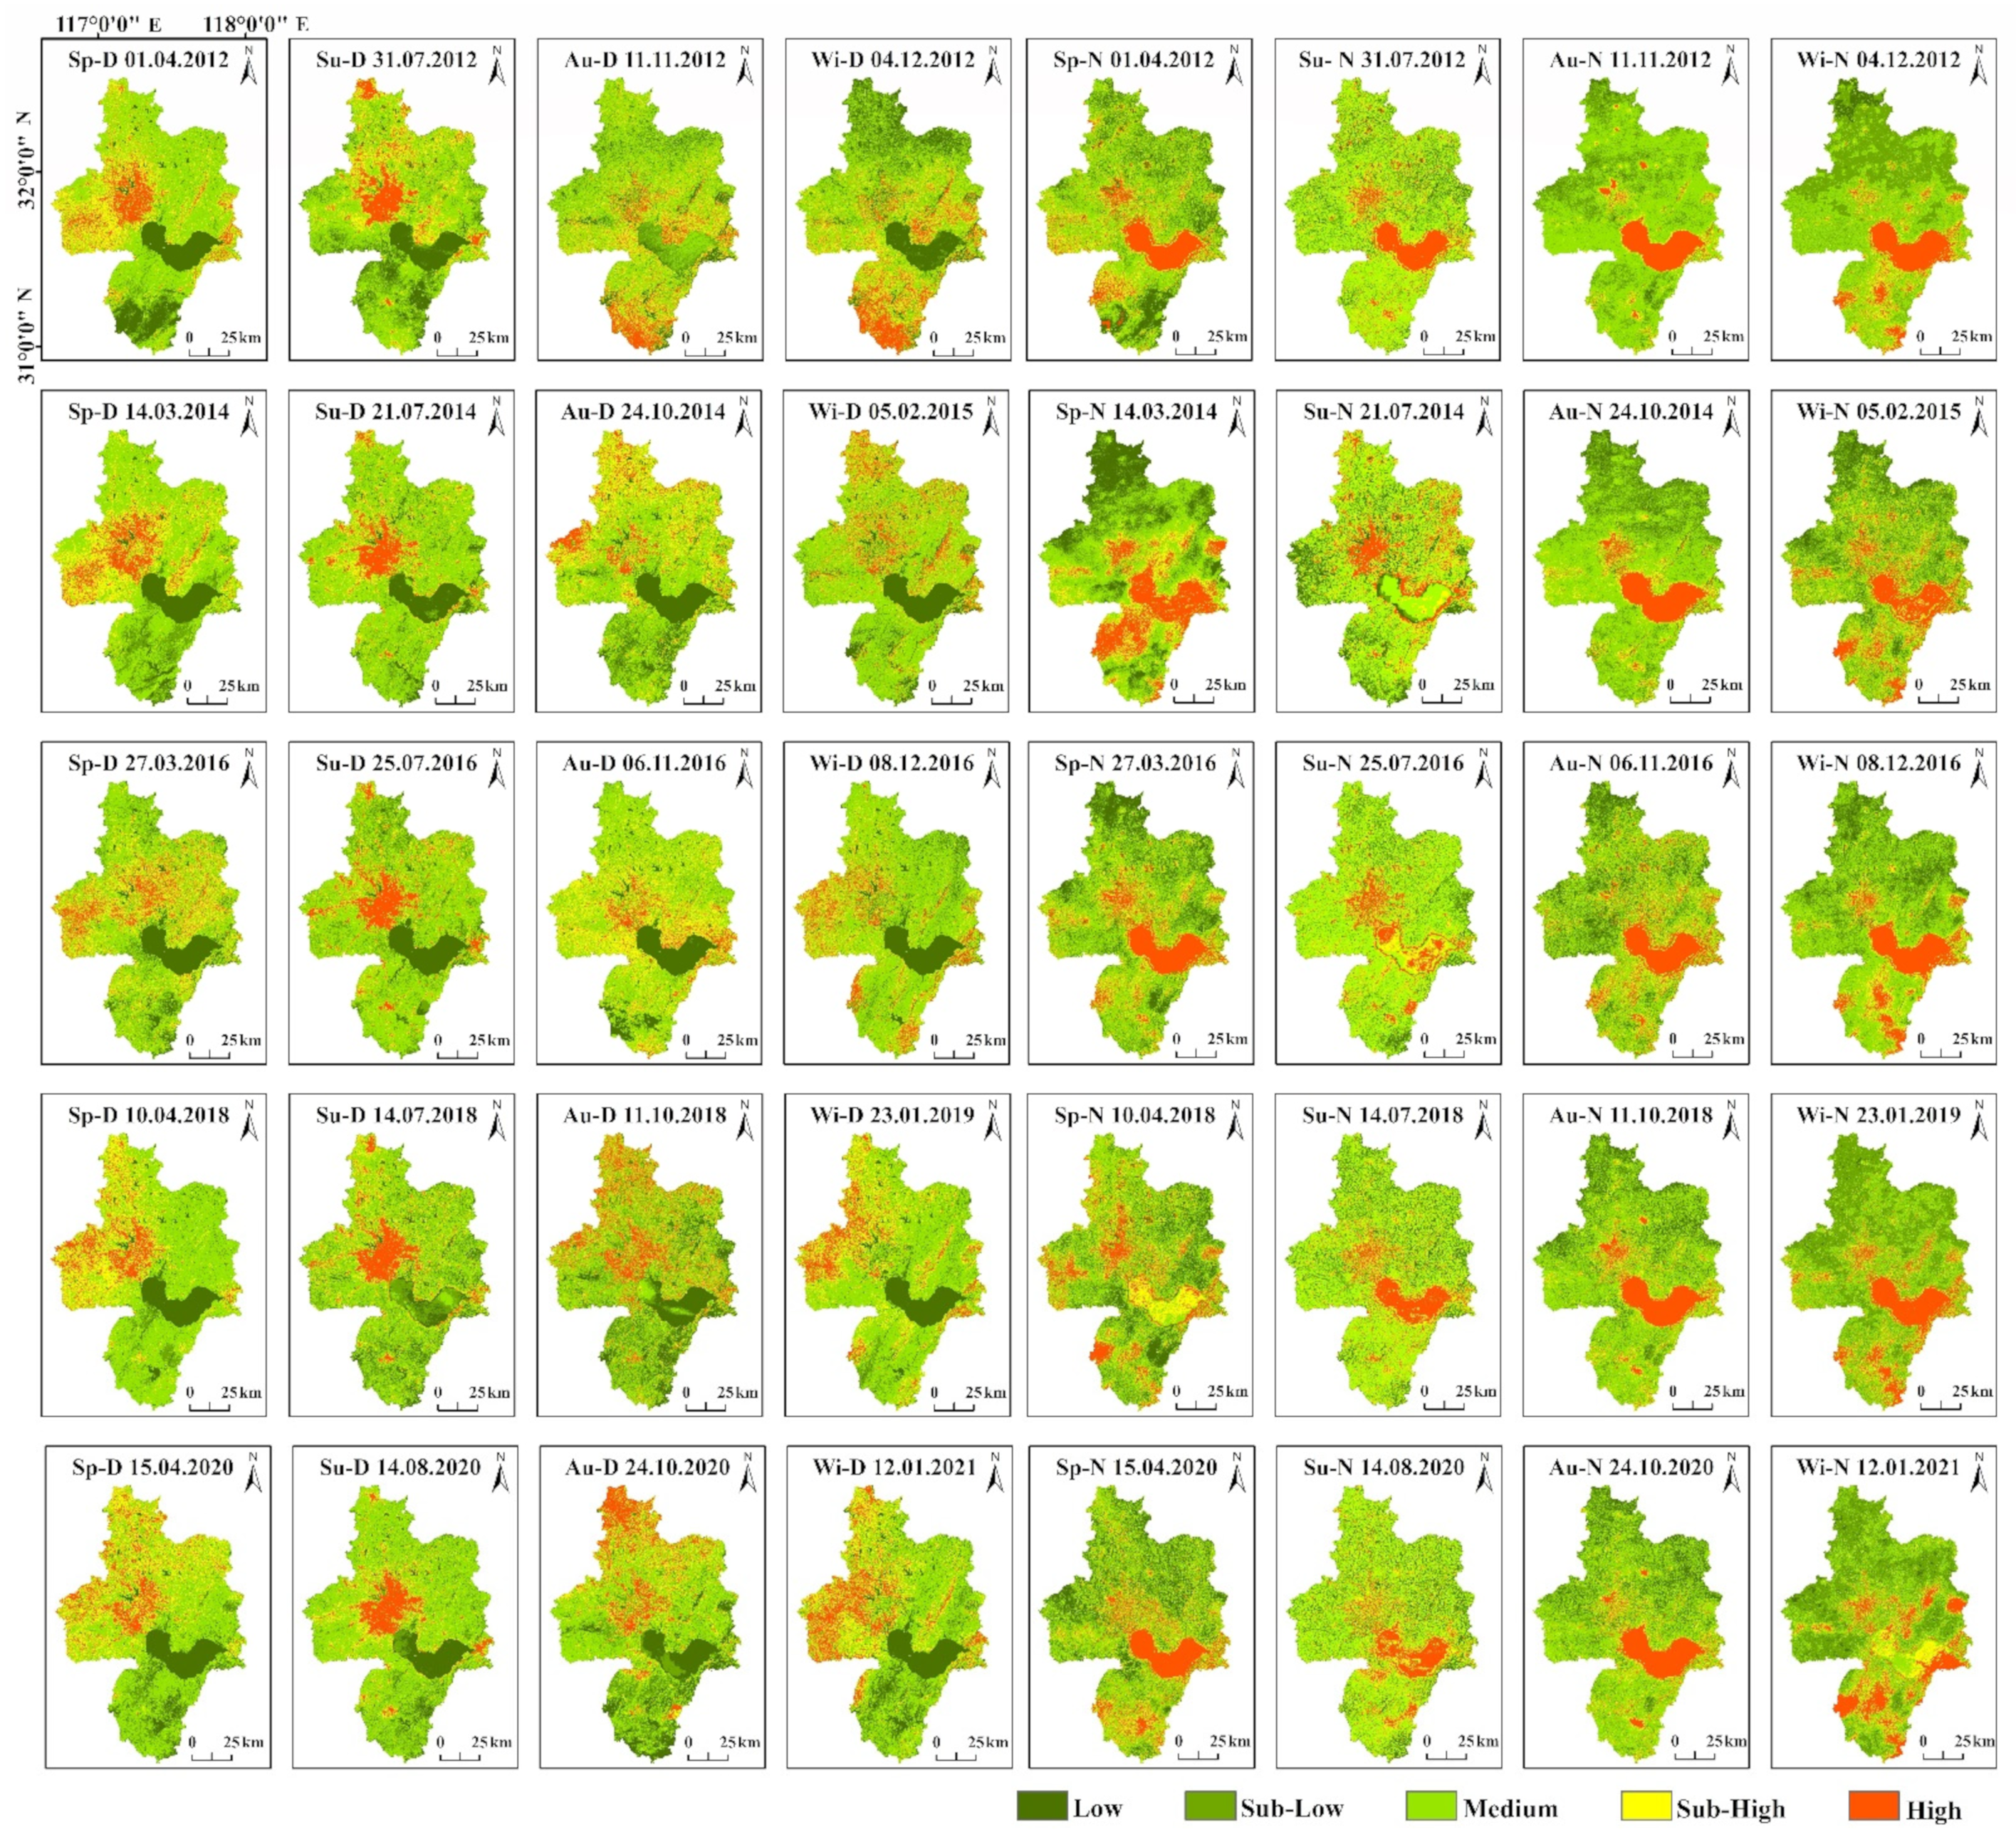
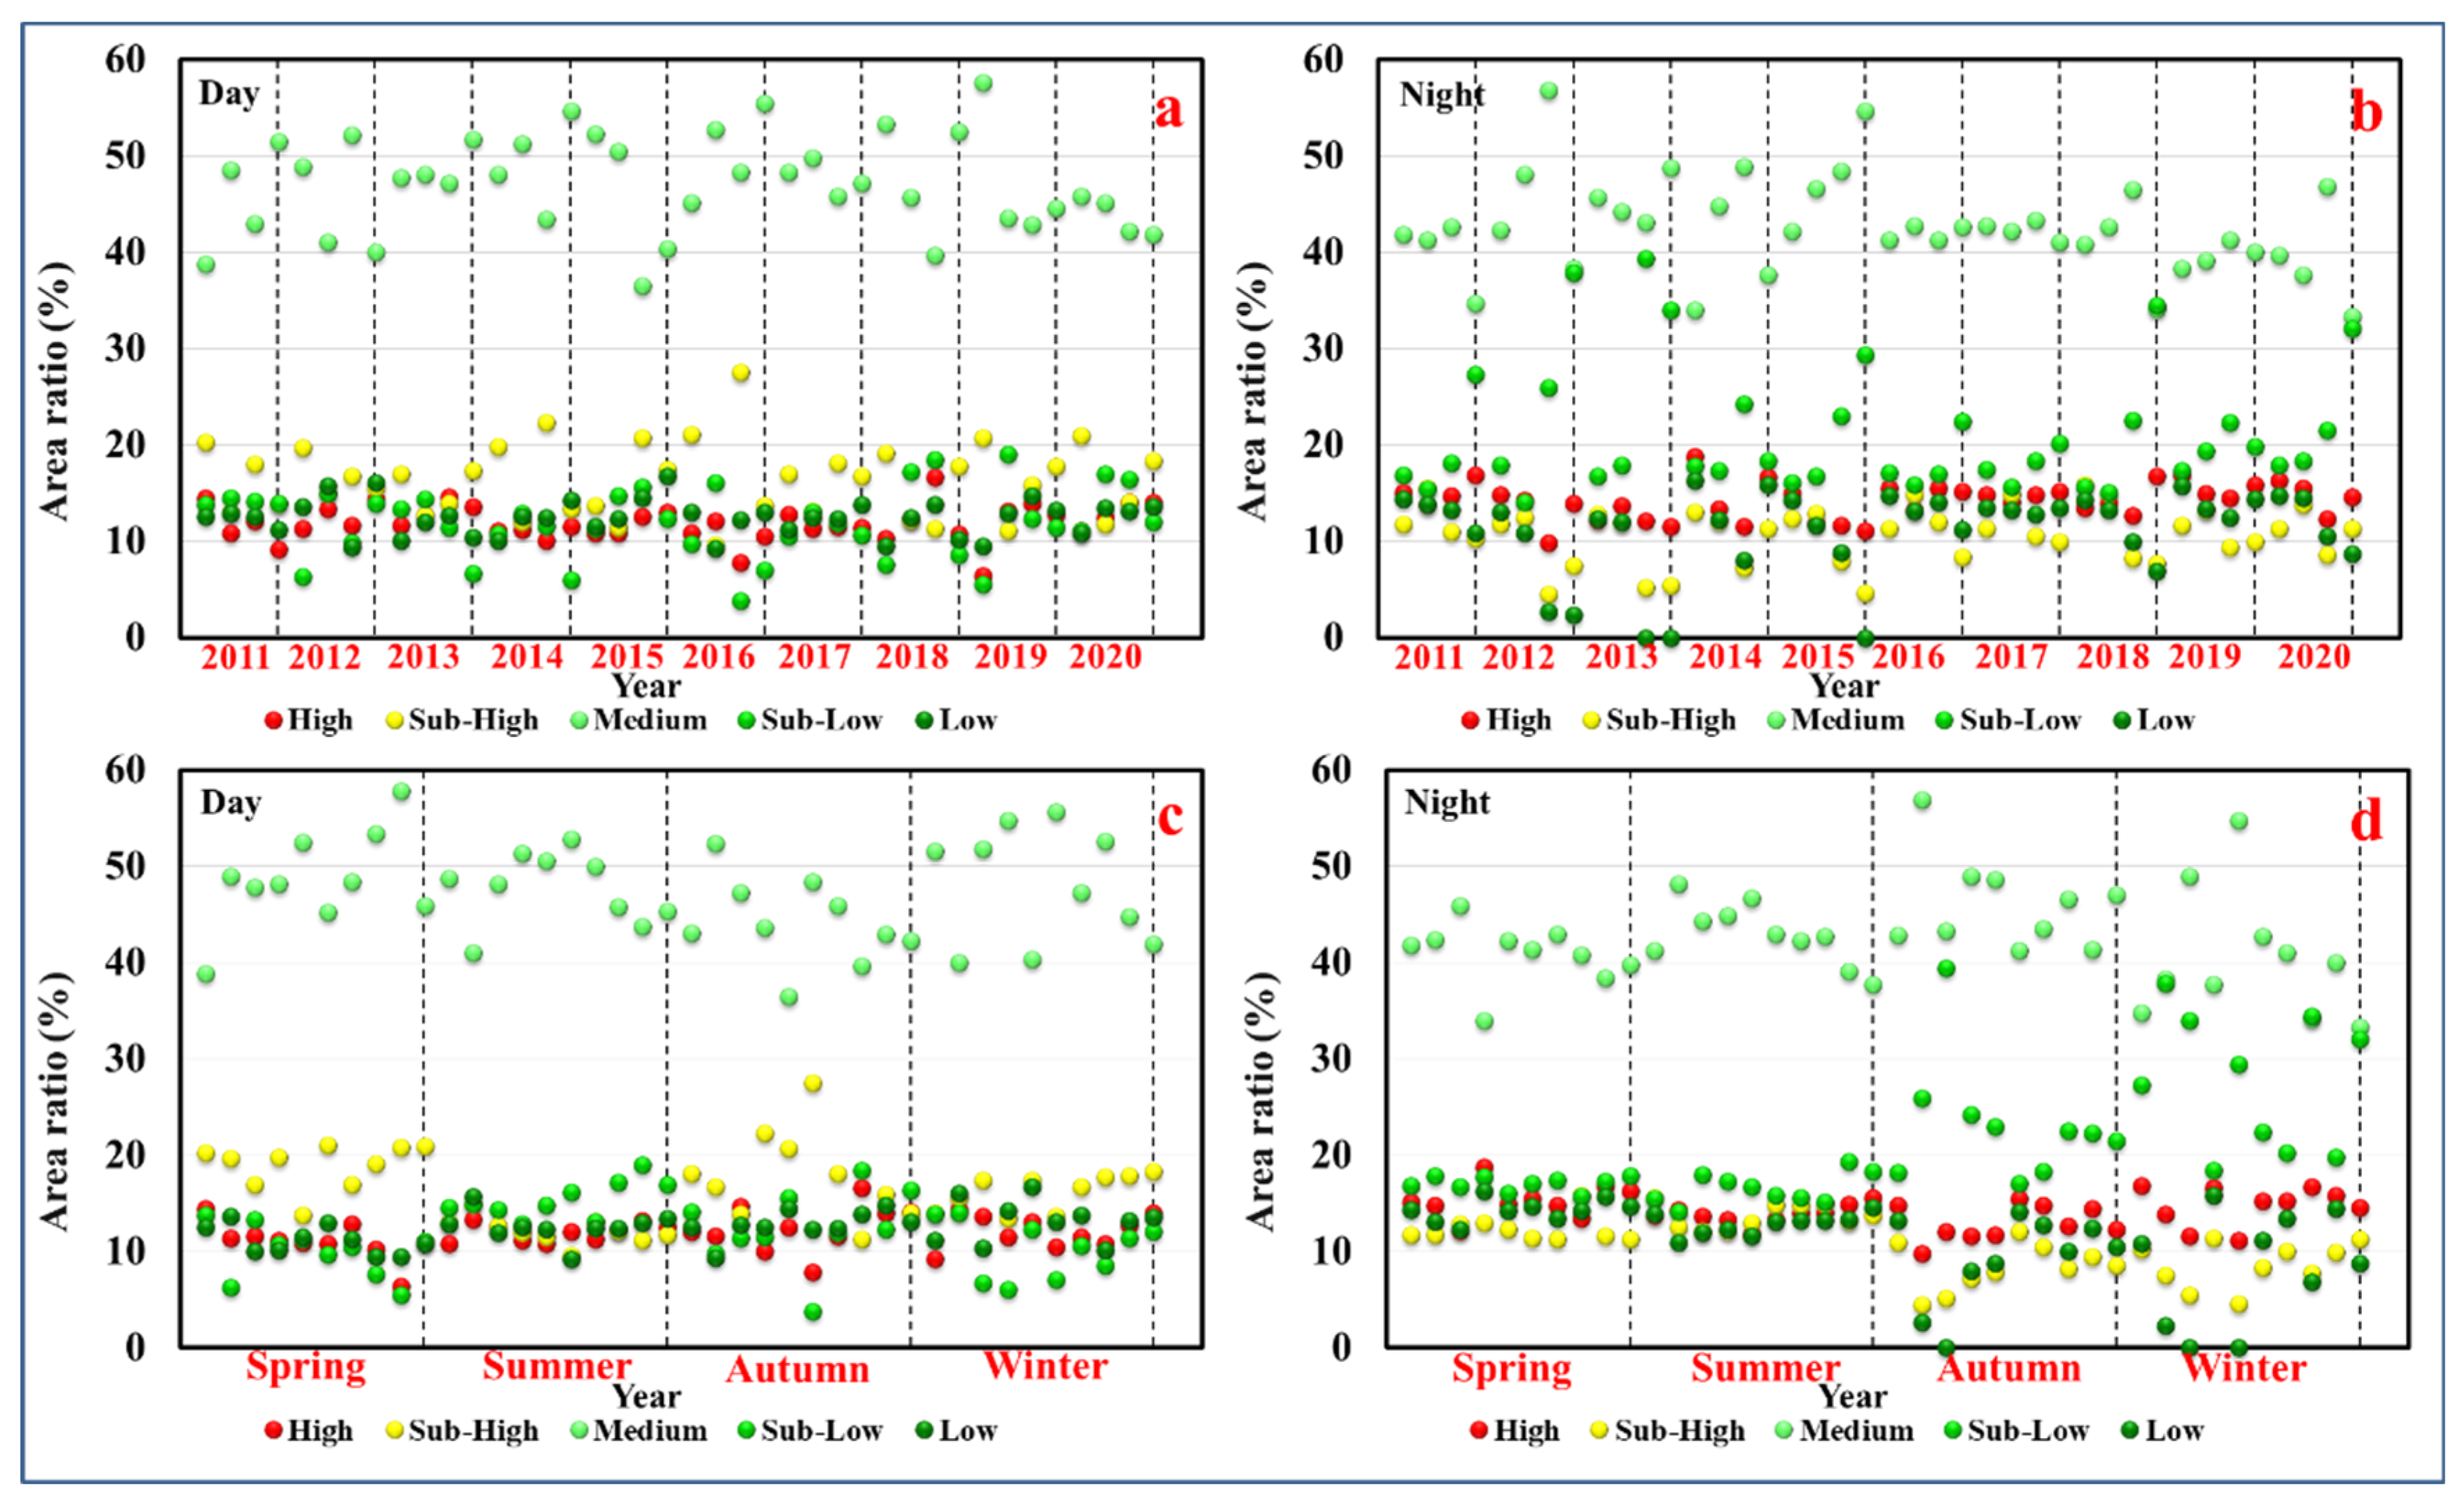
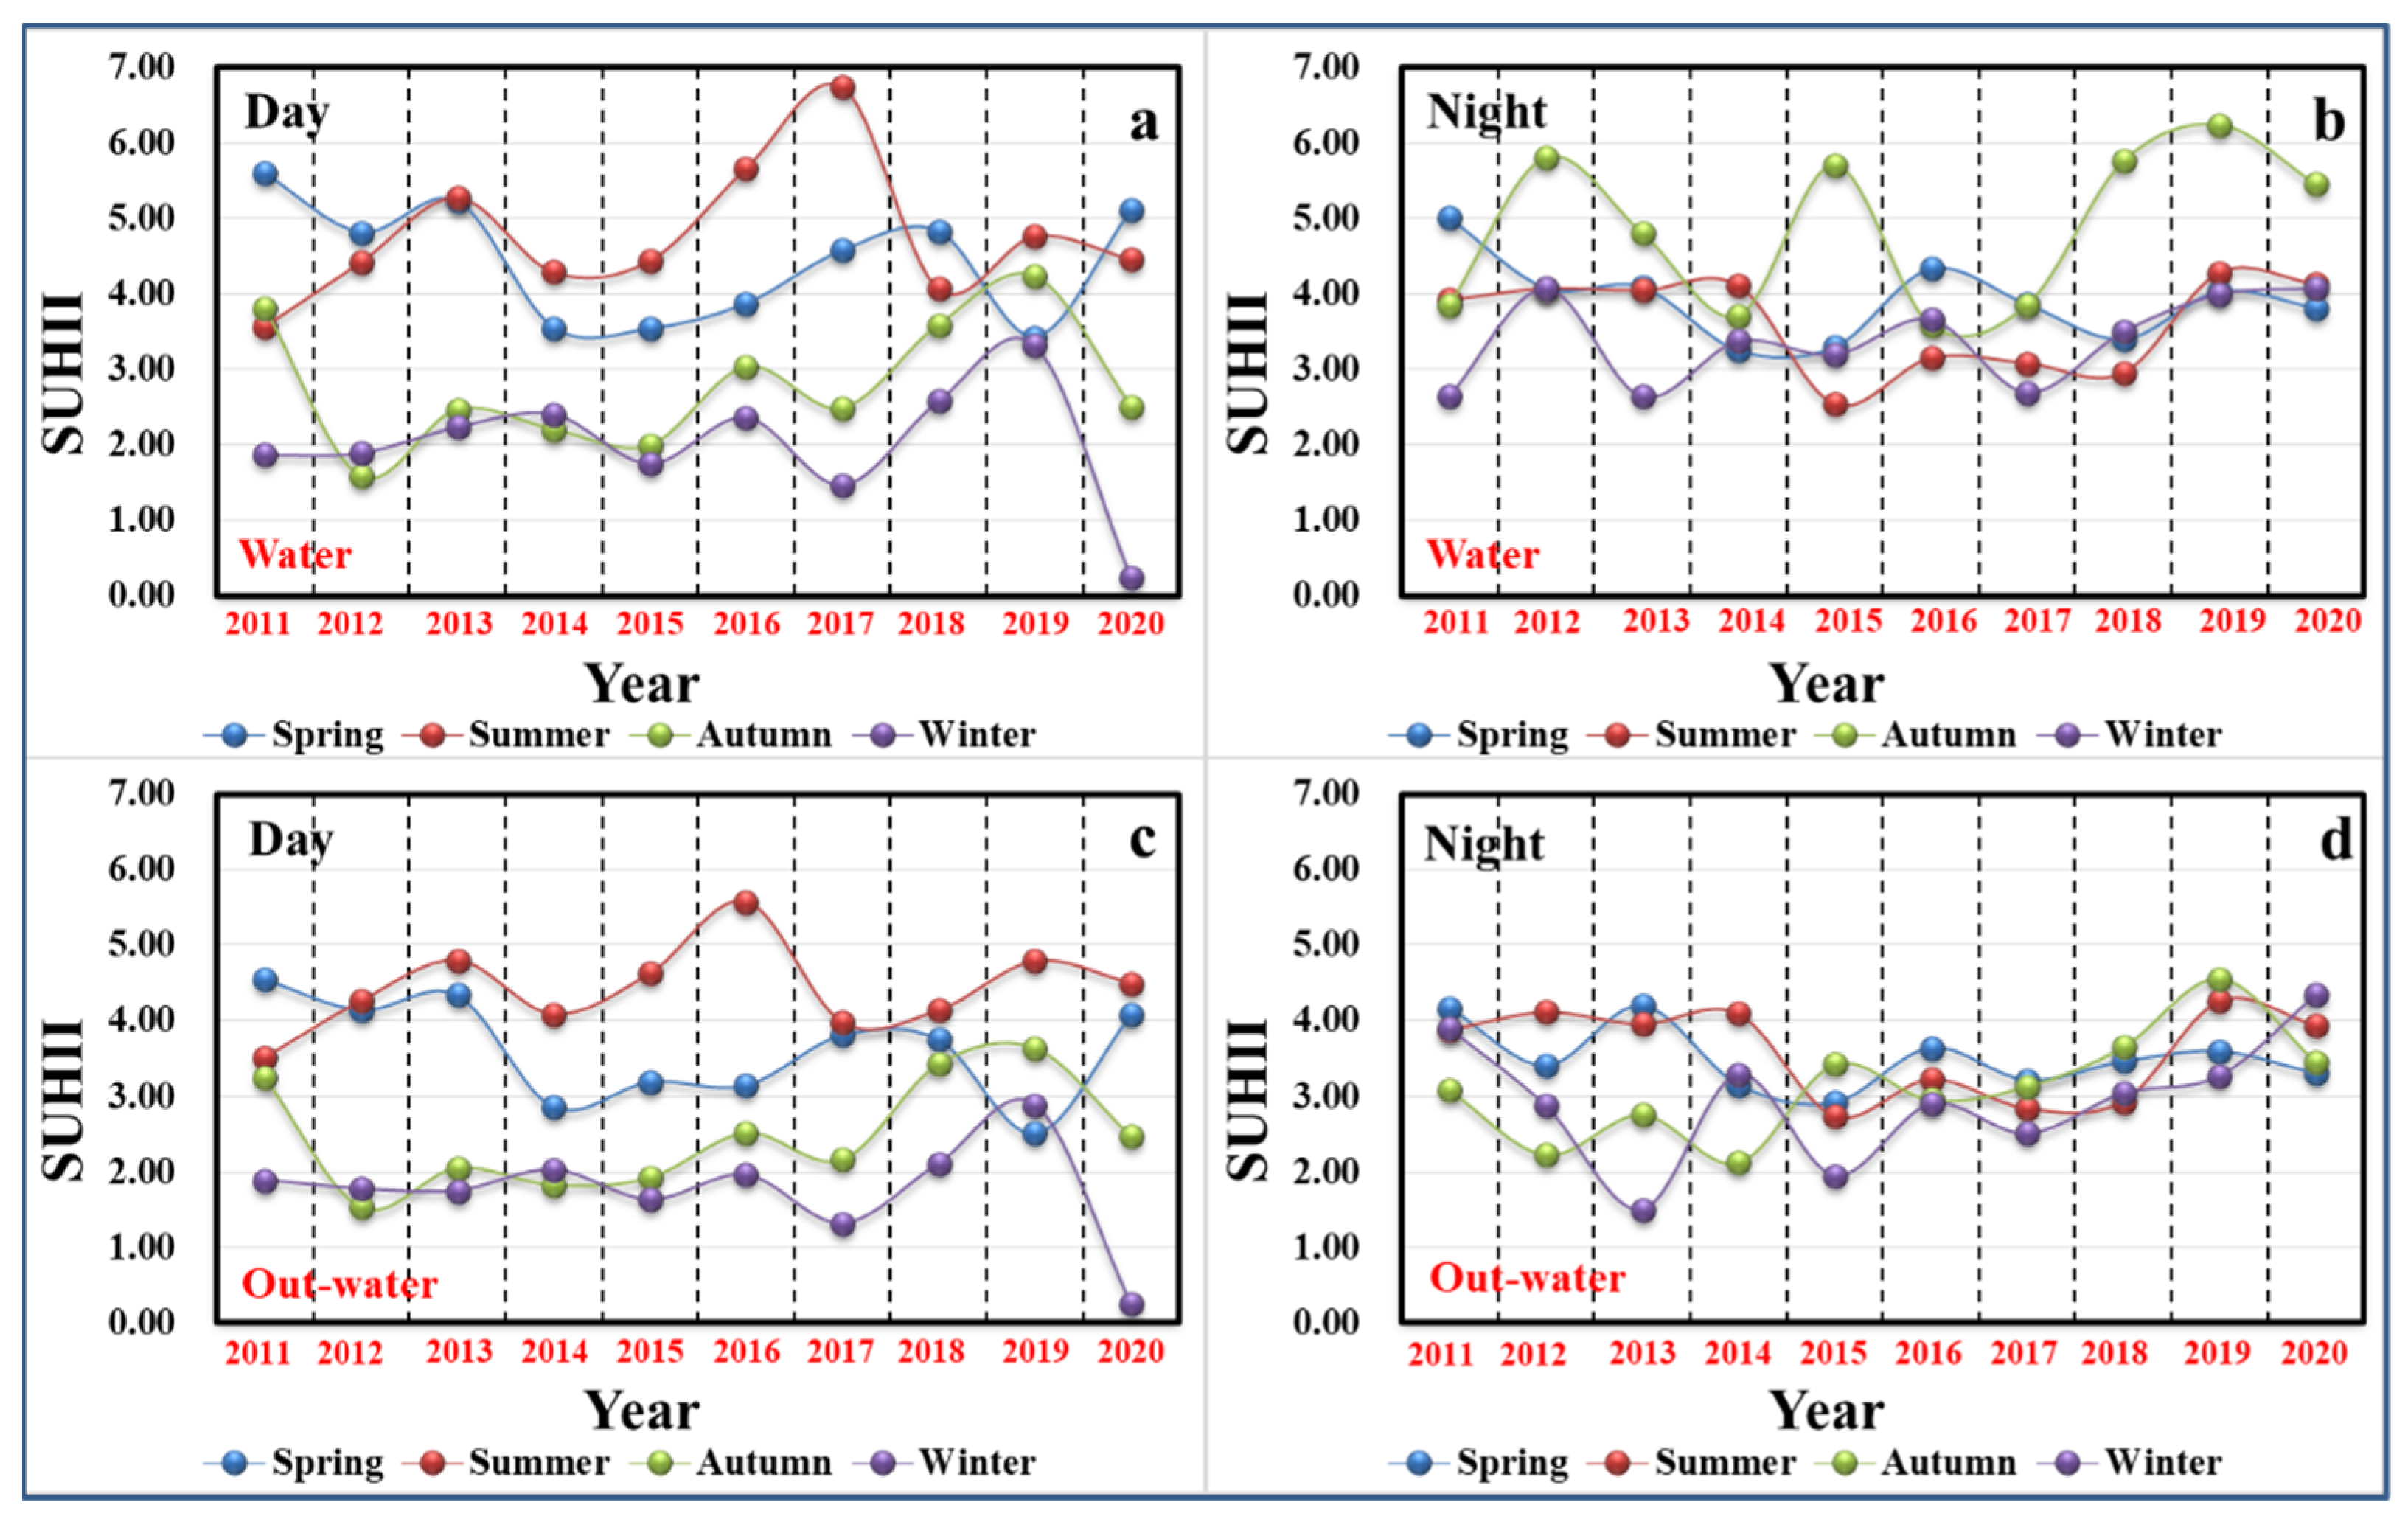
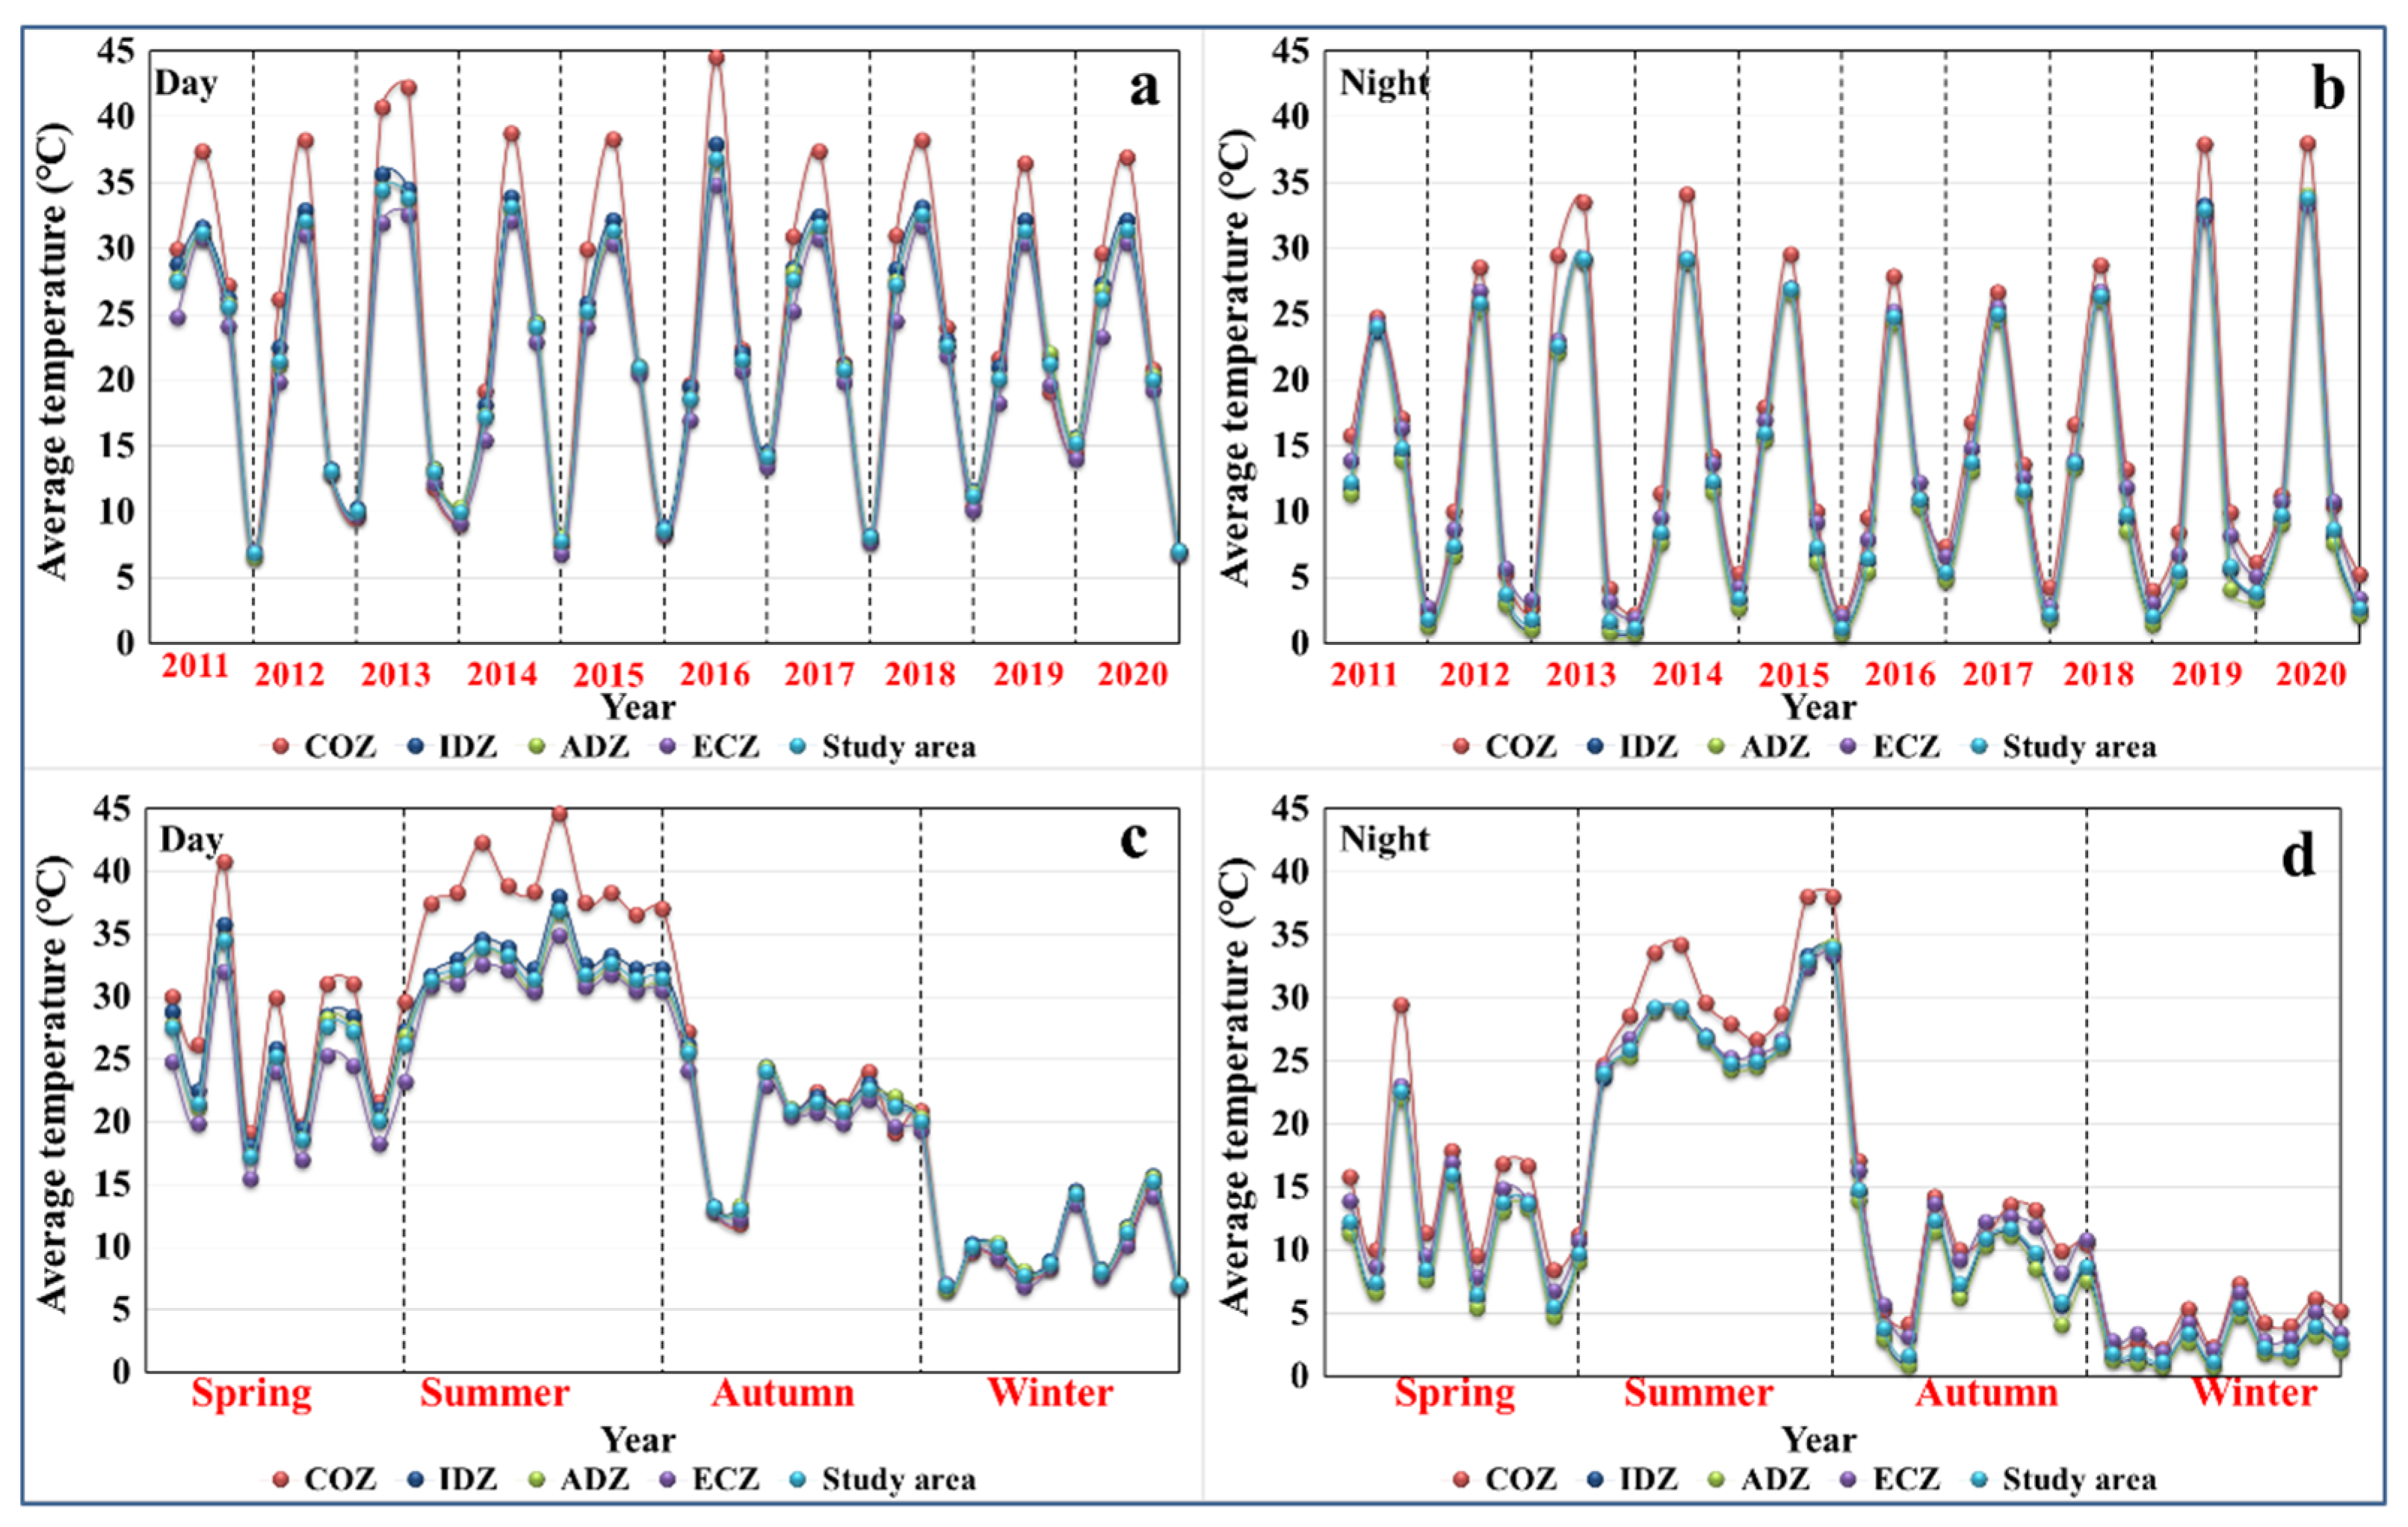
4.1. Evolution Analysis of Diurnal and Seasonal SUHI

Figure 3 shows the day and night SUHI images of Hefei during the different seasons from 2011 to 2020. The fused Landsat images presented more detailed information (e.g., image texture structure) and clearer boundaries than the MODIS images. The urban heat island phenomenon occurs in spring and summer during the day and becomes more obvious in summer, whereas the SUHI in other seasons is not obvious. Apparently, SUHI has been concentrated in the main city zone of Hefei over the past 10 years. The built-up areas of Changfeng, Chaohu, and Lujiang were small, and the effect of SUHI was not prominent. Heat islands appear on cultivated land during the spring, autumn, and winter. Because part of the cultivated land is not cultivated during these seasons, the surface of the land is exposed and rapidly heated by solar radiation. Thus, the surface temperature was higher. An urban heat island exists in all seasons at night, which is relatively evident in spring and summer. In addition, a heat island also appears in water bodies at night, mainly because the larger specific heat capacity of the water area slows down the cooling rate at night and, hence, increases the temperature. The temperature at night in areas covered by vegetation during winter was relatively high. Owing to the high thermal inertia of vegetation, dense vegetation has a heat preservation effect at night, and the temperature is higher than in other areas [54].
Overall, the heat island area in the main city zone of Hefei has increased with the expansion of the main city zone from 2011 to 2020 and is highly consistent with the spatial distribution and direction of urban expansion. It has mainly expanded to the southwest and northeast of the main city zone and is comprised of high and sub-high zones. The urban heat island phenomena in Changfeng, Chaohu, and Lujiang did not change significantly. In the last 10 years, the main city zone of Hefei has expanded significantly, the underlying surface has changed significantly, and the impervious surface area has increased, prominently changing the thermal environment of the study area.
Overall, during the day, the area ratio of the medium zone was higher than that of the sub-high zone, whereas the area ratios of the high, sub-low, and low zones were similar from 2011 to 2020 (Figure 4). During the day, the area ratio of the medium zone was higher than that of the sub-low zone, whereas the area ratios of the high, sub-high, and low zones were relatively similar. Seasonal differences in the area ratio of the temperature level zones were evident, and the area ratio of the medium zone was the highest in all seasons. In general, the SUHII showed significant diurnal and seasonal differences (Figure 5). The SUHII in summer was higher during the day than at night. In spring, SUHII during the day was similar to that at night. Overall, the intensity and fluctuation range of SUHI were higher in spring and summer than in autumn and winter. This is because the vegetation is lush in spring and summer, which are growing seasons. Compared with impervious surfaces, such as concrete buildings, areas with high vegetation coverage usually have lower sensible heat flux and higher latent heat flux owing to the strong effect of evaporation, which causes the temperature to be lower than that of impervious surfaces, such as buildings [55,56]. The seasonal difference in SUHII was higher during the day than at night, and the fluctuation range in different seasons at night was more concentrated than that during the day (especially when excluding water bodies). In addition, the urban heat island at night in autumn and winter was larger than that in the daytime, but this phenomenon weakened after excluding water bodies. This is mainly due to the more effective radiative cooling in vegetated land compared to urban canopy structures with complex geometry and large heat capacity. The larger specific heat capacity of water slows the cooling rate at night.

4.2. Diurnal and Seasonal Contribution of MFOZ

In this study, LULC data from 2011, 2014, 2017, and 2020 were selected as examples to further calculate the percentage of each landscape area under the MFOZ. The interpretation of remote sensing images refers to land use data of 30 m released by the Data Center of the Institute of Geographic Sciences and Natural Resources Research of the Chinese Academy of Sciences (http://www.resdc.cn/, accessed in 28 May 2021). Referring to the National Land Use Cover Classification System of remote sensing monitoring, the research results of land use in Hefei, and the current status of land use in the study area, the four types of LULC extracted in the study were defined as cultivated land, construction land, water, and vegetation [57,58]. According to the accuracy evaluation, the kappa coefficients of the remote sensing images for 2011, 2014, 2017, and 2020 were 0.89, 0.88, 0.87, and 0.89, respectively.
For the entire study area, with the increasing urbanization process, the cultivated land occupied by construction land decreased from 2011 to 2020. This may have led to the occupation of agricultural water. Water and vegetation were relatively stable, with little change. The four MFOZs showed significant differences in terms of area and landscape composition. The ratios of the four MFOZs (COZ, IDZ, ADZ, and ECZ) in Hefei were 1%, 46%, 28%, and 25%, respectively (Figure 6). The level of urbanization rapidly decreased from the COZ to the ECZ. Although only 0.01% of the study area is covered, according to Hefei’s MFOZ planning (2016–2020), the development intensity of the COZ is more than 90%, with approximately 6700 people per square kilometer, which is between five and ten times the average level of the whole city. From 2011 to 2020, construction land was dominant in the COZ, accounting for more than 94% of the area. In the IDZ, the main landscape is cultivated land, which accounts for more than 61% of the study area. Construction land was another important component of the IDZ, accounting for more than 23% of the total. Cultivated land accounted for approximately 80% of the ADZ, whereas construction land accounted for approximately 14%. The ECZ had the lowest level of urbanization among the four MFOZs. The coverage rates of cultivated land, construction land, water, and vegetation were approximately 53%, 9%, 28%, and 8%, respectively.
The average LST differences between each MFOZ were calculated (Figure 7), and the day and night data for the four seasons from 2011 to 2020 were selected to calculate the contributions of the four MFOZs (Figure 8). Overall, during the day, the average temperatures in the COZ and IDZ were higher than those in the ADZ and ECZ from 2011 to 2020 (Figure 6). The average temperature in the study area was very close to that of the ADZ. Compared with spring and summer, the average temperature regularity of the MFOZ in autumn and winter was not obvious. This is because, in autumn and winter, part of the cultivated land is in the non-cultivation period, the landscape type is greatly affected by solar radiation, and the temperature is unstable. At night, the average temperatures of the COZ and ECZ were higher than those of the IDZ and ADZ. The average temperature in the study area was between that of the ECZ and IDZ. This is because the ECZ contains a large amount of water, and the large specific heat capacity of the water slows down the cooling rate at night, so the temperature in the ECZ is higher at night. During the day or night, the average temperature of the COZ was much higher than those of the other MFOZs. When comparing the difference between day and night, LST was relatively stable and more regular during the night. Because of the different thermal inertia of the landscape during the day, the influence of solar radiation is also different, whereas the artificial heat resources during the night are relatively concentrated and stable. Overall, the average temperature of the four MFOZs after 2017 was lower than that before 2017, indicating that the implementation of MFOZ planning alleviated the urban heat island effect to a certain extent.
Figure 8 shows the thermal environment contribution index of the MFOZ to the study area during the day and night in the different seasons. The thermal environment contribution index is defined as the product of the average temperature difference between the MFOZ and the study area and the area percentage; thus, the value of the area and the average temperature have a greater influence. During the day, IDZ contributed the most to the urban thermal environment. The CI of IDZ ranges from 0.03–0.62. The CI of the ECZ ranges from −0.69 to −0.03. The CI values of the ADZ and COZ fluctuate around zero. The ADZ had a constant negative contribution in the summer because of the cooling effect of the lush crops. Although the COZ had the highest LST, its contribution to the urban thermal environment was not the greatest because it had the smallest area, accounting for only 0.01% of the study area. The ECZ had a constant negative contribution, mainly because it had a large amount of vegetation and water, alleviating the effect of the urban heat island. However, the contribution of the ECZ changed significantly following the changes in water and vegetation during the four seasons. In spring, the cooling effect of water and vegetation was the most obvious in the ECZ. At night, ECZ contributed the most to the urban thermal environment. The CI of the ECZ mostly ranges from 0.01 to 0.60. The CI of COZ ranges from 0.01 to 0.05. The CI of the IDZ mostly ranges from −0.01 to −0.25. The CI of the ADZ mostly ranges from −0.03 to −0.51. This is because the larger specific heat capacity of water slows the cooling rate at night.

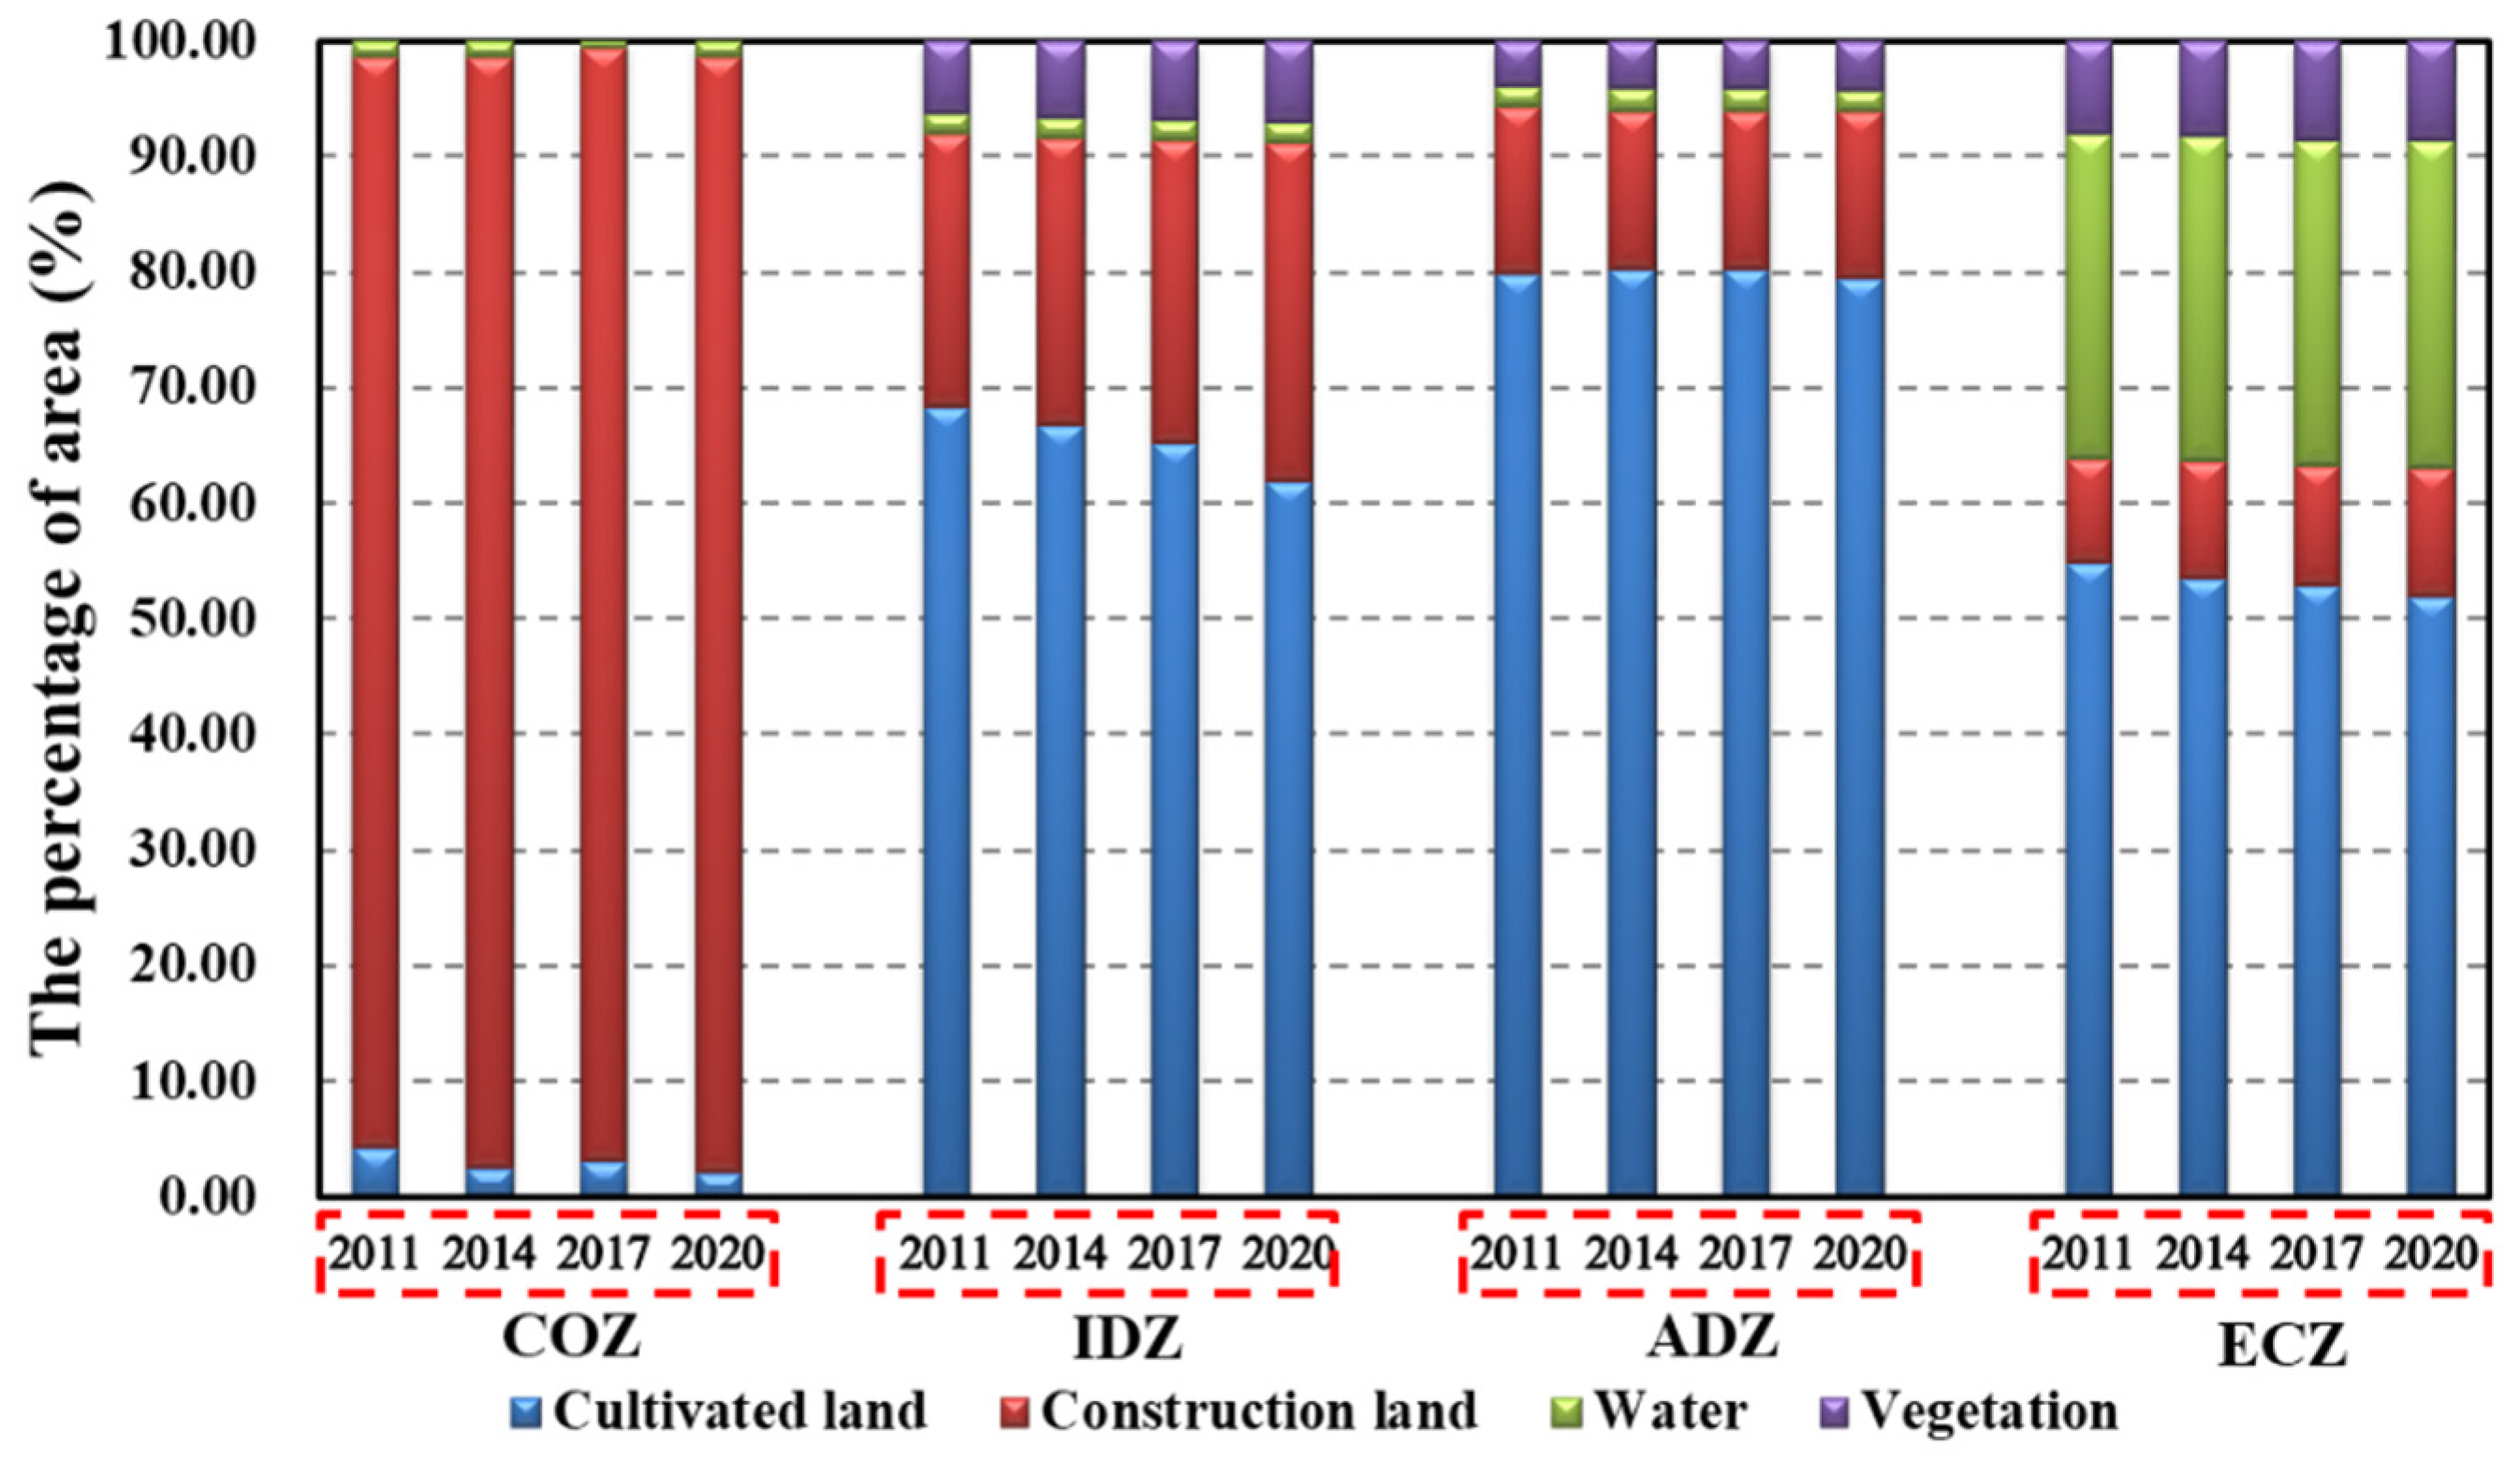
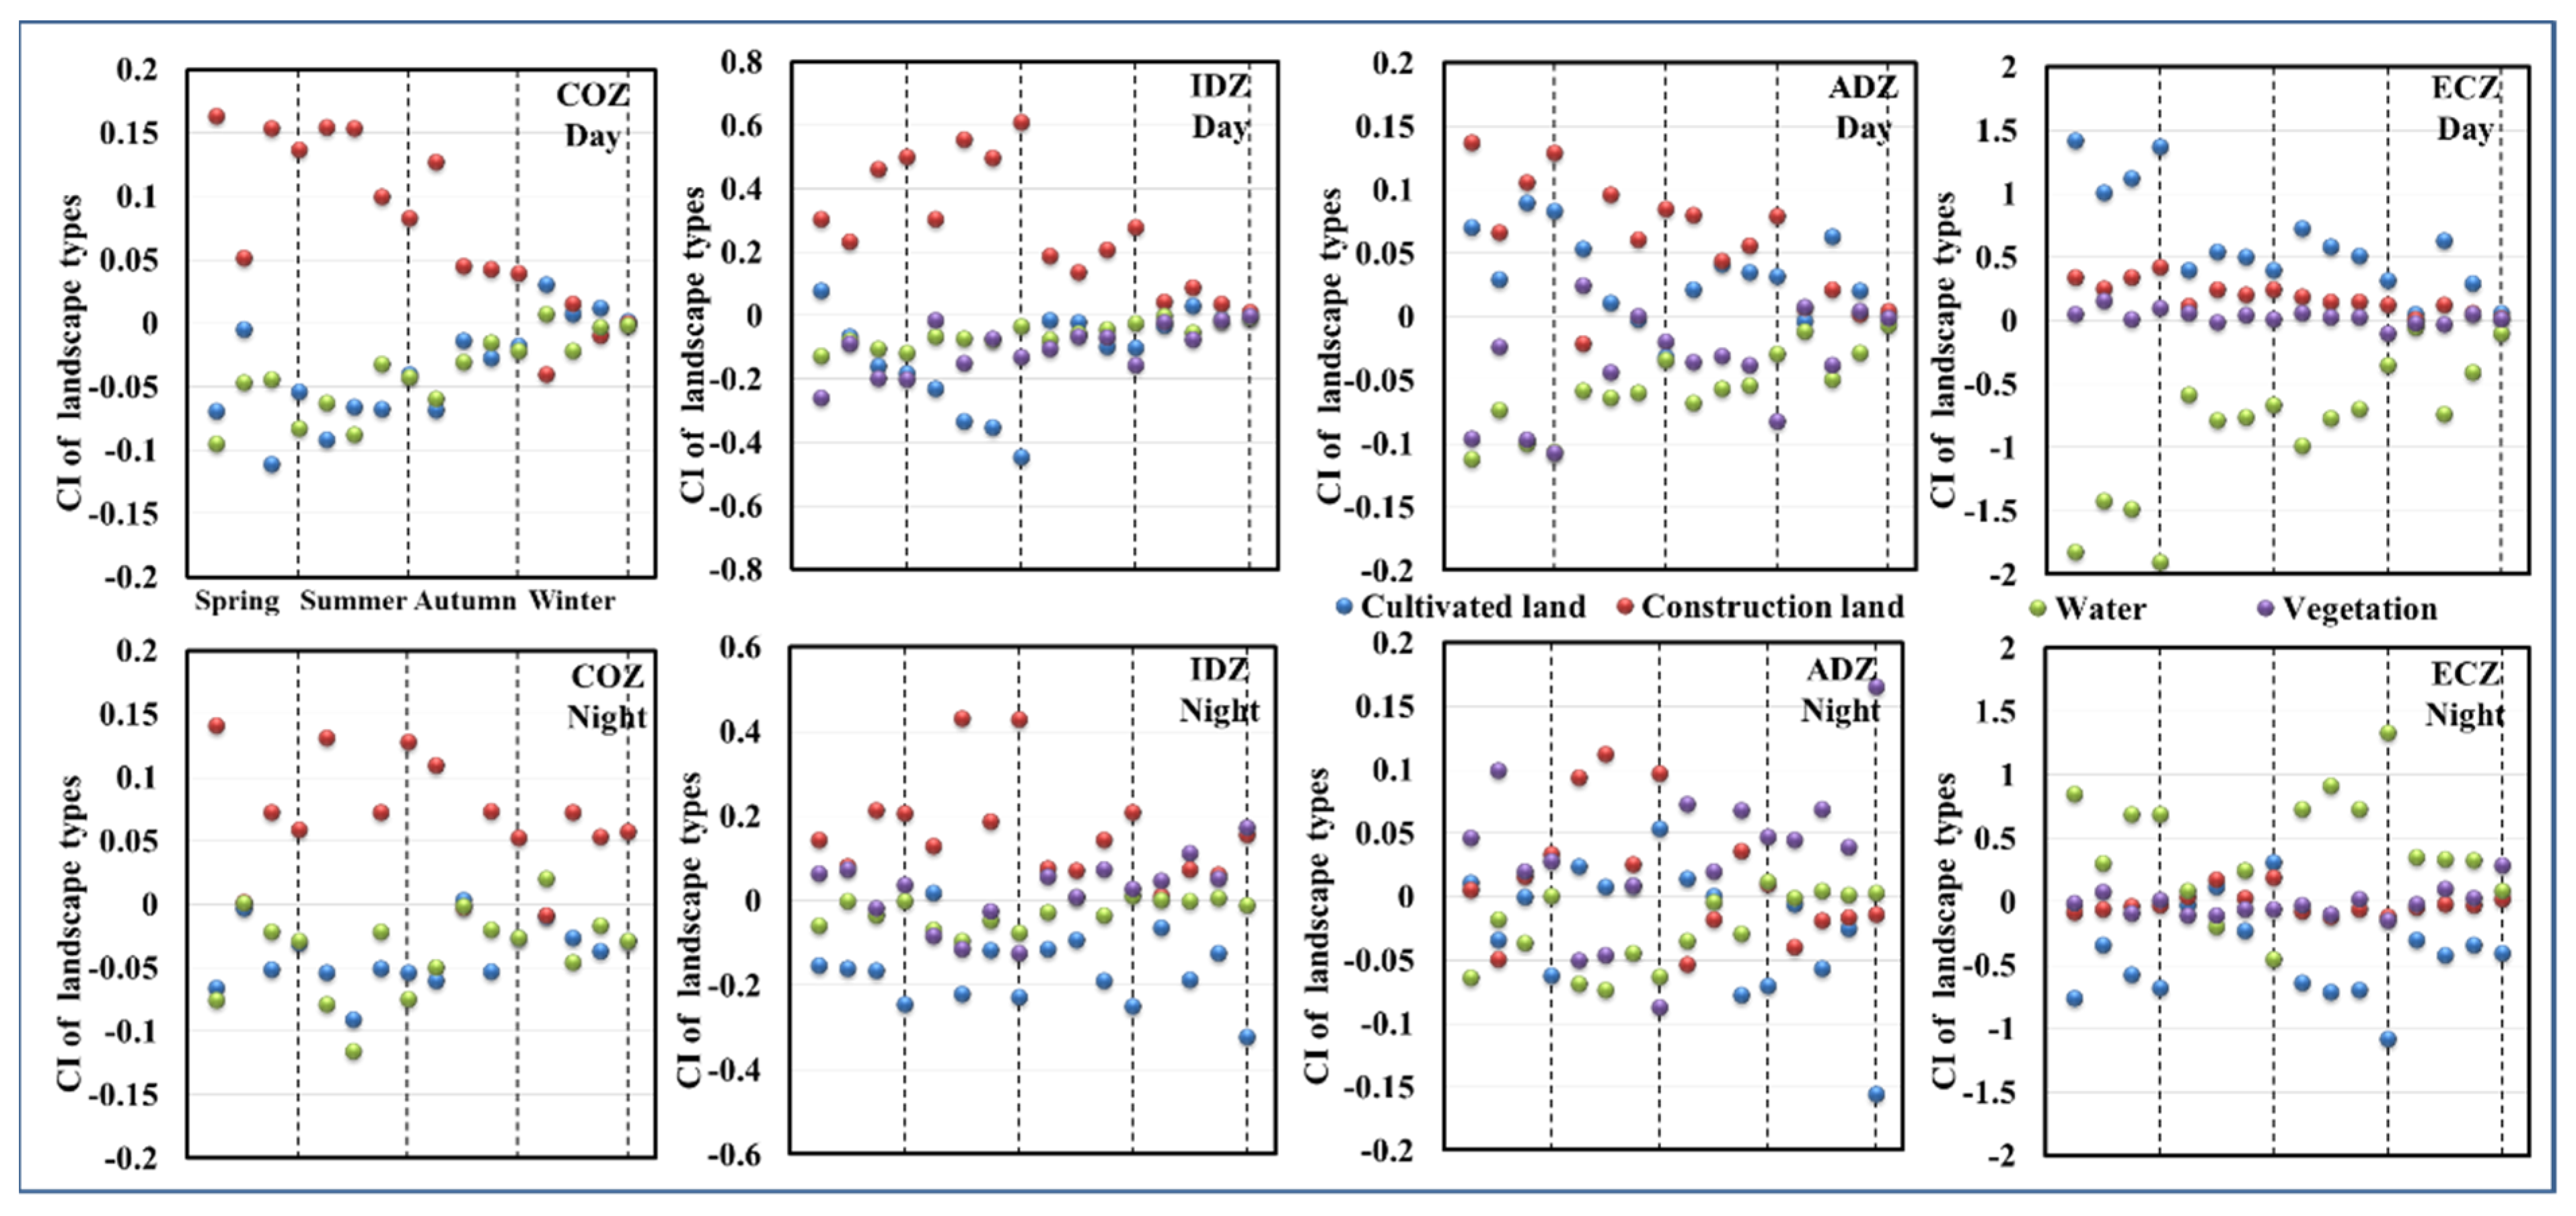
4.3. Contribution of Landscape Types under MFOZ

Overall, the absolute CI values of the landscape types in the IDZ and ECZ were much higher than those in the other functional zones (Figure 9). In the COZ, construction land had a significant positive impact on the thermal environment during the daytime in spring, summer, and autumn. Simultaneously, the cultivated land and water alleviated the regional thermal environment. At night, construction land had a greater positive impact on the four-season regional thermal environment, while cultivated land and water had a negative impact. Overall, the COZ, with construction land as the main source, contributes the most heat to the regional thermal environment during the day and night. Because the zone covers more than 94% of the impervious surface, there is less energy loss when latent heat evaporates.
In the IDZ, regardless of the time of day, construction land played a positive role in the regional thermal environment in all seasons. In particular, construction land contributed the most to the summer regional thermal environment during the daytime, at 0.61. At the same time, the average LST of construction land is more than 0.24 °C higher than the regional average LST. Cultivated land, vegetation, and water play negative roles during the day, particularly in spring and summer. At night, cultivated land played a negative role, and the CI of water and vegetation fluctuated around zero. Cultivated land, vegetation, and water can alleviate this regional thermal environment. The three landscape types have similar contributions to the urban thermal environment, but there are some differences. Because cultivated land is lush in summer and accounts for more than 61% of the area, the cooling effect in summer is the strongest during the daytime.
In the ADZ, cultivated land accounted for approximately 80% of the total area. During the daytime, cultivated and construction land had a positive impact on the regional thermal environment, and the impact of construction land was higher than that of cultivated land. Water and vegetation negatively affect regional thermal environments. At night, the impact of the landscape in different seasons on the regional thermal environment varied greatly, and the regularity was not strong. Cultivated land has a small positive impact in summer but a negative impact at night in other seasons. Vegetation had a positive impact. This is because the thermal inertia of cultivated land is low, and its ability to resist changes in the surface temperature is poor. However, vegetation has high thermal inertia. Therefore, the LST of cultivated land changes significantly during the day and night, and the vegetation maintains a higher temperature at night.
In the ECZ, cultivated land and water play important roles in the regional thermal environment, accounting for approximately 53% and 28% of the total area, respectively. During the day, cultivated land had a positive impact on the regional thermal environment, whereas water had a negative impact. At night, the impacts of cultivated land and water are opposite to those during the daytime. Construction land and vegetation had little impact on the thermal environment because of their small proportions. At night, in summer, the CI of cultivated land and water was close to zero. The seasonal difference was caused by the difference in thermal inertia. Cultivated land was the main contributor to the increase in the regional thermal environment, whereas water was the main source of cooling during the day. At night, the roles of cultivated land and water were opposite to those during the day. This is because the larger specific heat capacity of water slows down the cooling rate at night; therefore, the temperature is higher in water than in other terrains.

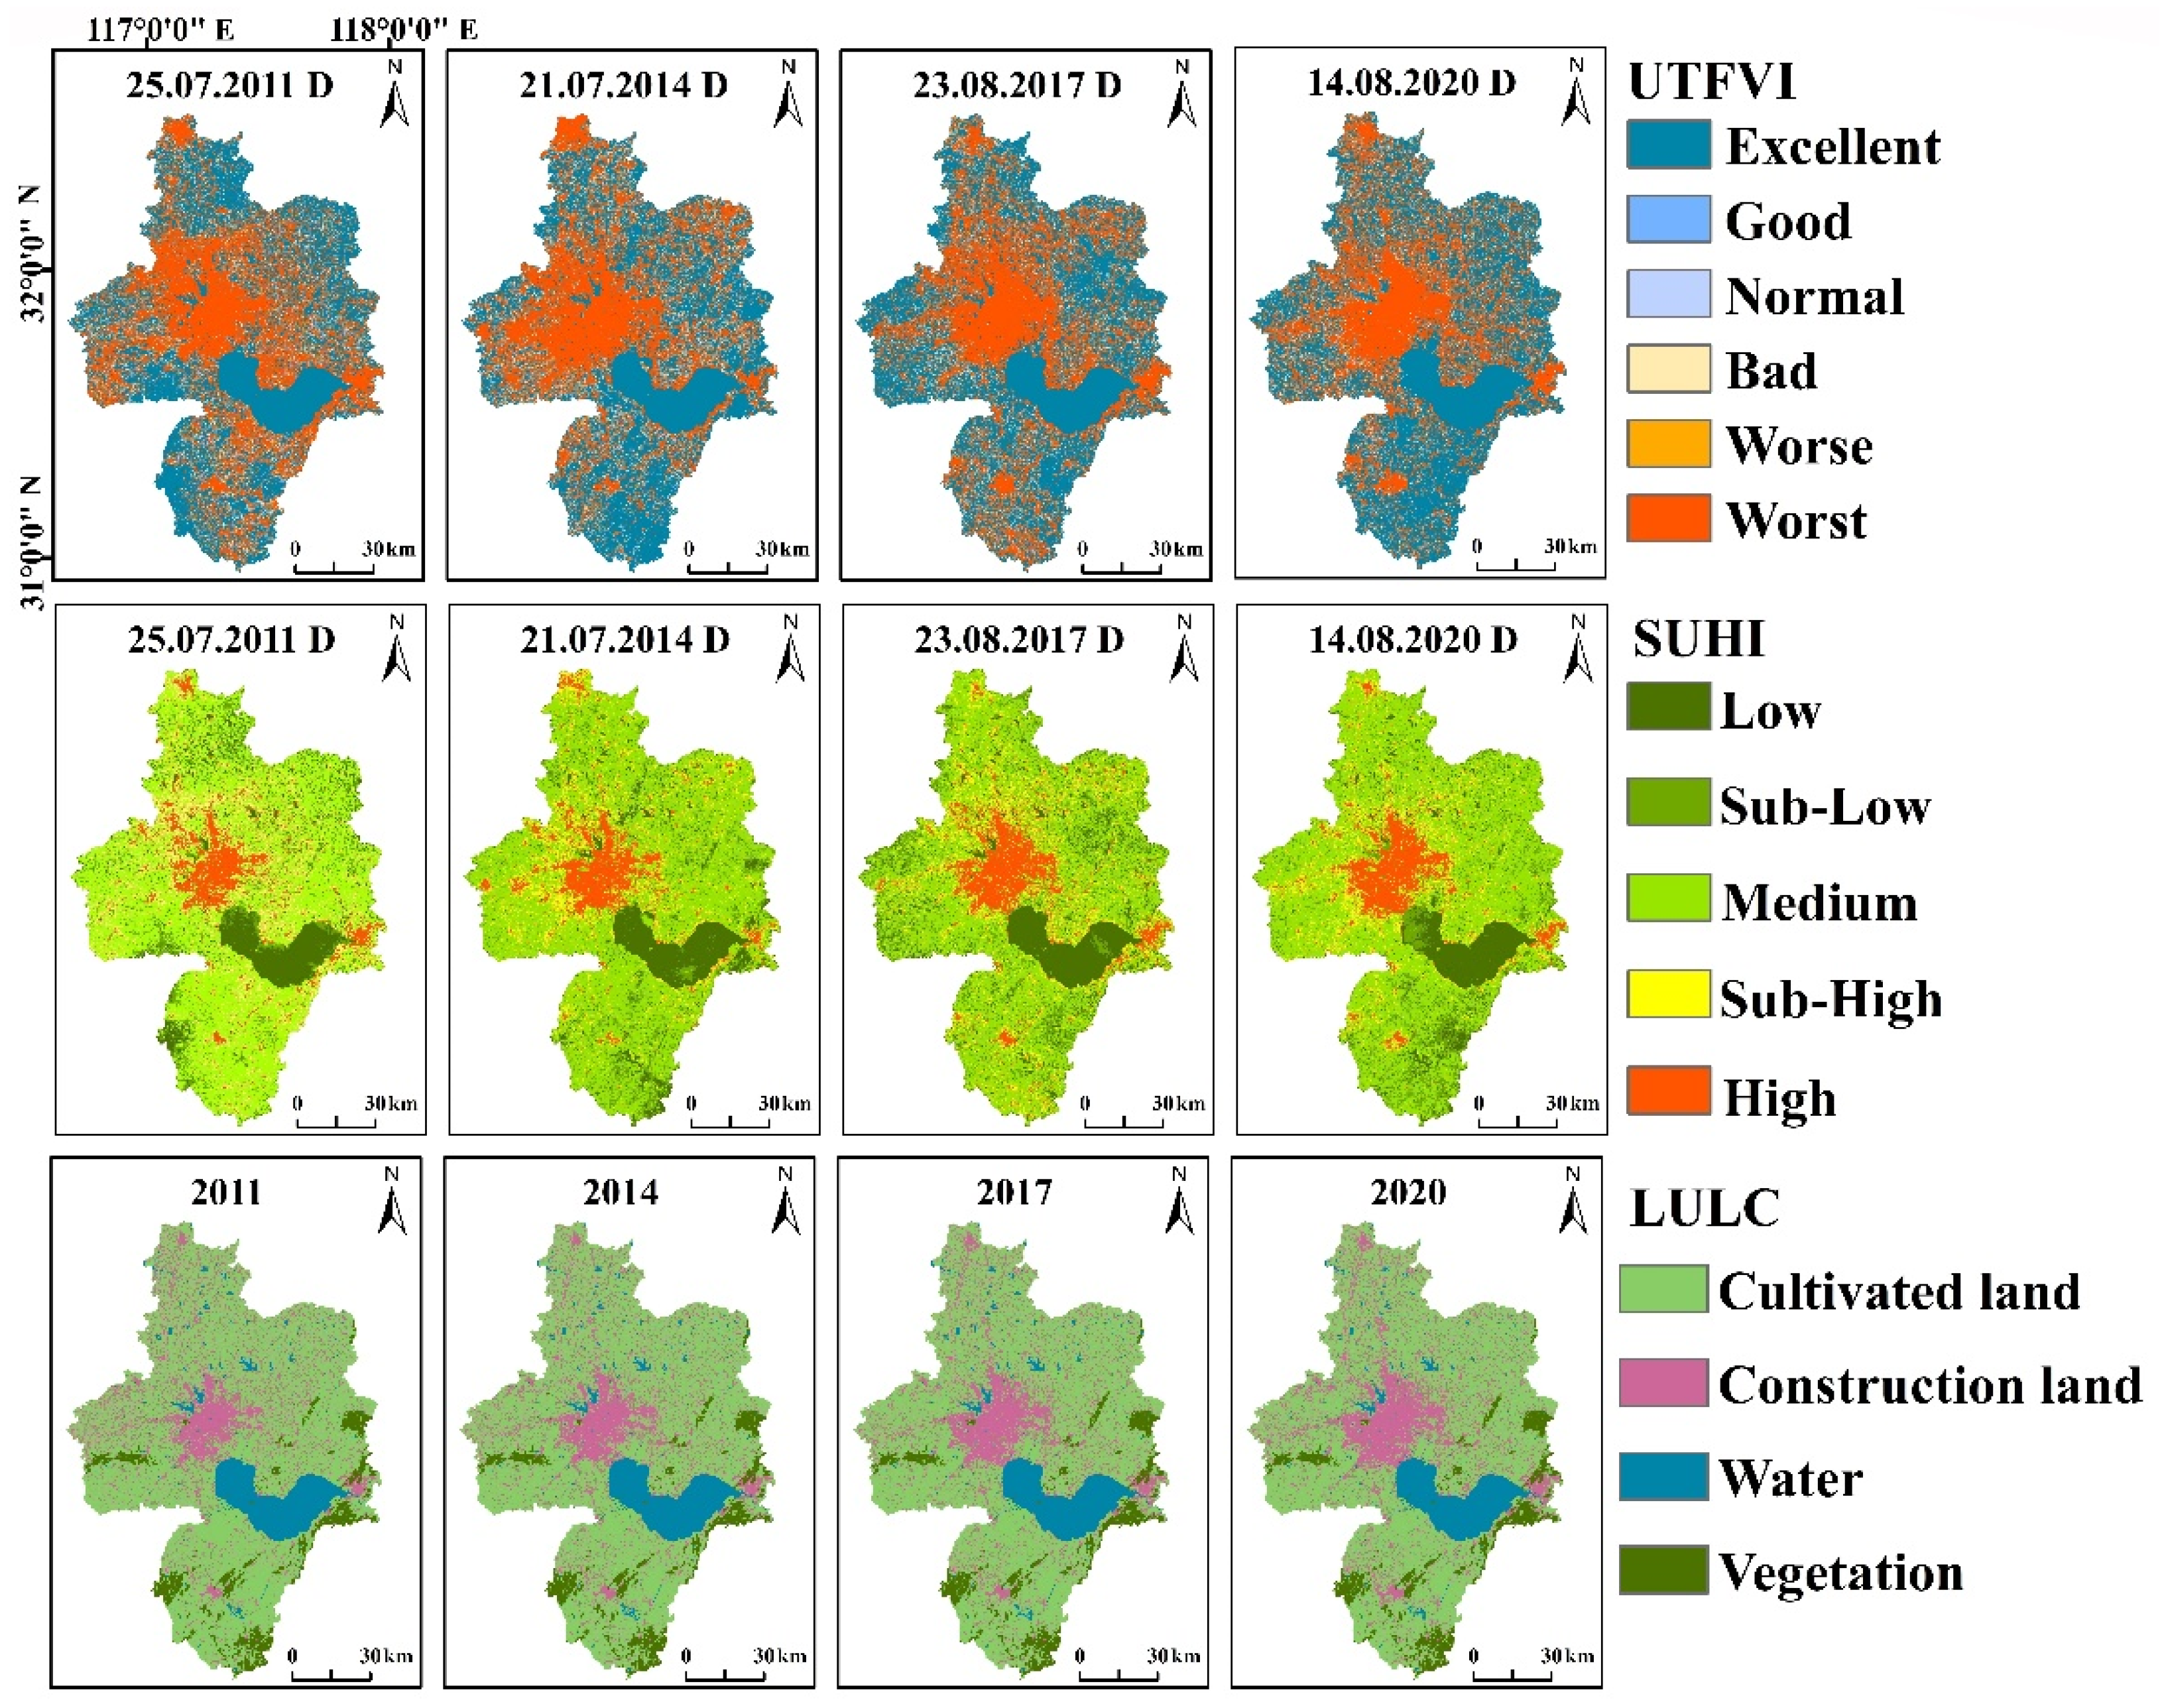
4.4. Estimation of UTFVI

Thermal comfort in the environment is a way for the UTFVI to characterize urban health and ecological quality. In this study, the UTFVI evaluation was conducted in summer during the day when the most obvious heat island effect occurred. According to the analysis in Figure 10, the spatial distribution characteristics of the UTFVI in Hefei were significantly different from those of SUHI and LULC. By comparing and analyzing the distribution of LULC and SUHI in the study area, we found that the spatial distribution pattern of the heat island zone in Hefei is consistent with construction land, whereas the distribution of water, cultivated land, and vegetation corresponds to the non-heat island zone. However, it can be seen from the UTFVI images that there are two extremes in the eco-environmental quality of Hefei: the zones with excellent and the worst ecological evaluation indicators are the most extreme; the zones with good, normal, bad, and worse ecological evaluation indicators are less extreme. The zones with the worst UTFVI were mainly distributed in the COZ and IDZ from 2011 to 2020. The zones with excellent UTFVI were mainly distributed in the ADZ and ECZ. The high coverage of water and vegetation in these zones indicates that they play a role in alleviating the thermal environment and improving the ecological environment. The UTFVI of the Dashu Mountain, Dafangying and Dongpu reservoirs, and Baiyan Lake in the main city zone (Figure 1) are excellent, showing that the large ecological parks in the main city zone have played a role in lowering the temperature, alleviating the urban heat island effect, and improving the ecological environment. Although we can see from the LULC and SUHI images since 2014 that the heat island effects of Chaohu, Changfeng, and Lujiang have not been significant, it can be seen from the UTFVI that these zones are under the worst UTFVI phenomenon, indicating that their ecological environment is gradually deteriorating.
To understand the specific results after the implementation of MFOZ planning (Table 4), we analyzed the characteristics of the ecological indicators in each MFOZ. From 2011 to 2020, the zones with the most severe UTFVI accounted for 39.70%, 37.84%, 38.27%, and 36.72% of Hefei City, respectively, and the zones with excellent UTFVI accounted for 45.20%, 46.89%, 48.49%, and 50.96%, respectively. Overall, the thermal comfort in the environment has improved over the past decade. We further analyzed the UTFVI of each MFOZ and found that thermal comfort was improved for all MFOZs, except the COZ, which decreased thermal comfort. However, because its area percentage was only 1%, its impact on the UTFVI in the study area was not obvious. The analysis of the UTFVI showed that the ecological environment improved to a certain extent after the implementation of MFOZ planning, and the standard of living in cities in the ADZ and ECZ zones was better.

5. Discussion

Monitoring the dynamics of the urban thermal environment in the MFOZ generally requires both high spatial and temporal resolution. It is difficult to monitor the regional thermal environment because of the trade-off between spatial and temporal resolutions. In this study, we first used spatiotemporal reconstruction fusion [41] to obtain multi-time scale LSTs and then combined this with the CI, UTFVI, and landscape patterns to analyze the urban thermal environment and mechanism of the MFOZ.
According to the SUHI results, the fused LST image series at the Landsat scale reveals clear spatial details in the MFOZ, which is of great significance for the accurate classification and dynamic monitoring of the urban thermal environment. A remarkable SUHI core was found in the main city zone of Hefei, and the progress of urbanization can also be recognized. The SUHI have obvious differences, and the differences in the degree of urbanization determine the different characteristics of LST [59]. During the daytime, the zone with dense buildings in the main city zone belongs to the heat island zone, whereas the zones with ecological parks belong to the non-heat island zone. This is because the compact block has a larger proportion of hard ground, absorbs more heat, and has poor ventilation, whereas ecological parks have better air circulation and higher vegetation coverage [60,61]. Both transpiration and shade effects of vegetation during the day help alleviate the heat island effect [6]. Although the surrounding surface temperatures of water and vegetation near or within towns are relatively high, their thermal inertia is high; therefore, their surface temperatures are relatively low [4,54]. At night, areas where buildings are sparse and belong to non-heat island zones expand. This is because the heat island effect is primarily caused by the release of stored heat at night. Areas where buildings are sparse store less heat during the day and have better ventilation conditions; therefore, the cooling rate is faster than in dense areas at night [62]. The results showed that the natural surface area (vegetation and water) interspersing or encircling an area has an obvious cooling effect, which efficiently alleviates the nighttime heat island effect.
According to the results of the CI and UTFVI, the role of each MFOZ can be determined through the analysis of the contribution of different MFOZs to the urban thermal environment. During the daytime, the zones of the COZ, IDZ, and ADZ contributed significantly to the regional thermal environment in different seasons. At night, the COZ and IDZ zones contributed significantly. In general, the COZ and IDZ were the main sources of LST rise. In the ADZ and ECZ, the roles of cultivated land and vegetation change between day and night. During the daytime, cultivated land was the main contributor to regional thermal energy. In contrast, forests had a significant negative effect on regional LST, which was reversed at night. This is because vegetation has higher thermal inertia than cultivated land, causing it to maintain a higher temperature at night [54]. Although the water area is limited, it has high specific heat capacity and stable thermal environment properties, which can effectively isolate the heat island and regulate the temperature in local areas [22]. Large ecological parks effectively cool the surfaces of the COZ and IDZ [54,63]. To find an appropriate balance between sustainable urban development and the increase in urban green space, urban planners should optimize the allocation of green space patches in selected zones by increasing the size of existing green space patches rather than building new small patches [64,65]. In addition, the estimation of UTFVI further revealed zones with high thermal risk in the different MFOZs. Comparing the analysis results of the whole city and different main function zones, we found that research on different main function zones can reveal spatial differences in the influence of different regional factors [47]. For research areas with strong landscape heterogeneity, the study of different MFOZs better reflects the impact of various factors on the thermal environment so that decision-makers can select governance zones when planning policies or dividing the key restoration areas of the thermal environment [32,47].
However, several limitations and constraints should be addressed in future studies. First, many factors affect the LST, such as climate, precipitation, and wind speed. There were differences in LST during the same season or even in the same month. Our study selected only one LST scenario for each month, which may be one-sided. Second, there are certain errors in the LST inversion, reconstruction, fusion, and LULC classification. Third, there are only four land-use types in our study, which leads to less refinement of the role of more land types in the thermal environment. Fourth, the UTFVI is the spatial temperature difference normalized by the average temperature, which strongly depends on the background air temperature and has certain limitations. We acknowledge that these uncertainties limited the accuracy of this study. Nevertheless, our research provides a feasible method for exploring the multi-time scale evolution characteristics and influencing factors of the thermal environment in different MFOZs on a fine scale, fills the knowledge gap in urban thermal environment estimation, and provides a reference for effective planning of MFOZs in the future. In our future work, we will focus on solving the following problems. First, we will continue to increase the density of the Landsat-scale LST and analyze the changes and impacts of the urban thermal environment in different months in the same season or even at different times in the same month. Second, the role of vegetation in the estimation of UTFVI is unclear. In the next stage, we will further refine the study zone and land-use types to better explore their roles in developing a more effective urban planning scheme. Third, we will use a variety of methods to define SUHI and its intensity and explore their differences and accuracy.

6. Conclusions

In this study, Landsat and MODIS data were integrated using spatiotemporal reconstruction and fusion to derive high spatiotemporal resolution data, which were used to capture accurate fine-spatial resolution details. By analyzing the diurnal and seasonal CI of different landscape types under the MFOZ, we determined the role of each MFOZ in the thermal environment, and the landscape components in different MFOZs directly determined the heat absorption and heat release processes, especially in the COZ and IDZ. The estimation of UTFVI further revealed that the COZ and IDZ are zones with high thermal risk. For the entire study area, the thermal environment was alleviated after the implementation of MFOZ planning, among which the planning results of the ADZ and ECZ were relatively obvious. Therefore, to alleviate the heat island effect of different MFOZs, urban forests, ecological parks, and artificial lakes should be centrally planned at a certain scale in the COZ and IDZ to break up continuous and concentrated construction land. Protective measures should be taken for the original forestland, lakes, rivers, and other water in the ADZ and ECZ, and the expansion and infiltration of construction land to cultivated land should be restricted to maintain its role in regulating temperature. Although the study results were derived from Hefei, the methodology illustrated here can be readily applied to many other cities to explore whether the urban thermal environment is related to different geographical environments and development models.

Author Contributions

Conceptualization, Y.L. and P.W.; methodology, Y.L. and P.W.; formal analysis, Y.L., K.X., and P.W.; investigation, Y.L.; resources, Y.L. and P.W.; data curation, Y.L.; writing—original draft preparation, Y.L.; writing—review and editing, K.X. and P.W.; visualization, Y.L. All authors have read and agreed to the published version of the manuscript.

Funding

This research was funded by the National Natural Science Foundation of China (grant number 41501376) and the Science and Technology Major Project of Anhui Province (grant number 201903a07020014).

Institutional Review Board Statement

Not applicable.

Informed Consent Statement

Not applicable.

Data Availability Statement

Not applicable.

Acknowledgments

The authors would like to thank the data providers of the USGS and the International Scientific and Technical Data Mirror Site, Computer Network Information Center, and Chinese Academy of Sciences.

Conflicts of Interest

The authors declare no conflict of interest.

References

  1. Xia, H.; Zhang, W.; He, L.; Ma, M.; Wang, X. Assessment on china’s urbanization after the implementation of main functional areas planning. J. Environ. Manag. 2020, 264, 110381. [Google Scholar] [CrossRef] [PubMed]
  2. Lu, Y.; Coops, N.C.; Hermosilla, T. Estimating urban vegetation fraction across 25 cities in pan-Pacific using Landsat time series data. ISPRS J. Photogramm. Remote Sens. 2017, 126, 11–23. [Google Scholar] [CrossRef]
  3. Gx, A.; Hua, S.B.; Qiang, Z.B.; Ra, A.; Kg, C.; Zw, D. Monitoring and characterizing multi-decadal variations of urban thermal condition using time-series thermal remote sensing and dynamic land cover data. Remote Sens. Environ. 2021, 269, 112803. [Google Scholar]
  4. Arnfield, A.J. Two decades of urban climate research: A review of turbulence, exchanges of energy and water, and the urban heat island. Int. J. Clim. 2003, 23, 1–26. [Google Scholar] [CrossRef]
  5. Howard, L. The Climate of London; London, UK, 1833; Volume I–III, Available online: https://books.google.com.hk/books/about/The_Climate_of_London.html?id=L0g0AQAAMAAJ&redir_esc=y (accessed on 28 March 2022).
  6. Weng, Q.; Lu, D.; Schubring, J. Estimation of land surface temperature–vegetation abundance relationship for urban heat island studies. Remote Sens. Environ. 2004, 89, 467–483. [Google Scholar] [CrossRef]
  7. Yusuf, Y.A.; Pradhan, B.; Idrees, M.O. Spatio-temporal Assessment of Urban Heat Island Effects in Kuala Lumpur Metropolitan City Using Landsat Images. J. Indian Soc. Remote Sens. 2014, 42, 829–837. [Google Scholar] [CrossRef]
  8. Ogashawara, I.; Bastos, V.D.B. A Quantitative Approach for Analyzing the Relationship between Urban Heat Islands and Land Cover. Remote Sens. 2012, 4, 3596–3618. [Google Scholar] [CrossRef] [Green Version]
  9. Peng, J.; Jia, J.; Liu, Y.; Li, H.; Wu, J. Seasonal contrast of the dominant factors for spatial distribution of land surface temperature in urban areas. Remote Sens. Environ. 2018, 215, 255–267. [Google Scholar] [CrossRef]
  10. Zhan, W.; Ju, W.; Hai, S.; Ferguson, G.; Quan, J.; Tang, C.; Guo, Z.; Kong, F. Satellite-Derived Subsurface Urban Heat Island. Environ. Sci. Technol. 2014, 48, 12134–12140. [Google Scholar] [CrossRef]
  11. Wang, Y.; Ren, Y.; Song, L.; Xiang, Y. Responses of extreme high temperatures to urbanization in the Beijing–Tianjin–Hebei urban agglomeration in the context of a changing climate. Meteorol. Appl. 2021, 28, e2024. [Google Scholar] [CrossRef]
  12. Stewart, I.D. A systematic review and scientific critique of methodology in modern urban heat island literature. Int. J. Clim. 2011, 31, 200–217. [Google Scholar] [CrossRef]
  13. Chakraborty, T.; Lee, X.; Ermida, S.L.; Zhan, W. On the land emissivity assumption and Landsat-derived surface urban heat islands: A global analysis. Remote Sens. Environ. 2021, 265, 112682. [Google Scholar] [CrossRef]
  14. Wu, P.; Yin, Z.; Zeng, C.; Duan, S.-B.; Gottsche, F.-M.; Li, X.; Ma, X.; Yang, H.; Shen, H. Spatially Continuous and High-Resolution Land Surface Temperature Product Generation: A review of reconstruction and spatiotemporal fusion techniques. IEEE Geosci. Remote Sens. Mag. 2021, 9, 112–137. [Google Scholar] [CrossRef]
  15. Li, Z.; Tang, B.; Wu, H.; Ren, H.; Yan, G.; Wan, Z.; Trigo, I.F.; Sobrino, J.A. Satellite-derived land surface temperature: Current status and perspectives. Remote Sens. Environ. 2013, 131, 14–37. [Google Scholar] [CrossRef] [Green Version]
  16. Zhou, D.; Xiao, J.; Bonafoni, S.; Berger, C.; Deilami, K.; Zhou, Y.; Frolking, S.; Yao, R.; Qiao, Z.; Sobrino, J. Satellite Remote Sensing of Surface Urban Heat Islands: Progress, Challenges, and Perspectives. Remote Sens. 2019, 11, 48. [Google Scholar] [CrossRef] [Green Version]
  17. Li, X.; Li, W.; Middel, A.; Harlan, S.L.; Brazel, A.J.; Turner II, B.L. Remote sensing of the surface urban heat island and land architecture in Phoenix, Arizona: Combined effects of land composition and configuration and cadastral–demographic–economic factors. Remote Sens. Environ. 2016, 174, 233–243. [Google Scholar] [CrossRef] [Green Version]
  18. Streutker, D.R. A remote sensing study of the urban heat island of Houston, Texas. Int. J. Remote Sens. 2002, 23, 2595–2608. [Google Scholar] [CrossRef]
  19. Unger, J. Intra-urban relationship between surface geometry and urban heat island: Review and new approach. Clim. Res. 2004, 27, 253–264. [Google Scholar] [CrossRef] [Green Version]
  20. Chow, W.T.L.; Chuang, W.; Gober, P. Vulnerability to Extreme Heat in Metropolitan Phoenix: Spatial, Temporal, and Demographic Dimensions. Prof. Geogr. 2012, 64, 286–302. [Google Scholar] [CrossRef]
  21. Nichol, J.E. High-Resolution Surface Temperature Patterns Related to Urban Morphology in a Tropical City: A Satellite-Based Study. J. Appl. Meteorol. 1996, 35, 135–146. [Google Scholar] [CrossRef] [Green Version]
  22. Carmona, P.L.; Tran, D.X.; Pla, F.; Myint, S.W.; Kieu, H.V. Characterizing the relationship between land use land cover change and land surface temperature. ISPRS J. Photogramm. Remote Sens. 2017, 124, 119–132. [Google Scholar] [CrossRef] [Green Version]
  23. Anniballe, R.; Bonafoni, S.; Pichierri, M. Spatial and temporal trends of the surface and air heat island over Milan using MODIS data. Remote Sens. Environ. 2014, 150, 163–171. [Google Scholar] [CrossRef]
  24. Liu, H.; Huang, B.; Gao, S.; Wang, J.; Yang, C.; Li, R. Impacts of the evolving urban development on intra-urban surface thermal environment: Evidence from 323 Chinese cities. Sci. Total Environ. 2021, 771, 144810. [Google Scholar] [CrossRef]
  25. Estoque, R.C.; Murayama, Y. Monitoring surface urban heat island formation in a tropical mountain city using Landsat data (1987–2015). ISPRS J. Photogramm. Remote Sens. 2017, 133, 18–29. [Google Scholar] [CrossRef]
  26. Hong, J.W.; Hong, J.; Kwon, E.E.; Yoon, D.K. Temporal dynamics of urban heat island correlated with the socio-economic development over the past half-century in Seoul, Korea. Environ. Pollut. 2019, 254, 112934. [Google Scholar] [CrossRef]
  27. Unger, J.; Sümeghy, Z.; Gulyás, Á.; Zsolt, B.; Mucsi, L. Land-use and meteorological aspects of the urban heat island. Meteorol. Appl. 2010, 8, 189–194. [Google Scholar] [CrossRef] [Green Version]
  28. Connors, J.P.; Galletti, C.S.; Chow, W.T.L. Landscape configuration and urban heat island effects: Assessing the relationship between landscape characteristics and land surface temperature in Phoenix, Arizona. Landsc. Ecol. 2013, 28, 271–283. [Google Scholar] [CrossRef]
  29. Li, X.; Zhou, W.; Quyang, W.; Zheng, H. Spatial pattern of green space affects land surface temperature: Evidence from the heavily urbanized Beijing metropolitan area China. Landsc. Ecol. 2012, 27, 887–898. [Google Scholar] [CrossRef]
  30. Turner, B.L.; Janetos, A.C., II; Verburg, P.H.; Murray, A.T. Land system architecture: Using land systems to adapt and mitigate global environmental change. Glob. Environ. Change 2013, 23, 395–397. [Google Scholar] [CrossRef]
  31. Xia, H.; Chen, Y.; Song, C.; Li, J.; Quan, J.; Zhou, G. Analysis of surface urban heat islands based on local climate zones via spatiotemporally enhanced land surface temperature. Remote Sens. Environ. 2022, 273, 112972. [Google Scholar] [CrossRef]
  32. Huang, X.; Wang, Y. Investigating the effects of 3D urban morphology on the surface urban heat island effect in urban functional zones by using high-resolution remote sensing data: A case study of Wuhan, Central China. ISPRS J. Photogramm. Remote Sens. 2019, 152, 119–131. [Google Scholar] [CrossRef]
  33. Feyisa, G.L.; Meilby, H.; Jenerette, G.D.; Pauleit, S. Locally optimized separability enhancement indices for urban land cover mapping: Exploring thermal environmental consequences of rapid urbanization in Addis Ababa, Ethiopia. Remote Sens. Environ. 2016, 175, 14–31. [Google Scholar] [CrossRef]
  34. Zhao, L.; Li, X.; Chai, X. Influencing Factors and Quality Evaluation of Urban Thermal Environment Based on Artificial Neural Network. Int. J. Heat Technol. 2021, 39, 128–136. [Google Scholar] [CrossRef]
  35. Ye, H.; Li, Z.; Zhang, N.; Leng, X.; Meng, D.; Zheng, J.; Li, Y. Variations in the Effects of Landscape Patterns on the Urban Thermal Environment during Rapid Urbanization (1990–2020) in Megacities. Remote Sens. 2021, 13, 3415. [Google Scholar] [CrossRef]
  36. Yin, Z.; Wu, P.; Foody, G.M.; Wu, Y.; Liu, Z.; Du, Y.; Ling, F. Spatiotemporal Fusion of Land Surface Temperature Based on a Convolutional Neural Network. IEEE Trans. Geosci. Remote. Sens. 2020, 99, 1–15. [Google Scholar] [CrossRef]
  37. Wu, P.; Shen, H.; Zhang, L.; Göttsche, F.-M. Integrated fusion of multi-scale polar-orbiting and geostationary satellite observations for the mapping of high spatial and temporal resolution land surface temperature. Remote Sens. Environ. 2015, 156, 169–181. [Google Scholar] [CrossRef]
  38. Xu, S. An approach to analyzing the intensity of the daytime surface urban heat island effect at a local scale. Environ. Monit. Assess. 2008, 151, 289–300. [Google Scholar] [CrossRef]
  39. Zhi, Q.; Tian, G.; Lin, X. Diurnal and seasonal impacts of urbanization on the urban thermal environment: A case study of Beijing using MODIS data. ISPRS J. Photogramm. Remote Sens. 2013, 85, 93–101. [Google Scholar]
  40. Coutts, A.M.; Harris, R.J.; Phan, T.; Livesley, S.J.; Williams, N.; Tapper, N.J. Thermal infrared remote sensing of urban heat: Hotspots, vegetation, and an assessment of techniques for use in urban planning. Remote Sens. Environ. 2016, 186, 637–651. [Google Scholar] [CrossRef]
  41. Lu, Y.; Wu, P.; Ma, X.; Yang, H.; Wu, Y. Monitoring Seasonal and Diurnal Surface Urban Heat Islands Variations Using Landsat-Scale Data in Hefei, China, 2000–2017. IEEE J. Sel. Top. Appl. Earth Obs. Remote Sens. 2020, 13, 6410–6423. [Google Scholar] [CrossRef]
  42. Lee, C.H.; Zhao, J.L.; Hassna, G. Government-incentivized crowd funding for one-belt, one-road enterprises: Design and research issues. Financ. Innov. 2016, 2, 2. [Google Scholar] [CrossRef] [Green Version]
  43. Jin, G.; Deng, X.; Zhao, X.; Guo, B.; Yang, J. Spatiotemporal patterns in urbanization efficiency within the Yangtze River Economic Belt between 2005 and 2014. J. Geogr. ENCES 2018, 28, 1113–1126. [Google Scholar] [CrossRef] [Green Version]
  44. Yu, X.; Guo, X.; Wu, Z. Land surface temperature retrieval from Landsat 8 TIRS-Comparison between radiative transfer equation-based method, split window algorithm and single channel method. Remote Sens. 2014, 6, 9829–9852. [Google Scholar] [CrossRef] [Green Version]
  45. Qin, Z.H.; Li, W.J.; Zhang, M.H.; Karnieli, A.; Berliner, P. Mono-window algorithm for retrieving land surface temperature from Landsat TM6 data. Acta Geogr. Sin. 2001, 68, 456–466. [Google Scholar]
  46. Quan, J.; Chen, Y.; Zhan, W.; Wang, J.; Voogt, J.; Wang, M. Multi-temporal trajectory of the urban heat island centroid in Beijing, China based on a Gaussian volume model. Remote Sens. Environ. 2014, 149, 33–46. [Google Scholar] [CrossRef]
  47. Firozjaei, M.K.; Kiavarz, M.; Alavipanah, S.K.; Lakes, T.; Qureshi, S. Monitoring and forecasting heat island intensity through multi-temporal image analysis and cellular automata-Markov chain modelling: A case of Babol city, Iran. Ecol. Indic. 2018, 91, 155–170. [Google Scholar] [CrossRef]
  48. Bao, T.; Li, X.; Zhang, J.; Zhang, Y.; Tian, S. Assessing the Distribution of Urban Green Spaces and its Anisotropic Cooling Distance on Urban Heat Island Pattern in Baotou, China. ISPRS Int. J. Geo-Inf. 2016, 5, 12. [Google Scholar] [CrossRef]
  49. Yao, Y.; Chen, X.; Qian, J.; Felix, N. Seasonal variations of the urban thermal environment effect in a tropical coastal city. Adv. Meteorol. 2017, 1, 1–18. [Google Scholar]
  50. Sun, R.; Xie, W.; Chen, L. A landscape connectivity model to quantify contributions of heat sources and sinks in urban regions. Landsc. Urban Plan. 2018, 178, 43–50. [Google Scholar] [CrossRef]
  51. Zhang, Y.; Yu, T.; Gu, X. Land surface temperature retrieval from cbers-02 IRMSS thermal infrared data and its applications in quantitative analysis of urban heat island effect. J. Remote Sens. 2006, 10, 789–797. [Google Scholar]
  52. Mnhna, B.; Aakc, D. Assessment of urban thermal field variance index and defining the relationship between land cover and surface temperature in Chattogram city: A remote sensing and statistical approach-Science Direct. Environ. Chall. 2021, 4, 100107. [Google Scholar]
  53. Majumder, A.; Setia, R.; Kingra, P.K.; Sembhi, H.; Singh, S.P.; Pateriya, B. Estimation of land surface temperature using different retrieval methods for studying the spatiotemporal variations of surface urban heat and cold islands in Indian Punjab. Environ. Dev. Sustain. 2021, 23, 15921–15942. [Google Scholar] [CrossRef]
  54. Peng, J.; Ma, J.; Liu, Q.; Liu, Y.; Hu, Y.; Li, Y.; Yue, Y. Spatial-temporal change of land surface temperature across 285 cities in China: An urban-rural contrast perspective. Sci. Total Environ. 2018, 635, 487–497. [Google Scholar] [CrossRef]
  55. Wang, C.; Myint, S.W.; Wang, Z.; Song, J. Spatio-Temporal Modeling of the Urban Heat Island in the Phoenix Metropolitan Area: Land Use Change Implications. Remote Sens. 2016, 8, 185. [Google Scholar] [CrossRef] [Green Version]
  56. Zhou, D.; Zhao, S.; Liu, S.; Zhang, L. Spatiotemporal trends of terrestrial vegetation activity along the urban development intensity gradient in china’s 32 major cities. Sci. Total Environ. 2014, 488–489, 136–145. [Google Scholar] [CrossRef]
  57. Yonaba, R.; Koïta, M.; Mounirou, L.A.; Tazen, F.; Queloz, P.; Biaou, A.; Niang, D.; Zouré, C.; Karambiri, H.; Yacouba, H. Spatial and transient modelling of land use/land cover (LULC) dynamics in a Sahelian landscape under semi-arid climate in northern Burkina Faso. Land Use Policy 2021, 103, 105305. [Google Scholar] [CrossRef]
  58. Gupta, Srimanta. Land Use/Land Cover classification of an urban area—A case study of Burdwan Municipality, India. Int. J. Geomat. Geosci. 2012, 2, 1014–1026. [Google Scholar]
  59. Ramaiah, M.; Avtar, R.; Rahman, M.M. Land Cover Influences on LST in Two Proposed Smart Cities of India: Comparative Analysis Using Spectral Indices. Land 2020, 9, 292. [Google Scholar] [CrossRef]
  60. Yin, C.; Yuan, M.; Lu, Y.; Huang, Y.; Liu, Y. Effects of urban form on the urban heat island effect based on spatial regression model. Sci. Total Environ. 2018, 634, 696–704. [Google Scholar] [CrossRef]
  61. Stewart, I.; Oke, T. Thermal differentiation of local climate zones using temperature observations from urban and rural field sites. In Proceedings of the Ninth Symposium on the Urban Environment, Keystone, CO, USA, 2–6 August 2010. [Google Scholar]
  62. Chen, X.; Xu, Y.; Yang, J.; Wu, Z.; Zhu, H. Remote sensing of urban thermal environments within local climate zones: A case study of two high-density subtropical Chinese cities—ScienceDirect. Urban Clim. 2020, 31, 100568. [Google Scholar] [CrossRef]
  63. Mariani, L.; Parisi, S.G.; Cola, G.; Lafortezza, R.; Colangelo, G.; Sanesi, G. Climatological analysis of the mitigating effect of vegetation on the urban heat island of Milan, Italy. Sci. Total Environ. 2016, 569–570, 762–773. [Google Scholar] [CrossRef] [PubMed]
  64. Peng, J.; Dan, Y.; Qiao, R.; Liu, Y.; Dong, J.; Wu, J. How to quantify the cooling effect of urban parks? Linking maximum and accumulation perspectives. Remote Sens. Environ. 2020, 252, 112135. [Google Scholar] [CrossRef]
  65. Algretawee, H.; Rayburg, S.; Neave, M. Estimating the effect of park proximity to the central of Melbourne city on Urban Heat Island (UHI) relative to Land Surface Temperature (LST). Ecol. Eng. 2019, 138, 374–390. [Google Scholar] [CrossRef]
Figure 1. Map of the study area (COZ: core optimization zone; IDZ: new-type urbanization and industrialization cluster development zone; ADZ: agricultural development zone; ECZ: ecological conservation zone).
Land 11 00711 g001
Figure 2. Flow chart of the research method.
Land 11 00711 g002
Figure 3. The images of SUHI in different seasons during day and night from 2011 to 2020 (D: day; N: night. Sp, Su, Au, and Wi represent spring, summer, autumn, and winter, respectively. Owing to the length of the article and the mapping effect, the images of SUHI are selected every two years, and those presented here are from 2012, 2014, 2016, 2018, and 2020).
Land 11 00711 g003
Figure 4. The area ratio of each temperature level zone from 2011 to 2020 ((a,b) are the area ratios of temperature zones during daytime and nighttime in different years, respectively; (c,d) are the area ratios of temperature zones during daytime and nighttime in different seasons, respectively).
Land 11 00711 g004
Figure 5. Diurnal and seasonal SUHII of Hefei from 2011 to 2020 ((a,b) are the SUHII during daytime and nighttime in different years, respectively; (c,d) are the SUHII during daytime and nighttime in different years under the excluded water, respectively).
Land 11 00711 g005
Figure 6. The area percentage of landscape types under MFOZ from 2011 to 2020.
Land 11 00711 g006
Figure 7. The average LST of MFOZ from 2011 to 2020 ((a,b) are the average temperature of MFOZ during daytime and nighttime in different years, respectively; (c,d) are the average temperature of MFOZ during daytime and nighttime in different seasons, respectively).
Land 11 00711 g007
Figure 8. The CI of the MFOZ to the urban thermal environment from 2011 to 2020 ((a,b) are the CI of MFOZ during daytime and nighttime in different years, respectively; (c,d) are the CI of MFOZ during daytime and nighttime in different seasons, respectively).
Land 11 00711 g008
Figure 9. The CI of different landscape types under four MFOZs in 2011, 2014, 2017, and 2020 (There is almost no vegetation of 30 × 30 m in the COZ zone).
Land 11 00711 g009
Figure 10. Images of UTFVI, SUHI, and LULC for 2011, 2014, 2017, and 2020.
Land 11 00711 g010
Table 1. Data used in the study (The dates of the fusion data are marked in red).
DataDates
Landsat-523 April 2011
Landsat-78 October 201111 December 20111 April 201211 November 201230 November 201317 January 20145 February 201512 May 2015
6 November 20168 December 201611 October 201815 November 2019
Landsat-814 May 201314 March 201424 October 201427 October 201515 January 201627 March 201625 July 201623 April 2017
1 November 201719 December 201710 April 201823 January 201912 March 201915 April 202024 October 202012 January 2021
MODIS23 April 201129 July 20118 October 201111 December 20111 April 201231 July 201211 November 20124 December 2012
14 May 201313 July 201330 November 201317 January 201414 March 201421 July 201424 October 20145 February 2015
12 May 20154 August 201527 October 201515 January 201627 March 201625 July 20166 November 20168 December 2016
23 April 201723 August 20171 November 201719 December 201710 April 201814 July 201811 October 201823 January 2019
12 March 201913 August 201915 November 201922 February 202015 April 202014 August 202024 October 202012 January 2021
Table 2. The classification of the surface temperature and the used formula (Ts is the zone of different temperature levels, μ is the average temperature of the study area, and std is the standard deviation of the LST in the study area).
LevelsFormula
HighTs > μ + std
Sub-Highμ + 0.5 std < Ts ≤ μ + std
Mediumμ − 0.5 std < Ts ≤ μ + 0.5 std
Sub-Lowμ − std < Ts ≤ μ − 0.5 std
LowTs < μ − std
Table 3. Classification of the ecological evaluation index.
UTFVIEcological Evaluation Index
<0.000Excellent
0.000–0.005Good
0.005–0.010Normal
0.010–0.015Bad
0.015–0.020Worse
>0.020Worst
Table 4. The area percentage of UTFVI of each MFOZ from 2011 to 2020.
COZIDZADZECZStudy Area COZIDZADZECZStudy Area
2011Excellent1.1334.6554.2154.2445.202014Excellent1.4437.8049.7560.0246.89
Good0.113.864.483.073.81Good0.133.554.983.663.96
Normal0.173.974.532.993.86Normal0.183.514.973.703.94
Bad0.273.884.253.183.78Bad0.203.424.813.413.78
Worse0.273.903.853.093.65Worse0.233.364.403.233.59
Worst98.0649.7428.6933.4239.70Worst97.8248.3731.0925.9737.84
2017Excellent0.4236.8556.5860.7848.492020Excellent0.1438.8959.5063.6650.96
Good0.113.284.052.773.33Good0.023.163.702.623.14
Normal0.113.393.922.793.36Normal0.043.213.762.483.14
Bad0.033.393.782.903.34Bad0.083.183.652.493.10
Worse0.083.343.562.723.21Worse0.083.193.162.402.94
Worst99.2549.7528.1228.0438.27Worst99.6448.3726.2326.3536.72
Publisher’s Note: MDPI stays neutral with regard to jurisdictional claims in published maps and institutional affiliations.

