Article

Spatiotemporal Evolution of Crop Planting Structure in the Black Soil Region of Northeast China: A Case Study in Hailun County

1
School of Public Administration and Law, Northeast Agricultural University, Harbin 150030, China
2
School of Economics and Management, Northeast Agricultural University, Harbin 150030, China
3
School of Public Administration, China University of Geosciences, Wuhan 430074, China
*
Author to whom correspondence should be addressed.
These authors contributed equally to this work.
Land 2022, 11(6), 785; https://doi.org/10.3390/land11060785
Submission received: 20 April 2022 / Revised: 22 May 2022 / Accepted: 24 May 2022 / Published: 26 May 2022
(This article belongs to the Special Issue Rural Land Use in China)

Abstract

:
Detailed characteristics of crop planting structure (CPS) evolution can inform the optimization of the crop yield proportion in the black soil region of Northeast China (BSRNC). Choosing Hailun County as an example, this study sought to analyze the geographic characteristics of CPS evolution from 2000 to 2020. Our analysis produced new spatiotemporal information based on the remote-sensing interpretation data, namely, Landsat4-5 TM, Landsat7 ETM+, and Landsat8 OLI images. The study characterized the temporal and spatial dynamics of CPS. Our results showed the following: (1) Soybean and maize were the main crops, with a total land area of 70%; they alternated as the most dominant crop. (2) The distribution breadth and aggregation intensity of soybean and maize were spatially complementary; rice had the smallest distribution range but strong water aggregation. (3) The evolution pattern of CPS was the interconversion between a single type of soybean and maize. Our results indicate that the future CPS adjustment of BSRNC needs to consider the county-level optimization of crop area proportion and crop spatial distribution. This context has excellent implications in geographically informing policymaking to adjust county-level CPS of BSRNC, thus safeguarding food security.

1. Introduction

Recently, diet shifts have threatened global food security [1]. As the Food and Agriculture Organization of the United Nations reported, nearly 12% of the worldwide population faced severe food insecurity in 2020. The percentage is likely to rise in the coming decades [2]. Hence, implementing suitable agricultural adaptation to diet shifts is challenging for ensuring food security [3]. According to this aim, an essential measure of this adaptation is to reach a food balance between supply and demand [4]. The rationalization of the crop planting structure (CPS) contributes to optimizing the crop yield proportion to achieve this balance [5].
The CPS rationalization refers to the appropriate adaptation of crop composition and spatial distribution for agricultural development [6]. This adaptation is different from one country to another. For example, the main crops in the United States are soybean and maize [7]. Additionally, agriculture in Brazil and China have main crops of soybean and maize, respectively [8,9]. This situation showed that these two crops represented an essential share of international trade. The interdependence of food trade intercountry ensures global food security [10]. However, irregular CPS evolution has been a significant obstacle to national food security, notably in China [11]. Previous studies show that this obstacle is mainly manifested in the irrational proportion of food yield [12]. Specifically, wheat, rice, and maize self-sufficiency have reached 95%, while soybean faces production shortages in China [13]. Consequently, the Chinese agricultural principal contradiction has shifted from an insufficient total output to a structural contradiction [14]. This situation results from China’s market economy and the interference of the natural environment [15]. Hence, the Chinese government has undertaken policymaking to address this contradiction nationwide [16,17]. Geographic information about the spatiotemporal changes of the CPS is an essential basis for such policymaking [9]. Therefore, the study of CPS plays a strategic role in optimizing CPS and safeguarding national food security.
Previous studies on CPS have focused on two main aspects. The first was to analyze the interactions between CPS and other elements. The second extracts information on crops’ spatial distribution and suggests the optimization of CPS. The study of interactions between CPS and other components involves several disciplines, including climatology [18], hydrology [19], ecology [20], and geography. The scholars have conducted research primarily in geography. They focused on the interaction between CPS with latitude, population density, and geographical location [21,22]. In extracting crop-distribution information and CPS optimization, scholars have mainly explored the spatiotemporal changes of CPS on national [23,24] and regional scales [25,26]. In China, researchers have conducted studies on different scales, such as the entirety of China [9], North China [27], Sanjiang Plain [5], Hunan Province [28], etc. These studies have promoted the optimization of China’s CPS to safeguard national food security. However, research on the black soil region of Northeast China (BSRNC), which is an essential commercial grain production base, is lacking. In addition, most of these studies focused on characterizing the CPS for the entire study area through multiple counties [29]. They concerned a large region, and few studies investigated the geographic characteristics of the CPS within a small geographical entity such as Hailun County. For this reason, we seek to understand the aspects of CPS in BSRNC on a small scale.
Small-scale acquisition of CPS features specialized methods and data. Surveys, statistics, and remote-sensing image interpretation are the three primary methods for obtaining CPS information. Survey data are accurate, but obtaining CPS information for long time series is challenging [30]. Statistical data are available for accessing long time series of crop information. Restrictedly, statistics fail to reflect spatial heterogeneity [31]. With the advancement of remote-sensing technology, acquiring high-resolution, long-term series of remote-sensing images is possible [32]. Remote-sensing image interpretation provides rapid access to small-scale spatial crop information with long time series [33]. Furthermore, high-, medium-, and low-spatial-resolution images are employed for remote-sensing image interpretation. High-spatial-resolution remote-sensing images, such as SPOT, enable the accurate extraction of crop information. However, image interpretation based on such data requires a long access period and a large workload due to the low temporal resolution [34,35]. Low-spatial-resolution remote-sensing images such as MODIS provide a broader coverage area and higher temporal resolution. Nevertheless, it is difficult to guarantee the accuracy of extraction results [36,37]. Medium-spatial-resolution remote-sensing images, such as Landsat, enable the rapid and accurate acquisition of crop information [38,39]. Overall, remote-sensing interpretation at medium spatial resolution is preferred to obtain CPS of BSRNC on a small scale.
The BSRNC covers an area of 1.09 million square kilometers and contains 264 counties [40]. The BSRNC is a significant supplier of soybean, maize, and rice in China and contributes a quarter of the national food yield [41]. Nevertheless, the irrational crop yield proportion has hindered agricultural development in this region. This hindrance is shown by a significant decline in soybean yield and increased maize and rice yield [42]. In addition to the unit yield, the crop yield changes are mainly due to the CPS adjustment [43]. From this fact, the CPS evolutionary study contributes to a new round of CPS policymaking in BSRNC, thus optimizing the food yield proportion. Furthermore, the adjustment policy of large-scale CPS needs to be practiced in small regions. Therefore, this study selected Hailun County as an example and aimed to summarize the geographical characteristics of CPS spatiotemporal dynamics from 2000 to 2020. Specifically, the objectives of this study are: (1) to analyze the temporal dynamics of crop area, (2) to analyze the spatial dynamics of crop distribution, and (3) to seek to determine CPS type and analyze CPS distribution characteristics. These findings can geographically inform county-level CPS adjustment in BSRNC to ensure regional food security.

2. Materials and Methods
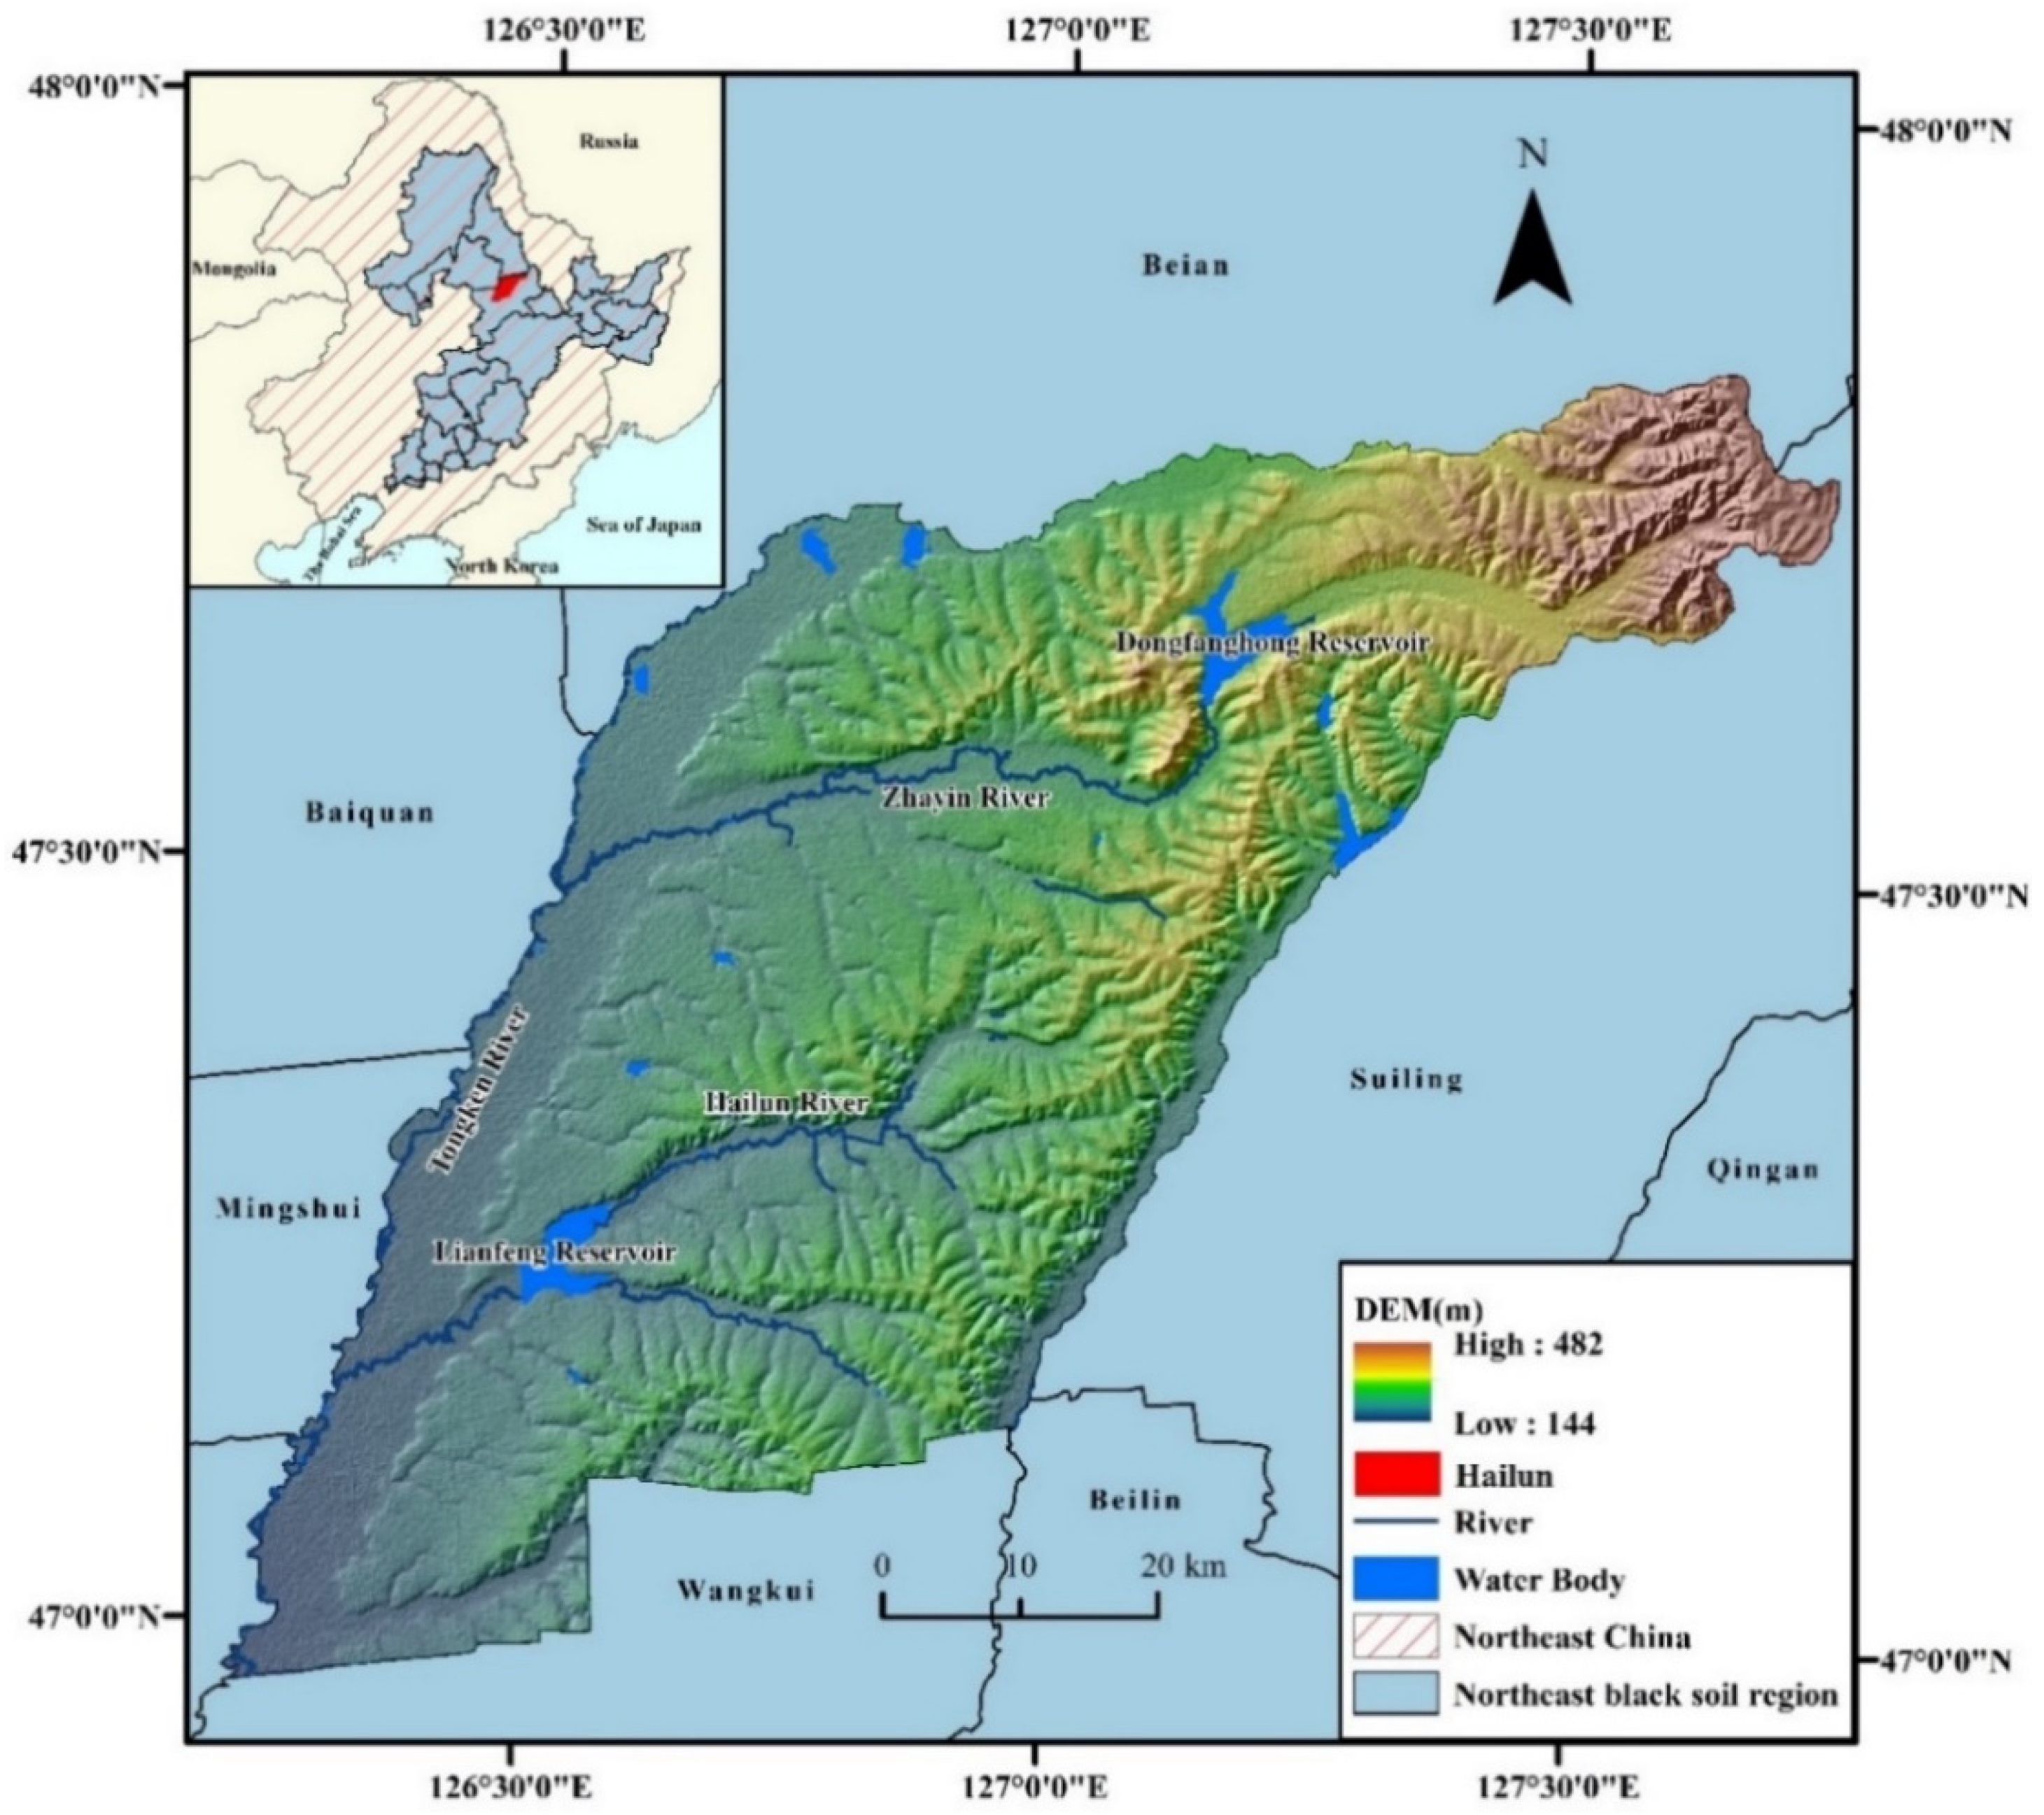
2.1. Study Area

Hailun County is located between latitudes of 46°58′–47°52′ N and longitudes of 126°14′–127°45′ E, in the central part of BSRNC [44]. The regional landform is characterized by southwestern plains and northeastern hilly, with an average elevation of 239 m. The northeastern most hilly area is mainly covered with forests. Hailun County has a humid continental climate, with an average annual temperature of 2.48 °C. The average yearly precipitation is 550 mm/year. The main rivers and reservoirs distributed in the territory are Tongkeng River, Zhayin River, Hailun River, Dongfanghong Reservoir, Lianfeng Reservoir, etc., (Figure 1).
Hailun County is a nationally renowned grain-producing county. The cultivated land area is about 310,000 hectares, accounting for 63.3% of the total land area. The principal crops are soybean, maize, and rice. In 2020, Hailun County’s food yield reached 132,500 tons, and its agricultural income was 65% of the county’s gross domestic product, which indicates that agriculture is the leading industry [45].
Black soil is the primary soil type in Hailun County, accounting for 63.4% of the total land area. This soil features excellent permeability and water retention, as well as great fertility potential, which provides favorable conditions for crop growth. To conduct observations and studies on black soil agriculture, the Chinese Academy of Sciences has established research stations in Hailun County [46]. In addition, the Chinese government has implemented relevant policies (Guidance on the Structural Adjustment of Maize in the “Sickle Bend” Area, etc.,) to adjust Hailun County’s maize area. To optimize the planting structure of soybean and maize, Hailun County was also listed as a pilot area of the national crop rotation fallow system in 2017 [11]. Therefore, Hailun County is a typical area for studying the CPS of BSRNC.

2.2. Data Resources

The crop phenology features one crop per annum in the study area. At the transplanting and tillering stages, the rice showed significant spectral differences in the remote-sensing images from May to June. Hence, we chose these images for identifying rice. From mid-late July to mid-August, soybean is in the stage of podding to maturity, and the plants begin to turn yellow. Meanwhile, maize is in the milky ripeness stage, and the plant greenness is still high. Therefore, we chose images from this period to distinguish between soybean and maize [47].
We collected Landsat4-5 TM, Landsat7 ETM+, and Landsat8 OLI remote-sensing images with a spatial resolution of 30 m for five years (2000, 2005, 2010, 2015, and 2020) (Table 1). In addition, we collected the administrative division vector data and DEM data of Hailun County. These data were sourced from the Geospatial Data Cloud Platform (https://www.gscloud.cn/home, accessed on 15 May 2020).

2.3. Methods

2.3.1. Crop Classification

This study used ENVI and ArcGIS for crop classification. First, we geometrically corrected the remote-sensing images based on DEM. After preprocessing remote-sensing images, we created a mask to crop images using the cropland vector data. Next, we performed a Landsat TM/ETM+ 453 RGB band composite and Landsat OLI 564 RGB band composite. According to crop spectral characteristics, we established the interpretation keys of soybean, maize, and rice by visual identification. Finally, we corrected the supervised classification results by visual interpretation to obtain crop information.
We assessed the accuracy of classification results through the confusion matrix and field survey. Taking the crop confusion matrix in 2020 as an example, the overall accuracy of crop classification was 91.5%, the Kappa coefficient was 0.89, and the user accuracies of soybean, maize, rice, and other crops were 86.36%, 96.36%, 100%, and 85.71%, respectively. Taking the crop field survey in 2020 as an example, the overall survey accuracy was 93%, and the field survey accuracies of soybean, maize, rice, and other crops were 92%, 88%, 98%, and 94%, respectively. The classification results met the requirements of the subsequent analysis.

2.3.2. Temporal Dynamics of Crops

This section revealed the area dynamics of soybean, maize, and rice through the dynamic degree model and transition matrix.
We introduced the land use dynamic degree model to analyze the crop area change characteristics, which can quantify the change rate of the crop area. The expression is as follows [48]:
K = U b U a U a × 1 T × 100 %
where K is the dynamic degree of crop area during the study period; U a and U b represent the crop area at the beginning and end of the study, respectively; and T is the time interval of the study.
We introduced the land-use transition matrix to analyze the crop area conversion characteristics. The transition matrix reflects the transferred-out area at the initial period and the transferred-in area at the end period. The form of the transition matrix is as follows [49,50]:
S i j = S 11 S 12 S 1 n S 21 S 22 S 2 n S n 1 S n 2 S n n
where n represents the number of crop types before and after the transfer; i , j ( i , j 1, 2…, n ) represent the crop type before and after the transfer, respectively; S i j represents the area of type- i crop before conversion to type- j crop after conversion.

2.3.3. Spatial Dynamics of Crops

We introduced the crop kernel density to analyze crops’ spatial aggregation and spatial dynamics [51]. Kernel density estimation reflects the spatial distribution density and changing trend of point groups. Before the kernel density estimation, all soybean, maize, and rice pixels were converted to points that were then algorithmically output to represent crop density. Suppose that ( x 1 , ……, x n ) is a series of n identically and independently distributed observations; the kernel estimator of the x density is given by [52,53]:
f n ( x ) = 1 n h i = 1 n K ( x x i h )
where K is the kernel function and h is a smoothing parameter called bandwidth. The bandwidth h is calculated as follows [54]:
h = 0.9 min S D , 1 ln ( 2 ) D m n 0.2
where S D is the standard distance, D m is the distance from the mean center for all points, and n is the number of points.
In addition, we defined the kernel density levels as follows: kernel density values between 0 and 400 frequency/km2 are “low level”, kernel density values between 401 and 800 frequency/km2 are “medium level”, and kernel density values between 801 and 1200 frequency/km2 are “high level”.

2.3.4. Determination and Spatial Characterization of CPS

The CPS type is determined based on one crop area as a percentage of the total area. Given previous studies in Northeast China [5,55], there are usually no more than three crops in a CPS type. The CPS type is determined as follows: if only a specific crop area accounts for more than 30% of the total crop area in the county, the CPS is the single type of this crop; if there are two or three types of crop areas accounting for more than 30% of the total crop area, the CPS is a combination of these crops; if all crop areas account for less than 30% of the total crop area, the CPS is a combination of the top three crops. Considering the spatial variation of CPS, we further calculated the variation in CPS types on the 900 × 900 m unit.

3. Results

3.1. Temporal Dynamics of Crops

3.1.1. Area Changes in Crops

Soybean and maize were the main crops with over 70% of the total area from 2000 to 2020. They alternated as the crops with the most area. Rice and other crops accounted for less than 30% of the area (Table 2).
From 2000 to 2020, rice showed a significant relative increase in area (over 80%). The second-largest relative increase in area was for soybean (71.8%). In contrast, the area of maize and other crops decreased by 31.7% and 76.4%, respectively. In addition, the relative area change of major crops varies over the period. The area changes in soybean and maize were the most pronounced across periods (Table 3).

3.1.2. Area Conversion among Crops

Specifically, the area interconversion featured differently across stages. From 2000 to 2005 (Figure 2a), soybean had the most significant area increase, while maize was the crop with the most considerable area decrease. The gain area of soybean was 13.83 × 10⁴ hm2, and the lost area of maize was 10.35 × 10⁴ hm2. For soybean, 52% of the gain area came from the maize, and 40% was translated from other crops. For maize, 70% of the lost area translated to soybean and 17% to other crops. From 2005 to 2010 (Figure 2b), maize was the crop with the most area reduction. The area loss of maize was 6.68 × 10⁴ hm2. A total of 55% of the lost area was converted to soybean and 28% to other crops. From 2010 to 2015 (Figure 2c), maize was the crop with the most significant area increase, and soybean was the crop with the most significant area decrease. The gain area of maize was 14.82 × 10⁴ hm2, and the lost area of soybean was 14.72 × 10⁴ hm2. Specifically, 79% of the gained area of maize came from soybean conversion, and 79% of the lost soybean area was converted to maize. From 2015 to 2020 (Figure 2d), the soybean area had the most significant increase, and the maize area had the largest decrease. The soybean gain area was 12.01 × 10⁴ hm2, and the maize loss area was 13.41 × 10⁴ hm2. For soybean, 81% of the gain area came from the maize conversion. For maize, 72% of the lost area was converted to soybean.
Overall, the area interconversion was concentrated between soybean and maize. The interconverted area between paddy and dryland was almost negligible.

3.2. Spatial Dynamics of Crops

Specifically, crops’ distribution ranges and aggregation characteristics differed significantly. According to Figure 3a–e, soybean was the most widely distributed and featured different aggregations. In 2005, 2010, and 2020, soybean was widely distributed and showed strong spatial aggregation. The frequency percentages of soybean kernel density at “high level” were about 30%. In 2000 and 2015, the spatial aggregation of soybean was weaker, with the frequency percentages of kernel density at a “high level” of about 4%. According to Figure 3f–j, maize was mainly distributed in the south-central part of Hailun County. In 2000 and 2015, the maize distribution was more widespread and aggregated. The frequency percentages of the maize kernel density at “high level” were 7.14% and 21.69%, respectively. In 2005, 2010, and 2020, the distribution and aggregation of maize were small, with some maize distributed along the Tongken River. According to Figure 3k–o, rice was the least widespread of the major crops. It was characterized by aggregation mainly near water sources, with the most pronounced spatial aggregation in the Tongken River and Zhayin River. In 2015 and 2020, rice showed more robust water aggregation than in other years.
Overall, soybean and maize were spatially complementary in distribution and aggregation. In 2005, 2010, and 2020, soybean’s distribution breadth and aggregation intensity far exceeded maize’s. Conversely, maize’s distribution breadth and aggregation intensity far exceeded soybean’s in 2000 and 2015. Moreover, the aggregation centers of soybean and maize did not overlap and complemented each other.

3.3. Determination and Spatial Characterization of CPS

We obtained the CPS types for the past 20 years in Hailun County based on the CPS determination criteria. The results were “single type of maize” (2000), “single type of soybean” (2005), “single type of soybean” (2010), “single type of maize” (2015), and “single type of soybean” (2020), respectively. In addition, the CPS evolution pattern was the interconversion between a single type of soybean and maize.
The CPS spatial distribution based on 900 m × 900 m units is determined by the crop spatial distribution based on 30 m × 30 m units. Therefore, they shared similar spatial distribution characteristics. According to Figure 4, a “single type of soybean” and “single type of maize” were the main CPS types, accounting for more than 40% of the total area. A “single type of soybean” was distributed throughout the territory, and a “single type of maize” was mainly distributed in the south-central part of the study area. The area proportion of a “single type of rice” was about 10%, which was mainly distributed near water sources, especially near the Tongken River and Zhayin River. “Mixed type of soybean–maize” was the largest area of mixed types, but the area was much smaller than that of a single type. “Mixed type of soybean–maize” was mainly distributed in the central and northern parts of Hailun County. The other “mixed types of two crops” were the non-dominant CPS types, and irregularities characterized their spatial distribution. The area of “mixed types of three crops” was almost negligible.

4. Discussion

4.1. Explanation for Geospatial Distribution of Crops in Hailun County

Soybean, maize, and rice showed significant differences in spatial distribution characteristics from 2000 to 2020 in Hailun County. The spatial distribution of regional crops is mainly influenced by natural conditions, socio-economic, and agricultural policies [56]. For soybean, Hailun County is blessed with widespread black soil and climatic conditions suitable for growing soybean. This county is also well experienced in growing soybean [57]. As a result, soybean is the main crop and is distributed throughout the territory. For maize, the yield and quality are higher in plains than in hilly areas. Farmers preferred to grow maize in the plains for higher economic benefits [58]. Therefore, maize in Hailun County is mainly distributed in the central and southern plains. For rice, it is concentrated near water sources due to its high water demand. From 2010 to 2014, China raised the minimum rice purchase price for five consecutive years [59]. During this period, more farmers preferred to grow rice. Some dry fields along the Tongken River were converted to paddy fields. As a result, rice’s distribution breadth and aggregation intensity along the Tongken River increased after 2015.
For soybean and maize, rotation improves the physicochemical properties of black soil to increase crop yield [60]. BSRNC has been rotating soybean and maize for the past 20 years. In 2016, the “Pilot Program for Exploring the Implementation of Cultivated Land Rotation and Fallowing System” proposed to conduct a pilot rotational fallowing system in Northeast China, and Hailun County was listed [11]. Therefore, the soybean and maize distributional breadth and aggregation intensity were complementary spatially across years.

4.2. Crop Planting Structure and Food Security

The Chinese agricultural conflict has shifted from an insufficient crop yield to an irrational crop structure in recent decades. To optimize this structure, China’s food security strategy aims to balance the food supply and demand [61]. Rational CPS adjustment contributes to optimizing the crop yield proportion to achieve this balance. Most relevant studies have found that state macro-regulation and changes in farmers’ cropping concept are the two primary measures to ensure food security from the CPS perspective [9,42].
One is the macro-control of the state. The CPS evolution is closely related to China’s food security policy. “ National mid-to long-term food security plan (2008–2020)” has set the goal of stabilizing the food self-sufficiency rate above 95% by 2020 [62]. At present, rice, wheat, and maize yields basically meet the demand for self-sufficiency. Due to imported soybean’s low price and high quality, China still accounts for more than 60% of global soybean imports [10]. The BSRNC contributes to 40% of China’s total soybean yield and plays a vital role in the national soybean supply [63]. Therefore, a new round of county-based regulation of CPS in BSRNC helps to realign the crop yield proportion, thus guaranteeing food security.
The other is the change in farmers’ cropping concept. According to the “Agricultural Supply-side Structural Reform,” the CPS optimization requires a shift in farmers’ cropping concept [64]. Food prices and planting subsidies directly influence farmers’ cropping concept. From 2000 to 2005, the soybean price in Hailun County was about 1.5–2-times higher than that of maize. The subsidies for growing soybean were also much higher than for growing maize. As a result, the CPS transformed from a “single type of maize” to a “single type of soybean.” Overall, the optimization of CPS in BSRNC requires reasonable adjustment by the state and changes in farmers’ cropping concepts to safeguard food security.

4.3. Crop Planting Structure and Policy Implementation

China has implemented policies to optimize the CPS of BSRNC at three levels. On overall policies, the “Outline of the Medium and Long-term National Food Security Plan (2008–2020)” and “National Agricultural Sustainable Development Plan (2015–2030)” called for rational optimization of agricultural production layout to reach a food balance between supply and demand [62]. On specific policies, “Agricultural Supply-side Structural Reform” and “ National Planting Structural Adjustment Plan (2016–2020)” required the rational CPS adjustment to achieve a reasonable crop yield proportion [17,65]. More specifically, “Guiding Opinions on the Adjustment of Maize Structure in the ‘Sickle’ Region” is required to reduce the excessive maize area, restore the shrinking soybean area, and achieve a proper crop rotation in BSRNC.
According to our results, the CPS adjustment over the past 20 years has largely met the requirements of these policies. However, there were still some deviations in the implementation of the policy. For example, the maize area far exceeded the soybean area in 2015. In this case, the new round of CPS adjustment in BSRNC should prioritize policy implementation at the county scale. The county-level geographic characteristics of CPS evolution in BSRNC contribute to monitoring the performance of these policies and guiding the direction of CPS adjustments.
We revealed the geographic characteristics of CPS dynamics in Hailun City from both temporal and spatial perspectives. Due to the limitations in data availability and precision, we did not perform a comprehensive and detailed CPS analysis. However, the geographic characteristics of CPS are both the result of spatiotemporal evolution and the prerequisite for CPS adjustment. Therefore, we will conduct longer time series and more detailed analyses of spatio-temporal characteristics and influencing factors to provide BSRNC with detailed CPS optimization recommendations in future studies.

5. Conclusions

This research attempted to systematically characterize the crop area dynamics and crop distribution dynamics and determine the CPS types in Hailun County. The main findings are as follows: From 2000 to 2020, soybean and maize had the largest area and alternated as the most dominant crop. The area of rice and other crops was tiny. The area interconversion was mainly concentrated between soybean and maize. Relatively, soybean was the most widely distributed and aggregated crop. The soybean and maize distribution breadth and aggregation intensity were spatially complementary in different years. Rice had the smallest distribution range but showed a substantial aggregation of water sources. In addition, the CPS types were a single type of soybean or maize in 2000, 2005, 2010, 2015, and 2020. The CPS evolution pattern was the interconversion between a single type of soybean and maize. The CPS spatial distribution had similar characteristics to the crop spatial distribution.
This study provides a new perspective for CPS research in BSRNC: the spatio-temporal analysis based on county-level geographic characteristics. The results suggest a future CPS adjustment of the BSRNC is necessary, and such an adjustment requires a county-level optimization of the crop-area proportion and crop spatial aggregation. These findings inform the Chinese government’s new round of CPS adjustments for BSRNC to safeguard food security.

Author Contributions

Conceptualization, Q.L. and G.D.; methodology, Q.L. and W.L.; validation, Q.L., W.L. and G.D.; formal analysis, W.L.; investigation, Q.L., W.L., G.D. and L.W.; resources, G.D.; data curation, W.L., H.W. and Y.L.; writing—original draft preparation, W.L.; writing—review and editing, Q.L., G.D., B.F. and S.Q.; visualization, W.L. and Y.L.; supervision, Q.L. and G.D.; project administration, Q.L.; funding acquisition, Q.L. and S.Q. All authors have read and agreed to the published version of the manuscript.

Funding

This research was funded by National Natural Science Foundation of China, grant number 41901208, National Natural Science Foundation of China, grant number 42101217, China Postdoctoral Science Foundation, grant number 2021M700738.

Institutional Review Board Statement

Not applicable.

Informed Consent Statement

Informed consent was obtained from all subjects involved in the study.

Data Availability Statement

The data presented in this study are available on request from the corresponding author. The data are not publicly available due to privacy or other restrictions.

Acknowledgments

We express gratitude to the Northeast Agricultural University professionals who have participated in the research and survey.

Conflicts of Interest

The authors declare no conflict of interest.

References

  1. Ranganathan, J.; Vennard, D.; Waite, R.; Lipinski, B.; Searchinger, T.; Dumas, P. Shifting Diets for a Sustainable Food Future; World Resources Institute: Washington, DC, USA, 2016. [Google Scholar]
  2. FAO. The State of Food Security and Nutrition in the World 2021: Transforming Food Systems for Food Security, Improved Nutrition and Affordable Healthy Diets for All; The State of Food Security and Nutrition in the World (SOFI); FAO: Rome, Italy, 2021; ISBN 978-92-5-134325-8. [Google Scholar]
  3. Noort, M.W.J.; Renzetti, S.; Linderhof, V.; du Rand, G.E.; Marx-Pienaar, N.J.M.M.; de Kock, H.L.; Magano, N.; Taylor, J.R.N. Towards Sustainable Shifts to Healthy Diets and Food Security in Sub-Saharan Africa with Climate-Resilient Crops in Bread-Type Products: A Food System Analysis. Foods 2022, 11, 135. [Google Scholar] [CrossRef]
  4. Keating, B.A.; Herrero, M.; Carberry, P.S.; Gardner, J.; Cole, M.B. Food Wedges: Framing the Global Food Demand and Supply Challenge towards 2050. Glob. Food Secur. 2014, 3, 125–132. [Google Scholar] [CrossRef]
  5. Du, G.; Zhang, Y.; Li, Q. The evolution path of crop structure in the Sanjiang Plain in the 21st century. Res. Agric. Mod. 2019, 40, 736–744. [Google Scholar]
  6. Hu, Q.; Wu, W.; Song, Q.; Yu, Q.; Yang, P.; Tang, J. Recent Progresses in Research of Crop Patterns Mapping by Using Remote Sensing. Sci. Agric. Sin. 2015, 48, 1900–1914. [Google Scholar]
  7. Publication|Acreage|ID: J098zb09z|USDA Economics, Statistics and Market Information System. Available online: https://usda.library.cornell.edu/concern/publications/j098zb09z (accessed on 18 April 2022).
  8. de Araújo, M.L.S.; Sano, E.E.; Bolfe, É.L.; Santos, J.R.N.; dos Santos, J.S.; Silva, F.B. Spatiotemporal Dynamics of Soybean Crop in the Matopiba Region, Brazil (1990–2015). Land Use Policy 2019, 80, 57–67. [Google Scholar] [CrossRef]
  9. Liu, Z.; Peng, Y.; Wenbin, W.; You, L. Spatiotemporal Changes of Cropping Structurein China during 1980–2011. J. Geogr. Sci. 2018, 28, 1659–1671. [Google Scholar] [CrossRef] [Green Version]
  10. Gale, F.; Valdes, C.; Ash, M. Interdependence of China, United States, and Brazil in Soybean Trade; USDA: Washington, DC, USA, 2019; p. 48.
  11. Song, G.; Zhang, H. Cultivated Land Use Layout Adjustment Based on Crop Planting Suitability: A Case Study of Typical Counties in Northeast China. Land 2021, 10, 107. [Google Scholar] [CrossRef]
  12. Wang, H.; Zhang, M.; Cai, Y. Chapter 3—Problems, Challenges, and Strategic Options of Grain Security in China. In Advances in Agronomy; Sparks, D.L., Ed.; Academic Press: Cambridge, MA, USA, 2009; Volume 103, pp. 101–147. [Google Scholar]
  13. Cui, K.; Shoemaker, S.P. A Look at Food Security in China. Npj Sci. Food 2018, 2, 4. [Google Scholar] [CrossRef] [Green Version]
  14. Jiang, Y.; Yang, L.; Xiaolei, Z. Analysis of the Characteristics of Connotation Evolution of Agricultural Modernization with Chinese Characteristics in the 70 Years since the Founding of New China. China Polit. Econ. 2020, 3, 57–74. [Google Scholar] [CrossRef]
  15. Ban, Z. Adjustment of planting structure: A grain Revolution at the turn of the century in China. China Food Econ. 2000, 18, 13–15. [Google Scholar]
  16. Guo, Y.; Liu, Y. Poverty Alleviation through Land Assetization and Its Implications for Rural Revitalization in China. Land Use Policy 2021, 105, 105418. [Google Scholar] [CrossRef]
  17. Zhang, J. Agrarian Change and the Pursuit of Self-Supplied Food Security in China. In Proceedings of the ICAS-Etxalde Colloquium—Elikadura21, Vitoria Gasteiz, Spain, 26 April 2017. [Google Scholar]
  18. Dong, Z.; Pan, Z.; Wang, S.; An, P.; Zhang, J.; Zhang, J.; Pan, Y.; Huang, L.; Zhao, H.; Han, G.; et al. Effective Crop Structure Adjustment under Climate Change. Ecol. Indic. 2016, 69, 571–577. [Google Scholar] [CrossRef]
  19. Davis, K.F.; Rulli, M.C.; Seveso, A.; D’Odorico, P. Increased Food Production and Reduced Water Use through Optimized Crop Distribution. Nat. Geosci. 2017, 10, 919–924. [Google Scholar] [CrossRef]
  20. Wang, Z.-B.; Zhang, J.-Z.; Zhang, L.-F. Reducing the Carbon Footprint per Unit of Economic Benefit Is a New Method to Accomplish Low-Carbon Agriculture. A Case Study: Adjustment of the Planting Structure in Zhangbei County, China. J. Sci. Food Agric. 2019, 99, 4889–4897. [Google Scholar] [CrossRef]
  21. Johnson, D.M. Using the Landsat Archive to Map Crop Cover History across the United States. Remote Sens. Environ. 2019, 232, 111286. [Google Scholar] [CrossRef]
  22. Hijmans, R.J. Global Distribution of the Potato Crop. Am. J. Potato Res. 2001, 78, 403–412. [Google Scholar] [CrossRef]
  23. Yu, H.; Liu, K.; Bai, Y.; Luo, Y.; Wang, T.; Zhong, J.; Liu, S.; Bai, Z. The Agricultural Planting Structure Adjustment Based on Water Footprint and Multi-Objective Optimisation Models in China. J. Clean. Prod. 2021, 297, 126646. [Google Scholar] [CrossRef]
  24. Zhang, Y.; Wang, J.; Dai, C. The Adjustment of China’s Grain Planting Structure Reduced the Consumption of Cropland and Water Resources. Int. J. Environ. Res. Public. Health 2021, 18, 7352. [Google Scholar] [CrossRef]
  25. Zhang, Z.; Ma, H.; Li, Q.; Wang, X.; Feng, G. Agricultural Planting Structure Optimization and Agricultural Water Resources Optimal Allocation of Yellow River Irrigation Area in Shandong Province. Desalination Water Treat. 2014, 52, 13–15. [Google Scholar] [CrossRef]
  26. Han, X.; Wei, Z.; Zhang, B.; Han, C.; Song, J. Effects of Crop Planting Structure Adjustment on Water Use Efficiency in the Irrigation Area of Hei River Basin. Water 2018, 10, 1305. [Google Scholar] [CrossRef] [Green Version]
  27. Zou, J.; Zhu, Y.; Yang, Y.; Liu, W.; Hu, Y.; Chen, F.; Yin, X. Analysis of planting structure evolution and itsdriving mechanism in North China from 1981 to 2015. J. China Agric. Univ. 2019, 24, 23–32. [Google Scholar]
  28. An, Y.; Tan, X.; Tan, J.; Yu, H.; Wang, Z.; Li, W. Evolution of Crop Planting Structure in Traditional Agricultural Areas and Its Influence Factors: A Case Study in Hunan Province. Econ. Geogr. 2021, 41, 156–166. [Google Scholar] [CrossRef]
  29. Jiang, L.; An, Y.; Tan, X.; Mi, S.; Xiong, Y.; Tan, J. Temporal and Spatial Evolution and Optimized Countermeasure of Crop Planting Structure in the Changsha-Zhuzhou-Xiangtan Area in Recent 30 Years. Econ. Geogr. 2020, 40, 173–180. [Google Scholar] [CrossRef]
  30. Zhou, J.; Zeng, F. Study on the Effect of Lowering Minimum Purchasing Price of Grain on the Planting Structure of Large Scale Rice Farmers: Based on Micro—survey of 188 Large Scale Rice Farmers. Issues Agric. Econ. 2019, 3, 27–36. [Google Scholar] [CrossRef]
  31. Wei, J.; Han, L. The impact of rural population structure changes on crop planting structure: A comprehensive FGSL estimation based on panel data of major grain producing areas in China. Rural Econ. 2019, 3, 55–63. [Google Scholar]
  32. Chen, Y.; Guerschman, J.P.; Cheng, Z.; Guo, L. Remote Sensing for Vegetation Monitoring in Carbon Capture Storage Regions: A Review. Appl. Energy 2019, 240, 312–326. [Google Scholar] [CrossRef]
  33. Lu, H.; Tian, Y.; Dong, S.; Wang, B.; Li, M.; Niu, H.; Zhang, E.; Xue, Q.; Zhang, X.; Cheng, S. Interpretation study of crop planting structure in north China plain based on landsat 8 OLI data. Comput. Tech. Geophys. Geochem. Explor. 2017, 39, 416–424. [Google Scholar]
  34. Yang, C.; Everitt, J.H.; Bradford, J.M. Evaluating High Resolution SPOT 5 Satellite Imagery to Estimate Crop Yield. Precis. Agric. 2009, 10, 292–303. [Google Scholar] [CrossRef]
  35. Yang, C.; Everitt, J.H.; Murden, D. Evaluating High Resolution SPOT 5 Satellite Imagery for Crop Identification. Comput. Electron. Agric. 2011, 75, 347–354. [Google Scholar] [CrossRef]
  36. Chen, Y.; Lu, D.; Moran, E.; Batistella, M.; Dutra, L.V.; Sanches, I.D.; da Silva, R.F.B.; Huang, J.; Luiz, A.J.B.; de Oliveira, M.A.F. Mapping Croplands, Cropping Patterns, and Crop Types Using MODIS Time-Series Data. Int. J. Appl. Earth Obs. Geoinf. 2018, 69, 133–147. [Google Scholar] [CrossRef]
  37. Wardlow, B.; Egbert, S.; Kastens, J. Analysis of Time-Series MODIS 250 m Vegetation Index Data for Crop Classification in the U.S. Central Great Plains. Remote Sens. Environ. 2007, 108, 290–310. [Google Scholar] [CrossRef] [Green Version]
  38. Cao, J.; Cai, X.; Tan, J.; Cui, Y.; Xie, H.; Liu, F.; Yang, L.; Luo, Y. Mapping Paddy Rice Using Landsat Time Series Data in the Ganfu Plain Irrigation System, Southern China, from 1988−2017. Int. J. Remote Sens. 2021, 42, 1556–1576. [Google Scholar] [CrossRef]
  39. Sonobe, R.; Tani, H.; Wang, X. An Experimental Comparison between KELM and CART for Crop Classification Using Landsat-8 OLI Data. Geocarto Int. 2016, 32, 128–138. [Google Scholar] [CrossRef] [Green Version]
  40. Liang, A.; Li, L.; Zhu, H. Protection and Utilization of Black Land and Making Concerted and Unremitting Efforts for Safeguarding Food Security Promoted by Sci-tech Innovation—Countermeasures in Conservation and Rational Utilization of Black Land. Bull. Chin. Acad. Sci. 2021, 36, 557–564. [Google Scholar] [CrossRef]
  41. Pan, T.; Zhang, C.; Kuang, W.; De Maeyer, P.; Kurban, A.; Hamdi, R.; Du, G. Time Tracking of Different Cropping Patterns Using Landsat Images under Different Agricultural Systems during 1990–2050 in Cold China. Remote Sens. 2018, 10, 2011. [Google Scholar] [CrossRef] [Green Version]
  42. Liu, D.; Liu, S.; Wen, X. Spatial-Temporal Evolution of Grain Production Structure in Northeast China. Econ. Geogr. 2019, 39, 163–170. [Google Scholar] [CrossRef]
  43. Gong, B.; Liu, S.; Yang, N.; Liu, W. Reflections after the “ninth consecutive increase”: Analysis of the contribution of internal grain restructuring and future potential. Jiangsu Agric. Sci. 2017, 45, 128–131. [Google Scholar] [CrossRef]
  44. Ma, Y.; Chen, L.; Zhao, X.; Zheng, H.; Lü, Y. What Motivates Farmers to Participate in Sustainable Agriculture? Evidence and Policy Implications. Int. J. Sustain. Dev. World Ecol. 2009, 16, 374–380. [Google Scholar] [CrossRef]
  45. The Main Indicators of the National Economy of Hailun City in 2020. Available online: https://hailun.gov.cn/Article/content.html?id=23653 (accessed on 4 April 2022).
  46. Xiaozeng, H.; Wenxiu, Z.O.U.; Jun, Y.A.N.; Na, L.I.; Yanhua, L.I.; Jianguo, W.; Lujun, L.I. Ecology in Agriculture and Long-Term Research Guide Protection of Black Soil and Agricultural Sustainable Development in Northeast China. Bull. Chin. Acad. Sci. Chin. Version 2019, 34, 362–370. [Google Scholar] [CrossRef]
  47. Song, G.; Zhang, W. Spatiotemporal differentiation characteristics of cultivated land use from persprctive of growing food crops in major grain production areas in northeast China. Trans. Chin. Soc. Agric. Eng. 2020, 36, 1–8. [Google Scholar]
  48. Liu, J.; Kuang, W.; Zhang, Z.; Xu, X.; Qin, Y.; Ning, J.; Zhou, W.; Zhang, S.; Li, R.; Yan, C.; et al. Spatiotemporal Characteristics, Patterns, and Causes of Land-Use Changes in China since the Late 1980s. J. Geogr. Sci. 2014, 24, 195–210. [Google Scholar] [CrossRef]
  49. Prasad, V.; Bhardwaj, A. Temporal Land Use Change Analysis of Saleran Dam Catchment in Shivalik Foot-Hills of Punjab Using Geospatial Techniques. J. Agric. Eng. 2021, 58, 167–176. [Google Scholar] [CrossRef]
  50. Guan, D.; Gao, W.; Watari, K.; Fukahori, H. Land Use Change of Kitakyushu Based on Landscape Ecology and Markov Model. J. Geogr. Sci. 2008, 18, 455–468. [Google Scholar] [CrossRef]
  51. Dehnad, K. Density Estimation for Statistics and Data Analysis. Technometrics 1987, 29, 495. [Google Scholar] [CrossRef]
  52. Yang, L.; Wang, L.; Huang, J.; Mansaray, L.R.; Mijiti, R. Monitoring Policy-Driven Crop Area Adjustments in Northeast China Using Landsat-8 Imagery. Int. J. Appl. Earth Obs. Geoinf. 2019, 82, 101892. [Google Scholar] [CrossRef]
  53. Tokuoka, Y.; Hosogi, D. Spatial Distribution and Management of Isolated Woody Plants Traditionally Used as Farmland Boundary Markers in Ibaraki Prefecture, Japan. SpringerPlus 2012, 1, 57. [Google Scholar] [CrossRef] [Green Version]
  54. Xie, F.; Wang, E.; Xie, F. Crop Area Yield Risk Evaluation and Premium Rates Calculation—Based on Nonparametric Kernel Density Estimation. In Proceedings of the 2009 International Conference on Management Science and Engineering, Moscow, Russia, 14–16 September 2009; pp. 246–252. [Google Scholar]
  55. Liu, Z.; Tang, P.; Fan, L.; Yang, P.; Wu, W. Spatio-Temporal Changes of Cropping Types in Northeast China During 1980–2010. Sci. Agric. Sin. 2016, 49, 4107–4119. [Google Scholar]
  56. You, L.; Wood, S.; Wood-Sichra, U.; Wu, W. Generating Global Crop Distribution Maps: From Census to Grid. Agric. Syst. 2014, 127, 53–60. [Google Scholar] [CrossRef] [Green Version]
  57. Zheng, H.; Chen, L.-D.; Han, X.; Ma, Y.; Xinfeng, Z. Effectiveness of Phosphorus Application in Improving Regional Soybean Yields under Drought Stress: A Multivariate Regression Tree Analysis. Afr. J. Agric. Res. 2010, 5, 3251–3258. [Google Scholar]
  58. Kravchenko, A.N.; Bullock, D.G. Correlation of Corn and Soybean Grain Yield with Topography and Soil Properties. Agron. J. 2000, 92, 75–83. [Google Scholar] [CrossRef]
  59. Yu, Y.; Su, X.; Peng, L. Response of Grain Farmers to Increase of the Minimum Purchase Price of Rice and Suggestion—Based on the Survey Results of 600 Grain Farmers in Wannian County, Jiangxi Province. China Rice 2022, 28, 32–37. [Google Scholar]
  60. Du, G.; Zhang, R.; Liang, C.; Hu, M. Remote sensing extraction and spatial pattern analysis of cropping patterns in black soil region of Northeast China at county level. Trans. Chin. Soc. Agric. Eng. 2021, 37, 133–141. [Google Scholar]
  61. Qi, X.; Vitousek, P.M.; Liu, L. Provincial Food Security in China: A Quantitative Risk Assessment Based on Local Food Supply and Demand Trends. Food Secur. 2015, 7, 621–632. [Google Scholar] [CrossRef]
  62. Zhang, H.; Cheng, G. China’s Food Security Strategy Reform: An Emerging Global Agricultural Policy. In China’s Global Quest for Resources; Routledge: London, UK, 2016. [Google Scholar]
  63. Zhang, Y.; Wu, Y.; Liu, B.; Zheng, Q.; Yin, J. Characteristics and Factors Controlling the Development of Ephemeral Gullies in Cultivated Catchments of Black Soil Region, Northeast China. Soil Tillage Res. 2007, 96, 28–41. [Google Scholar] [CrossRef]
  64. Zhou, Q. Agricultural supply-side structural reform: Meaning, dilemma and its realization path. Agric. Econ. 2017, 3, 3–5. [Google Scholar]
  65. Gao, K.; Shao, X.-X. Fundamental Problems, Causes and Focuses of China’s Agricultural Supply-Side Structural Reform. J. Interdiscip. Math. 2018, 21, 1375–1379. [Google Scholar] [CrossRef]
Figure 1. Study area.
Land 11 00785 g001
Figure 2. Transition matrix of crops 2000–2005, 2005–2010, 2010–2015 and 2015–2020 (ad) (S for soybean; M for maize; R for rice; O for other crops; N for non-cultivated land).
Land 11 00785 g002
Figure 3. Kernel density of soybean (ae); maize (fj); rice (ko) in 2000, 2005, 2010, 2015, and 2020.
Land 11 00785 g003
Figure 4. Spatial distribution of CPS based on 900 m × 900 m units in 2000, 2005, 2010, 2015, and 2020 (ae) (1: single type of soybean; 2: single type of maize; 3: single type of rice; 4: single type of other crops; 12: mixed type of soybean–maize; 13: mixed type of soybean–rice; 14: mixed type of soybean–other crops; 23: mixed type of maize–rice; 24: mixed type of maize–other crops; 34: mixed type of rice–other crops; 123: mixed type of soybean–maize–rice; 124: mixed type of soybean–maize–other crops; 134: mixed type of soybean–rice–other crops; 234: mixed type of maize–rice–other crops).
Land 11 00785 g004
Table 1. Details of satellite imageries.
TimesImage TypesCloud Proportions (%)Identified Crops
200006-06Landsat4-5 TM0.00Rice
08-17Landsat7 ETM+0.22Soybean, Maize
200506-28Landsat7 ETM+0.48Rice
08-07Landsat4-5 TM0.00Soybean, Maize
201006-10Landsat7 ETM+0.00Rice
08-24Landsat4-5 TM3.07Soybean, Maize
201506-16Landsat8 OLI3.13Rice
09-04Landsat8 OLI1.07Soybean, Maize
202005-28Landsat8 OLI0.66Rice
07-15Landsat8 OLI2.92Soybean, Maize
Table 2. Area of major crops in Hailun County.
Years Crop Types/Values
SoybeanMaizeRiceOther Crops
2000Area (104 hm2)
Proportion (%)
10.3
29.2
14.5
41.1
3.3
9.3
7.2
20.4
2005Area (104 hm2)
Proportion (%)
21.5
60.9
8.7
24.7
2.1
5.9
3.0
8.5
2010Area (104 hm2)
Proportion (%)
20.9
59.2
6.0
17.0
2.0
5.7
6.4
18.1
2015Area (104 hm2)
Proportion (%)
10.3
29.1
18.0
50.8
4.8
13.6
2.3
6.5
2020Area (104 hm2)
Proportion (%)
17.7
50.0
9.9
28.0
6.1
17.2
1.7
4.8
Table 3. Area changes of major crops in Hailun County.
Periods Crop Types/Values
SoybeanMaizeRiceOther Crops
2000–2005Relative change(%)
Dynamic degree(%)
+108.7
+21.7
−40.0
−8.0
−36.4
−7.3
−58.3
−11.7
2005–2010Relative change(%)
Dynamic degree(%)
−2.8
−0.6
−31.0
−6.2
−4.8
−1.0
+113.3
+22.7
2010–2015Relative change(%)
Dynamic degree(%)
−50.7
−10.1
+200.0
+40.0
+140.0
+28.0
−64.1
−12.8
2015–2020Relative change(%)
Dynamic degree(%)
+71.8
+14.4
−45.0
−9.0
+27.1
+5.4
−26.1
−5.2
2000–2020Relative change(%)
Dynamic degree(%)
+71.8
+3.6
−31.7
−1.6
+84.8
+4.2
−76.4
−3.8
(+) represents the increase in rate; (−) represents the decrease in rate.
Publisher’s Note: MDPI stays neutral with regard to jurisdictional claims in published maps and institutional affiliations.

