1. Introduction
Quantifying land-cover distributions and dynamics aids in understanding and valuing ecological, biogeochemical, and hydrological processes [
1,
2]. Long-term monitoring of land-cover change is particularly important within tropical landscapes, which are understudied relative to temperate systems, yet contain ~50% of global terrestrial biodiversity and two-thirds of the human population [
3,
4]. Wildfires, logging, ranching, and agriculture result in land-cover changes in the dry, moist, and humid tropics [
5] with often substantial impacts on biodiversity, watershed function [
6], soil retention [
7,
8], site energy balance [
9], and biosphere–atmosphere gas exchange [
10], with implications for global climate and human wellbeing [
11]. Given the sensitivity of tropical forest composition, structure, function, and dynamics to land-cover change, quantifying land-cover change at maximal scales is critical to supporting the natural resource stewardship and sustainability goals of tropical nations.
Land-cover monitoring commonly involves some ground-based field data collection paired with repeated remote sensing-based surveys to quantify and assess the distribution of cover types over time [
12]. Methods for documenting land cover in the tropics have evolved dramatically in the past century from ground-based surveys and inventories to plane-based photogrammetry and ultimately to satellite-based remote sensing with increasing temporal and spatial resolutions [
12,
13]. The advent of remote sensing methods has improved quantification of tropical deforestation and the efficiency of large-scale inventories, although forest degradation and/or recovery following disturbance can be underestimated [
13].
Landsat imagery has been commonly applied to map land cover and estimate land-cover change because of the historical coverage beginning in 1972 and frequent acquisition rate [
12]. Studies going farther back in time generally use topographic, land use, or vegetation maps as a baseline [
13,
14]. Most large-area Landsat products quantify forest change (predominately loss and fragmentation) since it is a focus of climate change and biodiversity loss, and comparatively easy to map [
15]. Supervised or knowledge-based classifications predominate, with some kind of consideration for radiometric correction and cloud cover involved [
15]. Very-high-resolution imagery datasets (such as Quickbird and WorldView-2) have become more available and used to generate habitat maps or validation points for classification accuracy assessments but are prone to shadowing and spectral mixing [
12]. In addition, they lack a shortwave infrared band, which limits their potential documentation of complex environments with many species such as tropical forests and spectrally homogenous habitats with low diversity such as mangroves [
12].
Many different methods have been applied to estimate land-cover change with remote sensing and ancillary datasets like digital elevation models (DEM) and soil maps, and research on integrating them with GIS into change detection has increased, in part because changes can be detected more clearly than with other techniques using multi-source data [
16,
17]. However, land-cover documentation efforts are often constrained by variable inventory methodologies and classification systems, uneven sampling, and high cloud cover, especially in tropical regions, where long-term documentation of land-cover change has been relatively rare, and the capacity to summarize and analyze remote sensing data is often lacking [
1,
18]. This is unfortunate because information on land-cover, land-use patterns, and monitoring of their changes can support regional policies and local action for sustainable development in terms of resource use and environmental protection [
19].
The Republic of Palau represents such a tropical case study with availability of variable land-cover inventory products, but covering a relatively long time period with multiple, relatively regular intervals. Land cover has been dynamic on Babeldaob, where large-scale infrastructure, agricultural developments, and natural recovery from them have impacted vegetation cover over the last century. Multiple imagery datasets of varying resolution are publicly available, but most remained unprocessed, and no studies have been undertaken to summarize land-cover change, to observe unassisted ecological processes of recovery, or generate change trends over the whole time frame with which to inform local resource management plans. This variation in imagery is not optimal for assessing land-cover change on the island, but is representative of the data assets of many tropical nations, which presents challenges for temporospatial summaries and comparisons of imagery.
As such, in this study, we asked two questions. Can variable sources of vegetation cover information be used to assemble a comprehensive history of land-cover change in a tropical setting? Secondly, what can vegetation cover change history tell us about the effects of major historical events on forest cover and its recovery from them on Babeldaob Island? Our study objectives were, thus, to compile and compare vegetation land cover from publicly available remote sensing datasets of Babeldaob Island, Palau and summarize temporospatial changes across vegetation cover types at the island scale.
2. Site Description
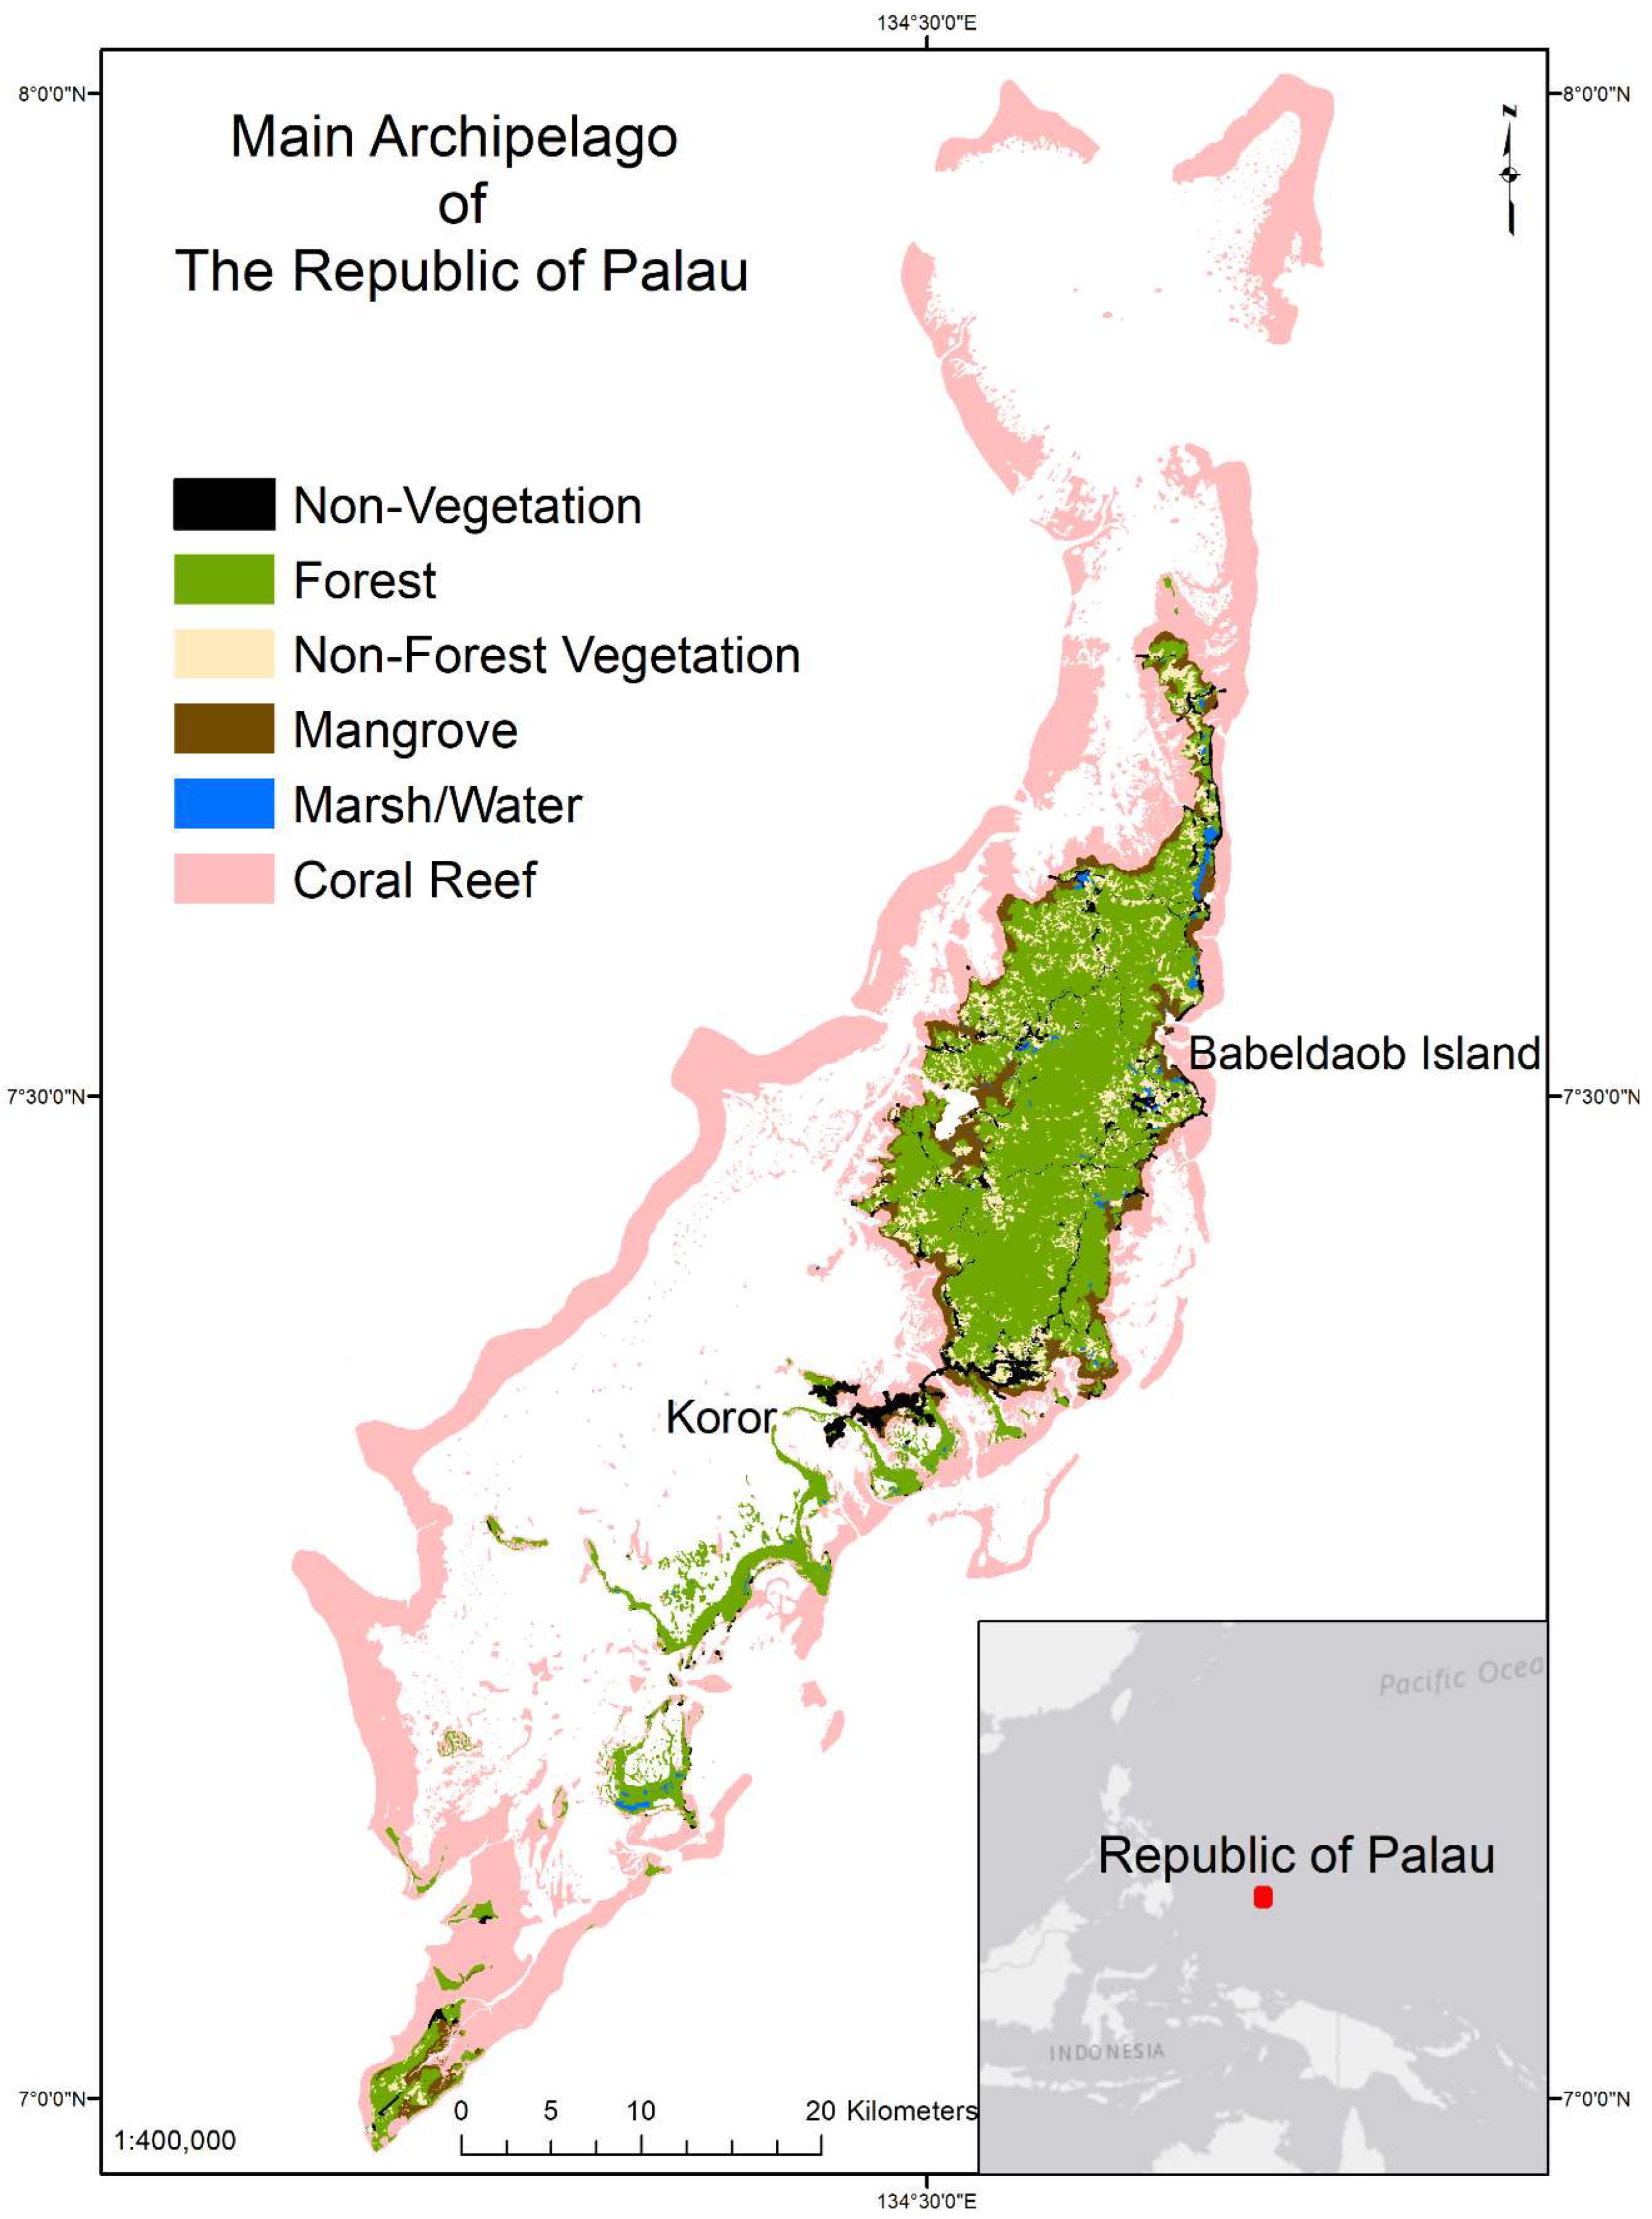
The Republic of Palau is an island archipelago in the western Tropical Pacific Ocean at a latitude of about 7° north and longitude of 134° east (
Figure 1). Palau hosts significant ridge-to-reef resources including endemic biodiversity and abundant ecosystem services vital to the people of Palau. Closed canopy tropical forest is currently the dominant land-cover type, mostly comprising native and endemic species [
20]. The country has a hot and humid climate with a daily average temperature maximum of 31.2 °C, mean annual rainfall of 3734 mm, and a mild dry season from January to April [
21].
Babeldaob island supports about 5000 human residents, or around 30% of the nation’s population, but comprises >75% of the nation’s ~466 km
2 in total land area [
22]. The island’s human history spans three millennia and includes ancient island scale disturbances of paleo-fire use and earthen architecture, as well as industrial agriculture and mining by the pre-World War II Japanese colonial administration [
23]. The main island group is surrounded by a 150 km long barrier reef covering some 100 km
2 of ocean area with an additional 70 km
2 of fringing reef along Babeldoab’s coasts. These reefs sustain both ecotourism and subsistence fishing economies of the island including the commercial and population center of Koror and communities across Babeldaob Island, and they are sensitive to landuse [
24]. Given the cultural, subsistence, and economic importance of reef ecosystems to Palau, land cover and land use have received increasing attention by the Palauan Government regarding how to effectively manage land–sea connections for coral health.
Palau transitioned from German to Japanese colonial administration in the early 20th century, which led to a land-use transformation between 1914 and 1945 during which tens of thousands of Japanese laborers sought to develop a mining and agriculture-based export economy [
25]. In 1947, the archipelago became a Trust Territory of the United States, and land rights were transferred back to native Palauans. In 1978, Palau opted out of joining four other trust territories that formed the Federated States of Micronesia but remained a territory until 1994 when it became an independent nation and formerly entered into a compact of free association with the US. This agreement included support between 1999 and 2007 of the largest infrastructure project in Micronesian history: a perimeter road, locally known as the Compact Road, around Babeldaob Island.
3. Materials and Methods
3.1. Vegetation Cover Types
A widely used Palau vegetation survey and map describes eight forest types on Babeldaob, including upland forest, swamp forest, mangrove forest, Rock Island forest, agroforest, coconut forest, mahogany plantation, and fruit tree plantation. This survey also documents eight non-forest vegetation types: water, barren, urban, marsh, secondary vegetation, cropland, urban cropland, and secondary savanna, the last composed of bare ground, fern land, grassland, shrubs, and abandoned agriculture [
26]. Previous and subsequent efforts provided simpler classifications with overlapping but distinct approaches from the official vegetation survey [
26]. To achieve temporal vegetation cover comparisons, we developed a least common denominator approach to classification that integrates previous cover types into four ecologically sensible categories. These were mangrove, forest, non-forest vegetation, and non-vegetation. Mangrove is a halophytic forest type characterized by many tree adaptations to periodic saltwater inundation that was delineated in all inventories used in this study. Forest includes all non-mangrove forest types. Non-forest vegetation includes all non-forest vegetation types. Barren, urban, water, and bare ground land-cover types were categorized as non-vegetation. In general, mangrove forest, forest, non-forest vegetation, and non-vegetation are straightforward to identify visually and spectrally.
3.2. Vegetation Type Ground Truthing
For temporal comparisons and satellite image classifications, we collected field-based ground-truth data for the above four vegetation classes: mangrove, forest, non-forest vegetation, and non-vegetation (
Table 1 and
Figure 2). We also collected data for swamp forest and marsh to assess precision of the spectral classifications. We used the digitized version of the 1976 USDA Forest Service vegetation survey map [
27] to generate points for field checking and informing classifications of the 1999 to 2014 imagery. The map was hand-drawn, made from high-resolution aerial photos, and partially field-checked [
27]. We generated points within 200 m of roads with a buffered road shapefile for the island [
27] and assigned WGS84 Easting and Northing coordinates using Geospatial Modeling Environment (2010). We exported the point file into a Garmin Map 60 handheld GPS, using GPS Trackmaker (2010). We increased the initial number of sample points for mangrove, swamp forest, and marsh. This was to ensure minimal sample sizes of 50 randomly selected points for each classification, and because we observed changes over time and some errors in the 1976 classification. We used handheld GPS to navigate to points, noted and photographed the vegetation class, and determined if the original classification was accurate, had changed over time, or was misclassified. Given the pansharpened Landsat image resolution of 15 m, we tried to ensure the vegetation class of each field point pertained to an area of at least 15 m
2 while considering a GPS field accuracy of 5–10 m. We estimated a habitat type constancy since 1976 for 93% of visited field points (
Table 1).
3.3. Remote Sensing Data
We collected, organized, and categorized the complete set of publicly available remote sensing data for Babeldaob Island, Palau. These seven land-cover inventories were carried out in 1921, 1947, 1976, 1992, 2001, 2006, and 2014, and they represent a relatively wide variety of survey, classification, and summary methodologies for temporal comparison [
27] (
Table 2). The 1921 map was a hand-drawn black and white map commissioned by the Japanese administration and digitized by Iida [
28] (
Figure S1). The 1947 topographic map and 1976 vegetation map were created from black and white aerial photographs commissioned by the US administration (
Figures S2 and S3). The 1992 color aerial photographs were commissioned by The Nature Conservancy for a rapid environmental assessment (
Figure S4). The 2001 mosaic image was made from downloaded archival Landsat satellite imagery [
29] (
Figure S5). The 2006 and 2014 satellite-derived images (Quickbird (QB) and WorldView-2 (WV2) mosaics) were procured by US government agencies to support environmental assessments of the Compact Road infrastructure project and the aftermath of super typhoons in 2012 and 2013 (
Figures S6 and S7).
We used the five most cloud-free images captured with the TM sensor between 1999 and 2002 (28 Sep 1999, 4 Jan 2001, 22 Dec 2001, 23 Jan 2002, and 29 Mar 2022), all with path 106 and row 055, to create the Landsat mosaic image. Standard processing steps were applied to deal with radiometric variation, cloud, and shadow cover, to create a single, nearly cloud-free image (1.6% cloud cover) for classification (
Figure S8). We used the maximum likelihood supervised classification (MLC) technique with nonparametric rule in ERDAS Imagine (2011) on the Landsat, QB, and WV2 imagery mosaics [
30]. The magnitude change for each land-cover class was calculated using Equation (1).
Percentage change for each land-cover class was calculated using Equation (2).
Annual rate of change for each land-cover class was calculated using Equation (3).
3.4. Accuracy Assessment
We created confusion matrices for classification outputs to generate overall, user, producer, and kappa accuracy estimates for all three satellite classifications. Overall accuracy was computed by dividing the total number of correctly classified pixels by the total number of reference pixels. Individual producer’s class accuracy was calculated by dividing the number of correctly identified pixels in each class by the number of reference pixels known to be in that class, which represents how well reference pixels of each class are classified. Individual user’s accuracy was calculated by dividing the number of correctly identified pixels in each class by the total number of pixels that were classified in that class, which represents the probability that a pixel classified into a category actually represents it on the ground. The Kappa coefficient of agreement was calculated using Equation (4),
where
N = total number of points,
d = sum of correctly mapped points, and
q = sum of the products between row and column totals from the confusion matrix for each class. Kappa coefficients fall within −1 and 1, where −1 = no agreement, 0 = random agreement, and 1 = perfect agreement.
3.5. Vegetation Change Analysis
Analysis of cover class dynamics was determined by dataset types. Polygon-based classifications can be directly compared with each other. In contrast, pixel-based classifications can only be compared if they share the same pixel size or if the pixels are extracted by a polygon-based method and summarized by area.
We used
Erase and
Clip tools on forest, non-forest vegetation, and non-vegetation class shapefiles in ArcMap 9.3 to compare, quantify, and visualize temporal vegetation dynamics among polygon-based classifications for 1947, 1976 and 1992. For mangrove, we used the
Erase tool with polygon-based classifications and coastline or total island area files to generate changes in seaward extent. We used the
Extract by Mask tool with the Landsat and QB classifications and 1992 forest and non-forest class shapefiles to generate forest change values for the time periods 1992–2001, and 1992–2006. We used forest, grassland (non-forest vegetation), and urban (non-vegetation) shapefiles from a polygon-based version of the QB mosaic classification [
27] to extract WV2 classification area summaries [
27,
31], and to summarize and visualize forest change for 2006–2014. Percentage estimates of vegetation cover were rounded to the nearest whole number.
3.6. Caveats
Integrating the 1992 aerial photos for classification was a challenge because of difficulties finding tie points for orthorectification. Even with available fiducial marks for georeferencing, mosaic creation was complicated by vegetation homogeneity and lack of defining anthropogenic features across datasets. There was a narrow gap between aerial images in the center of the island and a number of other small areas where images did not overlap. This occurred because the pilot did not overlap flight paths sufficiently, but we were able to fill in areas with no data by comparing with other imagery. We were unable to perform a spectral classification with the simple RGB imagery because the hue and saturation were markedly different between images.
The QB and WV2 classifications performed poorly with swamp and marsh classes included and identified some areas as mangrove that were too far from the coast; we suspect that these were high-water-content marsh and swamp forest areas, and they largely overlapped with areas of bottom land soils. The knowledge editor, on the basis of the island DEM, improved the pixel-based mangrove classifications, and it will be informative to process this imagery with a more precise DEM when it becomes available. Comparing a better classification output to the manual classifications in inland areas of mangrove discrepancies could help identify habitat class uncertainty in those areas and possibly improve island estimates for mangrove, marsh, and swamp forest habitat coverage.
The WV2 classification was problematic due to different spectral characteristics among, and misalignment of, mosaiced images. We initially used all available bands, but found using bands 6, 7, and 8 (all infrared) yielded the best results. There were also errors in the classification of non-vegetation. For example, some roads were difficult to classify because they range from dark tarmac to white concrete and, thus, could have widely ranging spectral properties. Similarly, building roofs come in all shades of color including green, which can be confused with vegetation. Furthermore, changes in classification shifted mangrove class to forest vegetation. While we ran a 3 × 3 kernel on forest in mangrove, more than one iteration had poor results; hence, about 3% of mangrove was misclassified as forest in the final image. The forest class was speckled with pixels of non-forest vegetation, which we attempted to minimize via kernels, but assessed accuracy decreased so the final classification included this speckling. The forest class was also initially speckled with non-vegetation, which on close inspection appeared to be shadows cast from adjacent tree canopies. To address this last concern, we ran three iterations of a 3 × 3 kernel over the forest class, which reassigned the non-vegetation pixels to forest while reducing the speckling effect, as well as the amount of non-forest vegetation near roads.
4. Results
Forest cover on Babeldaob increased 12% between 1947 and 2014, with most of the increase in cover (from 62% to 68%) occurring between 1947 and 1976 (
Table 3,
Figure 3 and
Figure 4). Forest cover slightly decreased between the 1976 and 1992 (
Figure 5) surveys but resumed increasing between the 1992, 2001, and 2006 surveys (
Figure 6 and
Figure 7), and through the completion of the Compact Road in 2007 to our 2014 survey. We found that the 2014 WV2 USFS thematic map and classification indicated that relative forest cover increases were largest in areas adjacent to the Compact Road (15–22%,
Figure 8) and adjacent to all roads (10–18%), compared to overall increases across Babeldaob (3.8–5.3%). The 2014 WV2 classification and the 2014 USFS thematic map showed small forest cover changes in inland Protected Area Network (PAN) sites between 2006 and 2014 (a 0.3% decline and 1.2% increase, respectively).
Forest and non-forest vegetation were dynamic from 1947 to 2014, with an average of nearly 1% (0.5–0.8%) annual relative change over this 67 year period (
Table 4,
Figure 3). Mangrove forest remained constant at 10–11% of the island’s total land area, but seaward expansion and loss each fluctuated by about 0.2%/year (
Figure S9).
Mapped non-forest vegetation cover decreased by 13% of the total island area from 1947 to 2014, after increasing by 16% from 1921–1947. The gains and losses of non-forest vegetation from 1921–1976 correspond closely with losses and gains in forest cover, indicating long-term transitions between the two categories.
From 1976–2014, 1–3% of non-forest vegetation and 1% of forest vegetation were converted to non-vegetation, including roads and lots, bare soil, buildings, the airport runway, and water. The area of non-vegetation increased from 1% to more than 2% between 1976 and 2014, with roads making up at least half of the total increase.
4.1. Ground Truth Point Observations
The photo-documentation of ground-truth points provided an overall accuracy estimate for the 1976 vegetation map of 86.5%. About 26% of ground-truth points visited had likely changed vegetation class between 1976 and 2012 (
Table 1). The highest rate of change among these points was for the non-vegetation class (70% changed), which had turned into forest or non-forest vegetation (38% and 62% of changed points, respectively). Marsh and swamp forest had the next highest rates of change (35% and 23%, respectively).
4.2. Accuracy and Resolution Ramifications
There were local-scale differences between the mapped coastlines of the 1954 topo map and the QB satellite mosaic, which was used as a general reference for island area comparisons and georeferencing. This can be attributed to the 1954 map being hand-drawn, not field-checked, and created from imagery with relatively low resolution. As such, the 1947 vegetation layer had expected lower accuracy relative to later mapping products. The 1921 mapping product was hand-drawn from field observations and was likely less accurate than the 1954 map derived from 1947 aerial photos, but had island and mangrove area totals similar to other products.
The lower resolution of Landsat imagery from 1999–2002 complicated efforts to compare this data source with other sources, but it had the marginally highest classification accuracy among pixel-based classifications (
Table 5). The relatively low resolution explains the reduction in island area for this time frame (in addition to 1.6% cloud cover), and probably explains the slight decrease in mangrove coverage compared to 1992. The lower resolution also means that tree shadow was not an issue with spectral classification, but small areas of bare soil and other non-vegetation were likely excluded, which could explain the low accuracy and the relative decrease in cover of non-vegetation.
5. Discussion
On the basis of our comparisons of historical ground-based and remote sensing data resources, we documented a considerable 12% absolute increase in forest cover and concomitant decrease in non-forest vegetation across Babeldaob island between 1947 and 2014, with much of this increase happening prior to 1992. While this forest recovery is substantial and contrasts with the tropics as a whole during this time period [
5], 16% of the island still supports non-forest cover, which may represent a 4% increase over 1921. Mangrove cover was stable at around 36 to 40 km
2 or about 10% of island area and mean seaward fluctuations of annual loss and gain appeared roughly equal over the study period.
5.1. Forest Cover Change
The majority (7%) of the island’s forest recovery occurred in the first 29 years after the end of WWII, and non-mangrove forest cover was highly dynamic during that time period, with 21% relative forest growth and 10% relative loss. This increase in forest cover was due to the abrupt halt to industrial-scale agriculture and mining and forced departure of the entire occupying Japanese population, along with some economic migration of Palauans from Babeldaob to the US trust territorial capitol of Koror [
25]. Approximately 78% of forest expansion between 1947 and 2006 occurred in areas deforested between 1921 and 1947, and 22% occurred in areas covered by non-forest vegetation in 1921, some of which may be considerably more ancient (
Figure 7). Only 30% of non-forest vegetation cover in 1921 had changed to forest by 2006, while 66% of forest area cleared between 1921 and 1947 experienced a change to forest cover by then.
A great deal of forest recovery was specifically natural forest regeneration from abandoned agriculture, roads, and residential areas [
32]. Approximately 30% of forest cover increase (4% of total) between 1947 and 2006 was classified as agroforest near coastal communities across the island [
27]. The remaining areas of naturally recovering forest are within a forest/non-forest vegetation (secondary savanna) mosaic that is periodically burned for hunting access, farming, and land clearing. These uses lead to complex patterns of temporal forest edge dynamics but generally stable interior forest areas. Forest vegetation on Babeldaob tends to recover and grow quickly along extant forest edges but slowly in isolated forest patches, especially within degraded areas [
33]. Secondary forests have been recognized for their importance in global carbon cycles and have latent potential to return to mature forests, particularly in areas such as Babeldaob that maintain stable populations of seed dispersers, have a sizable component of generalist tree species, and have old growth forest remnants present [
34,
35].
From 2006 to 2014, forest cover on Babeldaob continued to increase as indicated by satellite image classifications, especially near the compact road and all roads, although it is fairly clear from close inspection of the imagery that the QB and WV2 classifications overestimated forest area somewhat, with higher resolutions including small forest patches and individual trees and shrubs in the forest class. The forest cover increase also included secondary access roads, which might relate to tree canopy extending over road surfaces.
The USFS Forest Inventory Analysis (FIA) report for 2003–2014 estimated a 5.1% (
SE = 2.3) net increase in forest area for Babeldaob, which was generated from 1 acre plot-level changes of forest with at least 10% canopy cover across the island [
36]. Data from Global Forest Watch, which compares 30 m Landsat classifications over time, indicate a loss of 1.2% of forest with at least 10% canopy cover on Babeldaob from 2000 to 2014 and forest gain of 0.7% from 2000 to 2012 [
5]. This suggests that the construction of the Compact Road (1999–2007) did have an overall negative but relatively small impact on forest cover, with estimates of forest recovery revealed in the QB and WV2 imagery as low-statured secondary forest and shrubs concentrated in relatively narrow bands along extant forest edge.
5.2. Non-Forest Vegetation (Secondary Savanna)
Palau’s non-forest vegetation is quite diverse; apart from freshwater marsh and taro patch habitats which were included in the cateogory, 179 plant species have been observed to occur primarily in Babeldaob’s secondary savanna habitats [
37]. Many of these species have traditional and/or medicinal uses, and Palauans commonly express some concern about the continuing availability of those species where forests replace savanna [
37]. However, given the slow forest recovery in secondary savanna, and the continuing use of fire leading to savanna perpetuation, savanna habitats will persist on the landscape without stronger interventions to facilitate forest regeneration and to reduce burning practices that can damage and kill trees [
36,
38]. The distribution of the savanna habitat type is uneven on Babeldaob with some of the 10 states having a high percentage of savanna and others very low.
5.3. Non-Vegetation and Development
Analyses of the 1921 and 1947 mapping products revealed that areas without vegetation cover were very small relative to island area and likely were not mapped or quantified. Overall, non-vegetation remains the smallest cover type on Babeldaob, but its proportional change over the study period was the largest among cover types. Non-vegetation ground-truth points also showed the highest rate of change among classes, likely because they occurred primarily on abandoned roads that transitioned naturally to non-forest vegetation and forest, as well as on bare residential areas that transitioned with human assistance to agroforest.
Unfortunately, we could not examine how non-vegetation has changed since the completion of the Compact Road and the initiation and completion of other road projects between 2006 and 2014 due to tree shadows in the high-resolution satellite imagery. Many of the secondary roads used for the Compact Road construction have regenerated to forest or are covered by nearby forest canopy. In some cases, new houses and other developments have been built along these routes, but the level of urbanization remains very low and concentrated in a few small areas across the island. Overall, the net change in non-vegetation appears to have remained at roughly 2–3% of island cover since 2006, with about half being roads. This is a rough estimate unfortunately, since the Landsat and both 2014 products substantially underestimated non-vegetation, the 2006 polygon-based map did not include bare soils in the urban class, and the 2006 classification overestimated non-vegetation from picking up tree shadows. We utilized local knowledge of fully forested areas to calculate proportion of shadow cover in forest and mangrove for the 2006 QB classification and adjusted all category totals to arrive at a 3% non-vegetation cover estimate.
While new roads in the tropics often lead to additional deforestation, logging, and fire due to easier and more rapid access [
39], this apparently did not occur in Palau through 2014, likely because of the low population density of Babeldaob (~14 people/km
2), relatively clear land title/ownership, and a low level of economic marginalization [
22]. New road development and existing roads have increased and do increase sedimentation of streams and near-shore areas on Babeldaob [
40], which may influence seaward fluctuation of mangrove extent around the island.
5.4. Mangroves
Mangrove change studies have used Landsat archival imagery and a variety of other high-resolution satellite datasets in combination with historical aerial photos to establish landward and seaward mangrove edge baselines for temporal change estimates [
41,
42]. In this study, we found that the landward edge varied substantially across all products as a consequence of differences in boundary interpretation; thus, we were unable to make confident comparisons of net mangrove area change. Data from Global Mangrove Watch indicate no mangrove deforestation in Palau overall from 1996 to 2016 and annual loss and growth rates well within our estimates of seaward change but cite an estimate of total mangrove area more than 20% higher than the official vegetation survey [
26,
43]. Compared to the tropics as a whole over this time period, annual net rates of seaward change (0.04% loss/year–0.4% growth/year) on Babeldaob were substantially lower than global and most regional rates of change in mangroves [
44,
45]. The periods when seaward expansion was greater than loss (1921–1947 and 1976–1992) correspond with upland forest loss (and imagery with equivalent resolutions), which suggests that sedimentation from upland land-cover change is correlated with net seaward mangrove expansion. This, as well as the creation of coastal taro patches, is supposedly what occurred on a much larger scale around Babeldaob many centuries ago when Palauans created massive earthwork terraces across the island [
46]. While there has been some recent development which has altered a small proportion of mangrove habitat, for the most part, the local use of mangrove forests for harvesting of building materials and fuel wood appears to be sustainable in terms of maintaining persistent mangrove cover over time.
5.5. Ground-Truth Point Observations
While ground-truth points were generated within 200 m of roads [
27], this included older roads, some of which had been unused for decades. This and the proximity of roads to areas of human habitation suggest that our sampling area likely underwent more vegetation class change than the mean condition for Babeldoab island, which aligns with our finding that, between 2006 and 2014, areas within a road buffer (120 m on each side past the road surface) experienced about three times the rate of forest change compared to Babeldaob overall. The relatively high rates of change for swamp forest and marsh may relate to the reversion of abandoned taro patches (
Colocasia, Cyrtosperma and
Xanthosoma spp.) into marsh and swamp forest over time, as well as the anthropogenic conversion of marsh and swamp forest into taro patches. Alternatively, some change could have been caused by sedimentation and alterations to drainage from road building and other developments, and/or misclassifications of the 1976 black and white aerial imagery.
Swamp forest was the most misclassified habitat type in the 1976 vegetation map, followed by marsh, which is at least partly due to at least two common tree species (Campnosperma brevipetiolata and Hibiscus tiliaceous) that co-occur in forest and swamp forest. These species and another swamp forest species Barringtonia racemosa commonly occur in marshes as well. Study of these freshwater-affiliated habitats to better understand the species composition and temporal succession, as well as a better DEM, would help improve understanding of distribution, since field work indicates that coverage values from the 1976 vegetation map were overestimated for these relatively uncommon and valuable habitats.
5.6. International Context
Tropical forests are among the most threatened ecosystems on the planet, with continued deforestation often impacting the most ecologically high-quality forests, and most land-cover change products for most locations with tropical forest indicate net forest loss and general habitat degradation over the study period [
14,
47,
48,
49]. Our satellite classifications had lower numbers of cover classes and lower accuracy in general compared to other studies and what is considered to be very high accuracy of 86–100%, which could be due to them being composite images including scenes from different seasons [
12,
48]. In addition to subsistence farming, logging and commodity extraction are increasingly leading to degraded forest lands internationally [
50]. New road construction financed by governments or corporate interests can open new areas of forest to exploitation by colonizers and speculators who are responsible for significant additional deforestation [
50]. This pattern was evident during Palau’s colonial occupation by Japan, and relatively large areas of bare soil on Babeldaob today give testimony to the destructive potential of human activities more than 70 years after their cessation. However, since its independence and free association with the US, including construction of a major perimeter road, forests in Palau and on Babeldaob island stand in contrast to the typical modern tropical forest story. A combination of socioeconomic and political factors have likely contributed to this including Palauan soverignty, Pacific Islander control of their lands and natural resources, a relatively clear and well-respected system of state and private land ownership, low human population density, low levels of economic marginalization [
22], soils poorly suited to conventional agriculture and grazing [
51], and low quantities of timber suitable for harvest and/or export [
52].
6. Conclusions
We used publicly available imagery of Babeldaob Island across a 93-year time range, including a diverse assortment of aerial photos, topographic and vegetation maps, and satellite imagery to summarize spatiotemporal land-cover change on the island. Our study indicates that broadly summarized results from diverse sources of remote sensing data offer a valuable temporospatial view of land-cover change, which can support natural resource management plans and decision support tools designed for long-term sustainability [
53]. These broad comparisons do not approach tree species-level resolution, which can be challenging with even the highest available technology but do indicate habitat patterns and trends in the landscape over time [
12,
54]. Despite the limitations of working with diverse remote sensing datasets, this broad temporal comparison uncovered previously unrecognized important land-cover trends for Babledaob and indicate that, despite recent major infrastructure developments, forest and mangrove cover has remained robust, and non-mangrove forest continues to recover naturally from deforestation that occurred during the Japanese colonial administration more than 70 years ago. However, much of the recent forest growth is characterized by small statured forest trees and shrubs, and the landscape is still described as a mosaic of forest and non-forest vegetation with substantial forest edge subject to wildfire and other land-use disturbances [
37].
This study also suggests that classifications with newer satellite imagery offering higher resolution and more spectral bands does not guarantee better results, as suggested in the land-cover change review literature [
12]. We found that visual interpretation and manual mapping methods, even with black and white imagery, can have high-quality and even better outcomes than satellite classifications in terms of accuracy and useful GIS products. For island-wide comparisons of land-cover dynamics, remote sensing analyses can be useful and with public data, some technical skill, and computer software, relatively inexpensive. Given similar publicly available datasets, other small tropical countries and island states can use this approach to affordably generate extended land-cover histories.


 ,
, 


