
Relationship of Selected Soil Properties with the Micronutrients in Salt-Affected Soils

 , ,
, ,  and
and
Abstract
:1. Introduction
2. Materials and Methods
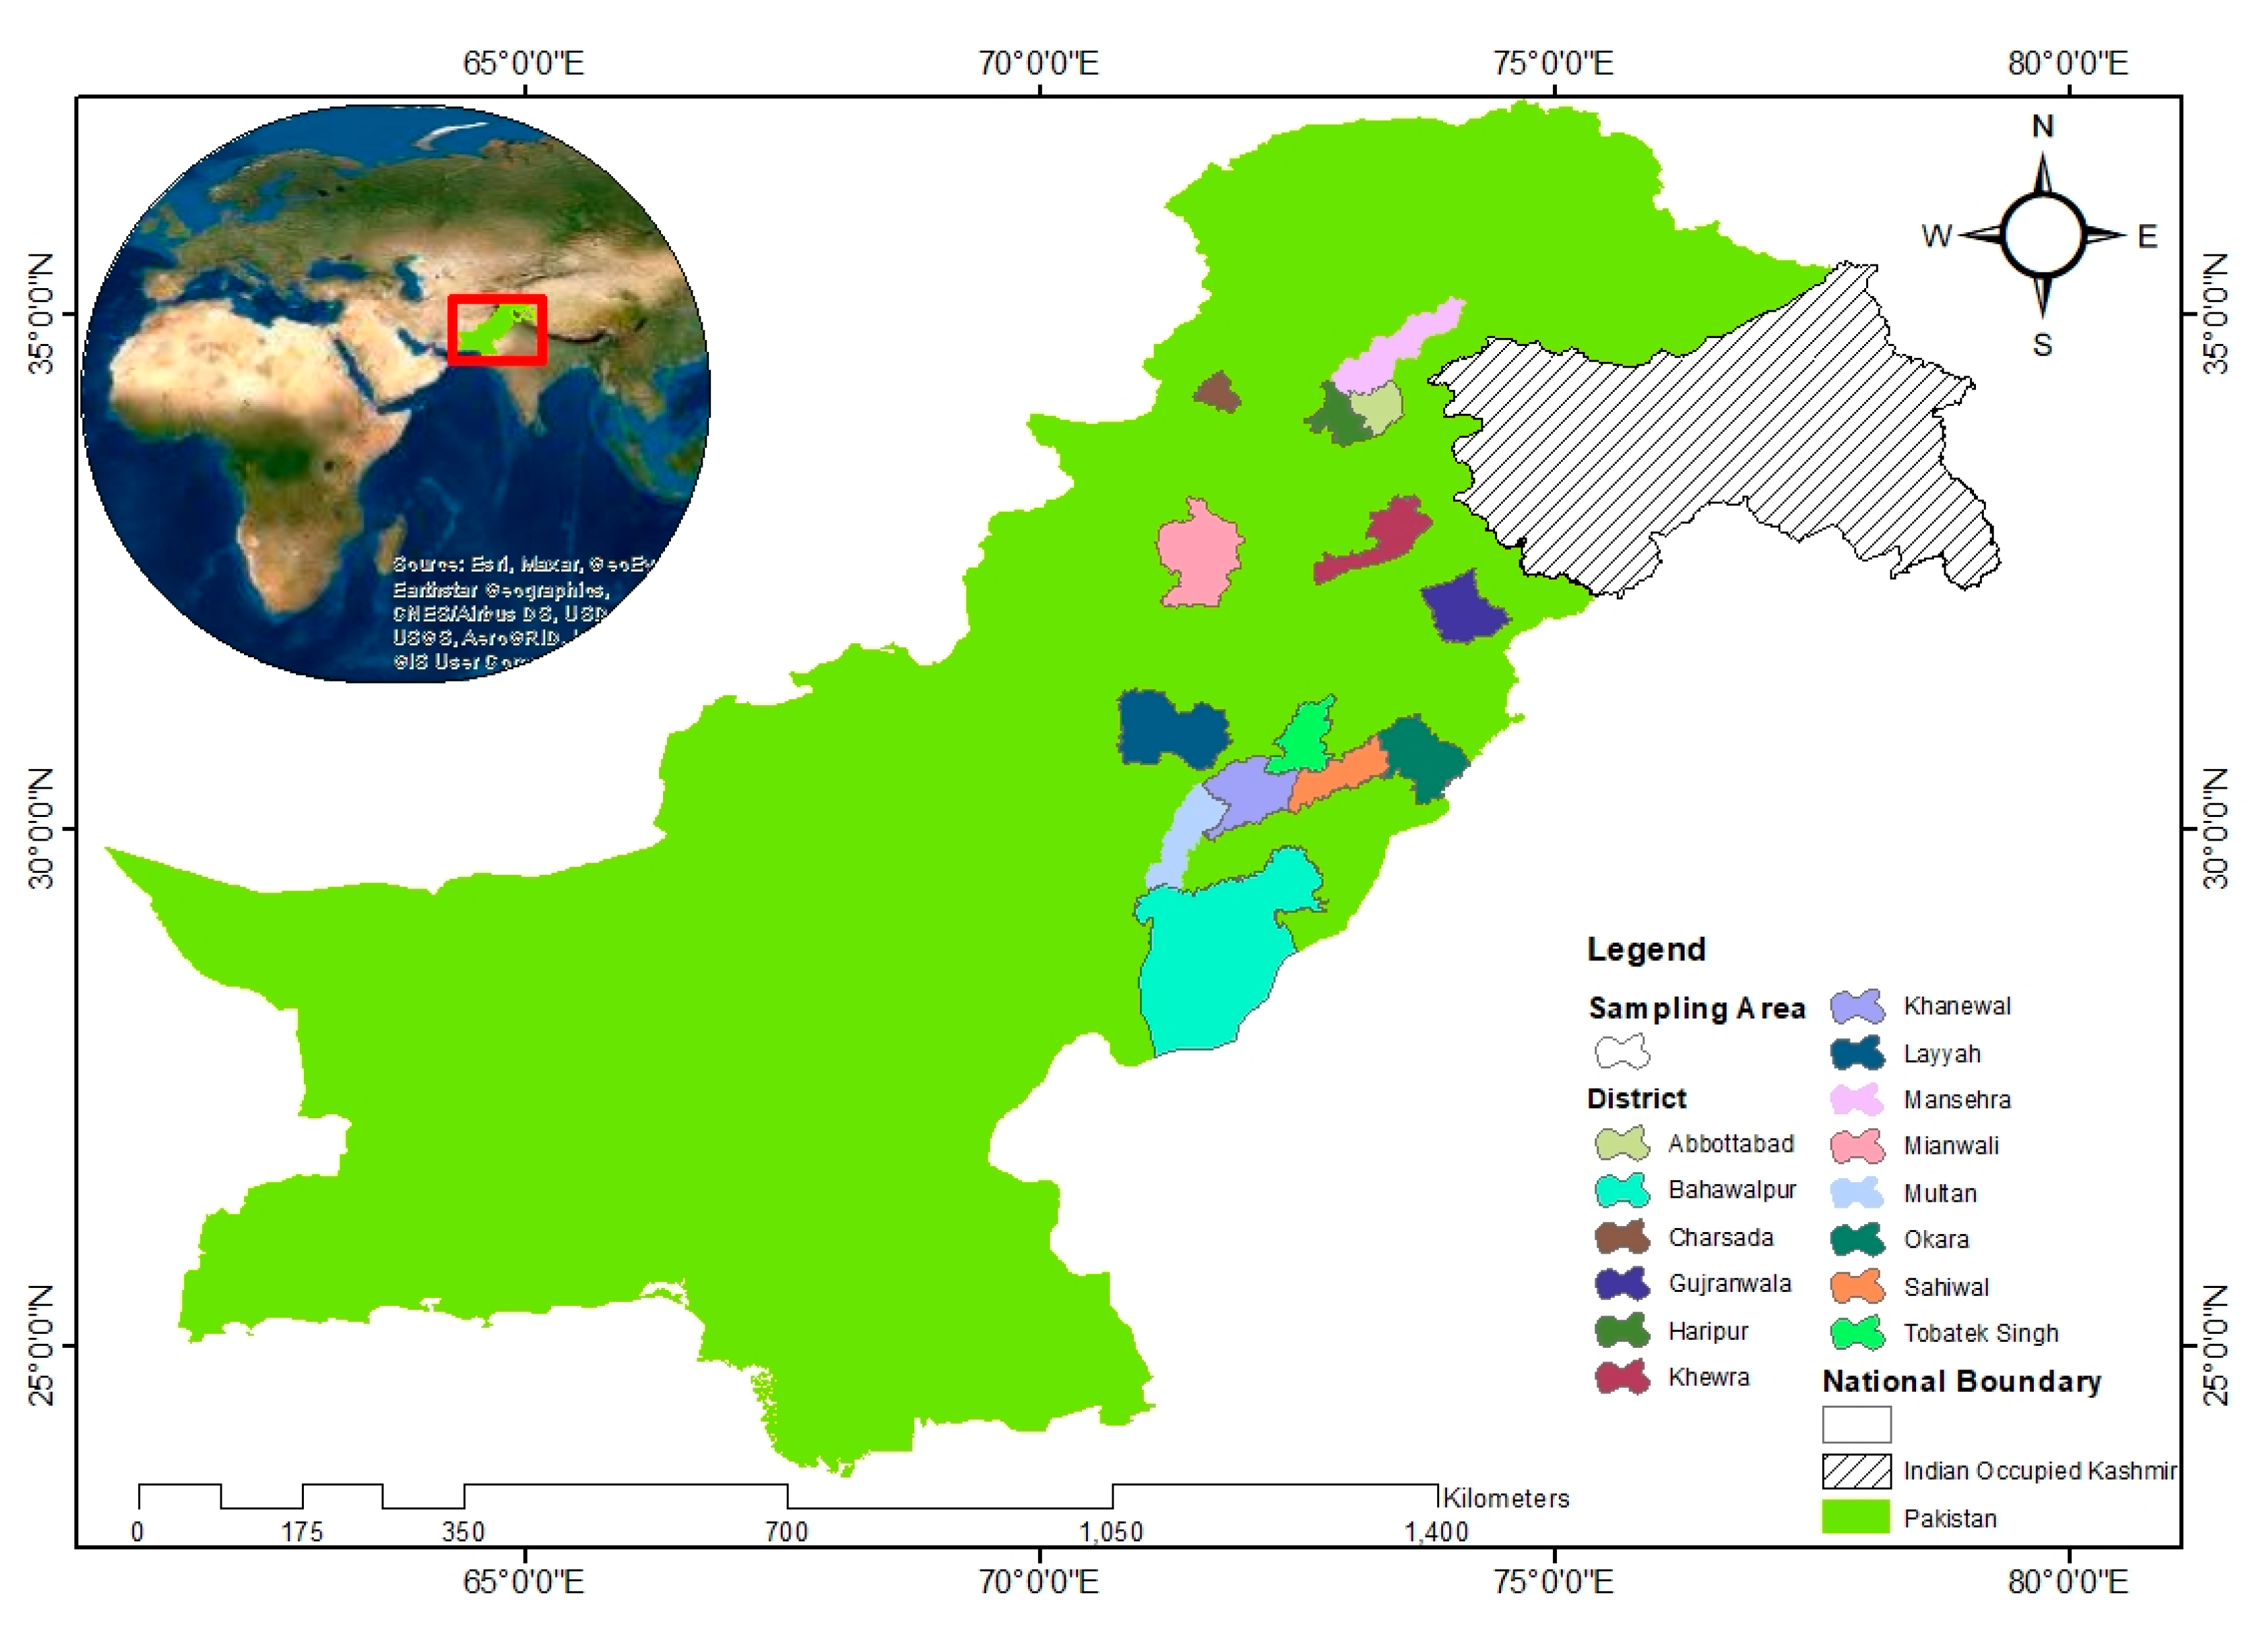
2.1. Study Area
2.2. Soil Sampling
2.3. Soil Analysis
2.4. Exchangeable Sodium Percentage
2.5. Mobility Factor
2.6. Statistical Analysis
3. Results and Discussion
3.1. Soil Properties and Classification
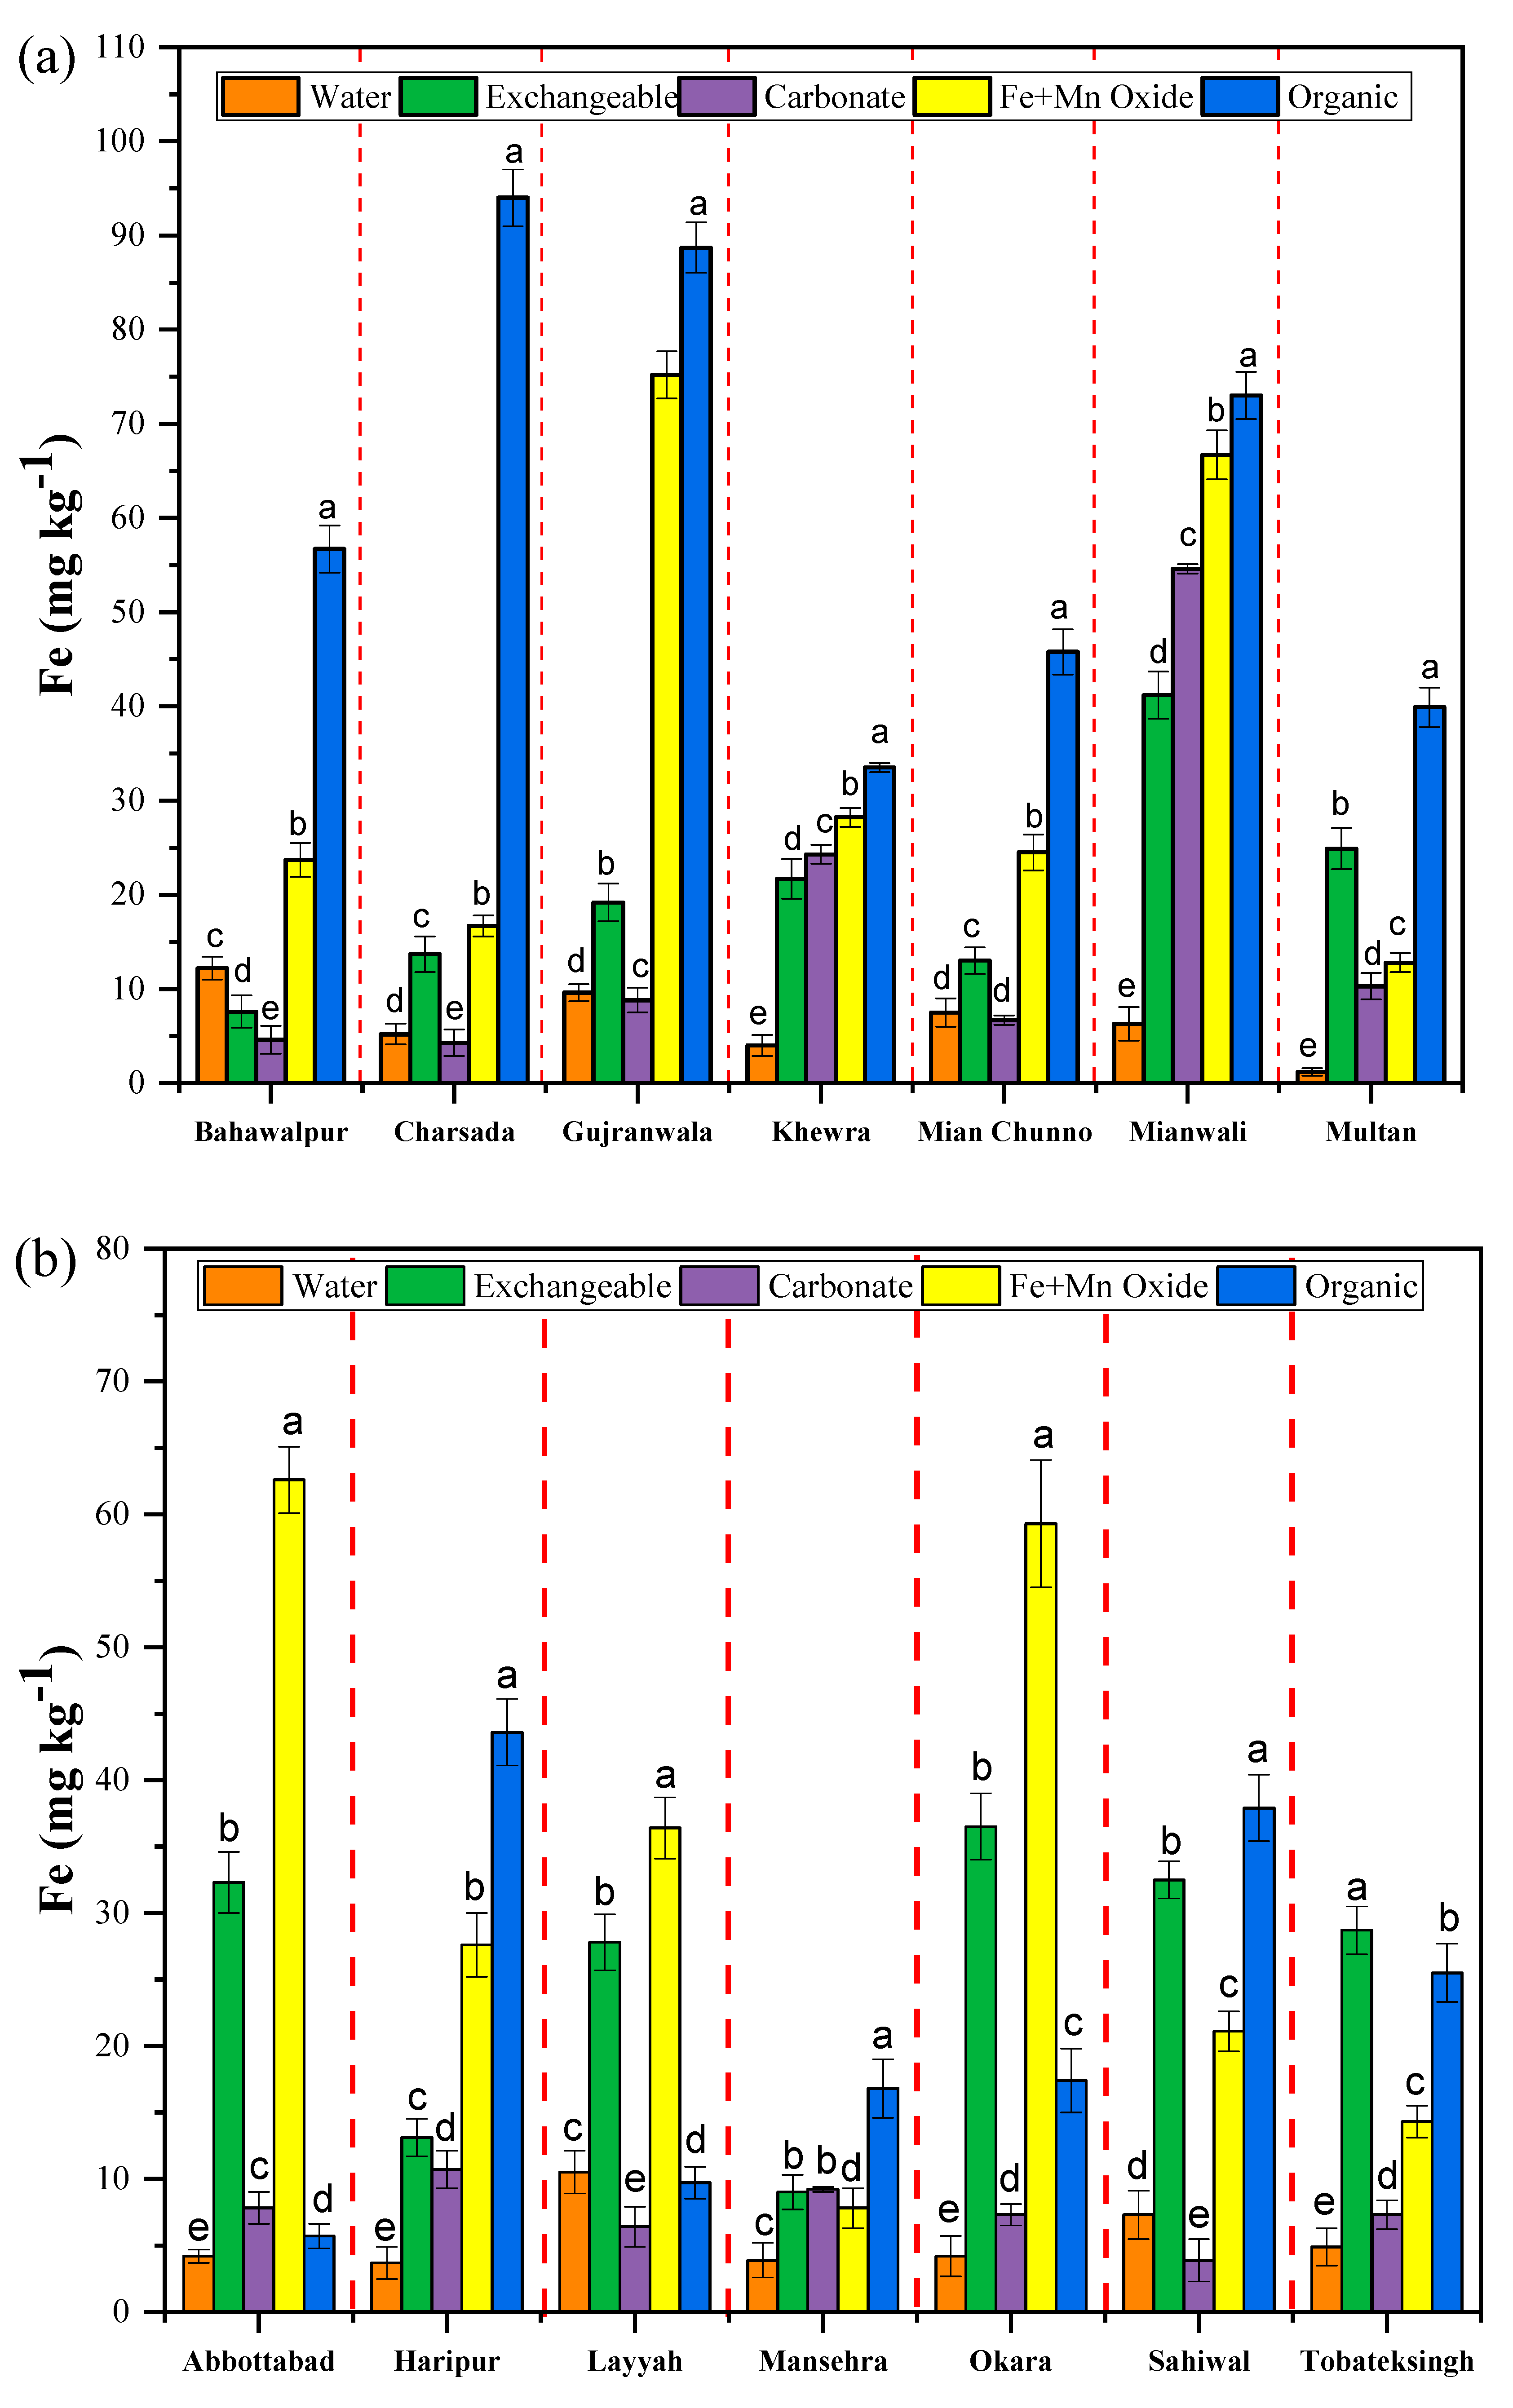
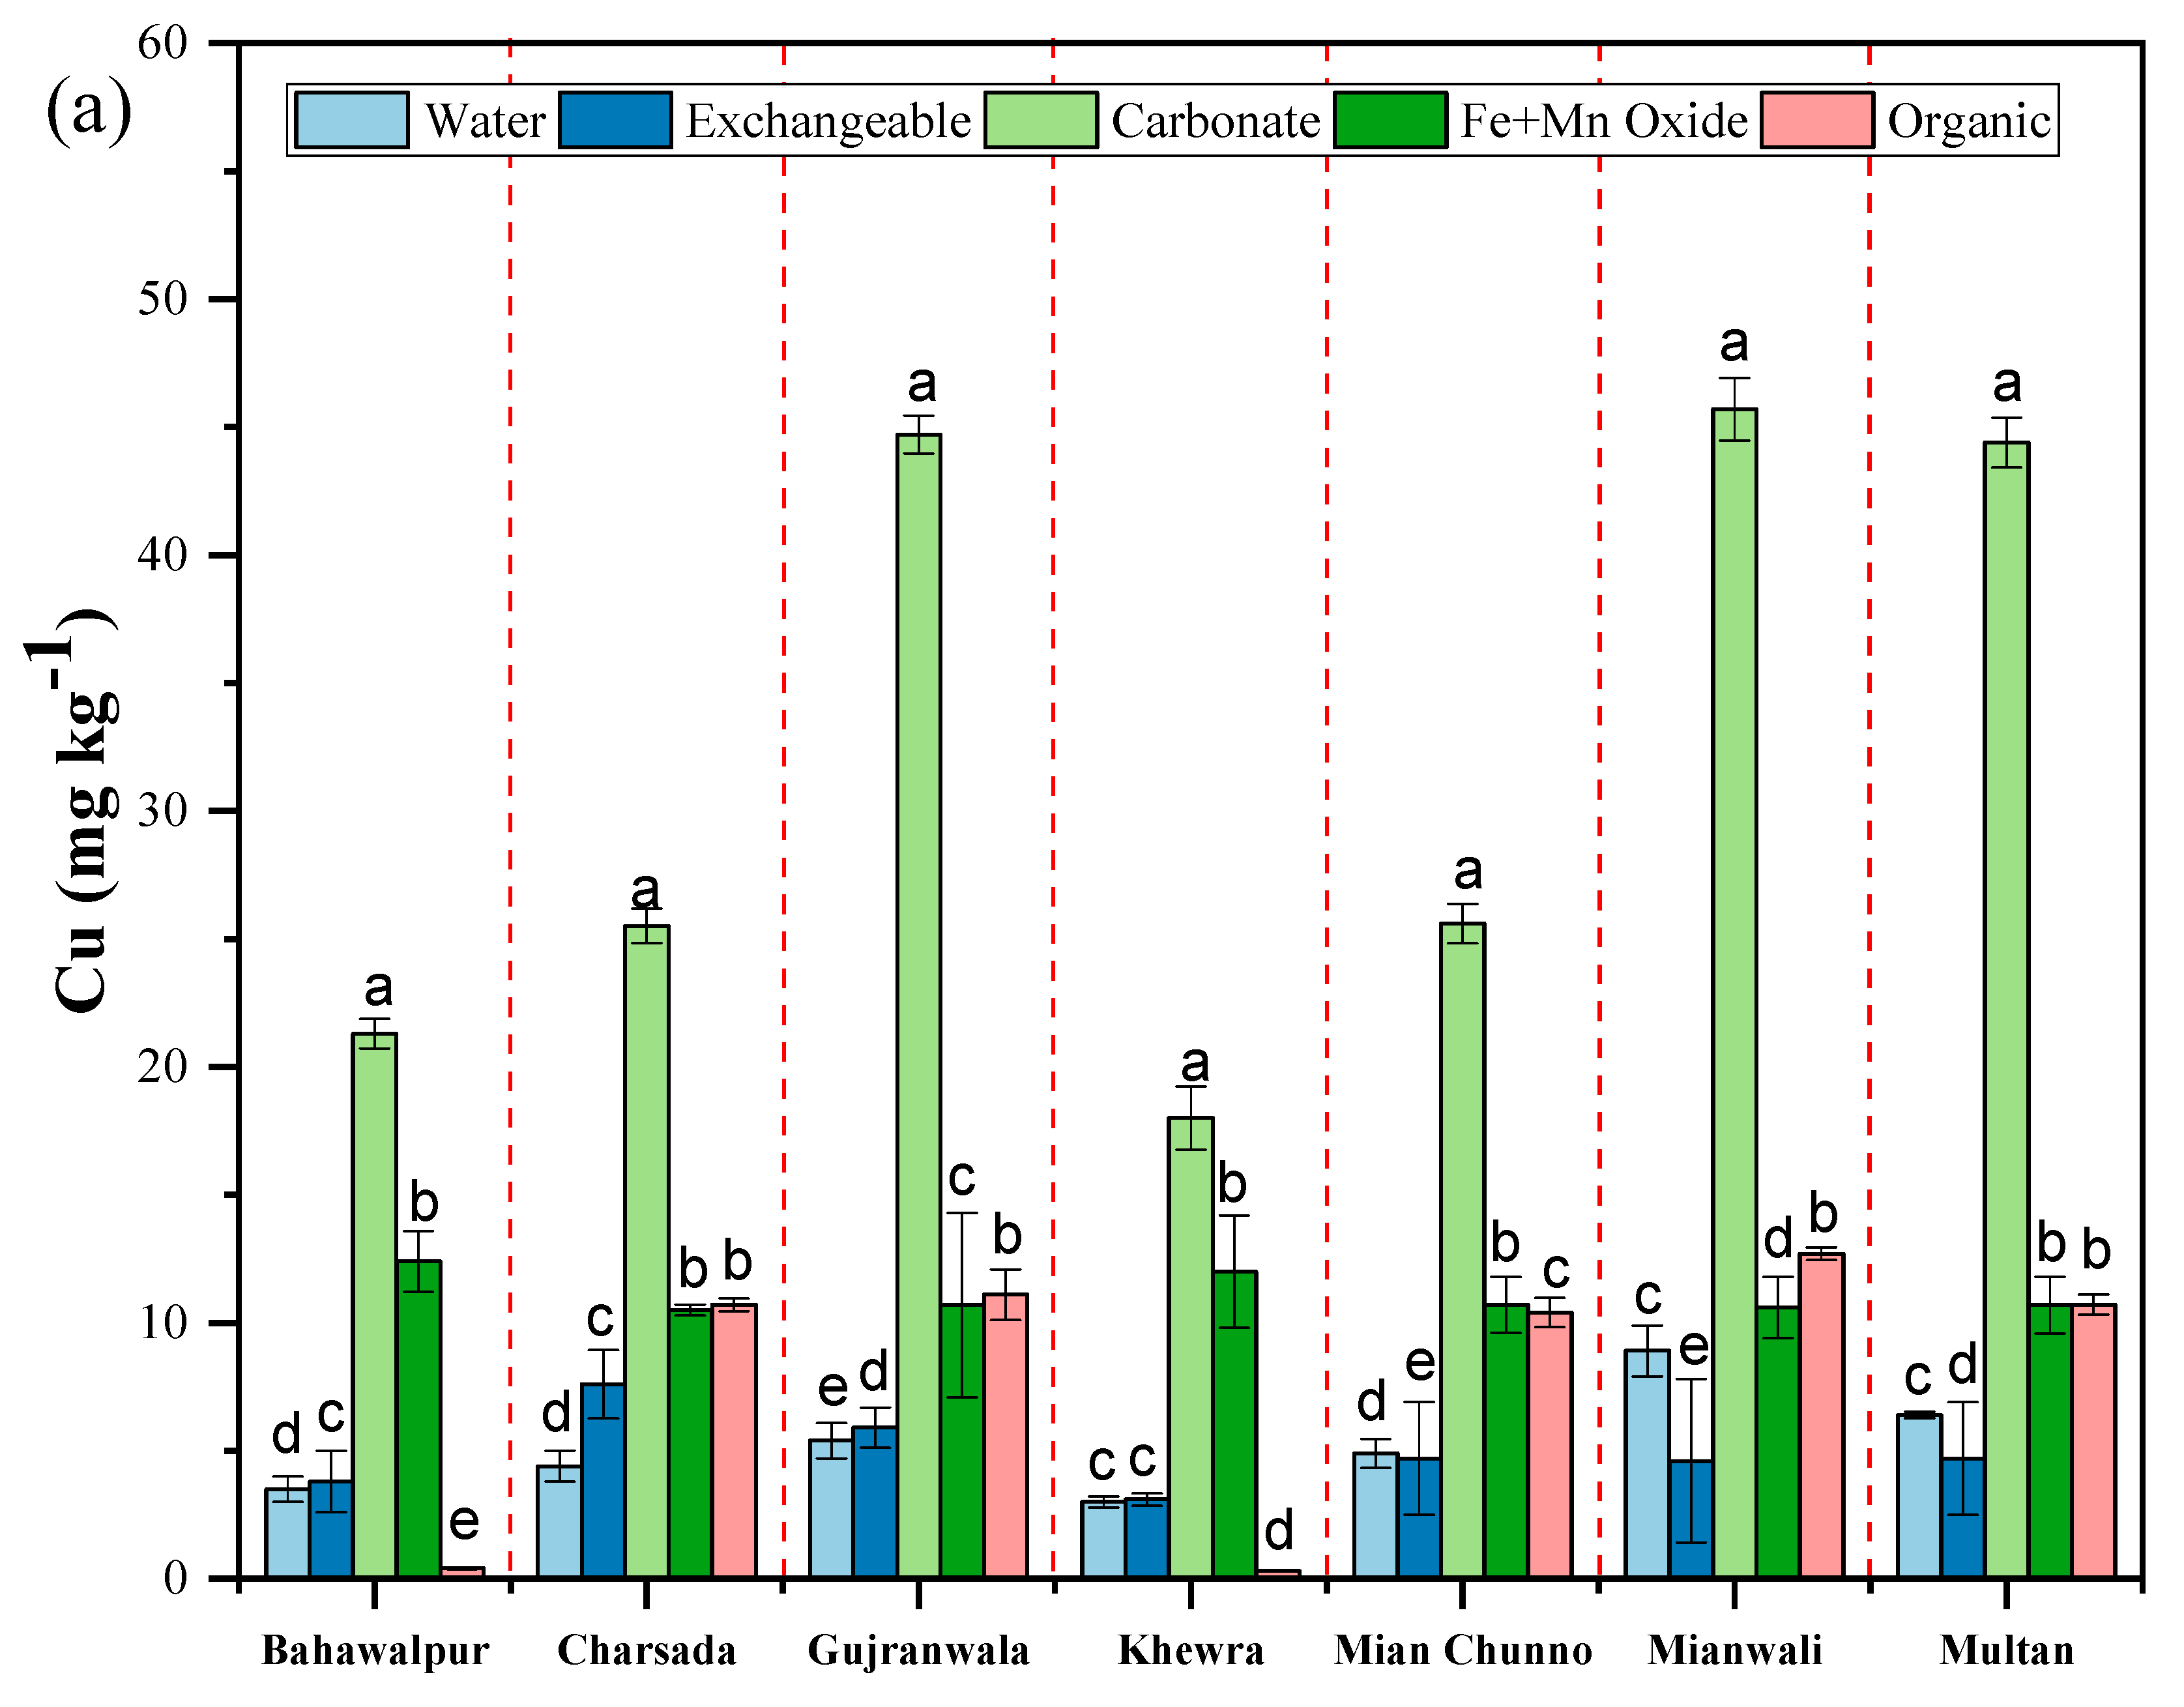
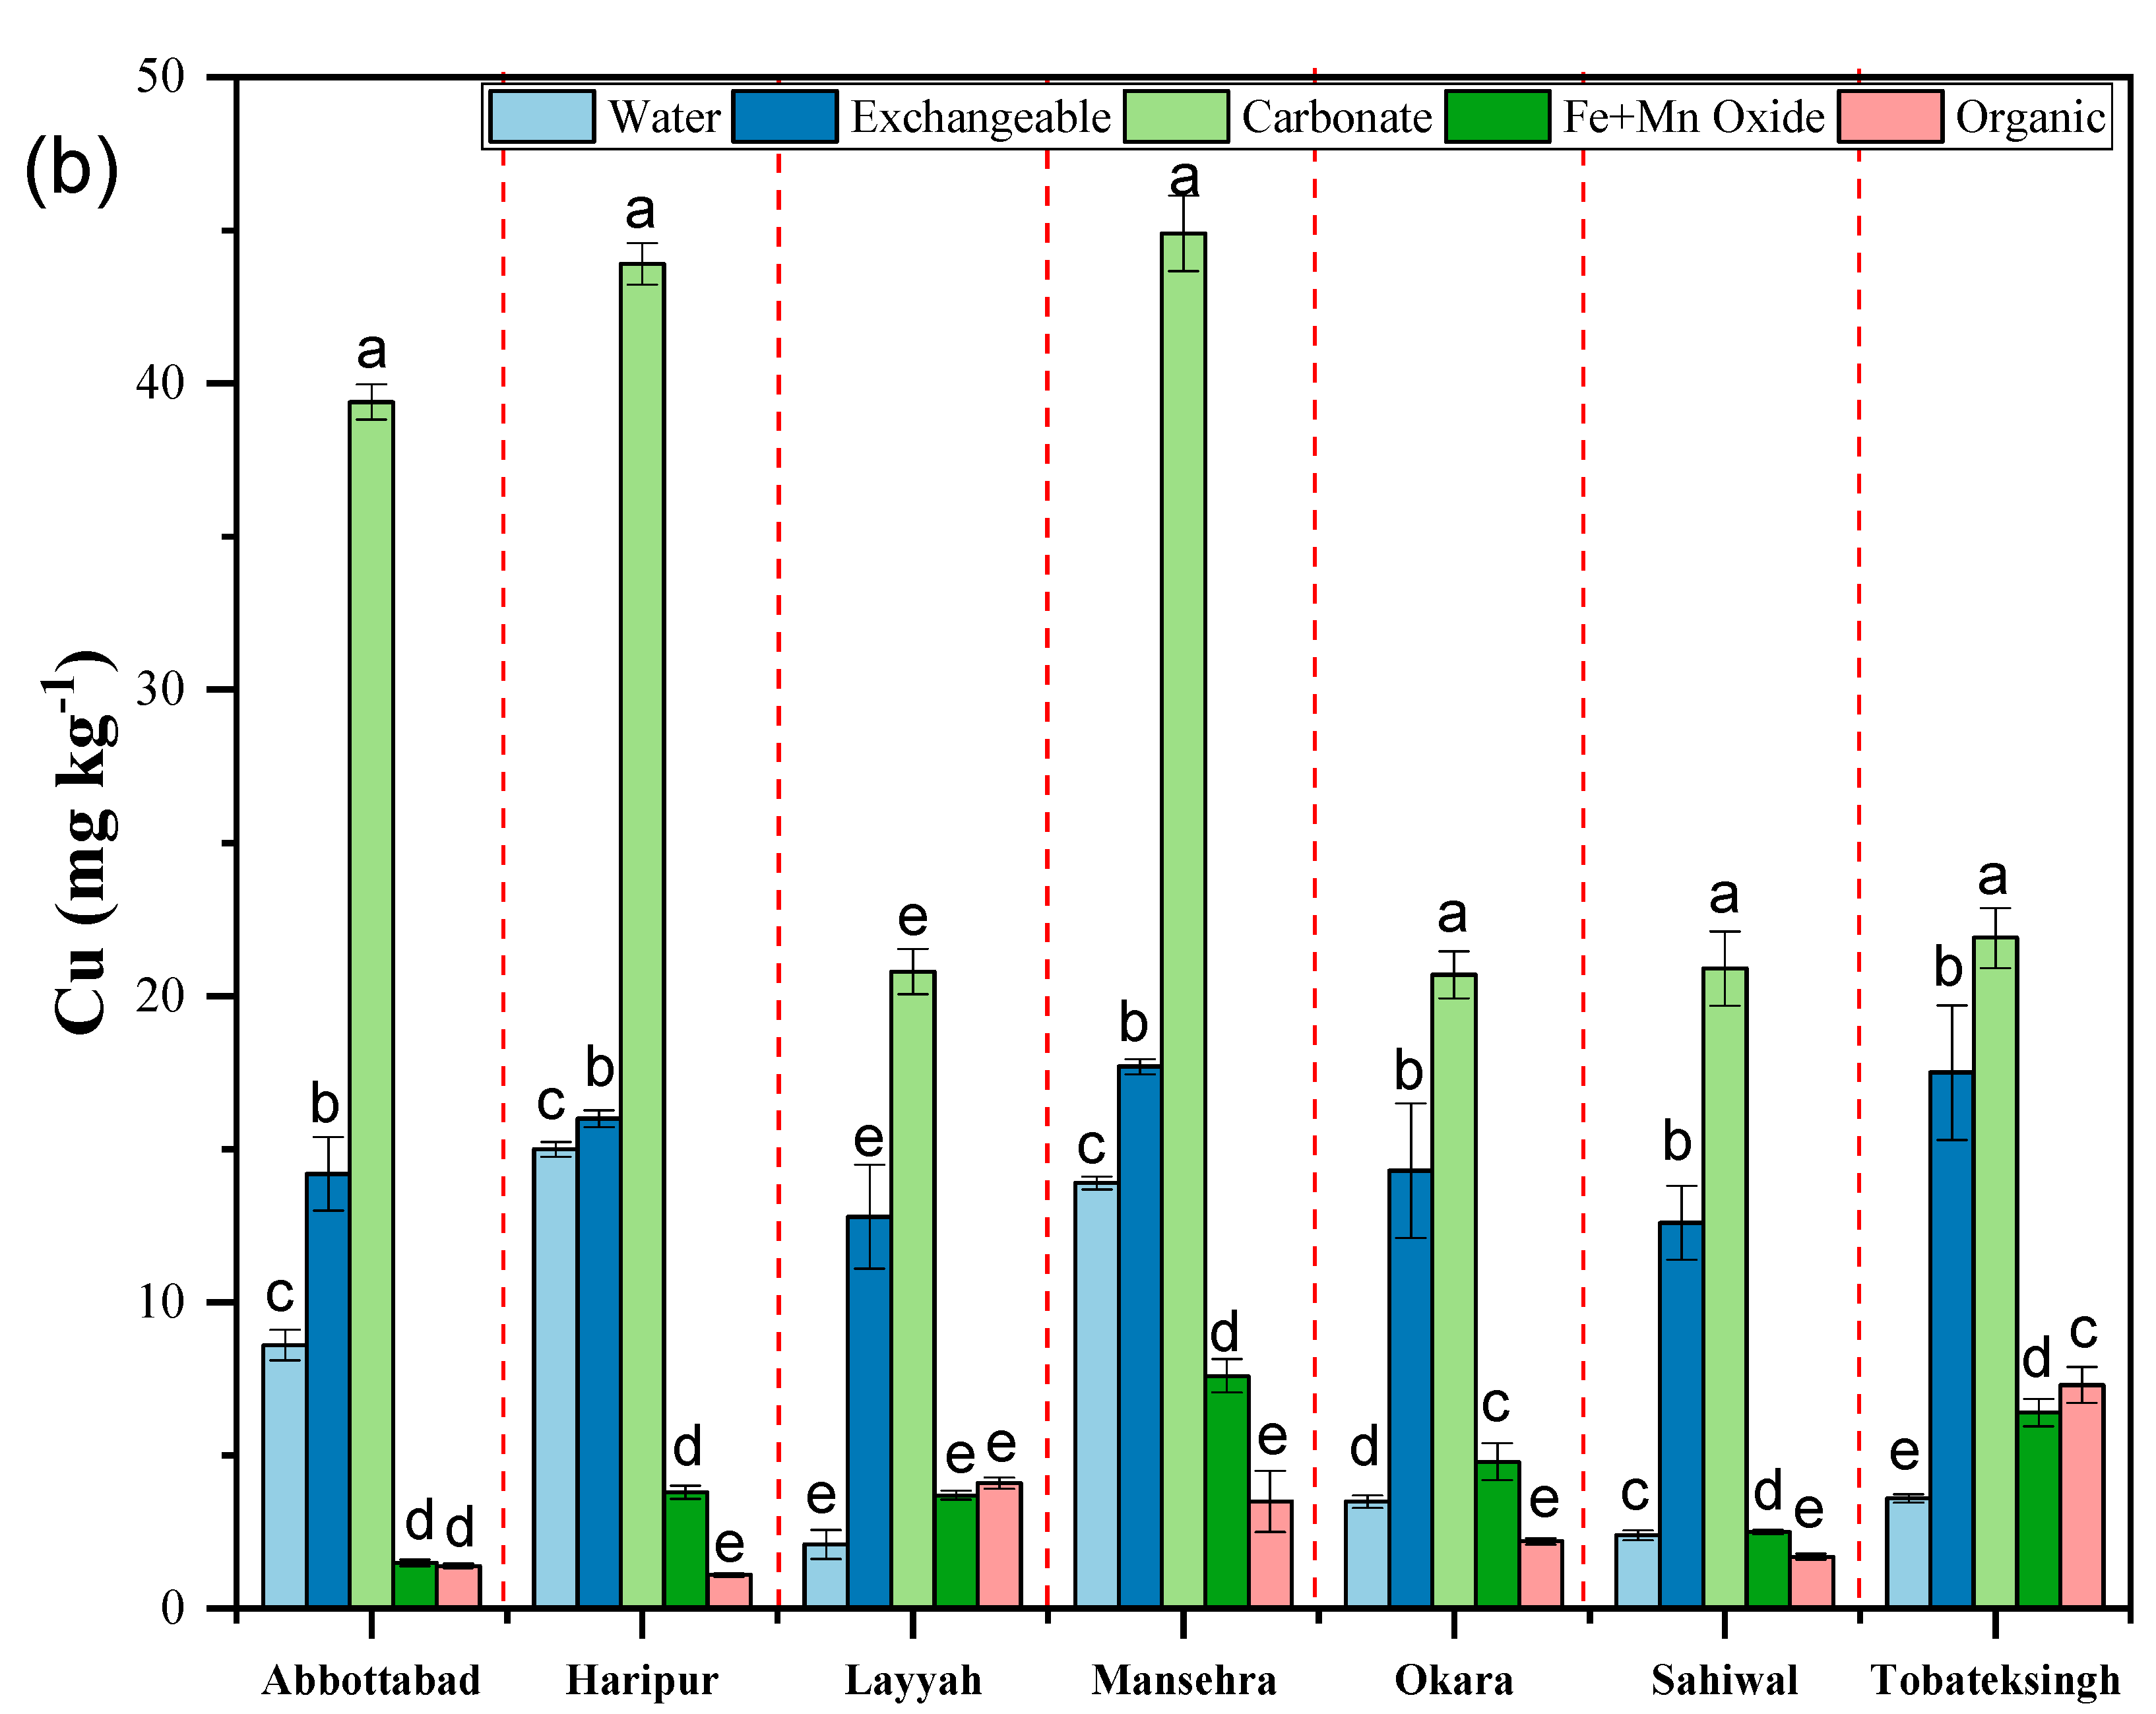
3.2. Fractionation of Micronutrients in Saline and Non-Saline Soils
3.3. Mobility Factor (MF)
3.4. Relationship of EC Values vs. Mobility Factor
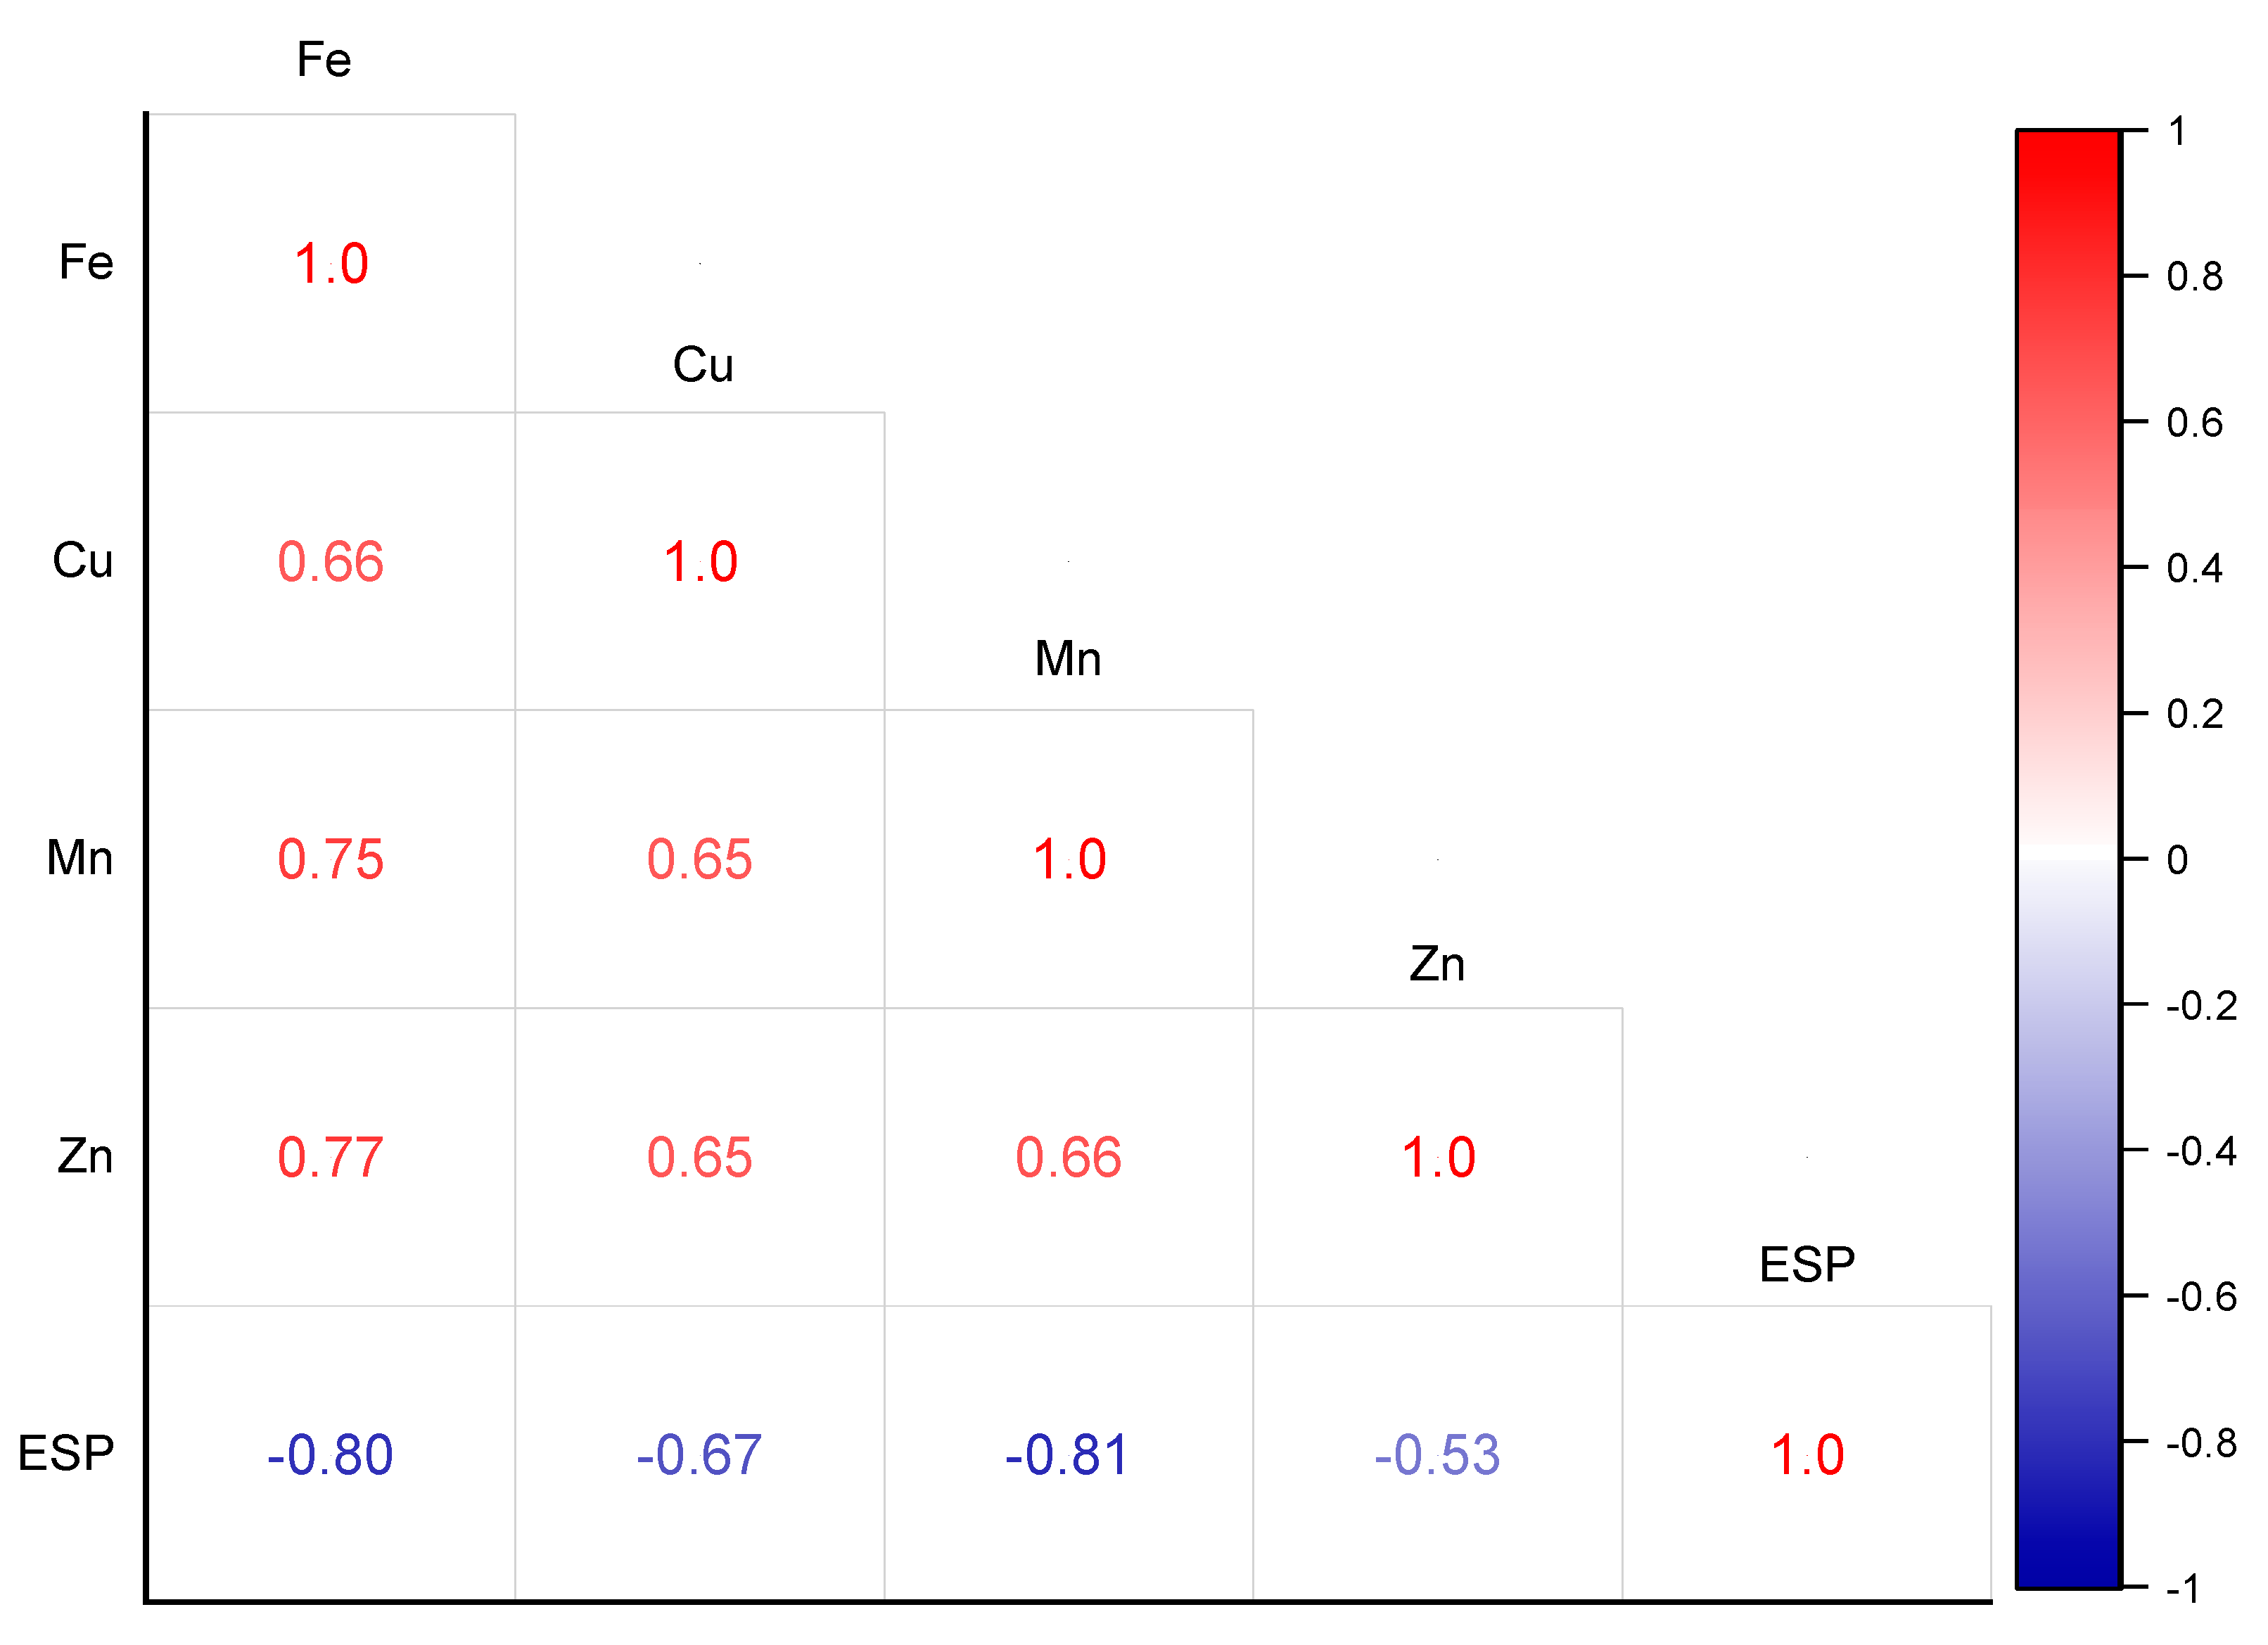
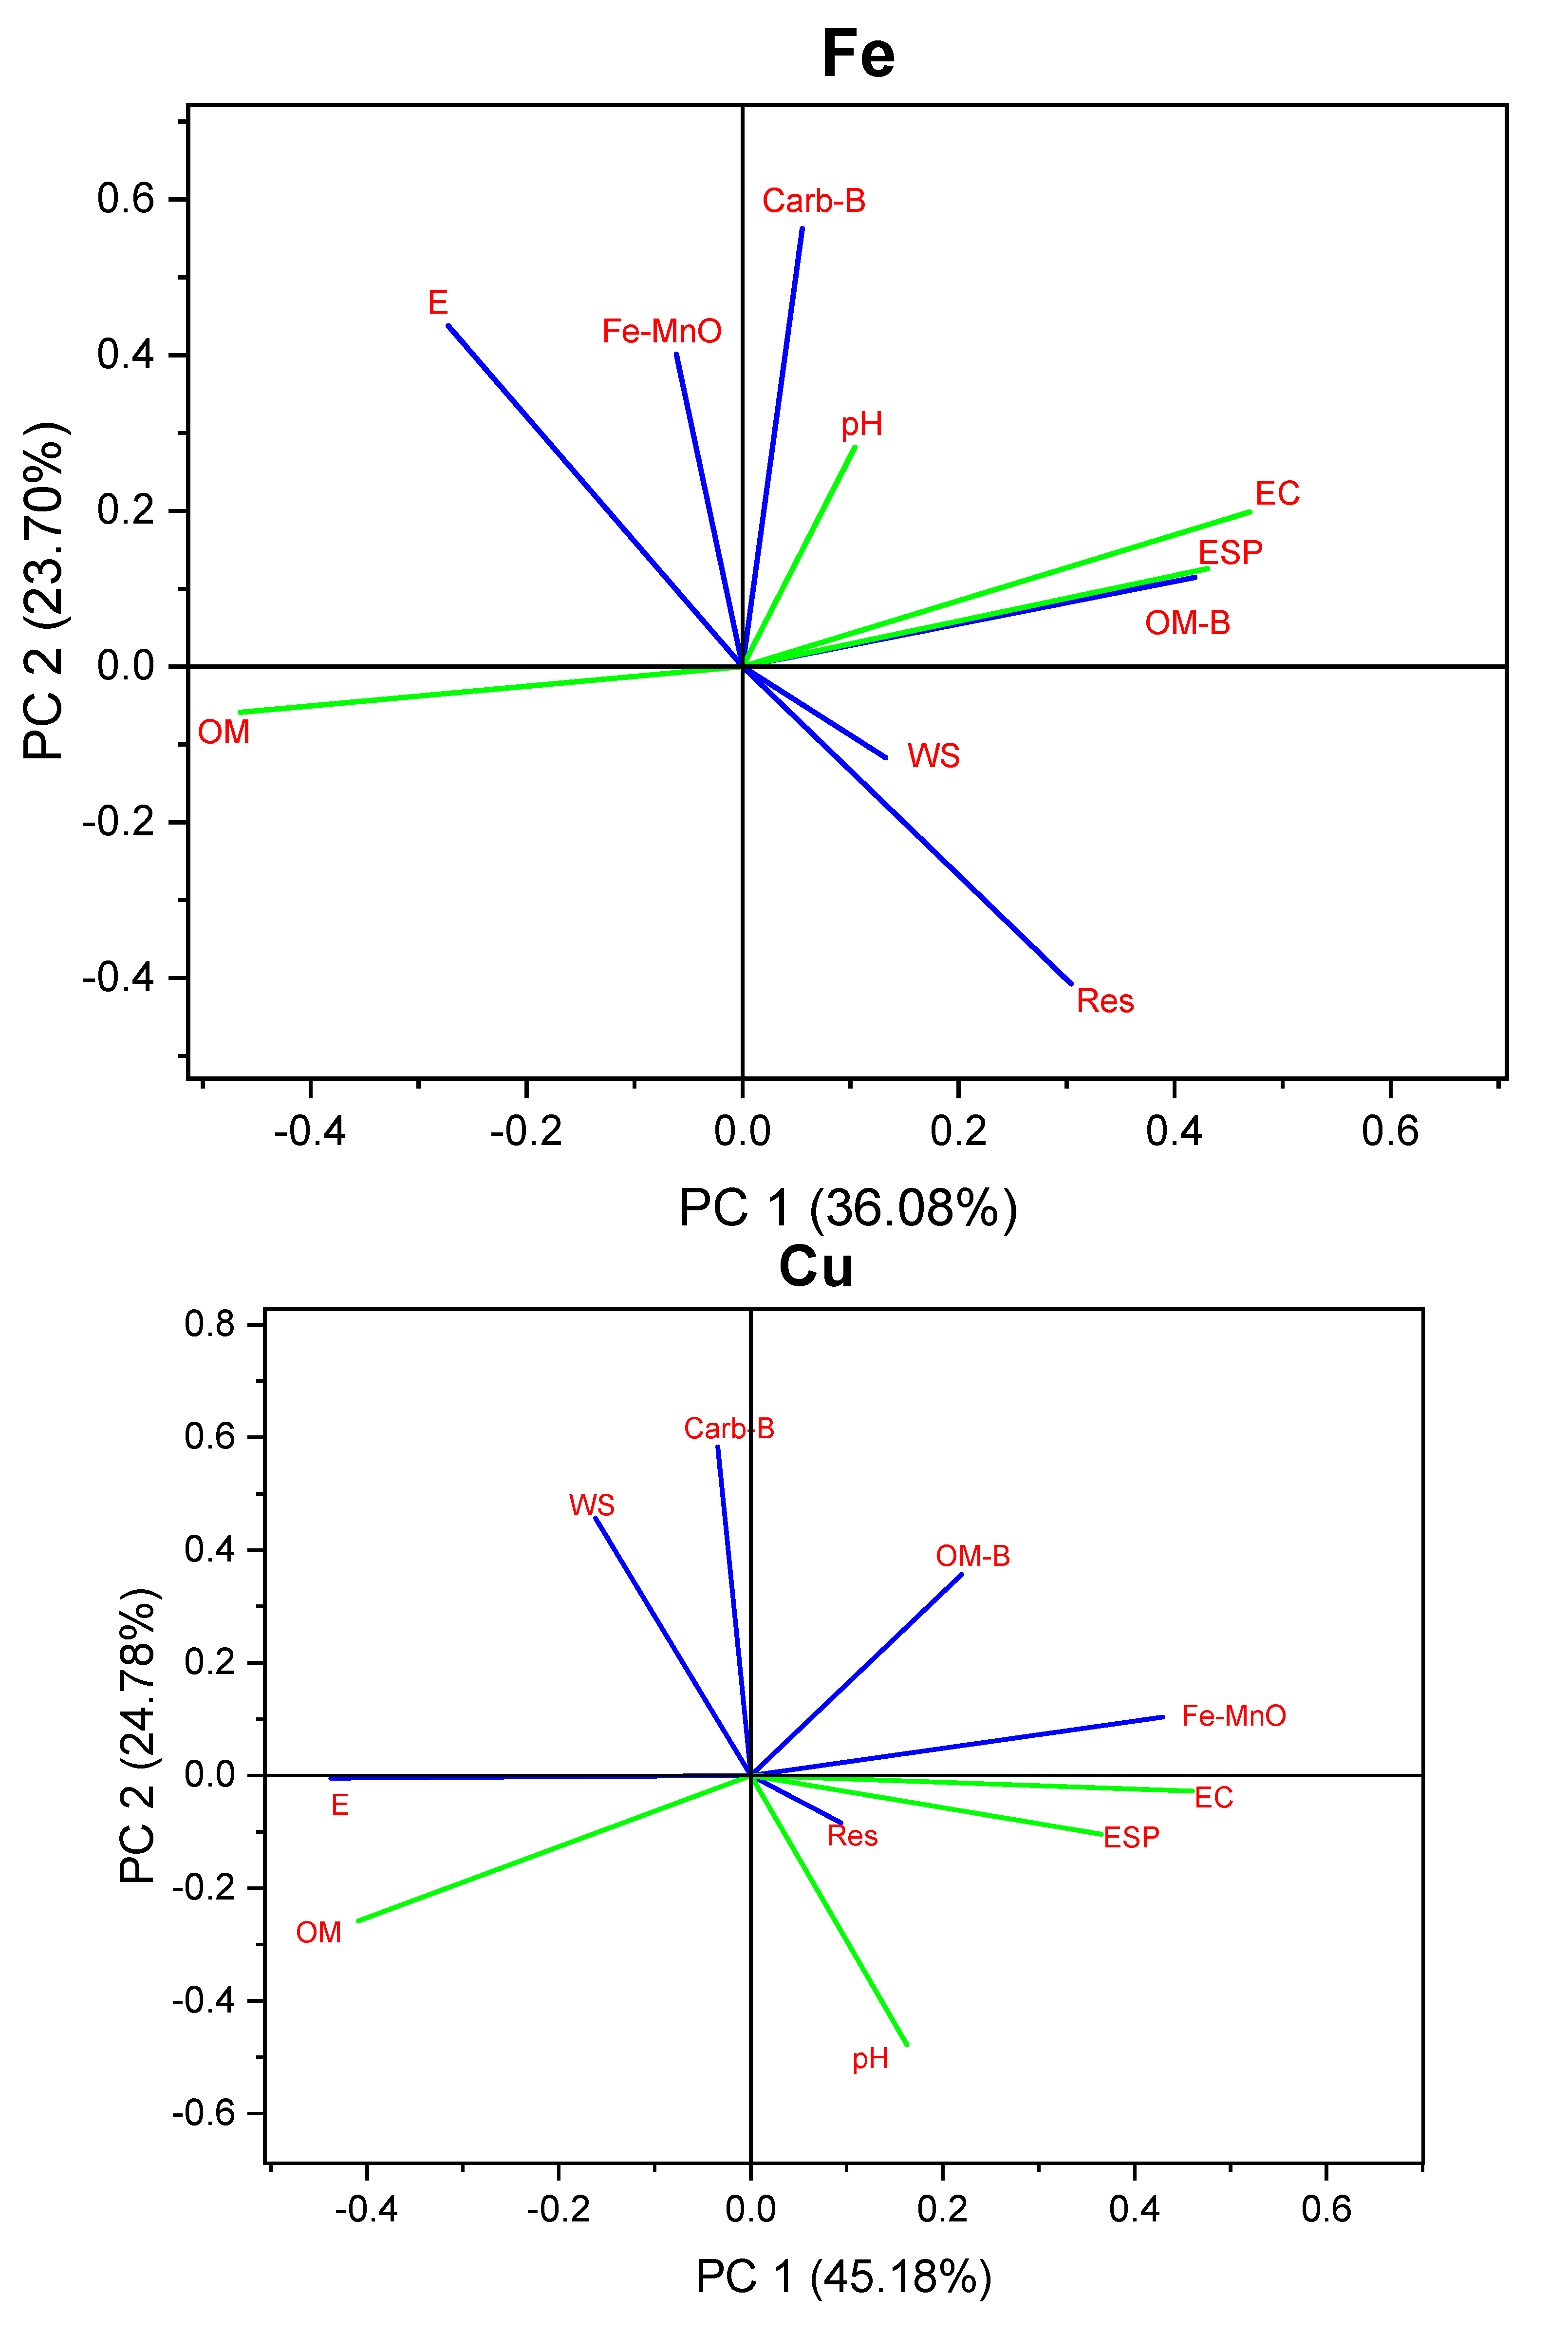
3.5. Multivariate Analyses
4. Conclusions
Supplementary Materials
Author Contributions
Funding
Informed Consent Statement
Acknowledgments
Conflicts of Interest
References
- Suchdev, P.S.; Jefferds, M.E.D.; Ota, E.; da Silva Lopes, K.; De-Regil, L.M. Home fortification of foods with multiple micronutrient powders for health and nutrition in children under two years of age. Cochrane Database Syst. Rev. 2011, 7, CD008959. [Google Scholar] [CrossRef]
- Bailey, R.L.; West, K.P., Jr.; Black, R.E. The epidemiology of global micronutrient deficiencies. Ann. Nutr. Metab. 2015, 66, 22–33. [Google Scholar] [CrossRef]
- Aulakh, M.S.; Grant, C.A. (Eds.) Integrated Nutrient Management for Sustainable Crop Production; The Haworth Press/Taylor & Francis Group: New York, NY, USA, 2008; Volume 2. [Google Scholar]
- Sekhon, K.S.; Singh, J.P.; Mehla, D.S. Long-term effect of organic/inorganic input on the distribution of zinc and copper in soil fractions under a rice–wheat cropping system. Arch. Agron. Soil Sci. 2006, 52, 551–561. [Google Scholar] [CrossRef]
- Barker, A.V.; Pilbeam, D.J. (Eds.) Handbook of Plant Nutrition; CRC Press: Boca Raton, FL, USA, 2015. [Google Scholar]
- Noll, M.R. Trace elements in terrestrial environments: Biogeochemistry, bioavailability, and risks of metals. J. Environ. Qual. 2003, 32, 374. [Google Scholar] [CrossRef]
- Dhaliwal, S.; Naresh, R.; Mandal, A.; Singh, R.; Dhaliwal, M. Dynamics and transformations of micronutrients in agricultural soils as influenced by organic matter build-up: A review. Environ. Sustain. Indic. 2019, 1, 100007. [Google Scholar] [CrossRef]
- Shukla, A.K.; Malik, R.; Tiwari, P.K.; Prakash, C.; Behera, S.K.; Yadav, H.; Narwal, R. Status of micronutrient deficiencies in soils of Haryana. Indian J. Fertil. 2015, 11, 16–27. [Google Scholar]
- Rengel, Z. Availability of Mn, Zn and Fe in the rhizosphere. J. Soil Sci. Plant Nutr. 2015, 15, 397–409. [Google Scholar] [CrossRef] [Green Version]
- Agrawal, R.; Kumar, B.; Priyanka, K.; Narayan, C.; Shukla, K.; Sarkar, J. Micronutrient fractionation in coal mine-affected agricultural soils, India. Bull. Environ. Contam. Toxicol. 2016, 96, 449–457. [Google Scholar] [CrossRef]
- Munns, R. Comparative physiology of salt and water stress. Plant Cell Environ. 2002, 25, 239–250. [Google Scholar] [CrossRef] [PubMed]
- Uddin, M.; Juraimi, A.S.; Ismail, M.; Hossain, M.; Othman, R.; Abdul Rahim, A. Physiological and growth responses of six turfgrass species relative to salinity tolerance. Sci. World J. 2012, 2012, 905468. [Google Scholar] [CrossRef] [Green Version]
- Tozlu, I.; Moore, G.A.; Guy, C.L. Effects of increasing NaCl concentration on stem elongation, dry mass production, and macro-and micro-nutrient accumulation in Poncirus trifoliata. Funct. Plant Biol. 2000, 27, 35–42. [Google Scholar] [CrossRef]
- Eskandari, S.; Mozaffari, V. Interactive effect of soil salinity and copper application on growth and chemical composition of pistachio seedlings (cv. Badami). Commun. Soil Sci. Plant Anal. 2014, 45, 688–702. [Google Scholar] [CrossRef]
- Keshavarz, P.; Malakouti, M.; Karimian, N.; Fotovat, A. The effects of salinity on extractability and chemical fractions of zinc in selected calcareous soils of Iran. J. Agric. Sci. Technol. 2006, 8, 181–190. [Google Scholar]
- Adriano, D.C. Trace Elements in Terrestrial Environments: Biogeochemistry, Bioavailability, and Risks of Metals; Springer: New York, NY, USA, 2001; Volume 860. [Google Scholar]
- Alloway, B. Zinc in Soils and Crop Nutrition; International Zinc Association (IZA): Brussels, Belgium; International Fertilizer Industry Association (IFA): Paris, France, 2008. [Google Scholar]
- Oluwatosin, G.; Adeyolanu, O.; Dauda, T.; Akinbola, G. Levels and geochemical fractions of Cd, Pb and Zn in valley bottom soils of some urban cities in southwestern Nigeria. Afr. J. Biotechnol. 2008, 7, 3455–3465. [Google Scholar]
- Nkinahamira, F.; Suanon, F.; Chi, Q.; Li, Y.; Feng, M.; Huang, X.; Yu, C.-P.; Sun, Q. Occurrence, geochemical fractionation, and environmental risk assessment of major and trace elements in sewage sludge. J. Environ. Manag. 2019, 249, 109427. [Google Scholar] [CrossRef] [PubMed]
- Palleiro, L.; Patinha, C.; Rodríguez-Blanco, M.; Taboada-Castro, M.; Taboada-Castro, M. Metal fractionation in topsoils and bed sediments in the Mero River rural basin: Bioavailability and relationship with soil and sediment properties. Catena 2016, 144, 34–44. [Google Scholar] [CrossRef]
- Shaheen, S.M.; Rinklebe, J.; Tsadilas, C.D. Fractionation and mobilization of toxic elements in floodplain soils from Egypt, Germany, and Greece: A comparison study. Eurasian Soil Sci. 2015, 48, 1317–1328. [Google Scholar] [CrossRef]
- Tessier, A.; Campbell, P.G.; Bisson, M. Sequential extraction procedure for the speciation of particulate trace metals. Anal. Chem. 1979, 51, 844–851. [Google Scholar] [CrossRef]
- Shuman, L. Fractionation method for soil microelements. Soil Sci. 1985, 140, 11–22. [Google Scholar] [CrossRef]
- Alvarez, J.M.; Lopez-Valdivia, L.M.; Novillo, J.; Obrador, A.; Rico, M.I. Comparison of EDTA and sequential extraction tests for phytoavailability prediction of manganese and zinc in agricultural alkaline soils. Geoderma 2006, 132, 450–463. [Google Scholar] [CrossRef]
- Tazisong, I.; Senwo, Z.; Taylor, R.; Mbila, M.; Wang, Y. Concentration and distribution of iron and manganese fractions in Alabama Ultisols. Soil Sci. 2004, 169, 489–496. [Google Scholar] [CrossRef]
- Borůvka, L.; Vacek, O.; Jehlička, J. Principal component analysis as a tool to indicate the origin of potentially toxic elements in soils. Geoderma 2005, 128, 289–300. [Google Scholar] [CrossRef]
- Lorenzoni, P.; Spadoni, M.; De Simone, C. Distribution of heavy metals in calcareous soils of central Italy: A multivariate approach. Fresenius Environ. Bull. 1998, 7, 678–684. [Google Scholar]
- Tokalioğlu, Ş.; Kartal, Ş.; Güneş, A.A. Statistical evaluation of bioavailability of metals to grapes growing in contaminated vineyard soils using single extractants. Int. J. Environ. Anal. Chem. 2004, 84, 691–705. [Google Scholar] [CrossRef]
- Leštan, D.; Grčman, H.; Zupan, M.; Bačac, N. Relationship of soil properties to fractionation of Pb and Zn in soil and their uptake into Plantago lanceolata. Soil Sediment Contam. 2003, 12, 507–522. [Google Scholar] [CrossRef]
- Sharma, B.; Arora, H.; Kumar, R.; Nayyar, V. Relationships between soil characteristics and total and DTPA-extractable micronutrients in Inceptisols of Punjab. Commun. Soil Sci. Plant Anal. 2004, 35, 799–818. [Google Scholar] [CrossRef]
- Anwari, G.; Mandozai, A.; Feng, J. Effects of biochar amendment on soil problems and improving rice production under salinity conditions. Adv. J. Grad. Res. 2020, 7, 45–63. [Google Scholar] [CrossRef] [Green Version]
- Egamberdieva, D.; Wirth, S.; Bellingrath-Kimura, S.D.; Mishra, J.; Arora, N.K. Salt-tolerant plant growth promoting rhizobacteria for enhancing crop productivity of saline soils. Front. Microbiol. 2019, 10, 2791. [Google Scholar] [CrossRef] [Green Version]
- Rouphael, Y.; Petropoulos, S.A.; Cardarelli, M.; Colla, G. Salinity as eustressor for enhancing quality of vegetables. Sci. Hortic. 2018, 234, 361–369. [Google Scholar] [CrossRef]
- Soomro, K.B.; Alaghmand, S.; Shaikh, M.M.; Andriyas, S.; Talei, A. Response of Salts in Saline Soil Using Different Irrigation Scheduling in Semi-Arid Zone of Pakistan. Pak. J. Sci. Ind. Res. Ser. A Phys. Sci. 2021, 64, 110–118. [Google Scholar] [CrossRef]
- Rahman, K.U.; Shang, S.; Shahid, M.; Wen, Y. Performance assessment of SM2RAIN-CCI and SM2RAIN-ASCAT precipitation products over Pakistan. Remote Sens. 2019, 11, 2040. [Google Scholar] [CrossRef] [Green Version]
- Li, F.; Fan, Z.; Xiao, P.; Oh, K.; Ma, X.; Hou, W. Contamination, chemical speciation and vertical distribution of heavy metals in soils of an old and large industrial zone in Northeast China. Environ. Geol. 2009, 57, 1815–1823. [Google Scholar] [CrossRef]
- Ben-Dor, E.; Banin, A. Determination of organic matter content in arid-zone soils using a simple “loss-on-ignition” method. Commun. Soil Sci. Plant Anal. 1989, 20, 1675–1695. [Google Scholar] [CrossRef]
- Kabala, C.; Singh, B.R. Fractionation and mobility of copper, lead, and zinc in soil profiles in the vicinity of a copper smelter. J. Environ. Qual. 2001, 30, 485–492. [Google Scholar] [CrossRef] [PubMed] [Green Version]
- Bastida, F.; Zsolnay, A.; Hernández, T.; García, C. Past, present and future of soil quality indices: A biological perspective. Geoderma 2008, 147, 159–171. [Google Scholar] [CrossRef]
- Ponizovsky, A.A.; Allen, H.E.; Ackerman, A.J. Copper activity in soil solutions of calcareous soils. Environ. Pollut. 2007, 145, 1–6. [Google Scholar] [CrossRef]
- Adamo, P.; Agrelli, D.; Zampella, M. Chapter 9—Chemical Speciation to Assess Bioavailability, Bioaccessibility and Geochemical Forms of Potentially Toxic Metals (PTMs) in Polluted Soils. In Environmental Geochemistry, 2nd ed.; de Vivo, B., Harvey, E.B., Annamaria, L., Eds.; Elsevier: Amsterdam, The Netherlands, 2018; pp. 153–194. [Google Scholar]
- Graf, M.; Lair, G.; Zehetner, F.; Gerzabek, M. Geochemical fractions of copper in soil chronosequences of selected European floodplains. Environ. Pollut. 2007, 148, 788–796. [Google Scholar] [CrossRef]
- Gong, Y.; Zhao, D.; Wang, Q. An overview of field-scale studies on remediation of soil contaminated with heavy metals and metalloids: Technical progress over the last decade. Water Res. 2018, 147, 440–460. [Google Scholar] [CrossRef]
- Olajire, A.; Ayodele, E.; Oyedirdan, G.; Oluyemi, E. Levels and speciation of heavy metals in soils of industrial southern Nigeria. Environ. Monit. Assess. 2003, 85, 135–155. [Google Scholar] [CrossRef]
- Bolan, N.; Adriano, D.; Mahimairaja, S. Distribution and bioavailability of trace elements in livestock and poultry manure by-products. Crit. Rev. Environ. Sci. Technol. 2004, 34, 291–338. [Google Scholar] [CrossRef]
- Iwegbue, C.; Emuh, F.; Isirimah, N.; Egun, A. Fractionation, characterization and speciation of heavy metals in composts and compost-amended soils. Afr. J. Biotechnol. 2007, 6, 67–78. [Google Scholar] [CrossRef]
- Kihara, J.; Bolo, P.; Kinyua, M.; Rurinda, J.; Piikki, K. Micronutrient deficiencies in African soils and the human nutritional nexus: Opportunities with staple crops. Environ. Geochem. Health 2020, 42, 3015–3033. [Google Scholar] [CrossRef] [PubMed] [Green Version]
- Torri, S.; Lavado, R. Dynamics of Cd, Cu and Pb added to soil through different kinds of sewage sludge. Waste Manag. 2008, 28, 821–832. [Google Scholar] [CrossRef]
- Gilkes, R.J.; McKenzie, R.M. Geochemistry and mineralogy of manganese in soils. In Manganese in Soils and Plants; Graham, R.D., Hannam, R.J., Uren, N.C., Eds.; Springer: Dordrecht, The Netherlands, 1988; pp. 23–35. [Google Scholar]
- Shibli, R.; Mohammad, M.; Abu-Ein, A.; Shatnawi, M. Growth and micronutrient acquisition of some apple varieties in response to gradual in vitro induced salinity. J. Plant Nutr. 2000, 23, 1209–1215. [Google Scholar] [CrossRef]
- Swarup, A. Effect of exchangeable sodium percentage and presubmergence on yield and nutrition of rice under field conditions. Plant Soil 1985, 85, 279–288. [Google Scholar] [CrossRef]
- Xue, N.; Seip, H.M.; Guo, J.; Liao, B.; Zeng, Q. Distribution of Al-, Fe-and Mn-pools and their correlation in soils from two acid deposition small catchments in Hunan, China. Chemosphere 2006, 65, 2468–2476. [Google Scholar] [CrossRef]
- Fujikawa, Y.; Fukui, M.; Kudo, A. Vertical distributions of trace metals in natural soil horizons from Japan. Part 1. Effect of soil types. Water Air Soil Pollut. 2000, 124, 1–21. [Google Scholar] [CrossRef]
- Boudesocque, S.; Guillon, E.; Aplincourt, M.; Marceau, E.; Stievano, L. Sorption of Cu (II) onto vineyard soils: Macroscopic and spectroscopic investigations. J. Colloid Interface Sci. 2007, 307, 40–49. [Google Scholar] [CrossRef]
- Tessier, A.; Fortin, D.; Belzile, N.; DeVitre, R.; Leppard, G. Metal sorption to diagenetic iron and manganese oxyhydroxides and associated organic matter: Narrowing the gap between field and laboratory measurements. Geochim. Cosmochim. Acta 1996, 60, 387–404. [Google Scholar] [CrossRef]
- Taylor, R.W.; Xiu, H.; Mehadi, A.A.; Shuford, J.W.; Tadesse, W. Fractionation of residual cadmium, copper, nickel, lead, and zinc in previously sludge-amended soil. Commun. Soil Sci. Plant Anal. 1995, 26, 2193–2204. [Google Scholar] [CrossRef]
- Ma, L.Q.; Rao, G.N. Chemical fractionation of cadmium, copper, nickel, and zinc in contaminated soils. J. Environ. Qual. 1997, 26, 259–264. [Google Scholar] [CrossRef] [Green Version]
- Jahiruddin, M.; Chambers, B.; Cresser, M.; Livesey, N. Effects of soil properties on the extraction of zinc. Geoderma 1992, 52, 199–208. [Google Scholar] [CrossRef]
- Shuman, L.M. Micronutrient fertilizers. J. Crop Prod. 1998, 1, 165–195. [Google Scholar] [CrossRef]
- Fan, T.-T.; Wang, Y.-J.; Li, C.-B.; He, J.-Z.; Gao, J.; Zhou, D.-M.; Friedman, S.P.; Sparks, D.L. Effect of organic matter on sorption of Zn on soil: Elucidation by Wien effect measurements and EXAFS spectroscopy. Environ. Sci. Technol. 2016, 50, 2931–2937. [Google Scholar] [CrossRef] [PubMed]
- Zhu, Y.-G.; Smith, F.; Smith, S. Phosphorus efficiencies and their effects on Zn, Cu, and Mn nutrition of different barley (Hordeum vulgare) cultivars grown in sand culture. Aust. J. Agric. Res. 2002, 53, 211–216. [Google Scholar] [CrossRef]
- Zhu, B.; Alva, A. The chemical forms of Zn and Cu extractable by Mehlich 1, Mehlich 3, and ammonium bicarbonate-DTPA extractions. Soil Sci. 1993, 156, 251–258. [Google Scholar] [CrossRef]


| Reagents | Soil (g) | Solution Volume (mL) | Fractionation Process | Fraction Type | |
|---|---|---|---|---|---|
| 1. | Water (pH = 7) | 5 | 50 | The sample was shaken in a beaker for 1 h at 200 rpm and then filtered and centrifuged. | Water-soluble |
| 2. | (NH4COOCH3) solution (pH 7.0) | Residue from step 1 | 40 | The residue from the above was extracted with 40 mL of ammonium acetate and shaken for 1 h at 200 rpm at room temperature. After centrifugation, the supernatant solution was filtered and analyzed. | Exchangeable fraction |
| 3. | 1 M sodium acetate (pH 5.0 with acetic acid) | Residue from above step | 40 | The soil residue was extracted with 1 M sodium acetate (NaCOOCH3) and adjusted to pH 5.0 with acetic acid (CH3COOH). The suspension was shaken for 5 h. | Carbonate-bound fraction |
| 4. | 0.05 M hydroxylamine hydrochloride acetic acid | Residue from the above step | 100 | To the residue, 100 mL of 0.05 M hydroxylamine hydrochloride was added to 25% (v/v) acetic acid and extracted at 95 ± 2 °C in a water bath, stirred for 6 h. After centrifugation, we washed the residue with 20 mL of water (20 mL), filtered, and washed in combination with the original extract to form a total volume of 100 mL. | Iron-manganese oxide bound |
| 5. | 0.02 M HNO3 30% H2O2 (adjusted at pH 2 with HNO3). 3.2 M ammonium acetate | Residue from above | 20 | The residue from above was extracted with 10 mL of 0.02 M HNO3 and 15 mL of 30% H2O2 (adjusted at pH 2 with HNO3). The mixture was then heated to 85o C for 5 h with occasional agitation. A second 15 mL aliquot of 30% (pH 2 with HNO3) was added and the mixture was heated again to 85o C for 3 h with intermittent agitation. After cooling, 5 mL of 3.2 M ammonium acetate (NH4COOCH3) in 20% HNO3 (v/v) was added, and the samples were diluted to 20 mL and agitated continuously for 30 min. After centrifuging, the residue was washed with 20 mL of water, and the washings were added to the extracted solution after filtration to make up a final volume of l00 mL. | Bound to organic matter |
| 6. | Perchloric acid (HClO4), hydrogen fluoride (HF), hydrochloric (HCl) acid | (1 g) | 100 mL | The soil sample was taken from the above and treated with 2 mL of 70% perchloric acid (HclO4) and 10 mL of hydrogen fluoride (70% HF) in a platinum crucible. The contents were digested on a hot plate, and when the residue became a paste, 1 mL of HClO4 and 10 mL of HF were added. Again, the contents were digested to near dryness. Finally, 1 mL of HClO4 was added and evaporated again until the appearance of white fumes. The contents were then dissolved in 6 N hydrochloric acid (HCl), filtered, made up to 100 mL, then kept in clean plastic bottles for analytical work. | Residual fraction |
| Classification | Electrical Conductivity (d S m−1) | pH | Exchangeable Sodium Percentage (ESP) |
|---|---|---|---|
| Normal | <4.0 | <13 | <15 |
| Saline | >4.0 | <8.5 | <15 |
| Sodic | <4.0 | >8.5 | >15 |
| Saline sodic | >4.0 | <8.5 | >15 |
| Soil Type | Sampling Area | pH (1:10) | EC | ESP | CEC | OM | Residual Fe | Residual Cu |
|---|---|---|---|---|---|---|---|---|
| dS m−1 | % | cmolc kg−1 | % | mg kg−1 | ||||
| Saline | Bahawalpur | 8.27 ± 0.5 | 4.50 ± 0.1 | 16.43 | 1.86 ± 0.4 | 1.8 ± 0.2 | 85.4 ± 2.6 | 98.6 ± 3.6 |
| Charsada | 8.6 ± 0.2 | 7.18 ± 0.6 | 18.69 | 1.93 ± 0.1 | 0.5 ± 0.01 | 75.1 ± 3.5 | 92.0 ± 2.5 | |
| Gujranwala | 8.17 ± 0.4 | 5.16 ± 0.1 | 10.76 | 1.45 ± 0.2 | 1.3 ± 0.5 | 49.9 ± 4.1 | 66.4 ± 4.6 | |
| Khewra | 9.59 ± 1.2 | 8.53 ± 0.2 | 21.85 | 2.24 ± 0.9 | 0.6 ± 0.01 | 45.3 ± 3.2 | 75.6 ± 2.9 | |
| Mian channu | 8.15 ± 0.9 | 4.81 ± 0.7 | 20.65 | 1.82 ± 0.3 | 1.6 ± 0.3 | 63.9 ± 2.5 | 80.2 ± 3.6 | |
| Mianwali | 8.44 ± 0.4 | 4.72 ± 0.8 | 8.63 | 2.05 ± 0.95 | 1.4 ± 0.4 | 35.6 ± 3.6 | 91.9 ± 4.3 | |
| Multan | 8.16 ± 1.1 i | 5.37 ± 0.3 | 10.81 | 1.82 ± 0.8 | 1.98 ± 0.2 | 52.7 ± 3.3 | 67.0 ± 2.9 | |
| Non-saline | Abbottabad | 8.14 ± 1.2 | 0.16 ± 0.1 | 3.73 | 1.28 ± 0.7 | 1.2 ± 0.1 | 51.7 ± 2.8 | 84.9 ± 3.6 |
| Haripur | 8.16 ± 0.8 i | 0.15 ± 0.06 | 6.15 | 1.18 ± 0.6 | 1.5 ± 0.05 | 39.0 ± 2.5 | 73.9 ± 3.8 | |
| Layyah | 8.6 ± 0.2 | 0.77 ± 0.1 | 7.79 | 1.77 ± 0.55 | 2.45 ± 1.2 | 38.4 ± 2.3 | 94.8 ± 3.5 | |
| Mansehra | 8.22 ± 0.6 | 0.18 ± 0.04 | 8.01 | 1.35 ± 0.45 | 3.21 ± 1.3 | 48.2 ± 2.8 | 80.1 ± 2.8 | |
| Okara | 8.46 ± 0.8 | 0.39 ± 0.1 | 7.32 | 1.96 ± 0.56 | 2.7 ± 0.2 | 51.6 ± 3.6 | 67.4 ± 3.5 | |
| Sahiwal | 8.63 ± 0.8 | 0.45 ± 0.05 | 7.792 | 1.77 ± 0.64 | 2.9 ± 0.9 | 51.7 ± 3.4 | 82.4 ± 2.8 | |
| Tobateksingh | 8.32 ± 0.9 | 0.62 ± 0.02 | 10.2 | 1.44 ± 0.77 | 2.5 ± 0.8 | 58.5 ± 2.5 | 53.7 ± 3.9 | |
| LSD (0.05) | 0.3 | 0.2 | 0.5 | 6.8 | 1.2 | 5.9 | 6.5 | |
| Soil | Sampling Area | N | Cl | P | HCO3 | Ca | Mg | K | Na |
|---|---|---|---|---|---|---|---|---|---|
| % | mg kg−1 | Cmolc kg−1 | |||||||
| Saline | Bahawalpur | 1.1 ± 0.2 | 1.7 ± 0.2 | 0.4 ± 0.03 | 5.8 ± 0.8 | 0.89 | 0.53 | 0.12 | 0.30 |
| Charsada | 2.1 ± 0.2 | 6.7 ± 0.4 | 0.26 ± 0.05 | 5.8 ± 0.4 | 0.73 | 0.61 | 0.22 | 0.36 | |
| Gujranwala | 3.1 ± 0.3 | 4.4 ± 0.4 | 0.15 ± 0.04 | 4.6 ± 0.4 | 0.71 | 0.50 | 0.08 | 0.15 | |
| Khewra | 0.9 ± 0.1 | 10.8 ± 0.3 | 0.16 ± 0.02 | 9.4 ± 0.6 | 0.89 | 0.53 | 0.32 | 0.49 | |
| Mian channu | 0.8 ± 0.1 | 1.5 ± 0.2 | 0.4 ± 0.01 | 5.8 ± 0.4 | 0.89 | 0.43 | 0.12 | 0.37 | |
| Mianwali | 1.9 ± 0.3 | 3.4 ± 0.3 | 0.11 ± 0.01 | 5.1 ± 0.5 | 1.19 | 0.57 | 0.11 | 0.17 | |
| Multan | 1.4 ± 0.2 | 4.9 ± 0.4 | 0.13 ± 0.05 | 4.6 ± 0.3 | 0.84 | 0.68 | 0.09 | 0.19 | |
| Non-saline | Abbottabad | 5.5 ± 0.2 | 0.1 ± 0.01 | 13.7 ± 0.06 | 0.3 ± 0.01 | 0.55 | 0.55 | 0.12 | 0.04 |
| Haripur | 6.7 ± 0.5 | 0.02 ± 0.01 | 12.0 ± 0.02 | 0.2 ± 0.02 | 0.56 | 0.38 | 0.16 | 0.07 | |
| Layyah | 6.4 ± 0.6 | 2.3 ± 0.2 | 11.3 ± 0.01 | 0.4 ± 0.02 | 0.67 | 0.70 | 0.25 | 0.13 | |
| Mansehra | 5.3 ± 0.3 | 0.01 ± 0.01 | 13.8 ± 0.04 | 0.6 ± 0.01 | 0.71 | 0.46 | 0.07 | 0.10 | |
| Okara | 7.1 ± 0.9 | 1.4 ± 0.1 | 9.0 ± 0.3 | 1.8 ± 0.2 | 0.95 | 0.74 | 0.12 | 0.14 | |
| Sahiwal | 5.6 ± 0.4 | 2.1 ± 0.1 | 8.6 ± 0.5 | 0.6 ± 0.01 | 0.83 | 0.54 | 0.25 | 0.14 | |
| Tobateksingh | 6.3 ± 0.6 | 0.4 ± 0.1 | 9.2 ± 1.0 | 4.6 ± 0.5 | 0.67 | 0.43 | 0.17 | 0.14 | |
| LSD (0.05) | 0.2 | 0.1 | 0.7 | 0.1 | 0.2 | 0.2 | 0.13 | 0.03 | |
| Soil Type | Sampling Area | Water Soluble | Exch. | Carbonate | Fe + Mn Oxide | Organic Bound | Residual |
|---|---|---|---|---|---|---|---|
| mg kg−1 | |||||||
| Bahawalpur | 7.4 ± 1.2 | 7.7 ± 2.2 | 4.6 ± 0.5 | 2.3 ± 0.3 | 12.7 ± 1.5 | 254.2 ± 12.5 | |
| Saline | Charsada | 24.4 ± 1.5 | 42.3 ± 3.6 | 4.3 ± 0.3 | 6.7 ± 0.9 | 9.4 ± 1.6 | 251.9 ± 13.2 |
| Gujranwala | 30.7 ± 1.3 | 19.2 ± 1.3 | 88.1 ± 7.9 | 75.2 ± 6.2 | 88.7 ± 2.9 | 299.6 ± 13.6 | |
| Kewara | 3.2 ± 1.5 | 21.7 ± 1.4 | 24.3 ± 1.2 | 28.2 ± 1.4 | 33.5 ± 3.3 | 253.9 ± 13.5 | |
| Mian channu | 6.3 ± 2.2 | 1.3 ± 0.2 | 6.9 ± 1.3 | 5.8 ± 0.4 | 34.7 ± 2.5 | 239.4 ± 14.5 | |
| Mianwali | 11.7 ± 2.6 | 41.2 ± 2.3 | 54.6 ± 2.5 | 66.7 ± 7.2 | 73.7 ± 3.2 | 256.6 ± 13.6 | |
| Non-saline | Multan | 17.6 ± 1.1 | 24.9 ± 2.1 | 103.3 ± 4.4 | 12.8 ± 1.1 | 23.9 ± 2.5 | 227.9 ± 10.5 |
| Abbottabad | 17.2 ± 1.3 | 21.3 ± 1.5 | 13.4 ± 1.3 | 18.9 ± 1.1 | 28.9 ± 2.5 | 206.5 ± 14.4 | |
| Haripur | 18.5 ± 1.4 | 27.2 ± 1.5 | 26.4 ± 1.2 | 13.5 ± 1.3 | 13.8 ± 1.2 | 286.4 ± 14.1 | |
| Layyah | 16.4 ± 1.2 | 20.7 ± 1.8 | 12.1 ± 1.1 | 12.2 ± 1.5 | 11.6 ± 1.6 | 184.6 ± 13.2 | |
| Mansehra | 17.5 ± 1.3 | 18.7 ± 1.3 | 19.3 ± 1.1 | 18 ± 1.5 | 16.7 ± 1.4 | 192.6 ± 12.5 | |
| Okara1 | 8.7 ± 1.2 | 30.6 ± 1.3 | 3.4 ± 0.8 | 3.7 ± 0.9 | 7.5 ± 2.5 | 207.8 ± 16.6 | |
| Sahiwal | 16.8 ± 1.3 | 20.2 ± 2.2 | 12.7 ± 1.3 | 12.4 ± 1.6 | 12.7 ± 2.7 | 169.8 ± 15.2 | |
| Tobateksingh | 16.9 ± 1.5 | 22.8 ± 2.6 | 3.7 ± 0.2 | 14.9 ± 1.2 | 10.6 ± 2.78 | 248.4 ± 13.6 | |
| LSD (0.05) | 1.2 | 2.3 | 1.6 | 1.8 | 2.8 | 6.4 | |
| Soil Type | Sampling Area | Water Soluble | Exch. | Carbonate | Fe + Mn Oxide | Organic Bound | Residual |
|---|---|---|---|---|---|---|---|
| mg kg−1 | |||||||
| Saline | Bahawalpur | 3.1 ± 0.2 | 8.2 ± 0.5 | 20.6 ± 2.58 | 11.9 ± 1.3 | 21.8 ± 2.1 | 168.8 ± 3.3 |
| Charsada | 4.9 ± 0.3 | 26.3 ± 1.2 | 25.6 ± 2.2 | 22 ± 2.1 | 41.9 ± 2.5 | 209.1 ± 13.4 | |
| Gujranwala | 4.4 ± 0.3 | 15.4 ± 0.2 | 12.6 ± 0.8 | 15.3 ± 1.1 | 40.6 ± 3.3 | 162.3 ± 13.5 | |
| Kewara | 5.3 ± 0.4 | 11.8 ± 1.1 | 8.3 ± 0.5 | 11.5 ± 1.3 | 0.8 ± 0.2 | 59.2 ± 5.3 | |
| Mian channu | 3.1 ± 0.2 | 9.9 ± 1.1 | 3.7 ± 0.5 | 17.4 ± 1.3 | 2.2 ± 0.36 | 191 ± 12.8 | |
| Mianwali | 5.5 ± 0.2 | 4.8 ± 0.6 | 6.2 ± 1.2 | 8.2 ± 1.5 | 1.4 ± 0.4 | 43.3 ± 4.2 | |
| Multan | 1.7 ± 0.3 | 9.4 ± 0.5 | 16.3 ± 1.1 | 16.1 ± 1.3 | 1.1 ± 0.4 | 78.2 ± 8.1 | |
| Abbottabad | 15.4 ± 0.8 | 26.5 ± 1.2 | 10.9 ± 1.2 | 3.0 ± 0.5 | 0.6 ± 0.1 | 224.8 ± 18.2 | |
| Haripur | 19.1 ± 2.1 | 36.6 ± 2.6 | 18.4 ± 1.3 | 1.3 ± 0.2 | 0.2 ± 0.01 | 324.0 ± 19.4 | |
| Layyah | 9.9 ± 1.1 | 35 ± 2.87 | 14.2 ± 1.8 | 1.9 ± 0.3 | 1.5 ± 0.2 | 271.9 ± 10.9 | |
| Non-saline | Mansehra | 15.6 ± 1.8 | 29.4 ± 2.4 | 15.3 ± 1.5 | 1.3 ± 0.4 | 0.2 ± 0.03 | 262.4 ± 13.3 |
| Okara1 | 7.2 ± 1.3 | 35.9 ± 3.4 | 5 ± 0.5 | 2.1 ± 0.3 | 2.3 ± 0.2 | 321.1 ± 13.5 | |
| Sahiwal | 12.6 ± 1.2 | 26.5 ± 2.6 | 9.6 ± 1.4 | 2.1 ± 0.2 | 1.7 ± 0.2 | 320.6 ± 20.1 | |
| Tobateksingh | 12.3 ± 2.3 | 26.1 ± 2.5 | 9.6 ± 1.2 | 2.3 ± 0.77 | 1.9 ± 0.3 | 256.1 ± 12.2 | |
| LSD (0.05) | 1.3 | 2.4 | 1.2 | 0.3 | 0.3 | 6.8 | |
| Soil | Fe | Cu | Mn | Zn |
|---|---|---|---|---|
| Saline/sodic soil | ||||
| Bahawalpur | 5.1 i | 5.5 k | 5.5 j | 5.1 k |
| Charsada | 10.4 h | 8.7 h | 10.5 g | 10.4 g |
| Gujranwala | 8.6 j | 8.5 h | 9 h | 8.6 i |
| Khewara | 21.4 a | 4 l | 7.3 i | 15.4 c |
| Mian channu | 6.1 k | 7.6 i | 2.6 k | 6.1 j |
| Mianwali | 17.4 b | 7.1 j | 11.7 f | 10.4 g |
| Multan | 9.9 i | 8.4 h | 11.6 f | 9.9 h |
| Non-saline soil | ||||
| Abbottabad | 17.5 b | 17.9 e | 14.4 cd | 17.5 a |
| Haripur | 16.2 c | 25.3 a | 13.4 e | 16.2 b |
| Layyah | 15.5 d | 11.7 g | 16.8 b | 15.5 c |
| Mansehra | 16.1 c | 23.2 c | 14.7 c | 16.1 b |
| Okara | 13 f | 19.1 d | 17.7 a | 13 e |
| Sahiwal | 11.7 g | 14 f | 17.8 a | 11.7 f |
| Tobateksingh | 14.2 e | 23.6 b | 14.3 d | 14.2 d |
Publisher’s Note: MDPI stays neutral with regard to jurisdictional claims in published maps and institutional affiliations. |
© 2022 by the authors. Licensee MDPI, Basel, Switzerland. This article is an open access article distributed under the terms and conditions of the Creative Commons Attribution (CC BY) license (https://creativecommons.org/licenses/by/4.0/).
Share and Cite
Mohiuddin, M.; Irshad, M.; Sher, S.; Hayat, F.; Ashraf, A.; Masood, S.; Bibi, S.; Ali, J.; Waseem, M. Relationship of Selected Soil Properties with the Micronutrients in Salt-Affected Soils. Land 2022, 11, 845. https://doi.org/10.3390/land11060845
Mohiuddin M, Irshad M, Sher S, Hayat F, Ashraf A, Masood S, Bibi S, Ali J, Waseem M. Relationship of Selected Soil Properties with the Micronutrients in Salt-Affected Soils. Land. 2022; 11(6):845. https://doi.org/10.3390/land11060845
Chicago/Turabian StyleMohiuddin, Muhammad, Muhammad Irshad, Sadaf Sher, Faisal Hayat, Ammar Ashraf, Salman Masood, Sumera Bibi, Jawad Ali, and Muhammad Waseem. 2022. "Relationship of Selected Soil Properties with the Micronutrients in Salt-Affected Soils" Land 11, no. 6: 845. https://doi.org/10.3390/land11060845
APA StyleMohiuddin, M., Irshad, M., Sher, S., Hayat, F., Ashraf, A., Masood, S., Bibi, S., Ali, J., & Waseem, M. (2022). Relationship of Selected Soil Properties with the Micronutrients in Salt-Affected Soils. Land, 11(6), 845. https://doi.org/10.3390/land11060845