Article

Corn and Wheat Residue Management Effects on Greenhouse Gas Emissions in the Mid-Atlantic USA

1
Center for Sustainability Science, The Nature Conservancy, Arlington, VA 22203, USA
2
School of Plant and Environmental Sciences, Virginia Polytechnic Institute & State University, Blacksburg, VA 24061, USA
3
Department of Renewable Resources, Faculty of Agricultural, Life and Environmental Sciences, University of Alberta, 442 Earth Sciences Building, Edmonton, AB T6G 2E3, Canada
4
Plant Production Department, College of Food and Agriculture Sciences, King Saud University, P.O. Box 2460, Riyadh 11451, Saudi Arabia
5
Department of Crop Sciences, Faculty of Agriculture, Menoufia University, Shibin El-Kom 32514, Egypt
6
Soil and Ecology Department, Kahramanmaras Sutcu Imam University, Kahramanmaraş 46050, Turkey
7
Department of Biochemistry and Microbiology, School of Environmental and Biological Sciences, Rutgers, The State University of New Jersey, New Brunswick, NJ 08901, USA
8
Crop, Soil, and Environment Program, School of Agricultural Sciences, Southern Illinois University, Carbondale, IL 62901, USA
9
Tasmanian Insititute of Agriculture, University of Tasmania, Newnham, Launceston 7248, Australia
*
Author to whom correspondence should be addressed.
Land 2022, 11(6), 846; https://doi.org/10.3390/land11060846
Submission received: 19 May 2022 / Revised: 1 June 2022 / Accepted: 2 June 2022 / Published: 5 June 2022

Abstract

:
Greenhouse gas (GHG) emissions from crop residue management have been studied extensively, yet the effects of harvesting more than one crop residue in a rotation have not been reported. Here, we measured the short-term changes in methane (CH4), nitrous oxide (N2O), and carbon dioxide (CO2) emissions in response to residue removal from continuous corn (Zea mays L.) (CC) and corn–wheat (Triticum aestivum L.)–soybean (Glycine max L. Merr.) (CWS) rotations in the Mid-Atlantic USA. A first experiment retained five corn stover rates (0, 3.33, 6.66, 10, and 20 Mg ha−1) in a continuous corn (CC) in Blacksburg, VA, in 2016 and 2017. Two other experiments, initiated during the wheat and corn phases of the CWS rotation in New Kent, VA, utilized a factorial combination of retained corn (0, 3.33, 6.66, and 10.0 Mg ha−1) and wheat residue (0, 1, 2, and 3 Mg ha−1). Soybean residue was not varied. Different crop retention rates did not affect CO2 fluxes in any of the field studies. In Blacksburg, retaining 5 Mg ha−1 stover or more increased CH4 and N2O emissions by ~25%. Maximum CH4 and N2O fluxes (4.16 and 5.94 mg m−2 day−1) occurred with 200% (20 Mg ha−1) retention. Two cycles of stover management in Blacksburg, and one cycle of corn or wheat residue management in New Kent did not affect GHG fluxes. This study is the first to investigate the effects of crop residue on GHG emissions in a multi-crop system in humid temperate zones. Longer-term studies are warranted to understand crop residue management effects on GHG emissions in these systems.

1. Introduction

Global emissions of greenhouse gases, including carbon dioxide (CO2), methane (CH4), and nitrous oxide (N2O), have increased by 75% since the 1970s [1]. Agriculture, together with managed timberland, anthropogenic land-use (i.e., wetlands and settlements) and other land (i.e., bare soil, rock, and ice) accounted for about 24% of the total emissions (mainly comprised of CH4 and N2O) and was only surpassed by the energy production sector (around 34% of the total emissions). From this total, estimated contributions from agriculture (5.0 to 5.8 Gt CO2 eq year−1) and land-use changes (4.3 to 5.5 Gt CO2 eq year−1) (i.e., forest and grassland conversion to pasture or cropland and abandonment of croplands and pastures to regrow into their prior natural state) were similar in magnitude over the period 2000 to 2010 [2]. In this context, lignocellulosic bioenergy systems that utilize crop residues could play an important role in mitigating the increases in anthropogenic GHG emissions [3,4,5,6]. Interest in lignocellulosic ethanol production from dedicated bioenergy crops [7,8,9] and crop residues has been on the rise recently [10,11]. However, the latter has received more attention, as crop residues for main crops are available in considerable amounts [12] and do not compete with food production [13,14], although reposition of removed nutrients could be expensive [15]. Moreover, crop residues are to some extent subsidized by primary grain production, so there is no need for land conversion, and its concomitant impacts [16], when considering biomass harvest. However, this potential largely depends on the development of sustainable and efficient bioenergy systems [17], and uncertainties regarding these topics still remain [1].
In residue-based bioenergy production systems, the potential impact of residue removal on soil processes and emissions of GHG, especially N2O, is of particular interest and concern [18,19]. Increased accumulation of crop residues in the soil surface, which increases the supply of readily available C and N for microbial activity [20,21], increases potential C oxidation, nitrification and denitrification rates in soils [22,23,24,25]. As a result, most field studies showed a reduction in the total GHG emissions following crop residue removal [19,26,27,28,29].
Because of the scope of the systems and the number of variables involved, much of the analysis of GHG emissions has been conducted via modeling. For example, all soil nitrogen-related emissions, when modeled with DayCent [30,31] were significantly reduced with corn stover removal [32,33]. Simulations of vehicular emissions with the GREET model [34] indicate that, relative to petroleum gasoline, GHG emissions can be reduced by 90–103% using ethanol from corn stover [35], a higher reduction when compared with ethanol from corn grain [36]. Incorporating crop residues has increased soil N2O emissions in some studies [21,37,38] but had no significant effect on N2O fluxes when 112 studies were considered together in a meta-analysis [39]. Some authors have stated that the release of N2O resulting from converting crop residues to biofuels may counterbalance the reduction in global warming resulting from fossil fuel displacement [18,40]. However, full life cycle assessments would be more appropriate, as the previous studies did not consider the fossil fuels needed for biomass, fertilizer and pesticide production, and the use of co-products from the bioenergy industry [40].
Although crop residue removal for biofuel production has the potential to reduce GHG emissions from soil or through fuel consumption and use, to date no data on this have been generated in the temperate humid Mid-Atlantic USA. At a global scale, the effects of harvesting more than one crop residue from a multi-crop system on GHG emissions have not been reported before. Generating information on the impact of crop residue removal on GHG emissions and soil health is crucial to assess its environmental sustainability in the region [15,41] and should be a prerequisite if bioethanol is to become a viable substitute for the fossil fuels intended to be displaced [42]. Thus, the objectives of this study were to record short-term changes in soil CO2, CH4 and N2O emissions in response to various levels of residue removal from continuous corn grain and corn-wheat/soybean rotations in Virginia.

2. Materials and Methods

Three field experiments assessing the impact of crop residue retention were conducted over three years, from 2015 through 2017, in two physiographic regions in Virginia.

2.1. Experiment 1

The experiment was conducted in Blacksburg, Virginia (BB), in the Valley and Ridge physiographic region (37°12′00.6″ N 80°33′52.0″ W), on a Unison and Braddock loam soil (fine, mixed semiactive, mesic hapludults) [43]. The experiment utilized an RCBD with five levels of corn stover retention: 0, 3.33, 6.66, 10.00, and 20.00 Mg ha−1 corn stover retained in a continuous corn (CC) grain rotation (Table 1). Four replications were established at BB resulting in a total of 20 experimental units (EU), with 5 EU per replication. Each EU was 4.6-m wide and 9.1-m long. Residue retention rates were calculated based on reported average grain yields from Virginia in the period 2011–2017 [44] and calculated corn stover yields, based on an assumed harvest index (HI) of 0.45. The treatments retaining 0, 3.33, 6.66, 10.00 and 20.00 Mg dry matter ha−1 corresponded to 0, 33, 66, 100 and 200% of the total stover produced, respectively.

2.2. Experiment 2 and 3

Two experiments were conducted in New Kent, Virginia (NK) in the Coastal Plain region (37°32′34.2″ N 76°53′43.9″ W). Experiments were initiated at different crop phases of the same corn–wheat/soybean (CWS) rotation, with one set of residue return treatments initiated in the wheat phase of the rotation in June 2015 (NK1) and another set of identical treatments initiated after corn harvest in September 2015 (NK2). Soils in both sites were classified as Altavista sandy loam (fine-loamy, mixed, semiactive, thermic Aquic Hapludults) [43]. Both experiments at NK utilized an RCBD with a factorial arrangement of sixteen treatments resulting from the combination of four residue retained rates each for corn (0, 3.33, 6.66 and 10.00 Mg ha−1) and wheat (0, 1.00, 2.00 and 3.00 Mg ha−1) (Table 1). Soybean residues were not harvested, as the scarce aerial biomass produced by this crop and difficulties related to residue harvesting prevent its use as a biofuel feedstock. Total annual retained residues from both corn and wheat were also calculated (Table 1). Four replications were established, resulting in 64 EU per experiment, with 16 EU per replication. Each EU was 4.6-m wide by 9.1-m long, and residue retention rates for each corn and wheat were calculated as in Experiment 1 based on an HI of 0.45. Treatments retaining 0, 3.33, 6.66 and 10.00 Mg dry corn stover ha−1, and 0, 1.00, 2.00, and 3.00 Mg dry wheat straw ha−1 corresponded to approximately 0, 33, 66 and 100% of the total stover and straw produced in this location.
Pest control, fertility, plant density, and planting and harvesting dates all followed recommended best practices to optimize relevant grain yields for both locations, according to Virginia Cooperative Extension Recommendations [45]. Detailed information on the management applied to these experiments can be seen in Table 2 (CC rotation, Blacksburg) and Table 3 (CWS rotation, New Kent; example provided for NK1 site; similar management was applied for NK2 site).

2.3. GHG Measurements

Measurement of CO2, CH4 and N2O fluxes was performed by non-static manual chambers. In 2015, six to eight aluminum chambers (12.5 cm tall by 15 cm diameter) were placed randomly within non-trafficked inter-rows across the experimental area at each experiment for baseline GHG measurements. Initial chamber installation for baseline GHG measures followed corn stover treatment allocation in September (NK2) and October (BB), and after wheat straw allocation in June (NK1). At least six months after treatment allocation, measurements in 2016 and 2017 were taken following corn and wheat planting and harvesting and corn nitrogen fertilization at V4 stage [46] in all four replications of each study. A timeline chart with the information of each component for both rotations and the gas sampling protocol for the different studies is shown in Figure 1.
For each sampling event, metal chambers were field installed four to six days before GHG collection. This schedule allowed the collection system to reach a new equilibrium state and facilitated proper soil-to-chamber contact. Chambers were hammered into the soil to a depth of 7.5 cm, leaving 5 cm of the chamber above ground level and open for normal soil–atmosphere dynamic exchange until gas sampling (Figure 2). For chamber-to-chamber headspace volume corrections, headspace height measurements were taken at four different points within the open space of each chamber. At sampling time, each chamber was covered with a plastic cap. The cap was fitted with two rubber septum stoppers, the first to allow gas collection and the second to avoid vacuum development during sampling. Capping times were recorded, and 30 mL gas samples collected one hour after the recorded capping time for each chamber. All sampling occurred between 1600 and 1800 h. Gas samples were then transferred to 30 mL pre-evacuated borosilicate glass vials assembled with butyl stoppers and aluminum seals (Figure 2). Before sampling, glass vials had been evacuated using a vacuum pressure pump by flushing alternate cycles of N2 air (3 cycles) followed by CO2-free air (4 cycles) for 3 min each, with 7 cycles and a total flushing time of 21 min per glass vial. Following gas sampling, all chambers were removed from the field plots until the next sampling time. Gas samples were analyzed for CO2, CH4 and N2O relative concentrations with a GC-2014 Gas Chromatograph (Shimadzu Scientific Instruments, Columbia, MD, USA). Chromatograph calibration followed the procedures of [28]. Briefly, a thermal conductivity detector and a flame ionization detector, both with dual flow rate differential systems, were utilized for CO2 and CH4 concentration analysis, respectively. Helium was used as the carrier gas, while hydrogen and hydrocarbon-free air were used as the flame gases for CH4 detection. Nitrous oxide concentration was analyzed by electron capture detector with a fixed system using 63Ni370MBq as radiation source and argon/methane mixture as the carrier gas. Detector temperature was set at 350 °C in all cases. Low, medium, and high standard concentrations were used for each gas (N2O: 0.37, 1.00, and 5 ppm; CH4: 1.00, 5.00, and 10 ppm; CO2: 370, 1750, and 5000 ppm). Standards were run in duplicate to calibrate the chromatograph prior to each gas analysis.

2.4. GHG Flux Calculation

Moles (n) of CO2, CH4 and N2O per mL of gas:
n = 10 3 × P R × T
where n is in moles mL−1; 10−3 = conversion factor (L mL−1); P = 1 is the standard atmospheric pressure in atmospheres (atm); R = 0.0821 l atm K−1 mol−1 is the universal gas constant; and T = 298 K is the standard temperature in Kelvin degrees.
CO2, CH4 and N2O gas mass per milliliter:
G m = n × C × M w × 10 3
where Gm is the gas mass in mg mL−1; C = gas concentration from chromatograph reading, as volume fraction; Mw = molecular weight of CO2, CH4 and N2O (i.e., 44.0095; 16.0425; and 44.0128, respectively), in g mole−1; and 103 = conversion factor (mg g−1).
Total CO2, CH4 and N2O gas mass per chamber:
T G M = G m × V c
where TGM is the total gas mass per chamber, in mg; and Vc = volume of the chamber, in mL.
Flux of CO2, CH4 and N2O gas flux per unit area and time:
q = T G M A × T × K
where q is the gas flux; A is the cross-sectional area of the chamber, in m2; T = 1 is the total time the chamber was capped with a lid, in hours; and K = 24 is the conversion factor from hours to day. Because of the relative magnitudes of the fluxes, CO2 flux is expressed in units of g m−2 day−1 while CH4 and N2O are expressed in units of mg m−2 day−1.

2.5. Weather Data

Weather data for the NK sites were obtained from the National Oceanic and Atmospheric Administration’s (NOAA) National Climate Data Center weather station in West Point, VA (https://www.ncdc.noaa.gov/cdo-web/search accessed on Date 1 January 2022). Total accumulated rainfall (mm), and daily average air temperatures (°C) were collected from the beginning of May through the end of October at New Kent, VA, USA (Figure 3). Weather data obtained from the Kentland Farm weather station in Blacksburg were used for specific comparisons but are not presented here.

2.6. Data Analysis

To examine the relationship between CO2, CH4 and N2O fluxes and the treatment rates of residue retention, linear regression analysis was conducted using the PROC REG procedure in SAS version 9.4 [47] (SAS Institute, 2014). Regression equations for each gas flux as a function of either corn stover, wheat straw or the total summation of both were developed using either quadratic or linear models depending on R2 values and model p-values, with significance set at p ≤ 0.10. The minimum, maximum and mean for each comparison were also calculated (Table 4). In three particular comparisons within a site or year (i.e., 2016 vs. 2017 in BB site; NK1 vs. NK2 in year 2016; and May vs. October 2017, in NK2 site) a mean separation and analysis of variance GLIMMIX procedure was conducted in SAS version 9.4 [47] to test the average effects of residue retained treatments on gas fluxes with significance set at p ≤ 0.10. At Blacksburg, five corn stover retained rates (0.00, 3.33, 6.66, 10.00 and 20.00 Mg ha−1) were considered as the treatment for the model effects both in 2016 and 2017. At New Kent, treatments applied in 2015 were the treatments considered in the analysis of GHG emissions in 2016. These included four stover retained rates applied at NK2: 0.00, 3.33, 6.66 and 10.00 Mg ha−1, and four straw retained rates applied at NK1: 0.00, 1.00, 2.00 and 3.00 Mg ha−1. In 2017, the total retained residues that resulted from the factorial combination of four corn stover treatments allocated in 2015 and four wheat straw treatments allocated in 2016 in NK2 were considered in the model. The INFLUENCE statement was used to assess for the presence of outliers.

3. Results and Discussion

3.1. Data Analysis

Quadratic models were significant in four out of eighteen comparisons (Table 4), with CH4 and N2O fluxes affected by different rates of residue retention in BB in 2016 and in NK2 in May 2017 (Table 4). Linear regression models were not significant (p > 0.10) in any comparison. As a result, the parameters for the quadratic model, the higher order model in our comparisons, are presented in Table 4, with a, b, and c being numerical coefficients different than zero in the equation Y = ax2 + bx + c, where Y represents the estimated CH4, N2O (both in mg m−2 day) or CO2 (in g m−2 day−1) gas flux and x a particular retained residue treatment (in Mg ha−1). When the quadratic models were significant, the derivative of the curve was used to calculate the inflection point as x’ = −b/2a, where x’ represents either the maximum or minimum point of the quadratic curve across the range of responses.

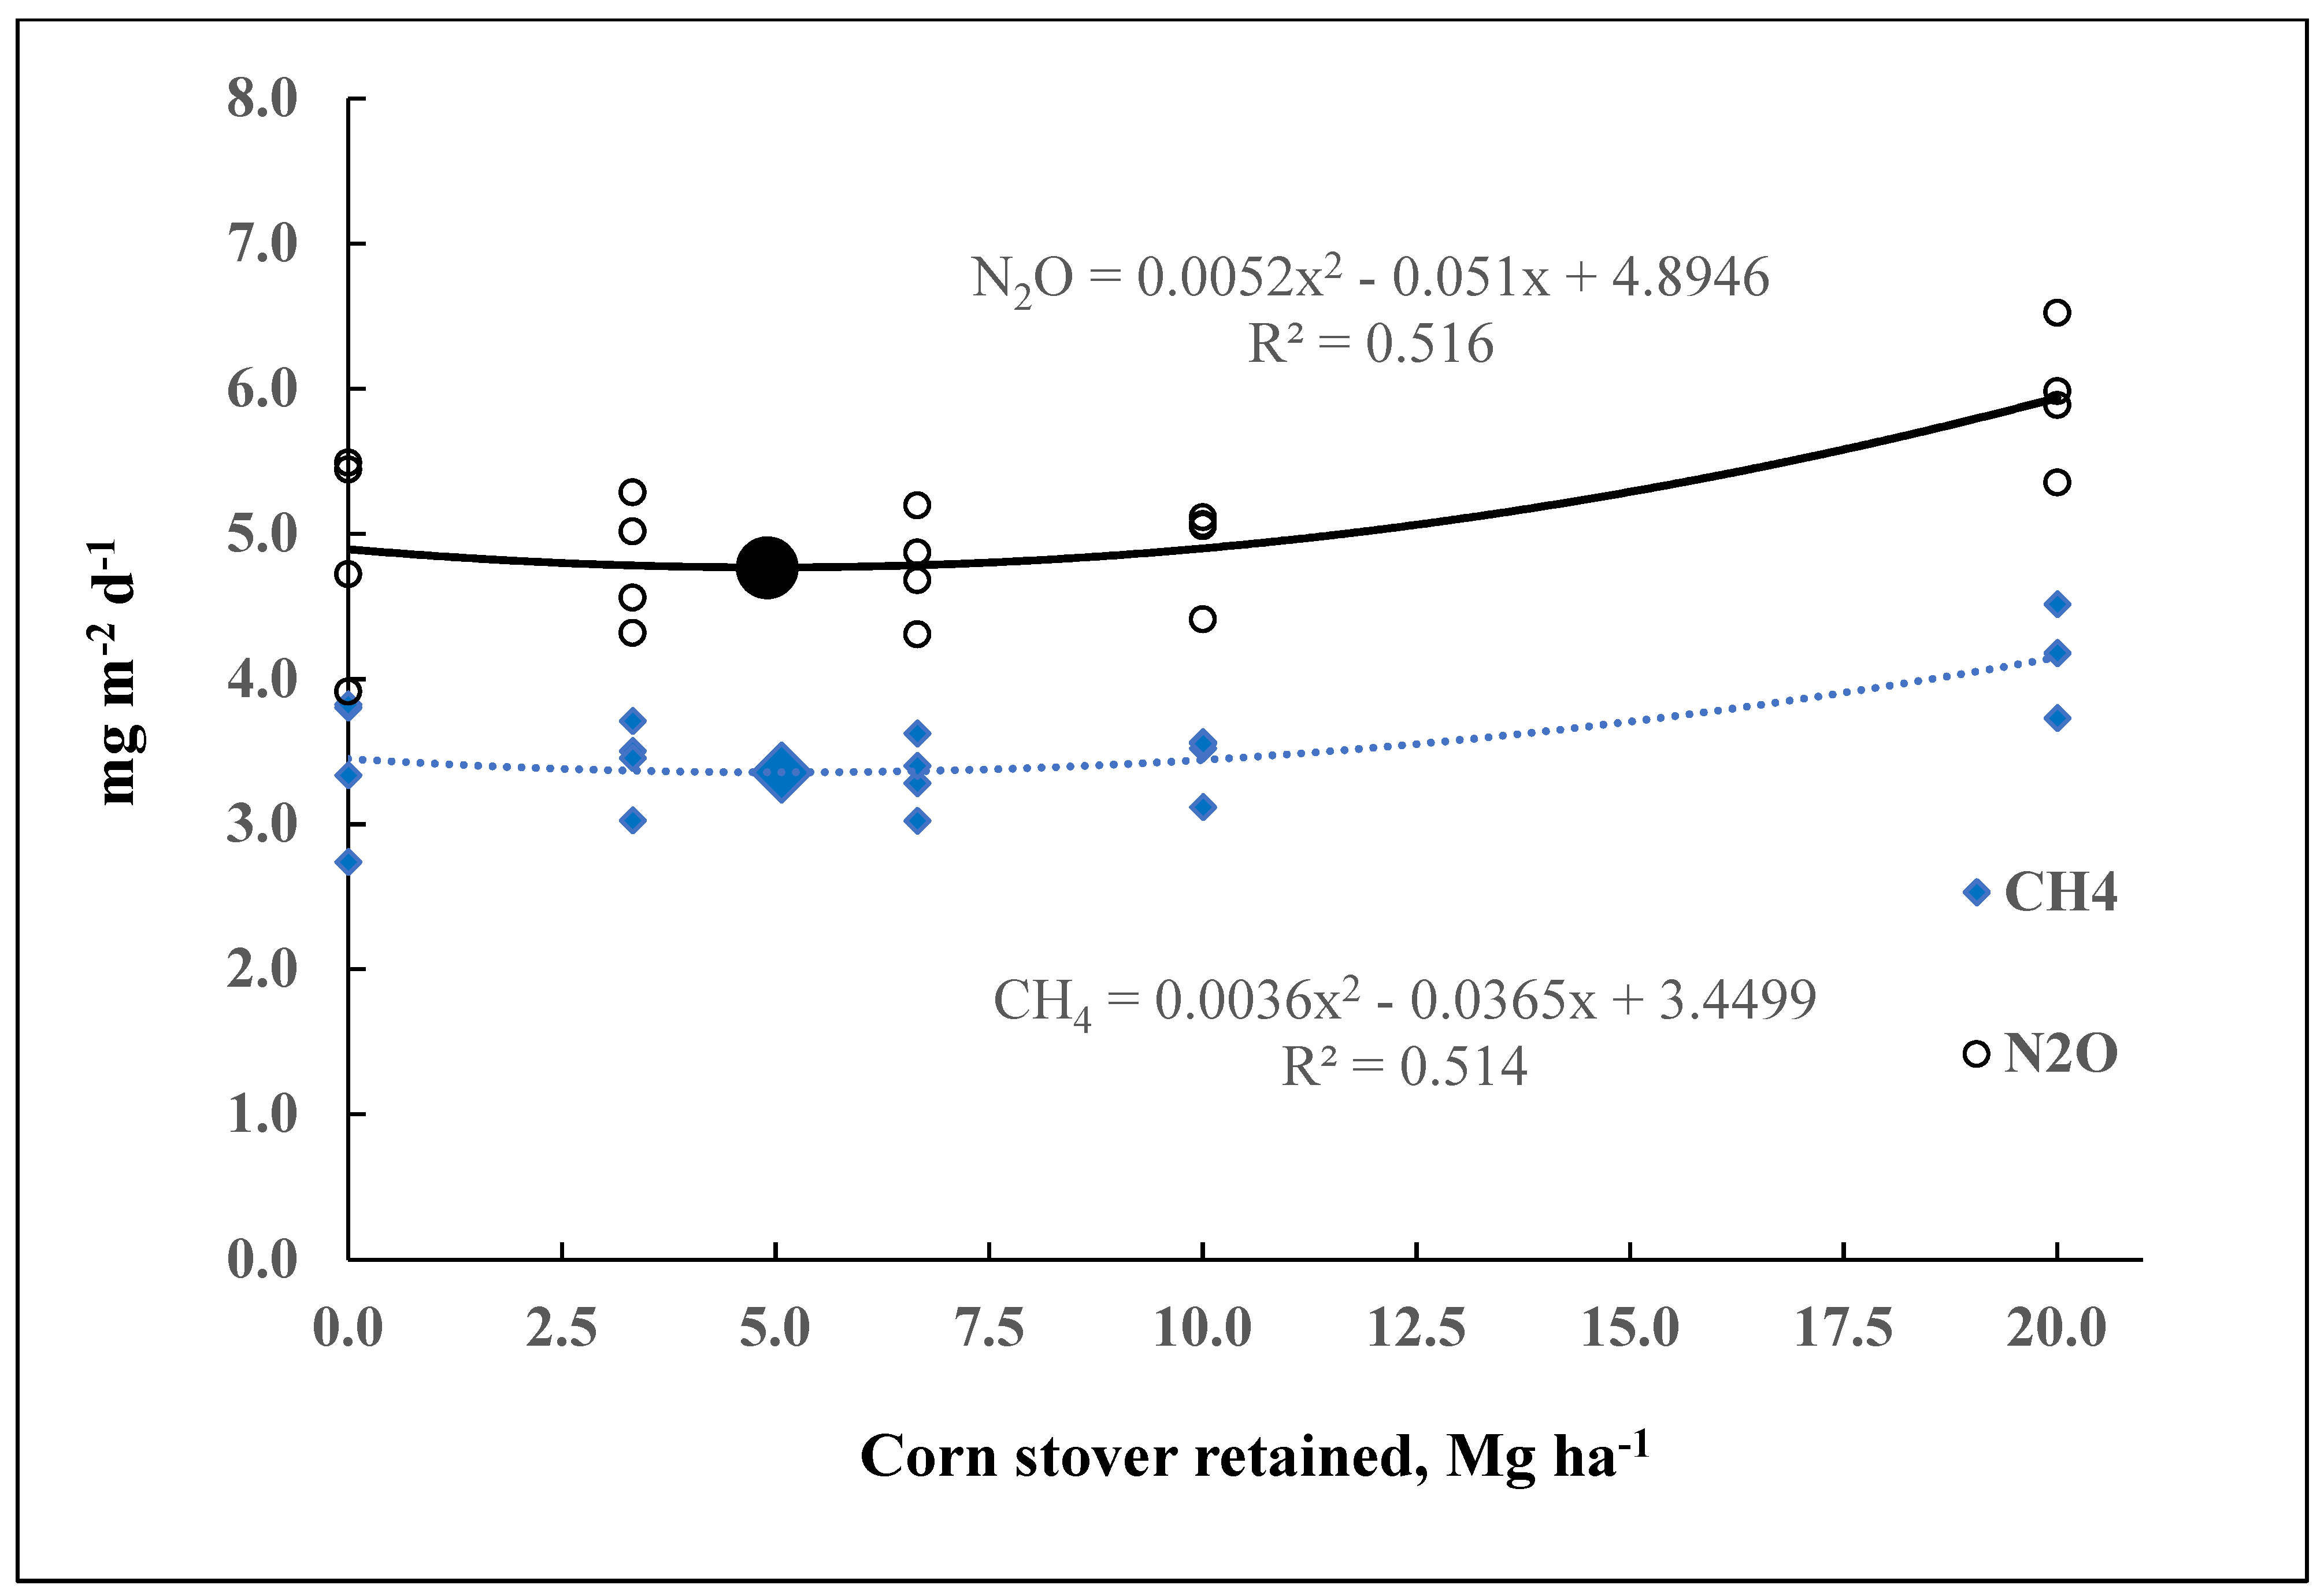
3.2. Effect of Corn Stover Retained Rates on GHG Emissions

Mean CO2, CH4, N2O measured in mid-June differed between 2016 and 2017 in BB (p ≤ 0.0016). Soil moisture content and soil temperature can have a profound impact on the rates of C mineralization, nitrification, denitrification and microbial respiration from soil, thus impacting the resulting GHG fluxes from soil [22,25,48,49,50,51]. In 2017, mean CO2, CH4, N2O fluxes across treatments were 43%, 23%, and 26% greater (p ≤ 0.001) than those measurements taken in 2016 (Table 4). This was likely due to the direct effect of greater soil moisture content (65% more precipitation within one week prior to readings) and indirect effect of greater air temperature (around 2 °C more at reading time) on soil temperature in 2017. The impact of air temperature on soil temperature, a main factor controlling the rates of GHG emissions in different environments, has been extensively cited [1,52,53]. Lenka and Lal [28], found greater CO2 and N2O fluxes with increases in both soil and air temperature. Similarly, increased anaerobic conditions resulting from greater soil moisture content resulted in greater CH4 and N2O fluxes in other experiments [28,54]. However, conditions favoring greater gas flux emissions may have also generated more variability in the samples collected in 2017, when standard errors for the calculated gas fluxes were, on average, 13% greater than values in 2016. Approximately 26–52% and 4–12% of the total variability in gas flux emissions were explained by the quadratic models in 2016 and 2017, respectively (Table 4).
Rates of corn stover retained (i.e., 0.00, 3.33, 6.66, 10.00 and 20.00 Mg ha−1) did not affect CO2 emissions following corn planting in a continuous corn rotation at BB in 2016 (p = 0.195) or 2017 (p = 0.494). Corn stover retained rates affected the CH4 and N2O fluxes in 2016 (p = 0.048 for CH4 and p = 0.051 for N2O; Figure 4) but not in 2017 (p = 0.363 for CH4 and p = 0.467 for N2O; Table 4). When differences were significant, minimum points in the regression curve (x’) corresponded to corn stover retained rates of 5.07 Mg ha−1 for CH4 and 4.90 Mg ha−1 for N2O. Predicted CH4 and N2O responses at the minimum stover retained rates were 3.36 mg m−2 day−1 for CH4 and 4.76 mg m−2 day−1 for N2O (Figure 4). Increasing the amount of stover retained in the range of 0 to ~5 Mg ha−1 (50% retained rate) gradually decreased CH4 and N2O fluxes, but reductions were <3% in both cases, similar to reports from Baker et al. [19] and Jin et al. [29] in a 2 year study in Minnesota. On the other hand, stover retained rates ≥5 Mg ha−1 gradually increased CH4 and N2O up to 24% and 25% (calculated values of 4.16 and 5.94 mg m−2 day−1 in the regression curve) respectively, corresponding to maximum retention rates of 20 Mg ha−1 (200% retained rate). Previous studies [19,26,27,29] did not include the 50% corn stover retained rate.
For NK2, corn stover treatments (i.e., 0.00, 3.33, 6.66 and 10.00 Mg ha−1) did not affect flux of any GHG (CH4, p = 0.223; N2O, p = 0.151; CO2, p = 0.114) measured within 20 day of wheat harvest and soybean planting around mid-July 2016. During this sampling time, resulting models explained 13–25% of the total variability in the gas flux emissions (Table 4).
Similarly to other reports [29,55], CO2 fluxes represented more than 90% of the total GHG emissions across all comparisons in both studies. The range of CO2 flux in the loam soils at BB in 2016 and 2017 (3.83 to 8.11 g m−2 day−1) more closely aligned with the range of emissions (5.70 to 9.51 g m−2 day−1) reported by Wei et al. [51], who worked with a clay soil. Those authors studied CO2 emissions in a continuous corn rotation in response to soil moisture and temperature at different landscape positions. In both cases, the ranges of CO2 flux were greater than values observed in the sandy loam soil at NK2 (2.78 to 6.86 g m−2 day−1; Table 4).
Retaining 0.00 Mg ha−1 of corn stover for one year in NK2 (July 2016) and for two consecutive years (2017; BB) did not affect the emissions of any gas compared with the retention of 10 Mg ha−1 (100% retained rate) of corn stover (Table 4). Similar results were recently found by Guzman et al. [55] in a study conducted under a continuous corn rotation at two locations in Iowa. In that study, retaining 0% or 100% of the corn stover had no effect on cumulative CO2 emissions during the crop season (i.e., April through October) in 2 out of 3 years in a clay loam soil, and in the CO2 and N2O emissions across two years in a silty clay loam soil. Those results likely occurred because only small differences in soil temperature and water content across residue treatments were measured in those well-drained soils, which was similar to the defining characteristics for the very deep soils used in our experiments. In other studies, retaining 0% corn stover at harvest reduced emissions of CO2 by 4 to 11% [19,26,29], and N2O by 7 to 51% [26,27,29] compared with 100% retention, but did not affect CH4 fluxes. In those studies, the cumulative fluxes of the three gases were compared for periods of time longer than a year, with more variable soil water content and temperatures over the period under analysis. Moreover, comparisons were restricted to treatments retaining either 0% or 100% corn stover.

3.3. Effect of Wheat Straw Retained Rates on GHG Emissions

There was no significant effect on the corn post-harvest CH4 (p = 0.304), N2O (p = 0.669) and CO2 (p = 0.718) emissions measured in mid-October 2016 following one year of wheat straw management at NK1 (Table 4). This is in contrast to Lenka and Lal [28], who studied GHG emissions in a 15-year residue management study with three wheat straw application rates (0, 8, and 16 Mg ha−1 year−1) and two fertilization rates (0 and 244 kg N ha−1 year−1) under no-till management in Ohio. In their study, the 0 and 8 Mg ha−1 year−1 retention rate treatments had lowest CO2 (1.587 g m−2 day−1) and N2O (0.510 mg m−2 day−1) emissions for both fertilization rates. On the other hand, retaining 16 Mg ha−1 year−1 of wheat straw combined with N application increased average CO2 (2.306 g m−2 day−1) and N2O (1.020 mg m−2 day−1) fluxes by 45% and 100%, respectively. Incorporating wheat straw at 8 and 16 Mg ha−1 year−1 (both with and without fertilizer) resulted in CH4 emissions ranging from 0.108 to 3.153 mg m−2 day−1 [28]. The discrepancy with our results is likely explained by factors included by Lenka and Lal [28], but not in our study. These include (a) the use of maximum straw retention rates more than five times greater than rates used in our experiment (16 vs. 3 Mg ha−1 year−1, respectively); (b) the likely cumulative effect of 15 year of wheat straw management, compared with the single year-effect in our study at the time when measurements were collected; (c) nitrogen treatment that interacted with straw rates and affected all three gas fluxes in their study; and (d) the lack of crops grown over the 15 year where treatments were allocated. The authors also used straw from external sources, a situation that does not reproduce certain conditions found in productive environments under intensive management, such as the presence of plant roots and the traffic of machinery for different labors. Despite such variations in experimental design, the range of responses for CH4 (0.04 to 3.93 in our study vs. 0.11 to 3.15 mg m−2 day−1 in Lenka & Lal [28], N2O (0.02 to 0.92 vs. 0.46 to 1.02 mg m−2 day−1), and CO2 (0.22 to 2.14 g m−2 day−1 vs. 1.51 to 2.31) in our study were similar to those reported by Lenka and Lal [28].
The lowest absolute values for CH4 (0.04 mg m−2 day−1), N2O (0.02 mg m−2 day−1), and CO2 (0.22 g m−2 day−1) across locations and years were measured at this sampling time (10 October 2016; Table 4). Following one cycle of residue management and for plots with similar soil series and fertility, CH4, N2O and CO2 emissions across wheat straw retention rates of 0, 33, 66, and 100% in mid-October at NK1 were 58, 92 and 81% lower (p < 0.0001) than measurements taken in mid-July at NK2 across similar relative corn retention rates (Table 4). These differences may be explained as a result of both the lower absolute amount of wheat residue applied in NK1 (range: 0.00–3.33 Mg ha−1) relative to corn stover applied in NK2 (range: 0.00–10.00 Mg ha−1), and the lower air temperature around sampling time in NK1 (15.5 °C, 10 October 2016) compared to NK2 (25.3 °C on 12 July 2016), as previously discussed. These observations agree with reports from Lenka and Lal [28], who calculated positive correlations between air and soil temperature with CO2 (0.71 and 0.68) and N2O (0.64 and 0.45) fluxes, respectively.

3.4. Combined Effect of Corn Stover and Wheat Straw Retained Rates on GHG Emissions

Total retained rates resulting from the summation of corn and wheat residue treatments allocated in 2015 and 2016 in NK2 affected both the CH4 (p = 0.020) and the N2O (p = 0.049) but not the CO2 (p = 0.135) fluxes measured after a corn V4 nitrogen fertilization at the end of May 2017 (Table 4). When differences were significant, calculated inflection points for the regression curve corresponded to total residue retained rates of 5.69 Mg ha−1 for CH4 and 5.44 Mg ha−1 for N2O, respectively. Predicted responses at the maximum total retained rates were 4.30 and 5.79 mg m−2 day−1 for CH4 and N2O, respectively. However, significant differences in both CH4 and N2O fluxes across treatments in this sampling time do not seem to be biologically meaningful. The best fitting line for each quadratic model had only slight curvature across the range of predicted values for the residue-retained treatments and the proposed model explained only about 10% of the total variability in each case (Figure 5). In fact, the differences between numerical lowest and highest predicted values across the sixteen treatments for both gas fluxes were less than 10% (Figure 5).
In the same experiment, two years of residue treatments did not have an effect on the CH4 (p = 0.138), N2O (p = 0.885), or CO2 (p = 0.682) fluxes measured following corn harvest during October 2017 (Table 4). Despite the similarity of gas fluxes among treatments, the data had substantial variations in dispersion between different sampling times: while the difference between numerical lowest and highest CH4, N2O and CO2 fluxes were <10% at the end of the May 2017 sampling time, the differences for similar comparisons were ~24% for measurements taken in mid-October 2017. In fact, the magnitude of standard errors for the measurements taken in October 2017 at NK2 represented between 32 and 54% of the average flux of each gas. In both cases, gas samples (sampling times 7 and 9; Figure 1) were taken more than 1.5 year after the corn stover treatments allocation in September 2015. However, less than a year elapsed between wheat straw treatment allocation in June 2016 and the post-V4 fertilization sampling in May 2017. Conversely, when samples were taken in mid-October 2017, wheat straw residues had been on the soil surface for a longer time (about 1.5 year; Figure 1), and thus exposed to additional weathering effects of temperature and rainfall during summer 2017 (Figure 3). As a result of this longer weathering process, intact straw biomass left on the surface was lower in mid-October and may, in turn, have fostered more interactions with the already decomposed corn residues. This process likely created the greater GHG data dispersion in the measurements taken later in the year. Unfortunately, there is a noticeable lack of experiments in the literature that have addressed the combined effects of corn and wheat residues simultaneously removed or retained in a corn-wheat/soybean rotation. To the best of our knowledge, no other similar field experiment has been reported in the literature. Recent evidence from a four-year study conducted in Illinois on silty clay loam and silt loam soils with no residue management applied indicated that maximum CO2 and N2O emissions for a corn-wheat/soybean rotation were greater than those emissions from a continuous soybean rotation but similar to emissions from a continuous corn and a corn-soybean rotation [56].
Fertilization with 56 kg N ha−1 at the corn V4 stage greatly impacted the size of the GHG fluxes measured at the end of May 2017 in NK2 compared with measurements taken four months later in the corn-wheat/soybean rotation. Lenka and Lal [28] reported significant increases in CH4, N2O, and CO2 fluxes following the addition of 244 Kg N ha−1 year−1 versus no N addition in most comparisons. Based on data from several authors [57,58,59,60,61] it is estimated that approximately 1% of the N present in both synthetic and organic fertilizers and in crop residues would be emitted from soils as N2O. Additionally, higher soil N availability following N fertilization stimulates residue decomposition [32,62,63] and reduces CH4 oxidation [28], resulting in both greater CH4 and CO2 emissions. In other cases, N fertilization with [37] or without [1,64] crop residue additions resulted in significant increases in the N2O fluxes from the soils. In our study, average CH4, N2O, and CO2 fluxes within 10 days from a V4 nitrogen fertilization in corn were 19, 56 and 50% greater (p < 0.0001) than similar comparisons taken at the same plot in mid-October 2017.

4. Conclusions

Our objective was to compare the relative, not the absolute cumulative GHG emissions, from various residue retained rates in two cropping systems in the Mid-Atlantic USA. Thus, we deemed appropriate the use of manual instead of automated chambers. This allowed us to use up to 64 chambers at the same time across 16 treatments, a number three to five times greater than the amount of simultaneous automated chambers used in most field studies cited in the literature. To date, most studies have addressed the impact of 0, 50 and 100% corn stover and wheat straw removal or retained rates on GHG fluxes, with data measured at only two or three replications at a time from soils under a continuous corn rotation scheme, and none has addressed the issue from a rotational corn-wheat/soybean cropping system. Remarkably, the continuous corn or wheat approach does not address the inherent complexity of current agricultural systems. Our removable manual chamber system did not interfere or precluded any of the crop management activities that would otherwise be performed in our “on-farm” research and was able to pick up small changes in weather and soil moisture across sampling times. The lack of reproducibility, the “monoculture” system approach and the experimental design shortcomings of a substantial part of the published GHG studies utilizing automated chambers must be promptly reassessed in the future.
Following one year of stover management, retaining ~50% (5 Mg ha−1) or more of the stover from the previous year gradually increased CH4 and N2O in the loamy soil in Blacksburg up to 24% and 25%, with maximum CH4 and N2O fluxes following 200% retention rates (i.e., 20 Mg ha−1). However, two cycles of corn stover management in this location, and one cycle of corn or wheat residue management in the sandy loam soils in both experiments at New Kent, did not affect measured fluxes of any gas. The combined effect of corn and wheat residues simultaneously managed for extended uses only had an impact in the CH4 and N2O fluxes following a corn V4 N fertilization at NK2, but these results were not biologically meaningful. These findings suggest that, while short-term residue management may not affect GHG fluxes in most cases, retaining 50% or less of the crop residues has the potential to reduce GHG fluxes, while providing the farmer with an extra source of income. Our study is a first effort aiming to understand the impacts that crop residue management in complex biofuel systems have on GHG emissions. More studies of this type are warranted to start building a body of knowledge, absent at this time, in this sense.

Author Contributions

Conceptualization, M.L.B., W.E.T., J.H.F., G.K.E.; methodology, M.L.B., W.E.T., J.H.F., G.K.E. and R.D.S.; formal analysis, M.L.B., W.E.T. and R.D.S.; A.S.; investigation, M.L.B.; resources, M.L.B., W.E.T., J.H.F. and M.T.H.; data curation, M.L.B., E.B., A.S. and M.F.S.; writing—original draft preparation, M.L.B., W.E.T. and J.H.F.; writing—review and editing, R.D.S., C.D.G., M.F.S. and M.T.H. All authors have read and agreed to the published version of the manuscript.

Funding

The time of MTH was supported by Meat & Livestock Australia, ‘Sustainable Pathways to CN30’ Project Number B.CCH.2121.

Institutional Review Board Statement

Not applicable.

Informed Consent Statement

Not applicable.

Data Availability Statement

All data are presented within the article.

Conflicts of Interest

The authors declare no conflict of interest.

References

  1. Smith, P.; Bustamante, M.; Ahammad, H.; Clark, H.; Dong, H.; Elsiddig, E.A.; Haberl, H.; Harper, R.; House, J.; Jafari, M.; et al. Agriculture, Forestry and Other Land Use (AFOLU). In Climate Change 2014: Mitigation of Climate Change. Contribution of Working Group III to the Fifth Assessment Report of the Intergovernmental Panel on Climate Change; Edenhofer, O., Pichs-Madruga, R., Sokona, Y., Farahani, E., Kadner, S., Seyboth, K., Adler, A., Baum, I., Brunner, S., Eickemeier, P., Eds.; Cambridge University Press: Cambridge, UK; New York, NY, USA, 2014. [Google Scholar]
  2. IPCC. Implications of Different Definitions and Generic Issues. Land Use, Land-Use Change and Forestry; Cambridge University Press: Cambridge, UK, 2000; p. 375. [Google Scholar]
  3. Wilhelm, W.W.; Johnson, J.M.; Hatfield, J.L.; Voorhees, W.B.; Linden, D.R. Crop and soil productivity response to corn residue removal: A literature review. Agron. J. 2004, 96, 1–17. [Google Scholar] [CrossRef]
  4. Macedo, I.C.; Nassar, A.M.; Cowie, A.L.; Seabra, J.E.A.; Marelli, L.; Otto, M.; Wang, M.Q.; Tyner, W.E. Greenhouse Gas Emissions from Bioenergy; Souza, G.M., Victoria, R.L., Joly, C.A., Verdade, L.M., Eds.; Bioenergy Sustainability: Paris, France, 2015; pp. 582–617. [Google Scholar]
  5. Souza, G.M.; Ballester, M.V.R.; de Brito Cruz, C.H.; Chum, H.; Dale, B.; Dale, V.H.; Fernandes, E.C.; Foust, T.; Karp, A.; Lynd, L.; et al. The role of bioenergy in a climate-changing world. Environ. Dev. 2017, 23, 57–64. [Google Scholar] [CrossRef]
  6. Battaglia, M.L.; Thomason, W.E.; Fike, J.H.; Evanylo, G.; von Cossel, M.; Babur, E.; Iqbal, Y.; Diatta, A. The broad impacts of corn stover and wheat straw removal on crop productivity, soil health and greenhouse gases emissions: A review. GCB Bioenergy 2021, 13, 45–57. [Google Scholar] [CrossRef]
  7. Battaglia, M.; Fike, J.; Fike, W.; Sadeghpour, A.; Diatta, A. Miscanthus × giganteus biomass yield and quality in the Virginia Piedmont. Grassl. Sci. 2019, 65, 1–10. [Google Scholar] [CrossRef]
  8. Kumar, P.; Lai, L.; Battaglia, M.L.; Kumar, S.; Owens, V.; Fike, J.; Galbraith, J.; Hong, C.O.; Farris, R.; Crawford, R.; et al. Impacts of nitrogen fertilization rate and landscape position on select soil properties in switchgrass field at four sites in the USA. CATENA 2019, 180, 183–193. [Google Scholar] [CrossRef]
  9. Kumar, S.; Lai, L.; Kumar, P.; Feliciano, Y.M.V.; Battaglia, M.L.; Hong, C.O.; Owens, V.N.; Fike, J.; Farris, R.; Galbraith, J. Impacts of nitrogen rate and landscape position on soils and switchgrass root growth parameters. Agron. J. 2019, 111, 1046–1059. [Google Scholar] [CrossRef]
  10. Golden, J.S.; Handfield, R.B.; Daystar, J.; McConnell, T.E. An Economic Impact Analysis of the US Biobased Products Industry: A Report to the Congress of the United States of America. A Joint Publication of the Duke Center for Sustainability Commerce and the Supply Chain Resource Cooperative at North Carolina State University. 2015. Available online: https://biopreferred.gov/BPResources/files/EconomicReport_6_12_2015.pdf (accessed on 10 February 2022).
  11. Zabed, H.; Sahu, J.N.; Boyce, A.N.; Faruq, G. Fuel ethanol production from lignocellulosic biomass: An overview on feedstocks and technological approaches. Renew. Sust. Energ. Rev. 2016, 66, 751–774. [Google Scholar] [CrossRef]
  12. Singh, A.; Pant, D.; Korres, N.E.; Nizami, A.; Prasad, S.; Murphy, J.D. Key issues in life cycle assessment of ethanol production from lignocellulosic biomass: Challenges and perspectives. Bioresour. Technol. 2010, 101, 5003–5012. [Google Scholar] [CrossRef]
  13. Tenenbaum, D.J. Food vs. Fuel: Diversion of Crops Could Cause More Hunger. Environ. Health Persperct. 2008, 116, A254–A257. [Google Scholar] [CrossRef] [Green Version]
  14. Thompson, P.B. The Agricultural Ethics of Biofuels: The Food vs. Fuel Debate. Agric. J. 2012, 2, 339–358. [Google Scholar] [CrossRef] [Green Version]
  15. Battaglia, M.L.; Groover, G.; Thomason, W.E. Harvesting and Nutrient Replacement Costs Associated with Corn Stover Removal in Virginia. Virginia Cooperative Extension Publication CSES-229NP. Blacksburg, VA. 2018. Available online: https://pubs.ext.vt.edu/content/dam/pubs_ext_vt_edu/CSES/cses-229/CSES-229.pdf (accessed on 10 February 2022).
  16. Babur, E.; Uslu, Ö.S.; Battaglia, M.L.; Diatta, A.; Fahad, S.; Datta, R.; Zafar-ul-Hye, M.; Danish, S. Studying soil erosion by evaluating changes in Physico-chemical properties of soils under different land-use types. J. Saudi. Soc. Agric. Sci. 2021, 20, 190–197. [Google Scholar] [CrossRef]
  17. Chum, H.; Faaij, A.; Moreira, J.; Berndes, G.; Dhamija, P.; Dong, H.; Gabrielle, B.; Eng, A.G.; Lucht, W.; Mapako, M. Bioenergy. In IPCC Special Report on Renewable Energy Sources and Climate Change Mitigation; Edenhofer, O., Pichs-Madruga, R., Sokona, Y., Seyboth, K., Matschoss, P., Kadner, S., Zwickel, T., Eickemeier, P., Hansen, G., Schlömer, S., et al., Eds.; Cambridge University Press: Cambridge, UK; New York, NY, USA, 2011; pp. 209–332. [Google Scholar]
  18. Hassan, M.U.; Aamer, M.; Mahmood, A.; Awan, M.I.; Barbanti, L.; Seleiman, M.F.; Bakhsh, G.; Alkharabsheh, H.M.; Babur, E.; Shao, J.; et al. Management strategies to mitigate N2O emissions in agriculture. Life 2022, 12, 439. [Google Scholar] [CrossRef] [PubMed]
  19. Baker, J.M.; Fassbinder, J.; Lamb, J.A. The impact of corn stover removal on N2O emission and soil respiration: An investigation with automated chambers. BioEnergy Res. 2014, 7, 503–508. [Google Scholar] [CrossRef]
  20. Aulakh, M.S.; Khera, T.S.; Doran, J.W.; Bronson, K.F. Denitrification, N2O and CO2 fluxes in rice-wheat cropping system as affected by crop residues, fertilizer N and legume green manure. Biol. Fertil. Soils 2001, 34, 375–389. [Google Scholar] [CrossRef]
  21. Huang, Y.; Zou, J.; Zheng, X.; Wang, Y.; Xu, X. Nitrous oxide emissions as influenced by amendment of plant residues with different C:N ratios. Soil Biol. Biochem. 2004, 36, 973–981. [Google Scholar] [CrossRef]
  22. Ball, B.C.; Scott, A.; Parker, J.P. Field N2O, CO2 and CH4 fluxes in relation to tillage, compaction and soil quality. Soil Till. Res. 1999, 53, 29–39. [Google Scholar] [CrossRef]
  23. Fontaine, S.; Bardoux, G.; Benest, D.; Verdier, B.; Mariotti, A.; Abbadie, L. Mechanisms of the priming effect in a savannah soil amended with cellulose. Soil Sci. Soc. Am. J. 2004, 68, 125. [Google Scholar] [CrossRef]
  24. Derrien, D.; Plain, C.; Courty, P.E.; Gelhaye, L.; Moerdijk-Poortvliet, T.C.W.; Thomas, F.; Versini, A.; Zeller, B.; Koutika, L.S.; Boschker, H.T.S.; et al. Does the addition of labile substrate destabilise old soil organic matter? Soil Biol. Biochem. 2014, 76, 149–160. [Google Scholar] [CrossRef]
  25. Badagliacca, G.; Ruisi, P.; Rees, R.M.; Saia, S. An assessment of factors controlling N2O and CO2 emissions from crop residues using different measurement approaches. Biol. Fertil. Soils 2017, 53, 547–561. [Google Scholar] [CrossRef] [Green Version]
  26. Dendooven, L.; Patiño-Zúñiga, L.; Verhulst, N.; Luna-Guido, M.; Marsch, R.; Govaerts, B. Global warming potential of agricultural systems with contrasting tillage and residue management in the central highlands of Mexico. Agric. Ecosyst. Environ. 2012, 152, 50–58. [Google Scholar] [CrossRef]
  27. Abalos, D.; Sanz-Cobena, A.; Garcia-Torres, L.; van Groenigen, J.W.; Vallejo, A. Role of maize stover incorporation on nitrogen oxide emissions in a non-irrigated Mediterranean barley field. Plant Soil 2013, 364, 357–371. [Google Scholar] [CrossRef] [Green Version]
  28. Lenka, N.K.; Lal, R. Soil aggregation and greenhouse gas flux after 15 years of wheat straw and fertilizer management in a no-till system. Soil Tillage Res. 2013, 126, 78–89. [Google Scholar] [CrossRef]
  29. Jin, V.L.; Baker, J.M.; Johnson, J.M.F.; Karlen, D.L.; Lehman, R.M.; Osborne, S.L.; Sauer, T.J.; Stott, D.E.; Varvel, G.E.; Venterea, R.T.; et al. Soil greenhouse gas emissions in response to corn stover removal and tillage management across the US Corn Belt. BioEnergy Res. 2014, 7, 517–527. [Google Scholar] [CrossRef] [Green Version]
  30. Parton, W.J.; Stewart, J.W.B.; Cole, C.V. Dynamics of C, N, P and S in grassland soils: A model. Biogeochemistry 1988, 5, 109–131. [Google Scholar] [CrossRef]
  31. Hartman, M.D.; Parton, W.J.; Del Grosso, S.F.; Easter, M. The Daily Century Ecosystem, Soil Organic Matter, Nutrient Cycling, Nitrogen Trace Gas, and Methane Model. NREL-Colorado State University, 2016. Available online: http://warnercnr.colostate.edu/lam/shared/25hFJQJu/DayCent_Manual_07.29.201/6.pdf (accessed on 10 February 2022).
  32. Kim, S.; Dale, B.E. Life cycle assessment of various cropping systems utilized for producing biofuels: Bioethanol and biodiesel. Biomass Bioenergy 2005, 29, 426–439. [Google Scholar] [CrossRef]
  33. Kim, S.; Dale, B.E.; Jenkins, R. Life cycle assessment of corn grain and corn stover in the US. Int. J. Life Cycle Assess. 2009, 14, 160–174. [Google Scholar] [CrossRef]
  34. Argonne National Laboratory, GREET Model. 2017. Available online: https://greet.es.anl.gov/ (accessed on 10 February 2022).
  35. Wang, M.Q.; Han, J.; Haq, Z.; Tyner, W.E.; Wu, M.; Elgowainy, A. Energy and greenhouse gas emission effects of corn and cellulosic ethanol with technology improvements and land use changes. Biomass Bioenergy 2011, 35, 1885–1896. [Google Scholar] [CrossRef] [Green Version]
  36. Wang, M.; Han, J.; Dunn, J.B.; Cai, H.; Elgowainy, A. Well-to-wheels energy use and greenhouse gas emissions of ethanol from corn, sugarcane and cellulosic biomass for US use. Environ. Res. Lett. 2012, 7, 045905. [Google Scholar] [CrossRef] [Green Version]
  37. Gentile, R.; Vanlauwe, B.; Chivenge, P.; Six, J. Interactive effects from combining fertilizer and organic residue inputs on nitrogen transformations. Soil Biol. Biochem. 2008, 40, 2375–2384. [Google Scholar] [CrossRef]
  38. Lin, S.; Iqbal, J.; Hu, R.; Shaaban, M.; Cai, J.; Chen, X. Nitrous oxide emissions from yellow brown soil as affected by incorporation of crop residues with different carbon-to-nitrogen ratios: A case study in central China. Arch. Environ. Contam. Toxicol. 2013, 65, 183–192. [Google Scholar] [CrossRef]
  39. Shan, J.; Yan, X. Effects of crop residue returning on nitrous oxide emissions in agricultural soils. Atmos. Environ. 2013, 71, 170–175. [Google Scholar] [CrossRef]
  40. Crutzen, P.J.; Mosier, A.R.; Smith, K.A.; Winiwater, W. N2O release from agro-biofuel production negates global warming reduction by replacing fossil fuels. Atmos. Chem. Phys. 2008, 8, 389–395. [Google Scholar] [CrossRef] [Green Version]
  41. Battaglia, M.L.; Groover, G.; Thomason, W.E. Value and Implications of Corn Stover Removal from Virginia Fields. Virginia Cooperative Extension Publication CSES-180. Blacksburg, VA. 2017. Available online: http://pubs.ext.vt.edu/CSES/CSES-180/CSES-180.html (accessed on 10 February 2022).
  42. Hill, J.; Nelson, E.; Tilman, D.; Polasky, S.; Tiffany, D. Environmental, economic, and energetic costs and benefits of biodiesel and ethanol biofuels. Proc. Natl. Acad. Sci. USA 2006, 103, 11206–11210. [Google Scholar] [CrossRef] [PubMed] [Green Version]
  43. NRCS, Natural Resource Conservation Service. Web Soil Survey. 2018. Available online: http://websoilsurvey.nrcs.usda.gov/app/HomePage.htm (accessed on 10 February 2022).
  44. USDA-NASS, Quick stats Lite (Beta). 2018. Available online: http://www.nass.usda.gov/Quick_Stats/Lite/index.php (accessed on 10 February 2022).
  45. Brann, D.E.; Holshouser, D.L.; Mullins, G.L. Agronomy Handbook; Virginia Tech Cooperative Extension: Blacksburg, VA, USA, 2000; Volume 424–100, p. 134. [Google Scholar]
  46. Abendroth, L.J.; Elmore, R.W.; Boyer, M.J.; Marlay, S.K. Corn Growth and Development. PMR 1009; Iowa State University Extension: Ames, IA, USA, 2011. [Google Scholar]
  47. SAS Institute. SAS 9.4 User’s Guide; SAS Inst.: Cary, NC, USA, 2014. [Google Scholar]
  48. Ball, B.C.; Crichton, I.; Horgan, G.W. Dynamics of upward and downward N2O and CO2 fluxes in ploughed or no-tilled soils in relation to water-filled pore space, compaction and crop presence. Soil Till. Res. 2008, 101, 20–30. [Google Scholar] [CrossRef]
  49. Davidson, E.A.; Belk, E.; Boone, R.D. Soil water content and temperature as independent or confounded factors controlling soil respiration in a temperate mixed hardwood forest. Glob. Change Biol. 1998, 4, 217–227. [Google Scholar] [CrossRef] [Green Version]
  50. Borken, W.; Davidson, E.A.; Savage, K.; Gaudinski, J.; Trumbore, S.E. Drying and Wetting Effects on Carbon Dioxide Release from Organic Horizons. Soil Sci. Soc. Am. J. 2003, 67, 1888–1896. [Google Scholar] [CrossRef] [Green Version]
  51. Wei, S.; Zhang, X.; McLaughlin, N.B.; Liang, A.; Jia, S.; Chen, X.; Chen, X. Effect of soil temperature and soil moisture on CO2 flux from eroded landscape positions on black soil in Northeast China. Soil Tillage Res. 2014, 144, 119–125. [Google Scholar] [CrossRef]
  52. Dalal, R.C.; Allen, D.E. Greenhouse gas fluxes from natural ecosystems. Aust. J. Bot. 2008, 56, 369–407. [Google Scholar] [CrossRef]
  53. Gritsch, C.; Zimmermann, M.; Zechmeister-Boltenstern, S. Interdependencies between temperature and moisture sensitivities of CO2 emissions in European land ecosystems. Biogeosciences 2015, 12, 5981–5993. [Google Scholar] [CrossRef] [Green Version]
  54. Mosier, A.; Wassmann, R.; Verchot, L.; King, J.; Palm, C. Methane and nitrogen oxide fluxes in tropical agricultural soils, sources, sinks and mechanisms. Environ. Dev. Sustain. 2004, 6, 11–49. [Google Scholar] [CrossRef]
  55. Guzman, J.; Al-Kaisi, M.; Parkin, T. Greenhouse Gas Emissions Dynamics as Influenced by Corn Residue Removal in Continuous Corn System. Soil Sci. Soc. Am. J. 2015, 79, 612–625. [Google Scholar] [CrossRef]
  56. Behnke, G.D.; Zuber, S.M.; Pittelkow, C.M.; Nafziger, E.D.; Villamil, M.B. Long-term crop rotation and tillage effects on soil greenhouse gas emissions and crop production in Illinois, USA. Agric. Ecosyst. Environ. 2018, 261, 62–70. [Google Scholar] [CrossRef]
  57. Bouwman, A.F.; Boumans, L.J.M.; Batjes, N.H. Emissions of N2O and NO from fertilised fields: Summary of available measurement data. Glob. Biogeochem. Cycles 2002, 16, 1058. [Google Scholar] [CrossRef]
  58. Bouwman, A.F.; Boumans, L.J.M.; Batjes, N.H. Modeling global annual N2O and NO emissions from fertilised fields. Glob. Biogeochem. Cycles 2002, 16, 1080. [Google Scholar] [CrossRef]
  59. Novemberoa, R.; Tejeda, H.R. Evaluation of the N2O emissions from N in plant residues as affected by environmental and management factors. Nutr. Cycl. Agroecosyst. 2006, 75, 29–46. [Google Scholar] [CrossRef]
  60. Stehfest, E.; Bouwman, L. N2O and NO emission from agricultural fields and soils under natural vegetation: Summarizing available measurement data and modeling of global annual emissions. Nutr. Cycl. Agroecosyst. 2006, 74, 207–228. [Google Scholar] [CrossRef]
  61. De Klein, C.; Novemberoa, R.S.A.; Ogle, S.; Smith, K.A.; Rochette, P.; Wirth, T.C.; McConkey, B.G.; Mosier, A.; Rypdal, K. N2O Emissions from Managed Soils, and CO2 Emissions from Lime and Urea Application. In IPCC Guidelines for National Greenhouse Gas Inventories, Agriculture, Forestry and Other Land Use; IPCC: Geneva, Switzerland, 2006; Volume 4, pp. 1–54. Available online: https://www.ipcc-nggip.iges.or.jp/public/2006gl/pdf/4_Volume4/V4_11_Ch11_N2O&CO2.pdf (accessed on 1 June 2022).
  62. Duiker, S.W.; Lal, R. Crop residue and tillage effects on carbon sequestration in a Luvisol in central Ohio. Soil Till. Res. 1999, 52, 73–81. [Google Scholar] [CrossRef]
  63. Jacinthe, P.A.; Lal, R.; Kimble, J.M. Carbon budget and seasonal carbon dioxide emission from a central Ohio Luvisol as influenced by wheat residue amendment. Soil Till. Res. 2002, 67, 147–157. [Google Scholar] [CrossRef]
  64. McSwiney, C.P.; Robertson, G.P. Nonlinear response of N2O flux to incremental fertilizer addition in a continuous maize (Zea mays L.) cropping system. Glob. Change Biol. 2005, 11, 1712–1719. [Google Scholar] [CrossRef]
Figure 1. Chronological chart with the detail of the full crop rotations and the gas sampling protocol for Blacksburg and New Kent (NK1 and NK2) sites in Virginia (top); information including sequential sampling order, effective date of sampling and main crop management milestone at the time of gas sampling for each study (bottom).
Land 11 00846 g001
Figure 2. Metal ring after field installation at the pre-sampling (left) and at the sampling and post-sampling stage (right).
Land 11 00846 g002
Figure 3. Total accumulated rainfall (in mm) and daily mean air temperature (in °C) for the period May through October 2017, in New Kent, VA. Source: National Oceanic and Atmospheric Administration, National Climate Data Center (https://www.ncdc.noaa.gov; 1 January 2022).
Land 11 00846 g003
Figure 4. Flux of CH4 and N2O (mg m−2 day−1) under five corn stover retained rates following corn planting in a continuous corn rotation in 2016 in Blacksburg, Virginia. Polynomial best fit line, quadratic equation and coefficient of determination (R2) are presented for each gas. Minimum points (x’ = −b/2a) and their associated gas response fluxes (mg m−2 day−1) were calculated for each significant quadratic function and are symbolized by an oversized solid shape (circle, N2O = [(0.0052 × 4.902) – (0.051 × 4.90) + 4.8946] = 4.76 mg m−2 day−1); diamond, (CH4 = [(0.0036 × 5.072) – (0.0365 × 5.07) + 3.4499] = 3.36 mg m−2 day−1).
Land 11 00846 g004
Figure 5. Flux of CH4 and N2O in a factorial design of sixteen total residue retained rates from corn and wheat following a V4 corn nitrogen fertilization in a corn-wheat/soybean rotation in 2017 in New Kent, experiment 2 (NK2), Virginia. Predictor variable total residue retained refers to the sum of corn stover and wheat straw residue treatments allocated in 2015 and 2016. Polynomial best fit line, quadratic equation and coefficient of determination (R2) are presented for each gas. Maximum points (x’ = −b/2a) and their associated gas response fluxes for each significant quadratic model were calculated and are symbolized by an oversized solid shape (circle, N2O = [(−0.0096 × 5.442) + (0.1044 × 5.44) + 5.5115] = 5.79 mg m−2 day−1); diamond, (CH4 = [(−0.0080 × 5.692) + (0.0911 × 5.69) + 4.036] = 4.30 mg m−2 day−1).
Land 11 00846 g005
Table 1. Residue sources and retention rates for a field-based greenhouse gas emissions study in Blacksburg and New Kent, VA.
LocationTreatmentCorn StoverWheat StrawTotal Residue
Mg ha−1
Blacksburg10.00--
23.33--
36.66--
410.00--
520.00--
New Kent (NK1 and NK2)10.000.000.00
20.001.001.00
30.002.002.00
40.003.003.00
53.330.003.33
63.331.004.33
73.332.005.33
83.333.006.33
96.660.006.66
106.661.007.66
116.662.008.66
126.663.009.66
1310.000.0010.00
1410.001.0011.00
1510.002.0012.00
1610.003.0013.00
Total retained residues here refer to the summation of corn stover and wheat straw residue treatments allocated in 2015 and 2016. Soybean residues, even when part of the rotation, are not considered here.
Table 2. Detail of the management practices applied to continuous corn in the period 2015–2017 at Kentland Farm, Blacksburg, VA, USA.
201520162017
Fertilizer application date4 May4 July19 June
N–P2O5–K2O, kg ha−143-43-4356-0-056-0-0
Seeding date3 May9 May11 May
TillageNo-tillNo-tillNo-till
GenotypeP1498HRP1498HRP1498HR
Seed rate, seeds ha−169,18969,18969,189
Seed rate, kg ha−1---
Row width, cm767676
Herbicides date4 May (pre-emerg); 10 June (post-emerg)9 May (all); 24 May (barley silage) 2 May
Pre-emergent
  2,4 D (Dimethylamine salt) 0.498 kg a.i. ha−10.498 kg a.i. ha−1
  Bicep II Magnum (Atrazine + S-Metolachlor) ƛ0.573 kg a.i. ha−1 + 0.351 kg a.i. ha−1 0.717 kg a.i. ha−1 + 0.439 kg a.i. ha−1 0.717 kg a.i. ha−1 + 0.439 kg a.i. ha−1
  Atrazine 4L (Atrazine) 0.235 kg a.i. ha−1
  Glystar plus (Glyphosate) §0.919 kg a.i. ha−1 0.316 kg a.i. ha−1 0.316 kg a.i. ha−1
Post-emergent
  Glystar plus (Glyphosate) §0.460 kg a.i. ha−1 0.316 kg a.i. ha−1
Insecticide dateNoneNoneNone
Fungicide dateNoneNoneNone
Irrigation managementNoneNoneNone
Harvest date 8-OctoberNot harvested20-October
(46.8%) 2,4-Dichlorophenoxyacetic acid. ƛ Atrazine (33.0%) 2-chloro-4-ethylamino-6-isopropylamino-striazine; S-Metolachlor (26.1%) Acetamide, 2-chloro-N-(2-ethyl-6-methylphenyl)-N-(2-methoxy-1-methylethyl],(S). Atrazine (41.9%) 2-chloro-4-ethylamino-6-isopropylamino-striazine. § Glyphosate (41.0%) (N-(phosphonomethyl)glycine). Harvest date for barley cover crop refers to the day when chemical killing is applied to terminate the crop.
Table 3. Detail of the management practices performed in NK1 in the period 2014–2017 at Lanexa, New Kent, VA, USA *.
2014201520162017
WheatWheat (Cont.)SoybeanCornWheatWheat (Cont.)
Fertilizer application date5 November19 March- 2 November15 March
2-April 5-April
N–P2O5–K2O, kg ha−140-60-8067-0-0- 40-60-8067-0-0
67-0-0- 67-0-0
Seeding date28 October-23 June15 April25 October-
TillageNo-tillNo-tillNo-tillNo-tillNo-tillNo-till
GenotypeUSG 3404-Asgrow 5332Channel 197-31USG 3404USG 3404
Seed rate, seeds ha−1--346,00059,300
Seed rate, kg ha−10---135-
Row width, cm191919761919
Herbicides -
Pre-emergent 15 April
  Atrazine 4L (Atrazine) ---0.235 kg a.i. ha−1--
  Glystar plus (Glyphosate) ---0.919 kg a.i. ha−1--
Post-emergent23 November1 April-15 May21 November3 April
  Metribuzin 75 (Metribuzin) ¥ 0.039 kg a.i. ha−1---0.039 kg a.i. ha−1-
  Prowl H2O (Pendimethalin) 0.309 kg a.i. ha−1---0.309 kg a.i. ha−1-
  Glystar plus (Glyphosate) ---0.460 kg a.i. ha−1--
  Harmony SG (Thifensulfuron-methyl)-0.092 kg a.i. ha−1---0.092 kg a.i. ha−1
Insecticide date23-November1 April--23-November1 April
  Baythroid XL (ß-cyfluthrin) 0.002 kg a.i. ha−1---0.002 kg a.i. ha−1-
  Warrior T (Lambda-cyhalothrin) -0.001 kg a.i. ha−1---0.001 kg a.i. ha−1
Fungicide date-1 April; 14 May- -2 April; 11 May
  QuiltXcel (Azoxystrobin + Propiconazole) ƛ-0.022 + 0.017 kg a.i. ha−1--0.022 + 0.017 kg a.i. ha−1
  Prosaro (Prothioconazole + Tebuconazole) § -0.020 + 0.020 kg a.i. ha−1--0.020 + 0.020 kg a.i. ha−1
Growth regulator dateNone1 April---3 April
  Palisade EC -0.002 kg a.i. ha−1---0.002 kg a.i. ha−1
Irrigation managementNoneNoneNoneNone
Harvest date-22 June 6 September-22 June
* Plot 2, initiated after corn harvest in September 2015, had similar treatments than Plot 1. Atrazine (33.0%) 2-chloro-4-ethylamino-6-isopropylamino-striazine; S-Metolachlor (26.1%) Acetamide, 2-chloro-N-(2-ethyl-6-methylphenyl)-N-(2-methoxy-1-methylethyl],(S). Glyphosate (41.0%) (N-(phosphonomethyl)glycine). ¥ Metribuzin (75%): 4-Amino-6-(1,1-dimethylethyl)-3-(methylthio)-1,2,4-triazin-5 (4H)-one. Pendimethalin (38.%): N-(1 -ethylpropyl)-3,4-dimethyl-2,6-dinitrobenzenamine. Thifensulfuron-methyl (50%): Methyl 3-[[[[(4-methoxy-6-methyl-1,3,5-triazin-2-yl) amino]carbonyl]amino]sulfonyl]-2-thiophenecarboxylate. ß-cyfluthrin (12.7%): Cyano(4-fluoro-3-phenoxyphenyl)methyl-3-(2,2-dichloro-ethenyl)-2,2-dimethyl-cyclopropanecarboxylate. Lambda-cyhalothrin (11.4%): [1α(S*),3α(Z)]-(±)-cyano-(3-phenoxyphenyl)methyl-3-(2-chloro-3,3,3-trifluoro-1-propenyl)-2,2-dimethylcyclopropanecarboxylate. ƛ Azoxystrobin (13.5%): Methyl (E)-2-{2-[6-(2-cyanophenoxy)pyrimidin-4-yloxy]phenyl}-3-methoxyacrylate; Propiconazole (11.7%): 1-[[2-(2,4-dichlorophenyl)-4-propyl-1,3-dioxolan-2-yl]methyl]-1H-1,2,4-triazole. § Prothioconazole (19%): 2-[2-(1-Chlorocyclopropyl)-3-(2-chlorophenyl)-2-hydroxypropyl]-1, 2-dihydro-3H-1, 2,4-triazole-3-thione; Tebuconazole (19%): alpha-[2-(4-chlorophenyl)ethyl]-alpha-(1, 1-dimethylethyl)-1H-1, 2,4-triazole-1-ethanol. Trinexapac-ethyl (12.0%): Cyclohexanecarboxylic acid, 4-(cyclopropylhydroxymethylene)-3,5-dioxo-, ethyl ester(95266-40-3).
Table 4. Quadratic regression parameters, coefficients of determination (R2), p-values (Pr > t), and range and mean response values for CH4 (mg m−2 day−1), N2O (mg m−2 day−1), and CO2 (g m−2 day−1) fluxes under different corn stover (CS) and wheat straw (WS) management in 2016 and 2017 in Blacksburg and New Kent, Virginia.
Blacksburg (BB) ParameterR2Pr > tRangeMean
Timing abc
June 2016 (CS)CH4, mg m−2 day−10.0036−0.03653.450.5140.0482.74–4.523.55
N2O, mg m−2 day−10.0052−0.05104.890.5160.0513.91–6.525.06
CO2, g m−2 day−10.0048−0.05564.690.2580.1953.83–6.404.78
June 2017 (CS)CH4, mg m−2 day−1−0.00110.04134.180.1210.3633.42–5.014.38
N2O, mg m−2 day−1−0.00250.06126.190.0420.4675.10–7.516.39
CO2, g m−2 day−1−0.00150.05236.600.0670.4945.59–8.116.86
New Kent, experiment 1 (NK1) ParameterR2Pr > tRangeMean
Timing abc
October, 2016 (WS)CH4, mg m−2 day−1−0.22390.54481.340.1100.3040.04–3.931.71
N2O, mg m−2 day−10.0600−0.13710.960.0200.6690.02–0.920.41
CO2, g m−2 day−10.0095−0.54573.620.0200.7180.22–2.140.99
New Kent, experiment 2 (NK2) ParameterR2Pr > tRangeMean
Timing abc
July 2016 (CS)CH4, mg m−2 day−10.0152−0.15064.020.1320.2233.17–5.064.07
N2O, mg m−2 day−10.0286−0.26675.440.2020.1513.15–6.915.42
CO2, g m−2 day−10.0375−0.33775.230.2490.1142.78–6.865.27
May 2017 (CS + WS)CH4, mg m−2 day−1−0.00800.09114.040.1070.0203.57–5.224.17
N2O, mg m−2 day−1−0.00960.10445.510.0900.0494.48–7.305.65
CO2, g m−2 day−1−0.00810.07805.970.0740.1355.19–7.786.02
October 2017 (CS + WS)CH4, mg m−2 day−1−0.02580.43502.170.0870.1380.22–7.483.51
N2O, mg m−2 day−10.0028−0.03643.690.0010.8850.67–7.553.62
CO2, g m−2 day−1−0.00990.19423.280.0120.6820.43–10.064.01
Measurements taken following corn planting on 7 June 2016, and 12 June 2017, corresponding to sampling times 4 and 8 in Figure 1, respectively. Measurements taken following corn harvest on 16 October 2016, corresponding to sampling time 6 in Figure 1. Measurements taken following wheat harvest/soybean planting, N fertilization at V4 in corn, and corn harvest on 12 July 2016, 29 May 2017, and 16 October 2017, respectively. Dates corresponding to sampling times 5, 7 and 9 in Figure 1, respectively.
Publisher’s Note: MDPI stays neutral with regard to jurisdictional claims in published maps and institutional affiliations.

