Article

A Survey Bias Index Based on Unmanned Aerial Vehicle Imagery to Review the Accuracy of Rural Surveys

Key Laboratory of Land Surface Pattern and Simulation, Institute of Geographical Science and Natural Resources Research, Chinese Academy of Sciences, Beijing 100101, China
Land 2022, 11(6), 873; https://doi.org/10.3390/land11060873
Submission received: 10 March 2022 / Revised: 30 May 2022 / Accepted: 4 June 2022 / Published: 8 June 2022

Abstract

:
Field surveys and questionnaires are a cornerstone of rural socioeconomic research, providing invaluable firsthand data regarding on-the-ground situations. However, cost-effective and efficient methods for validating the accuracy of self-reported data in such questionnaires are lacking. Biased data are likely to lead to incorrect conclusions. In this study, we propose a new index, the survey bias index (SBI), for evaluating the degree of survey bias in field surveys. This index was obtained by comparing the data recorded in questionnaires with those from portable unmanned aerial vehicles (UAVs). In a case study, we employed SBI to reveal the degree of survey bias of questionnaires in field surveys on rural homesteads. The SBI of self-reported areas of rural homesteads reached 0.439, implying that 43.9% of data were significantly different from those collected using UAVs. A greater SBI was obtained in the pre-urban zone (0.515) than in the pure rural zone (0.258). These results indicate that homestead areas in the pre-urban zone have more incentive to expand than those in the pure rural zone. UAV remote sensing can strongly support research in the field of social economy, which reveals key information hidden in field surveys and questionnaires.

1. Introduction

Field surveys are a cornerstone of rural socioeconomic research, providing invaluable firsthand data regarding on-the-ground situations. Questionnaires are a key component of field surveys that usually provide a low-cost method of obtaining information regarding a diverse range of factors. Questionnaire accuracy depends upon valid responses from interviewees. This can be ensured by careful questionnaire design as well as via formal assessments of questionnaire repeatability and validity [1]. However, in practice, questionnaires are often used without thorough evaluation, which can result in unknown bias affecting results [2].
Survey bias is apparent not only for stigmatized or illicit behaviors [3,4] but also for minimally controversial topics, such as income [5], attending religious services, and voting [6]. Despite the importance of this concept, there have been few attempts to overcome this confidence problem. One solution to this problem is to introduce third-party data. Kar et al., compared data on self-reported consumption and purchases of LPG cylinders to assess survey biases regarding a clean fuel program in Karnataka, India; a large significant difference was observed between the self-reported mean annual consumption (3.53 cylinders) and annual consumption determined by purchase records (1.73 cylinders). Thus, only 15% of consumers accurately reported their consumption [7]. Tur-Sinai et al., compared self-reported dwelling prices and data from national samples of housing sale transactions using a census tract. They found that the self-reported estimates of dwelling values were, on average, 20% higher than the mean market prices of houses in the corresponding census tracts. The second solution is to compare results obtained using measuring devices [8]. To determine the accuracy of self-reported body mass index, self-reported and measured values were compared. Women tended to underestimate their weight, whereas men overestimated their weight [9]. Verbeij et al. compared the self-reported and the measured use of social media by adolescents and found that these subjects overestimated their time spent on social media [10]. To measure the confidence of the respondents, VR equipment with an electroencephalogram sensor and eye-tracking camera was used to assess social desirability bias from questionnaires. This pioneering strategy was used to incorporate both virtual reality and biosensor technology in surveys [11]. Based on these results, survey bias in questionnaires is quite common. The introduction of third-party data or that measured using devices has explained some survey bias. However, there is no uniform approach for representing the degree of bias.
Recently, China’s rural population has declined by approximately 13%, whereas the population in rural homestead areas has increased by approximately 4% [12]. The vacancy rate of rural homesteads in China has reached 10–15% [13], resulting in a large quantity of unused rural land [14]. Consequently, rural homesteads have attracted the attention of rural social researchers [15]. Questionnaires administered via personal interviews can be applied in rural homesteads for exploring the informal withdrawal homestead issue [16]. Because homesteaders often have strong incentives to misstate data (e.g., to avoid revealing illegal or informal housing arrangements or to receive increased government subsidies) [17,18,19], questionnaires can lead to highly biased results depending on the status of the respondents. To overcome these limitations, new methods for rural homestead surveys should be developed to minimize survey bias. This research area presents an ideal opportunity for testing a new method for identifying survey bias in reported data [20].
This study presents a new index method implementing new technologies, such as an unmanned aerial vehicle (UAV), specifically for evaluating survey bias encountered during rural surveys. Survey bias can be revealed by comparing data collected on homesteads from questionnaires; UAV can be used to verify the reliability of rural homestead survey data. This research attempts to fill two gaps by (1) introducing UAVs as measuring devices for verifying the survey bias of self-report homestead areas in rural surveys; and (2) developing a new index method for identifying the degree of survey bias and enabling comparison of the bias results obtained from different areas. Therefore, this research provides academic and practical insights into how the survey bias index (SBI) based on UAVs can reveal attitude responses in rural surveys and how more information can be mined for rural management.
To present the application of this new index method based on UAV, we selected Jianfeng Village in Anhui province in China as the study case. This paper is divided into five sections. The next section explains the case selection, and it elaborates on the methodological aspects of this paper. Section 3 presents the results from the application of the SBI. Section 4 discusses the results, and Section 5 presents the main conclusions.

2. Methods

2.1. Profile of the Study Area

Anhui Province is the pilot location of China’s systemic reform of collective rural property rights. Qimen County is globally renowned for its black tea. Jianfeng Village, located along the eastern edge of Qimen County in the town of Qishan, is a typical area of rural–urban transfer (Figure 1). We selected two zones in Jianfeng Village to test our questionnaire and UAV survey: the pre-urban area (Zone A) and a strictly rural area (Zone B).

2.2. Questionnaire and Survey Design

Field survey interviews with farmers residing in 31 different rural homesteads were conducted over a 3-day field survey. Each interview lasted for approximately 30 min. The interviews comprised questions about the farmers’ homesteads, including the area of different functional parts (e.g., main building, ancillary building, and yard), as well as the year of construction, number of floors, and number of residents (Table 1). Interview data from each farmer were coded as N01–N31. Homesteads N01–N12 are in Zone A, whereas N13–N31 are in Zone B. The investigator explained that the purpose of the survey was to evaluate the accuracy of the homestead area, and the survey data would be compared with UAV remote sensing data. Because the study area had many rural residential reconstructions and expansions, and differences exist between the homestead area and the registered area, we chose to record the homestead area data as self-reported in this study.

2.3. UAV Survey

Most studies of UAV technology have focused on the accuracy of data collection, whereas few studies have focused on the associated attitudes of owners of rural homesteads. For instance, Yang et al., used Dajiang UAVs to measure the building density and floor area ratio of rural settlements [21]. UAV can simultaneously acquire real-time high-resolution images, offset the fixed acquisition cycle of optical sensor satellite remote sensing, and respond to dynamic weather conditions (e.g., cloud cover) [22].
A DJI MAVIC Pro UAV (Da-Jiang Innovations, Guangdong, China) was used to estimate the area of each homestead. This UAV was a quadcopter featuring four electric motors, and it was equipped with a CMOS camera with a focal length of 28 mm and 12.35 million effective pixels in a 1-inch CMOS. The UAV’s maximum speed was 18 m/s, and the maximum flight duration was 21 min. UAV data were acquired on 16 August 2019. A dry, non-windy day was selected to avoid distortions caused by UAV camera undulations. Autonomous flight planning was conducted across the study area. The flight path was oriented in the north–south direction at a speed of 11 m/s in two flights of approximately 12 min each. The camera was set to a F-stop of 2.2, shutter speed of 1/2000 s, and ISO-values that adapted automatically to available light conditions, between 100 and 1600 ISO. During UAV image acquisition, a camera angle of −90° was used, and safe mode was engaged. The sensor produced three 20-MP images in the red, green, and blue (RGB) wavelengths. During the flight, the camera was automatically released every 7 m, while the device’s position was simultaneously recorded by an internal GPS/GLONASS dual-mode satellite positioning system. In Zone A, the flight longitude ranged from 117°42′57.60″ E to 117°43′12.00″ E, and the flight latitude ranged from 29°51′07.20″ N to 29°51′10.80″ N. Images were obtained from a height of 109 m with a 70% side overlap, a 90% forward overlap, and an optical GSD of 3.4 cm. The flight area covered was 66,394.21 m2. In Zone B, the flight longitude ranged from 117°42′57.60″ E to 117°43′12.00″ E, and the flight latitude ranged from 29°51′07.20″ N to 29°51′10.80″ N. Images were obtained from a height of 100.4 m with a 70% side overlap, a 90% forward overlap, and an optical GSD of 3.1 cm. The flight area covered was 61,196.23 m2. During the survey, 130 RGB images were obtained.

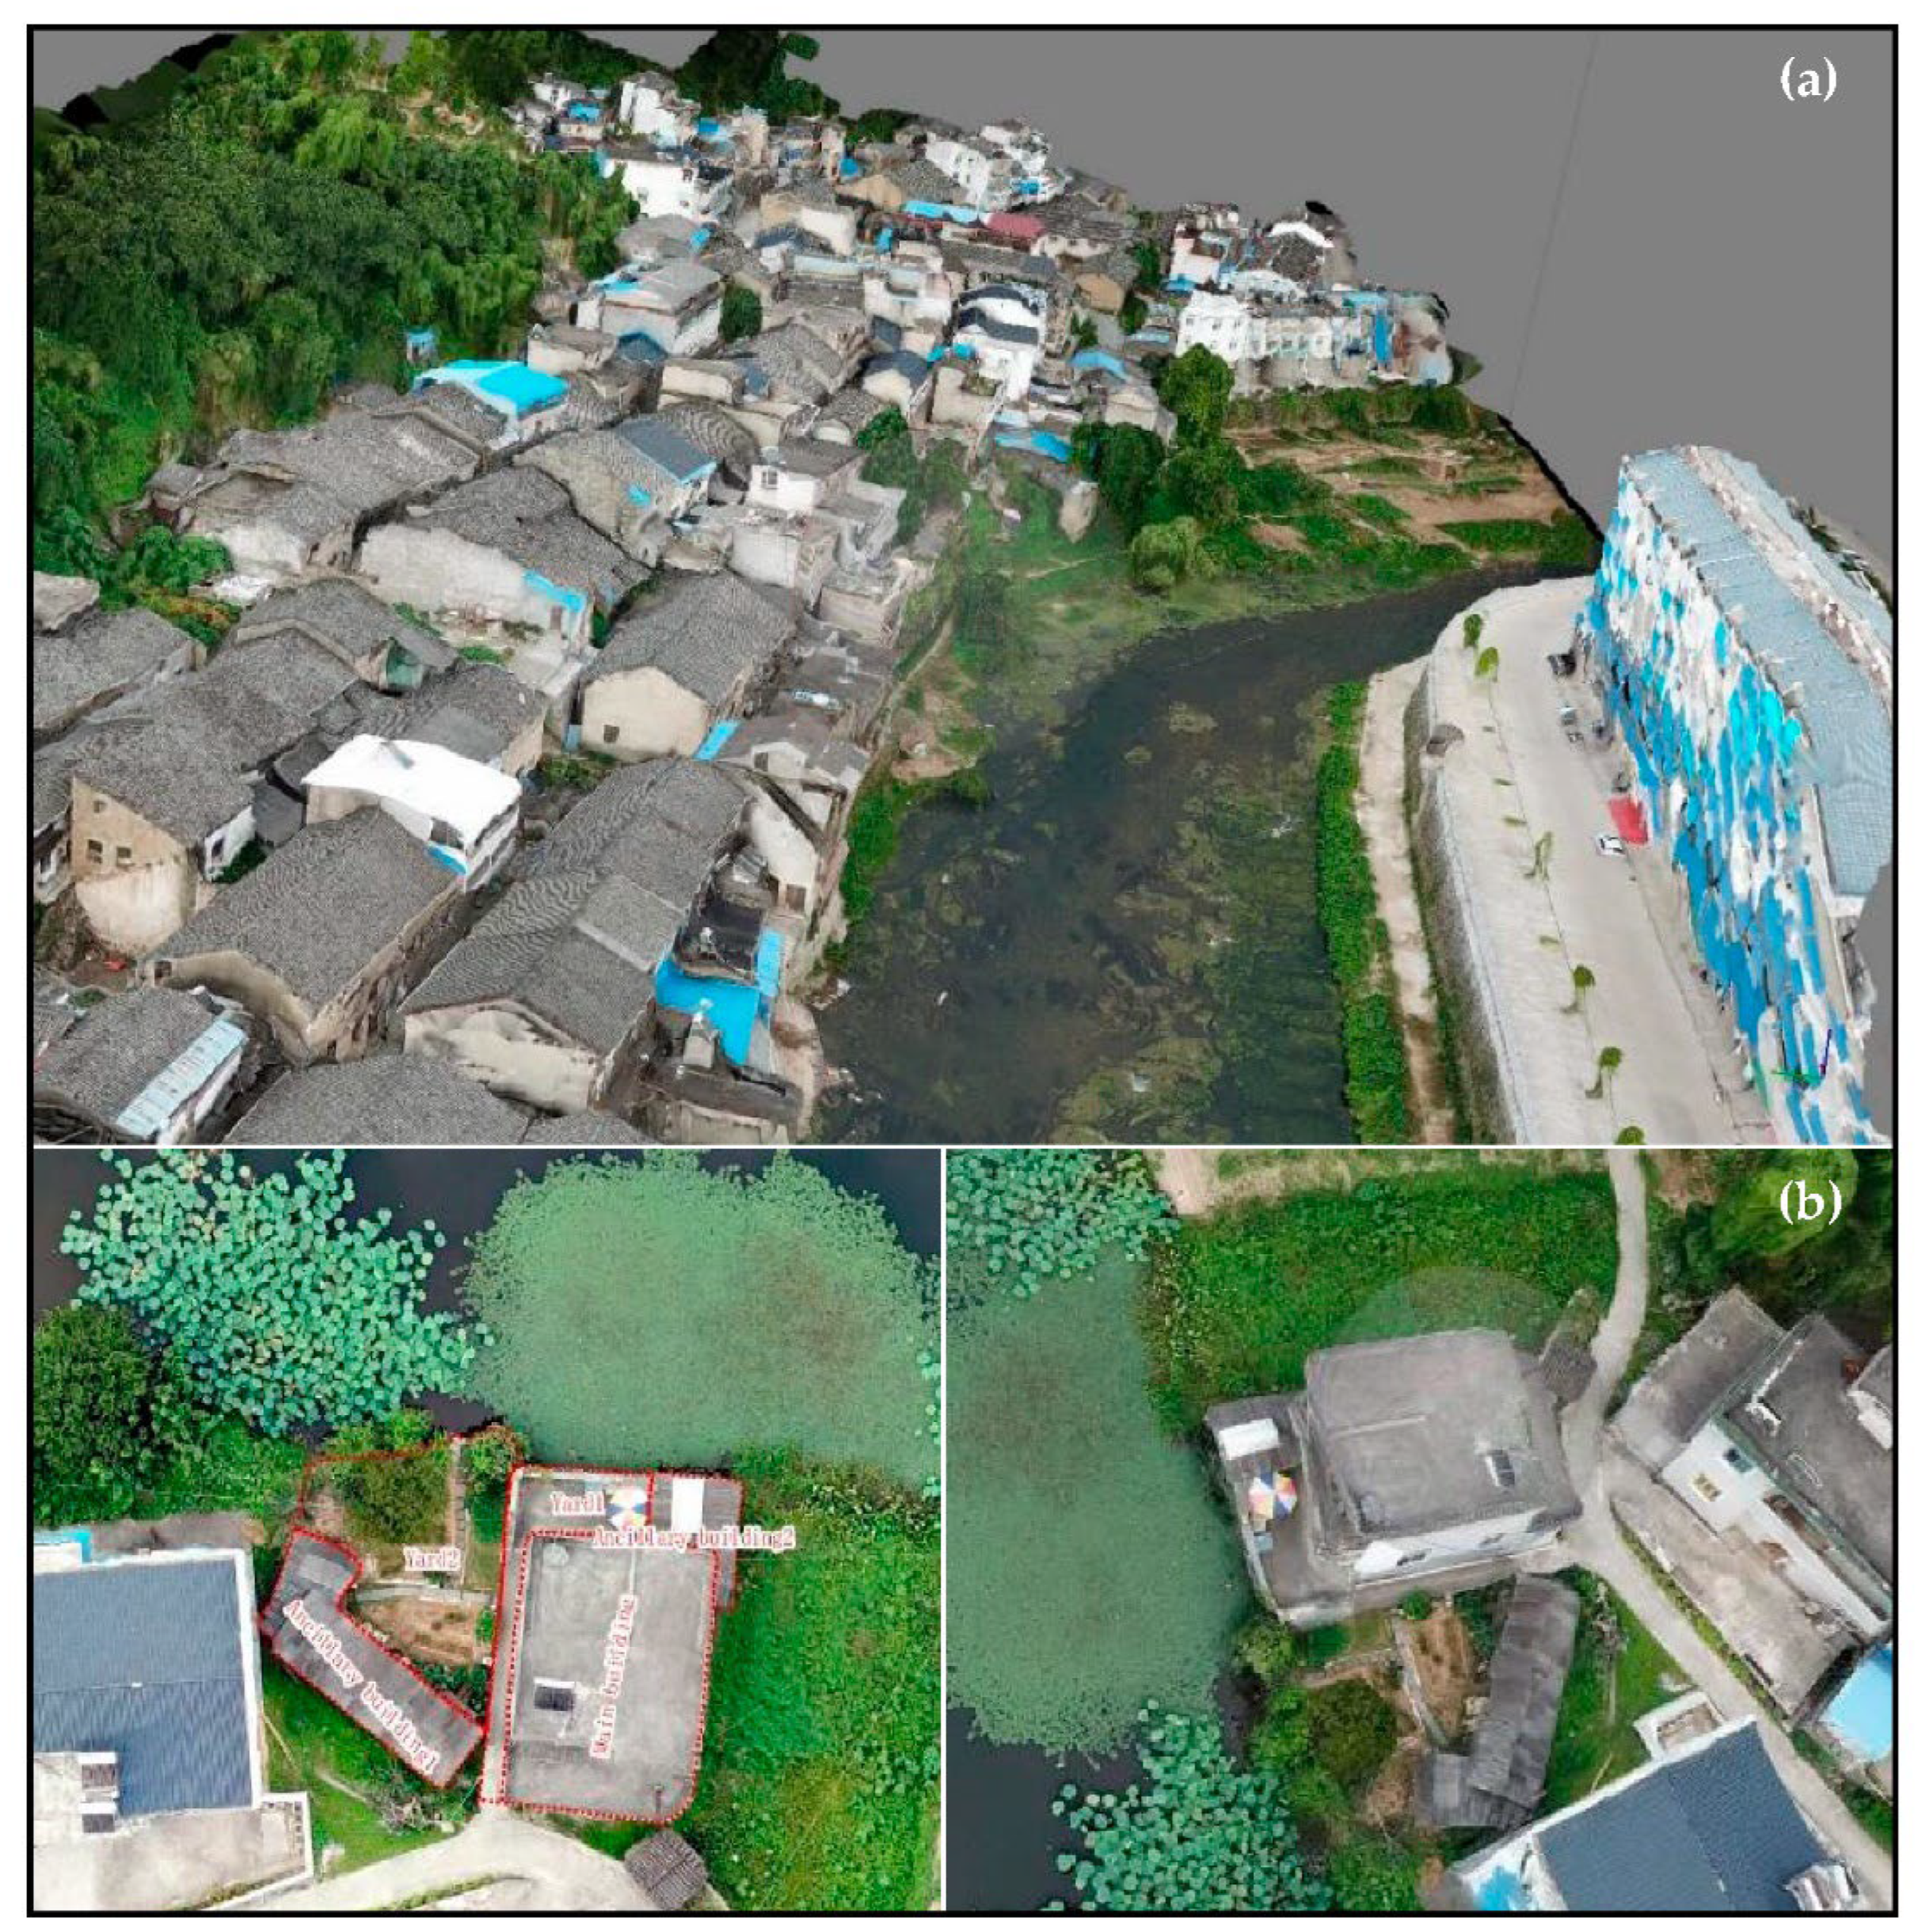
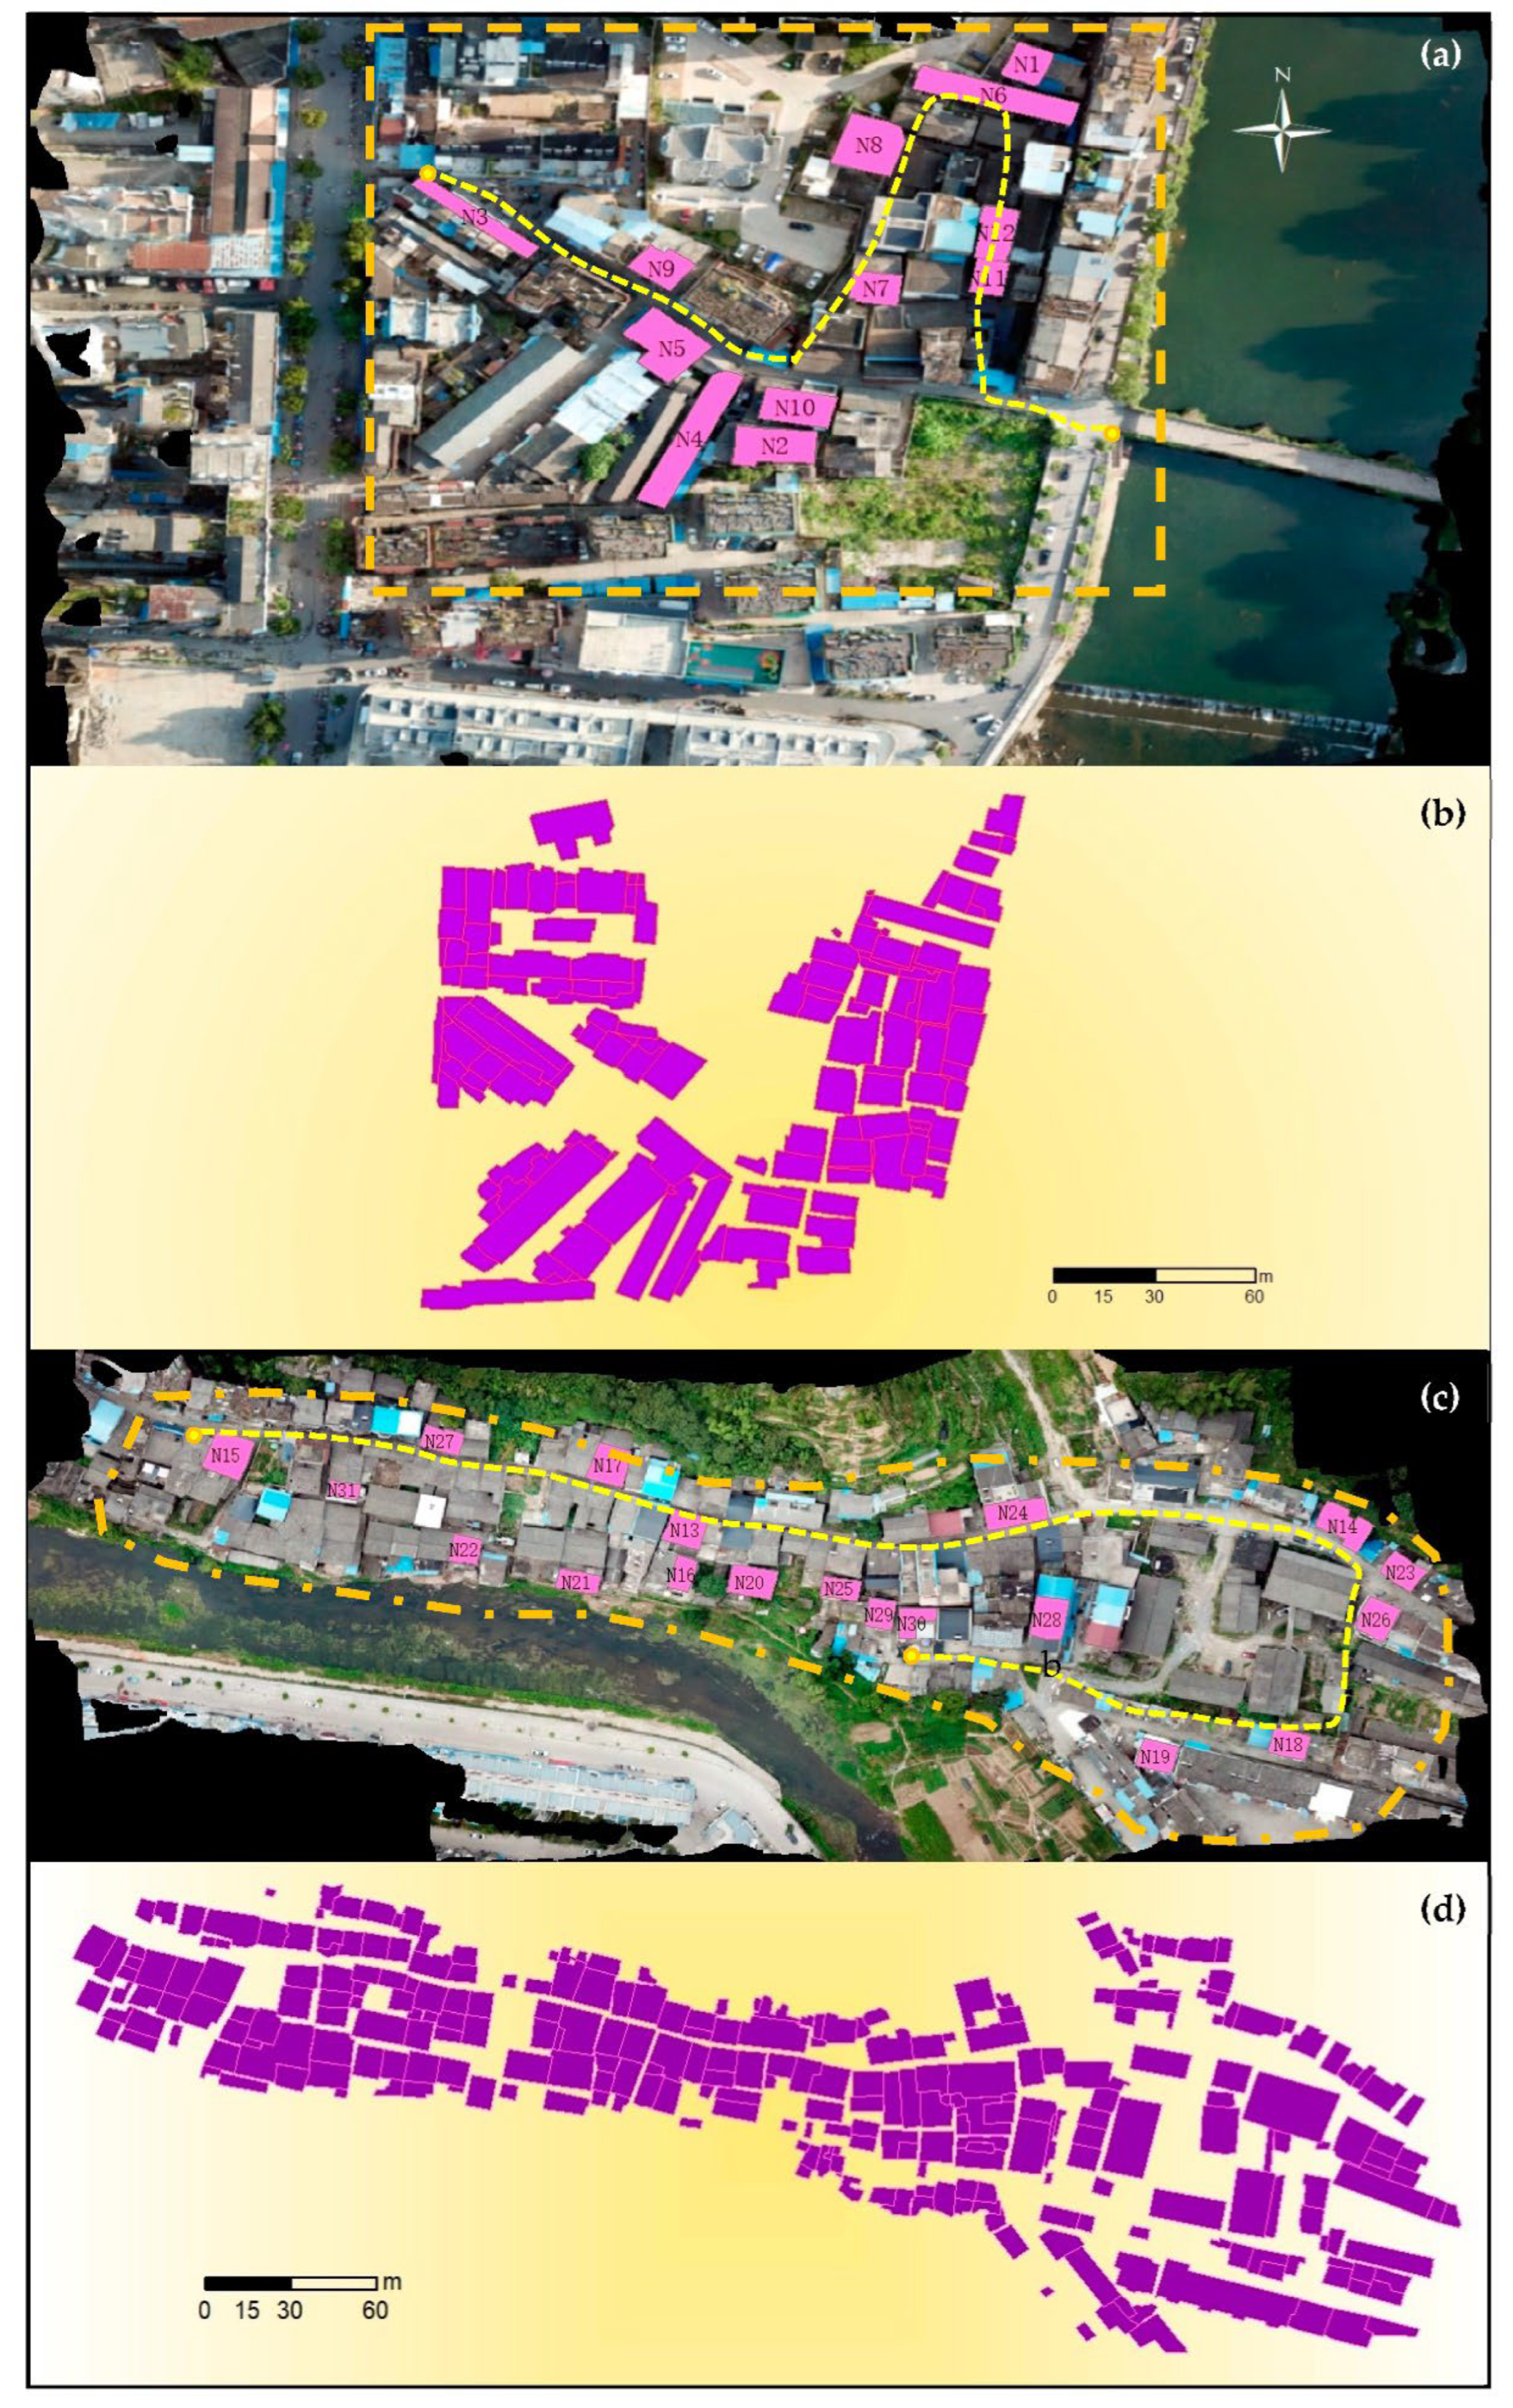
2.4. Three-Dimensional Modeling for Visual Interpretation

The structure from the motion method was used to build a 3D model to enhance the visual interpretation of the collected data. The workflow of the structure from the motion method consists of two major processes: aligning images and building geometry. The 3D point cloud was generated using Agisoft Photoscan Professional Edition software (Agisoft LLC, St. Petersburg, Russia) [23]. First, the camera position for each image and four common points in the images were located and matched to enable the identification of calibration parameters for image comparison. The point cloud was built based on the estimated camera positions and images [24]. A digital surface model and an orthomosaic were also generated [25]. The 3D point cloud digital surface model and the orthophoto are shown in Figure 2a. The orthophoto was used for visual interpretation, with 1-pixel precision in ArcGIS. The 3D tiled model assisted in identifying different functional areas of each rural homestead, such as the main building, ancillary building, and yard (Figure 2b).

2.5. Survey Bias Index

Values obtained from the UAV were set as the baseline. Survey bias was then estimated using the degree of shift from the baseline. Therefore, in the absence of survey bias, the homestead areas reported by the respondents should closely match the information extrapolated from UAV data. Any discrepancy between the datasets indicated some degree of survey bias in the household survey data. To minimize error from respondents’ inaccurate memory, the measurement at the main building area was selected for comparison between the survey data and the UAV data (as respondents were likely to have the greatest familiarity with the dimensions of this facility).
To evaluate survey bias during surveys on rural homesteads and to analyze the interspecific differences in the two survey methods, the index of survey bias for rural surveys was calculated using the least squares method:
S B I = i = 1 n ( V G a p , i V G a p ¯ ) ( V U A V , i V U A V ¯ ) i = 1 n ( V G a p , i V G a p ¯ ) 2
where S B I is the survey bias index, V U A V is the value associated with the rural homestead obtained by UAV (m2), V G a p is the difference between homestead areas obtained from self-reported questionnaires and UAV (m2), n is the number of rural homesteads surveyed using the two methods, and i is the i-th zone surveyed.
An independent samples t-test was used to analyze the mean value comparison. All analyses were performed in SPSS version 19 software (SPSS, Inc., Chicago, IL, USA), and the results were considered significant when p ≤ 0.05.

3. Results

3.1. Descriptive Statistics

Most responses to the survey were from 31 households (Table 2). Male respondents accounted for 58%, and female respondents accounted for 42%. Most residents of the surveyed rural households graduated from primary school or more (79.31%), and only 31.03% of the surveyed sample insisted on engaging in agricultural production. The average area of the homestead was 90.48 m2, and many households had more than three family members (72.41%).

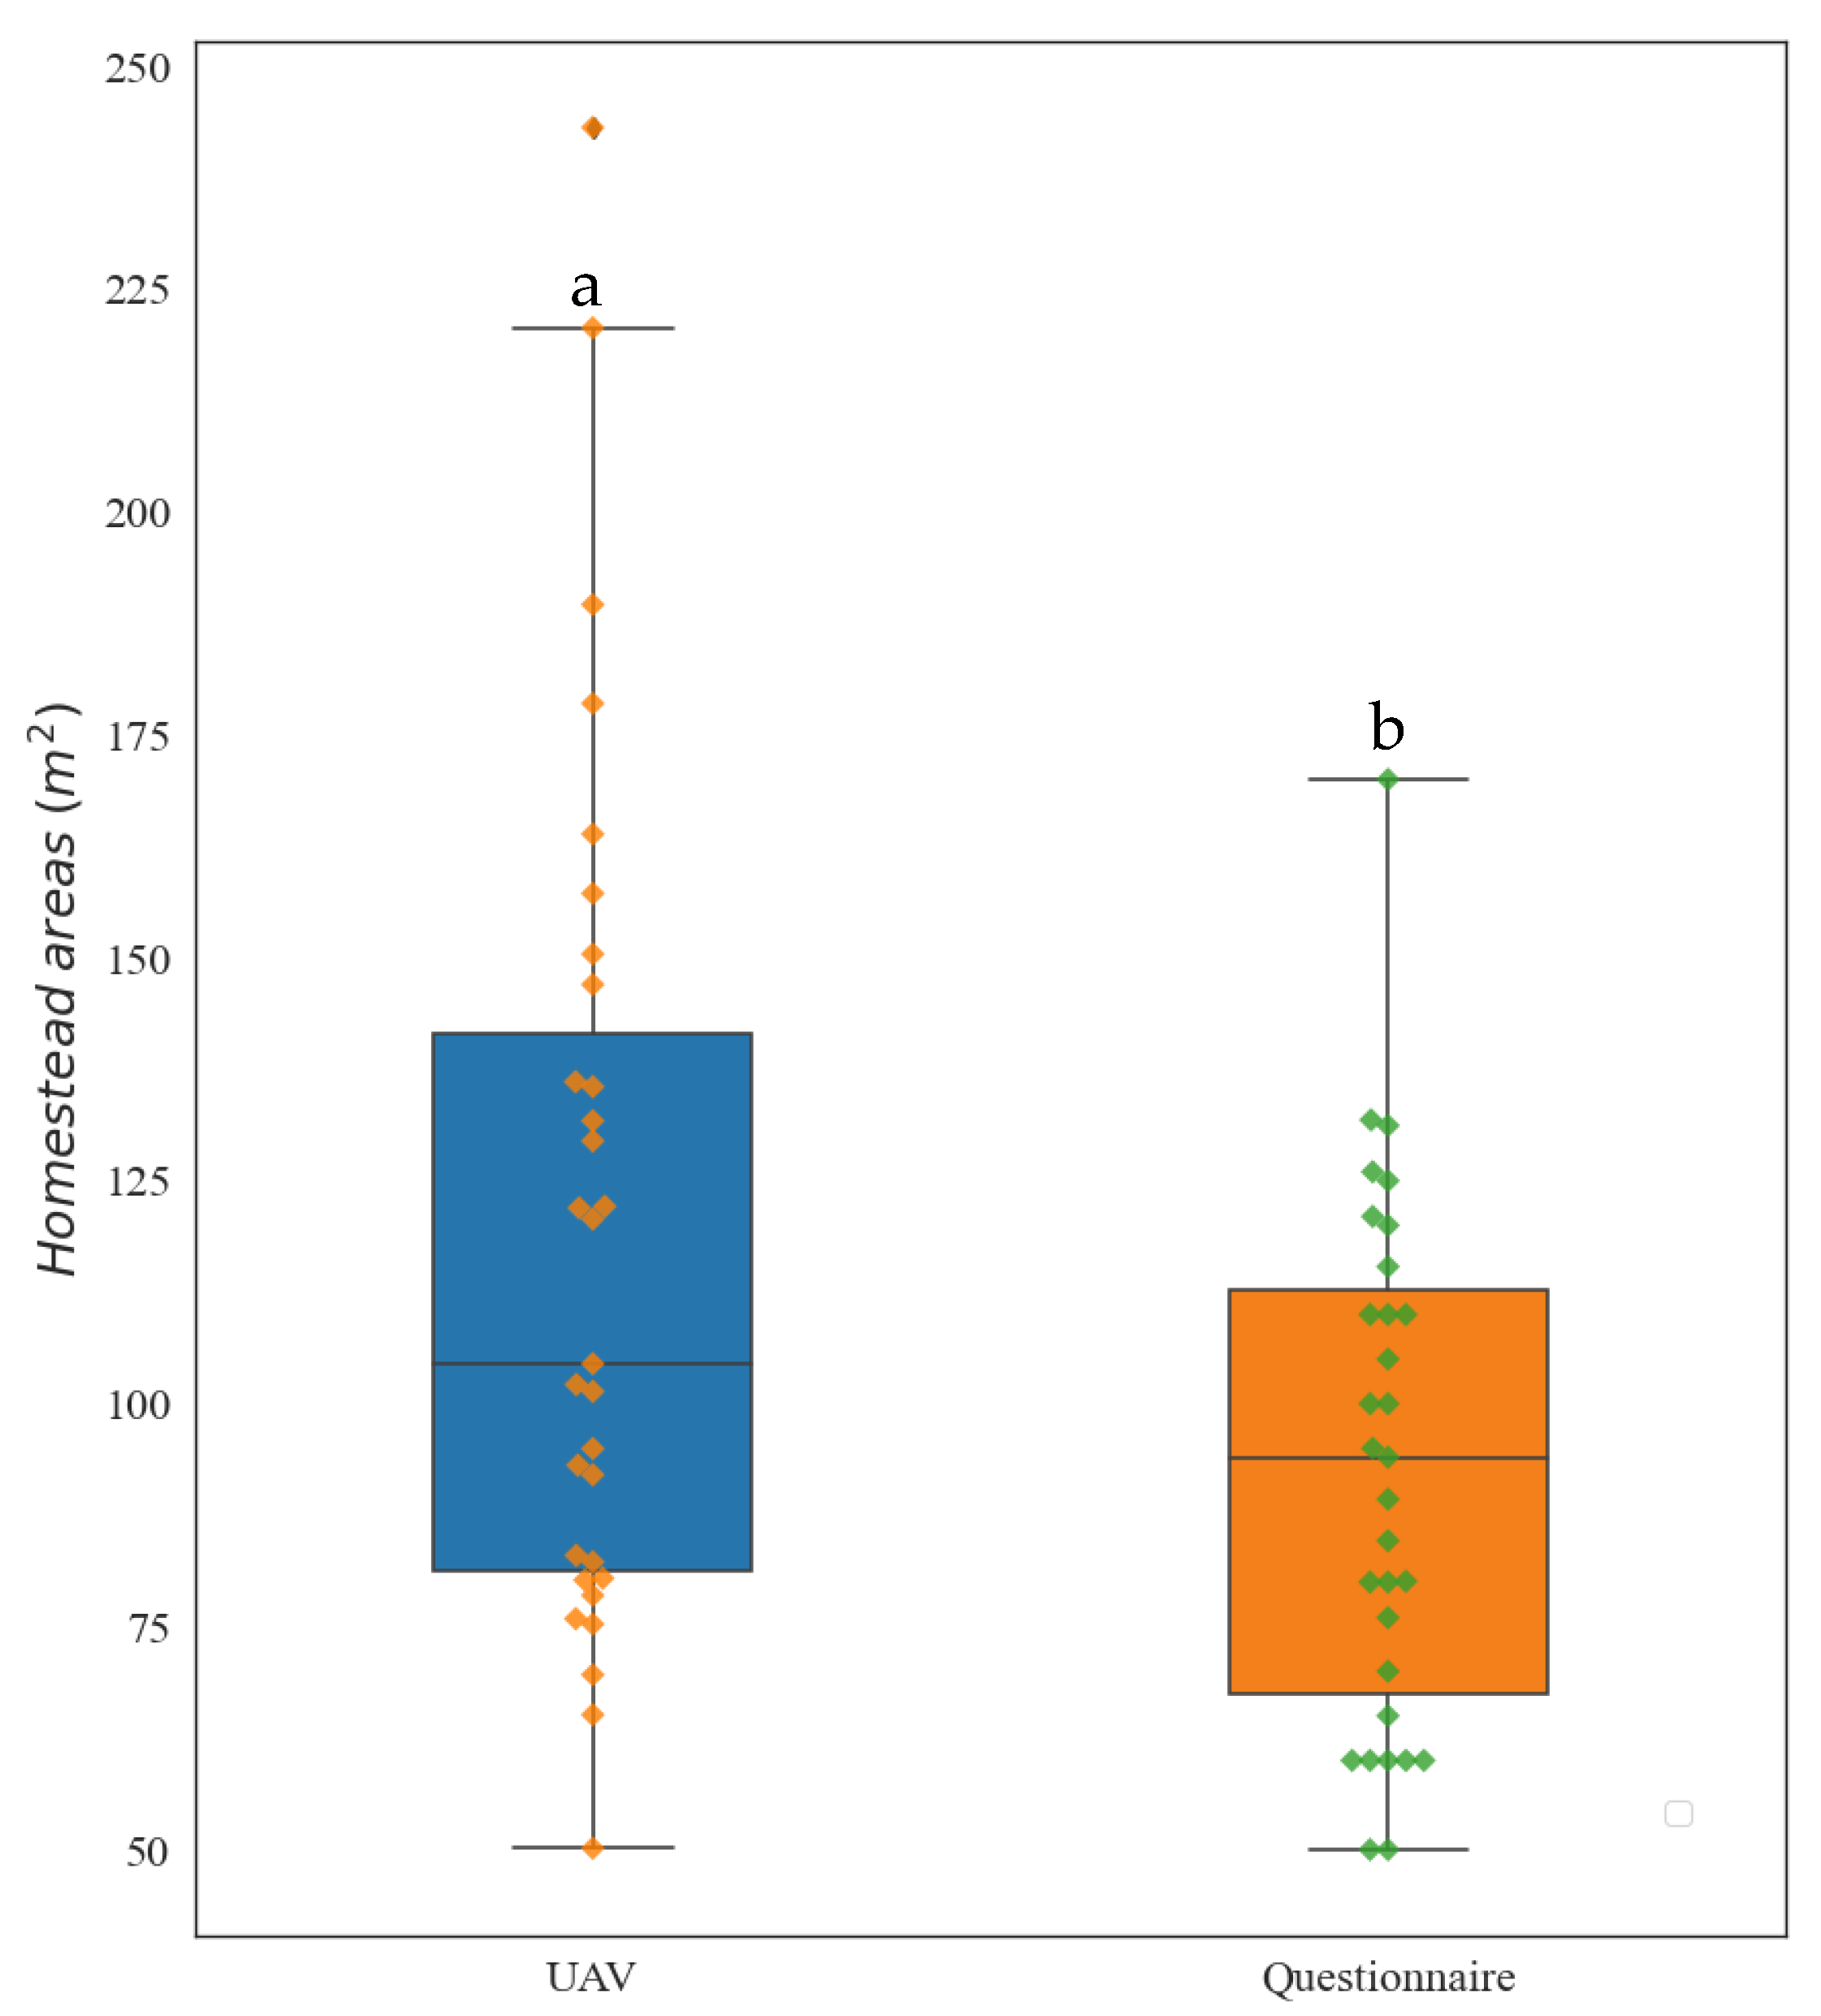
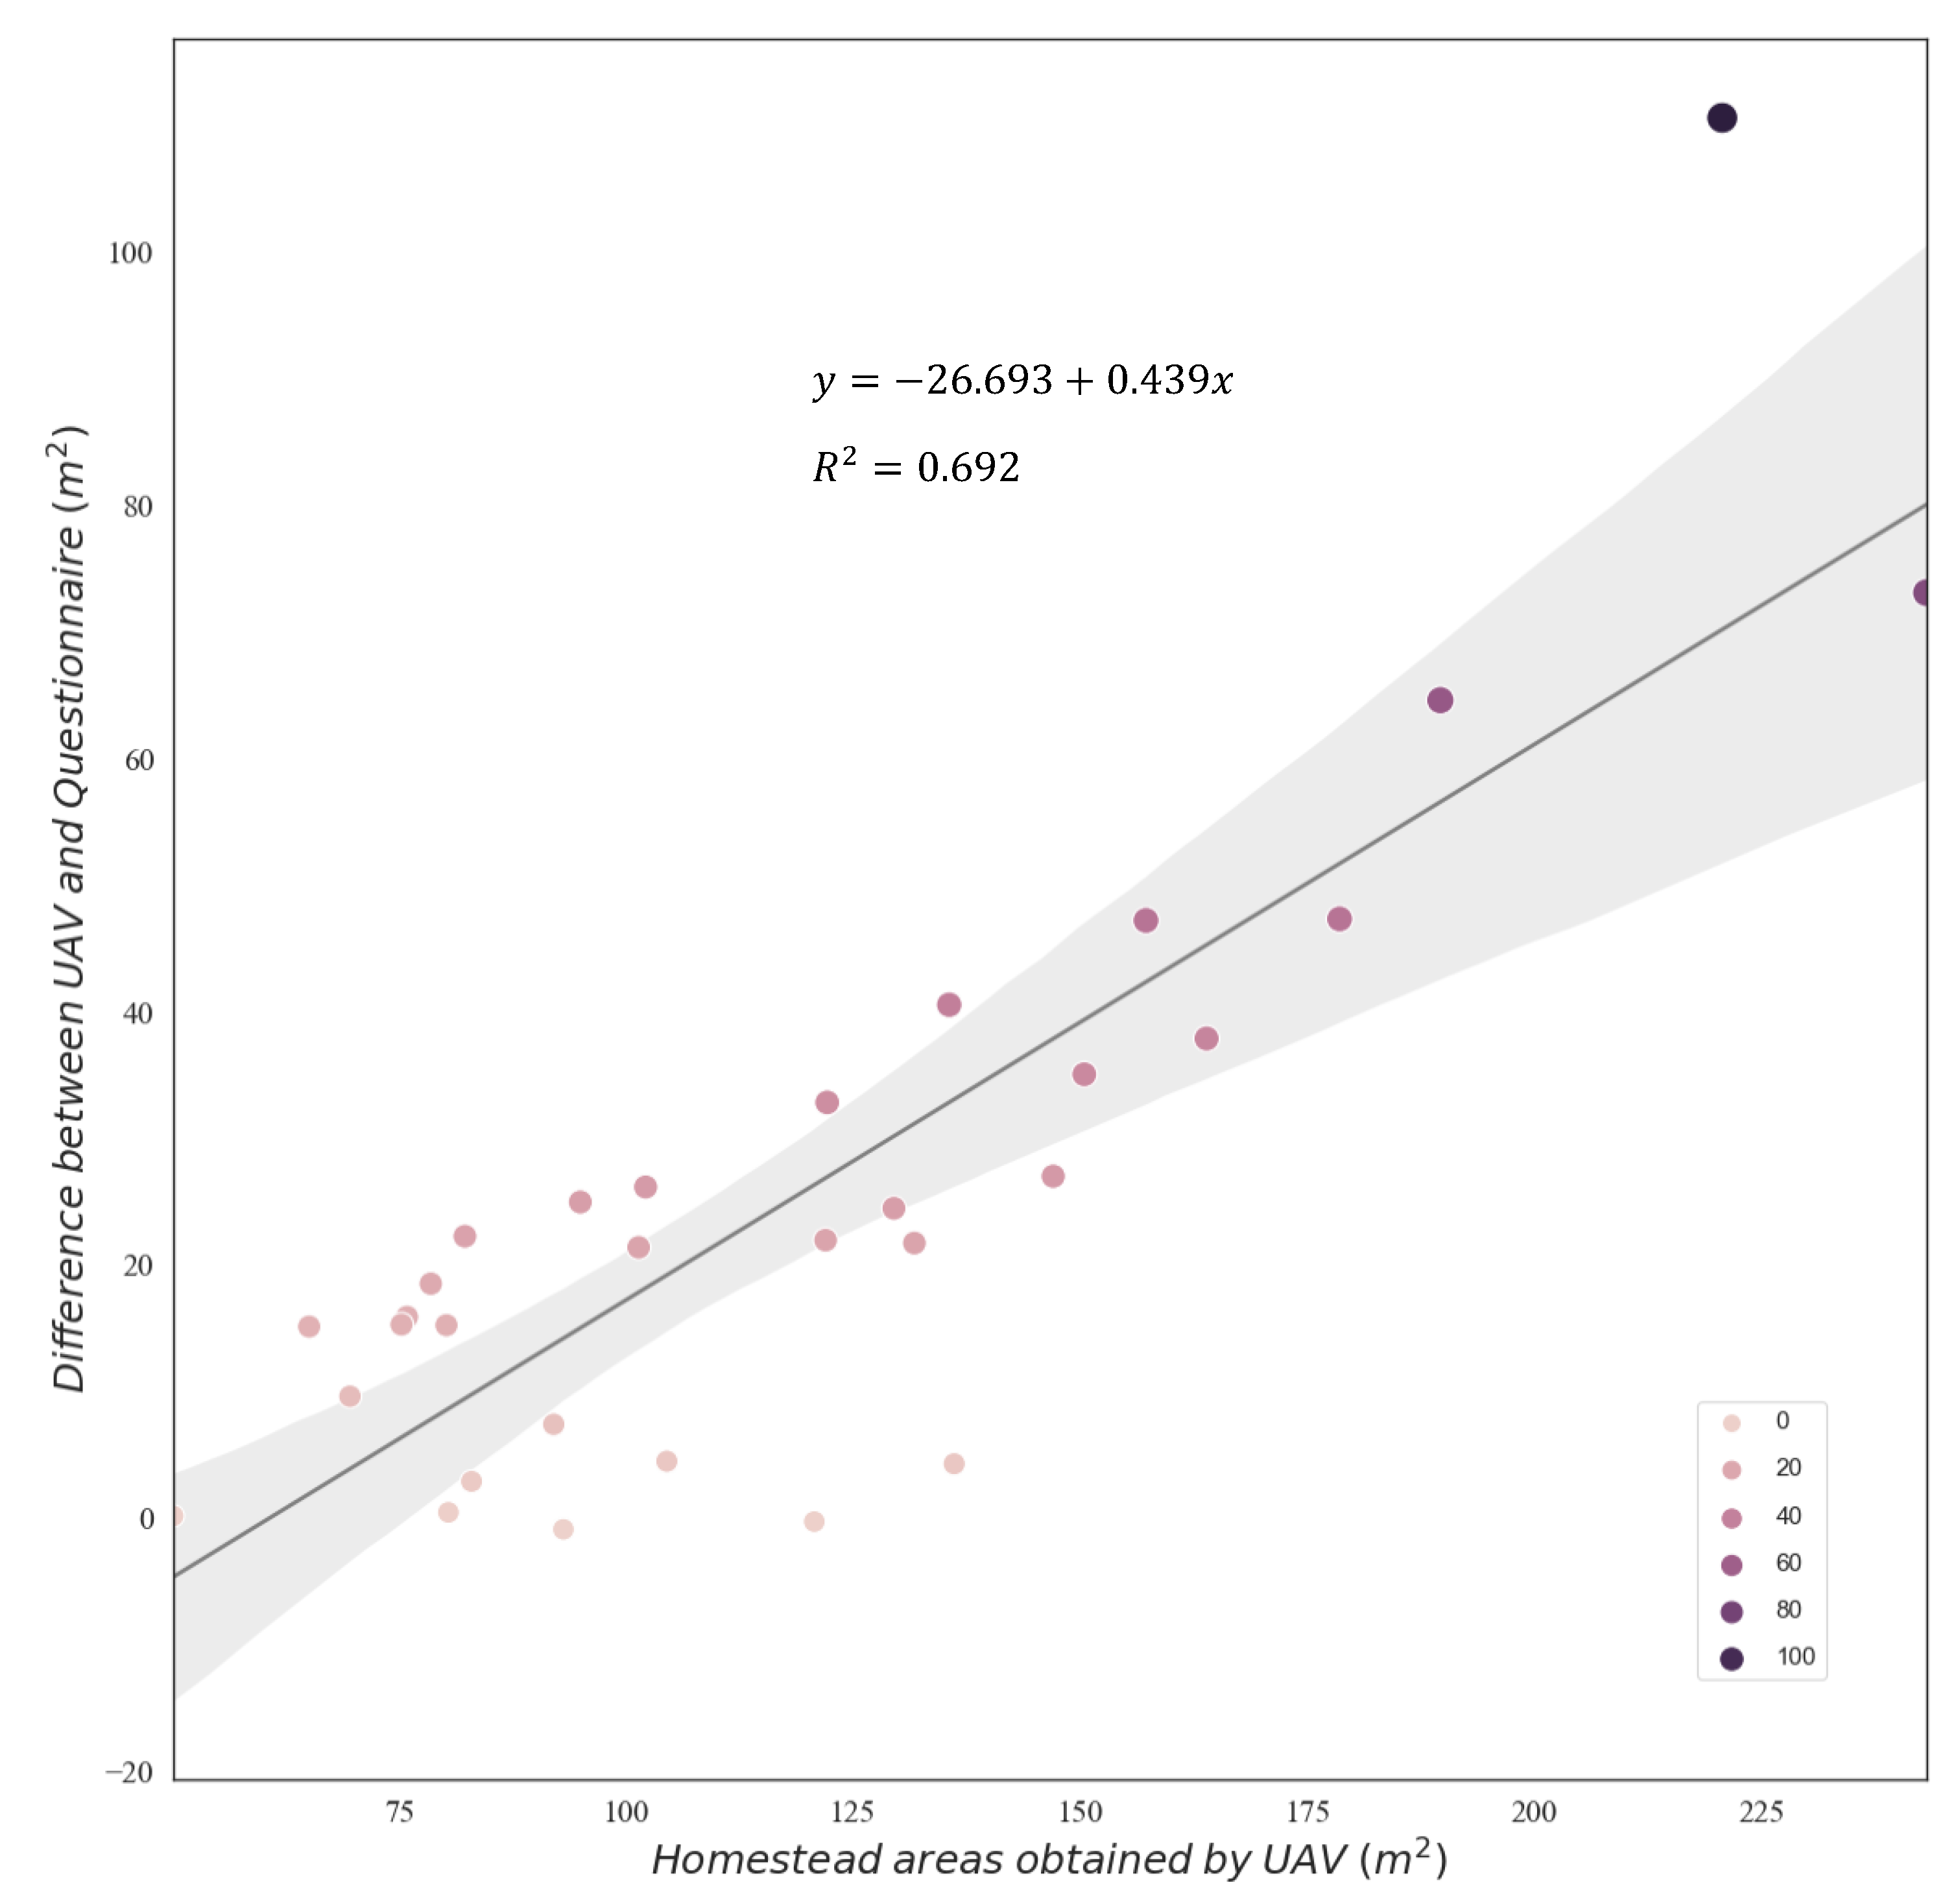
3.2. Areas of Homesteads Identified by Questionnaire and UAV

Twelve rural homesteads were surveyed using a questionnaire in Zone A, a typical pre-urban zone (Figure 3a). The areas of rural homesteads in Zone A range from 65.12 to 243.11 m2, with a mean of 138.57 ± 58.69 m2 (Figure 3a). Existing buildings in Zone A form the original neighborhood. Most buildings are 2–4 stories and self-built by farmers for rental purposes. Figure 3b shows all areas of the homesteads in Zone A as a visual interpretation based on UAV data. Nineteen rural homesteads were surveyed using a questionnaire in Zone B (Figure 3c). Their areas range from 50.16 to 163.88 m2, with a mean of 105.98 ± 32.11 m2 (Figure 3c). The buildings in Area B are distributed along the riverbank. There are 1–2 story buildings occupied by farmers for personal use. Whole homesteads in Zone B were interpreted based on orthographic and 3D UAV data (Figure 3d).

3.3. SBI in the Rural Homesteads Survey

As shown in Figure 4, the mean of homestead areas obtained by UAV was larger than that determined from the questionnaire (N = 31, p < 0.01). According to the questionnaire data, the area of homesteads ranged from 50.00 to 170.00 m2, with a mean value of 93.20 ± 29.13 m2. In contrast, the area of rural homesteads surveyed by UAV ranged from 50.16 to 243.11 m2, with a mean value of 118.60 ± 46.28 m2. The difference in mean areas of rural homesteads obtained using the UAV and questionnaire was up to 25.40 m2 (N = 31, p < 0.01), which could not be attributed to random error.
According to Formula 1, the overall SBI of the surveyed homesteads was 0.439, and the total areas of the homesteads were 3676.60 m2 ( V U A V ) and 2889.41 m2 ( V q u e s t i o n n a i r e ). This represented a slope between V G a p and V U A V , reflecting the ratio of the difference between areas obtained using the UAV and the questionnaire to actual areas of the homesteads. The areas of homesteads obtained in Zone A using the UAV and the questionnaire were 1652.12 and 1237.29 m2, respectively. The areas of homesteads obtained in Zone B using the UAV and the questionnaire were 2013.75 and 1662.85 m2, respectively. Formula 1 gave an SBI of 0.515 in Zone A and 0.258 in Zone B (Table 3). Thus, the SBI was greater in the pre-urban zone than in the pure rural zone.
As shown in Figure 5, a significant positive correlation was observed between the difference in the areas measured by the UAV and the questionnaire survey for the property size (N = 31, p < 0.001). As the areas of the homesteads increased, the difference in the results between the questionnaire and the UAV also increased. This result reveals that respondents with larger homesteads show greater data bias than others.

4. Discussion

Field surveys and questionnaires are a cornerstone of rural social and economic research, and they provide invaluable firsthand data regarding on-the-ground situations. However, cost-effective and efficient methods for validating the accuracy of self-reported data from such questionnaires are lacking. In this study, we propose the SBI, which evaluates the degree of survey bias in field surveys on rural homesteads by comparing data recorded from questionnaires and portable UAV. The calculated SBI revealed that the degree of survey bias of questionnaires from field surveys on rural homesteads reached 0.439, reflecting that the ratio of the difference between areas obtained using the UAV and questionnaire to actual areas of the homesteads reached 43.9%. Survey bias has three possible sources: (1) Different measurement methods lead to different measurement areas; (2) The measurement methods are the same, but accuracy errors exist; and/or (3) Inconsistent area due to house reconstruction and expansion [26].
The SBI obtained in the pre-urban zone (0.515) was higher than that in the pure rural zone (0.258). The homestead areas in the pre-urban zone showed more survey bias than those in the pure rural zone (Table 3). In addition to the three reasons mentioned above, the homesteads in the pre-urban zone have greater possibilities and a higher frequency of reconstruction and building extension for rental and other businesses [18]. Therefore, the homestead areas in the pre-urban zone showed a greater SBI than those in the pure rural regions—where there is a lack of such motivation to reconstruct—and the degree of survey bias was significantly lower. As shown in Figure 5, the larger homesteads showed greater data bias than others. One possible explanation is that the rebuilt houses may expand the area, resulting in a great survey bias in the investigation of a large area of the homestead. Another rural homestead survey also reported that the evolution and the upgrading of the structure and the function of homesteads are influenced by factors such as expanding production, improved living conditions, promotion of regional economic development, and mutual comparison between neighbors [15].
This method can be widely applied to many other survey indicators that can be obtained through remote sensing. UAV is a real-time, in situ survey tool that can interpret many land features, including crop area, crop yield, quantity of large agricultural machinery, types of cash crops, soil fertility, and forest resources, all of which are common targets of rural research. Furthermore, compared with RGB cameras, UAVs equipped with multispectral sensors can investigate the rural environment, such as the water quality of rural rivers. Therefore, SBI is an efficient method for quickly judging the data quality of rural surveys and research, which should be confirmed in further expanded research.
The SBI method based on UAV has some limitations. First, it can only be used to verify specific objects in rural surveys, rather than abstract objects, such as income, employment, and education. It cannot be used for objects invisible to UAVs, such as indoor assets. However, in this case, this part of the data can be used to verify the reliability of the questionnaire data. Second, the duration of a UAV survey is limited. Periodic UAV data acquisition should be used to construct a long-timescale continuous rural panel data set [27]. Third, the scope and the scale of UAV surveys are limited. When surveys are conducted in large villages, small drones may not be able to obtain data effectively.

5. Conclusions

This study proposed an SBI for evaluating the accuracy of self-reported rural surveys using questionnaires based on a comparison of data recorded from questionnaires and a portable UAV. The calculated SBI revealed that the degree of survey bias of questionnaires in field surveys on rural homesteads reached 0.439, reflecting that the ratio of the difference between areas obtained using the UAV and questionnaire to actual areas of the homesteads reached 43.9%. A greater SBI was obtained in the pre-urban zone (0.515) than in the pure rural zone (0.258). Our results suggest that homestead areas in the pre-urban zone have more incentive to expand than those in the pure rural zone. The SBI based on UAV remote sensing can be used as an efficient tool for validating the quality of data and the extent of survey bias. Our case study shows that UAV remote sensing can strongly support research in a rural survey, revealing key information hidden in field surveys and questionnaires.

Funding

National Key R&D Program of China (No. 2021xjkk0903, No.2018YFC1508805, and No. 2019YFA0607403), Central Public Interest Scientific Institution Basal Research Fund (No. Y2020PT05 and No. BSRF201901), and the Strategic Priority Research Program of Chinese Academy of Sciences (XDA20010302).

Institutional Review Board Statement

Not applicable.

Informed Consent Statement

Not applicable.

Data Availability Statement

The data presented in this study are available on requested from the author.

Conflicts of Interest

The author declares no conflict of interest.

Declaration of Self-Responsibility for Ethical Issues

The author declares that she will take responsibility for any ethical issues in this paper.

References

  1. Sargeant, J.M.; Martin, S.W. The dependence of kappa on attribute prevalence when assessing the repeatability of questionnaire data. Prev. Vet. Med. 1998, 34, 115–123. [Google Scholar] [CrossRef]
  2. Lee, J.L.; Simon, M.J.; Basito, C.S. Problems translating a questionnaire in cross-cultural setting. Prev. Vet. Med. 1999, 41, 187–194. [Google Scholar] [CrossRef]
  3. Stuart, G.S.; Grimes, D.A. Social desirability bias in family planning studies: A neglected problem. Contraception 2009, 80, 108–112. [Google Scholar] [CrossRef]
  4. Catania, J.A.; Turner, H.; Pierce, R.C.; Golden, E.; Stocking, C.; Binson, D.; Mast, K. Response Bias in Surveys of AIDS-Related Sexual Behavior. In Methodological Issues in AIDS Behavioral Research; Ostrow, D.G., Kessler, R.C., Eds.; Kluwer Academic Publishers: Dordrecht, The Netherlands, 2002; pp. 133–162. [Google Scholar] [CrossRef]
  5. Moore, J.C.; Stinson, L.L.; Welniak, E.J. Income Measurement Error in Surveys: A Review. J. Off. Stat. 2000, 16, 331–361. [Google Scholar]
  6. Epstein, W.M. Response bias in opinion polls and American social welfare. Soc. Sci. J. 2006, 43, 99–110. [Google Scholar] [CrossRef]
  7. Kar, A.; Brauer, M.; Bailis, R.; Zerriffi, H. The risk of survey bias in self-reports vs. actual consumption of clean cooking fuels. World Dev. Perspect. 2020, 18, 100199. [Google Scholar] [CrossRef]
  8. Tur-Sinai, A.; Fleishman, L.; Romanov, D. The accuracy of self-reported dwelling valuation. J. Hous. Econ. 2020, 48, 101660. [Google Scholar] [CrossRef]
  9. Tuomela, J.; Kaprio, J.; Sipilȁ, P.N.; Silventoinen, K.; Wang, X.; Ollikainnen, M. Accuracy of self-reported anthropometric measures-Finding from the Finnish twin study. Obes. Res. Clin. Pract. 2019, 13, 522–528. [Google Scholar] [CrossRef]
  10. Verbeij, T.; Pouwels, J.L.; Beyens, I.; Valkenburg, P.M. The accuracy and validity of self-reported social media use measures among adolescents. Comput. Hum. Behav. Rep. 2021, 3, 100090. [Google Scholar] [CrossRef]
  11. Nam, S.; Kim, H.; Jeong, D.; Song, Y.; Lee, J.; Jeong, J. Questionnaire accuracy measurement and verification using bio signal sensor based virtual reality head mounted display. IBRO Rep. 2019, 6, 554–5345. [Google Scholar] [CrossRef]
  12. Zhang, Y.; Wang, Y. Research on the interaction relation between migrant workers citizenization and rural homestead exit. Acad. J. Zhongzhou 2016, 7, 43–48. (In Chinese) [Google Scholar]
  13. Han, K. The three major contradictions of the rural homestead system. Peoples Trib. 2008, 14, 38–39. (In Chinese) [Google Scholar]
  14. Li, X.; Li, H.; Wang, X. Farmers’ willingness to convert traditional houses to solar houses in rural areas: A survey of 465 households in Chongqing, China. Energy Policy 2013, 63, 882–886. [Google Scholar] [CrossRef] [Green Version]
  15. Su, K.; Hu, B.; Shi, K.; Zhang, Z.; Yang, Q. The structural and functional evolution of rural homesteads in mountainous areas: A case study of Sujiaying Village in Yunnan province, China. Land Use Policy 2019, 88, 104100. [Google Scholar] [CrossRef]
  16. Cao, Q.; Sarker, M.N.I.; Sun, J. Model of the influencing factors of the withdrawal from rural homesteads in China: Application of ground theory method. Land Use Policy 2019, 85, 285–289. [Google Scholar] [CrossRef]
  17. Ward, P.M.; Peters, P.A. Self-help housing and informal homesteading in peri-urban America: Settlement identification using digital imagery and GIS. Habitat Int. 2007, 31, 201–218. [Google Scholar] [CrossRef]
  18. Biase, C.; Losco, S. Up-grading illegal building settlements: An urban-planning methodology. Procedia Environ. Sci. 2017, 37, 454–464. [Google Scholar] [CrossRef]
  19. Li, B.; Tong, D.; Wu, Y.; Li, G. Government-backed ‘laundering of the grey’ in upgrading urban village properties. Prog. Plan. 2019, 146, 100436. [Google Scholar] [CrossRef]
  20. Sun, L.; Perter, H. Formalizing informal homes, a bad idea: The credibility thesis applied to China’s “extra-legal” housing. Land Use Policy 2018, 79, 891–901. [Google Scholar] [CrossRef]
  21. Yang, C.; Li, H.; Xu, G.; Xiang, X.; Yang, D. A measure to the building density and floor area ratio of rural settlements based on Da Jiang unmanned aerial vehicle remote sensing. Mt. Res. 2019, 37, 144–150. [Google Scholar]
  22. Purnamasayangsukasih, R.P.; Norizah, K.; Ismail, A.A.M.; Shamsudin, I. A review of uses of satellite imagery in monitoring mangrove forests. IOP Conf. Ser. Earth Environ. Sci. 2016, 37, 012034. [Google Scholar] [CrossRef]
  23. Agisoft. Agisoft Photoscan User Manual; Agisoft LLC: St. Petersburg, Russia, 2014; Available online: http://www.agisoft.com/pdf/photoscan-pro_1_1_en.pdf (accessed on 1 January 2022).
  24. Torres-sánchez, J.; Castro, A.I.; Peňa, J.M.; Jiménez-Brenes, F.M.; Arquero, O.; Lovera, M.; López-Granados, F. Mapping the 3D structure of almond trees using UAV acquired photogrammetric point clouds and object-based image analysis. Biosyst. Eng. 2018, 176, 172–184. [Google Scholar] [CrossRef]
  25. González-Jaramillo, V.; Fries, A.; Bendix, J. AGB estimation in a tropical mountain forest (TMF) by means of RGB and multispectral images using an unmanned aerial vehicle (UAV). Remote Sens. 2019, 11, 1413. [Google Scholar] [CrossRef] [Green Version]
  26. Sun, L. Problems and countermeasures of rural housing construction. Shanxi Agric. Econ. 2014, 6, 32–33. [Google Scholar]
  27. Walelign, S.Z. Should all attrition households in rural panel datasets be tracked? Lessons from a panel survey in Nepal. J. Rural. Stud. 2016, 47, 242–253. [Google Scholar] [CrossRef]
Figure 1. Study area (a) Anhui Province in China, (b) Qishan Town in Anhui Province, and (c) Zone A and Zone B in Qishan Town.
Land 11 00873 g001
Figure 2. Three-dimensional model to enhance visual interpretation: (a) three-dimensional tiled model of Zone B and (b) 3D model helps to identify different functional areas of rural homestead from orthographic and different perspectives.
Land 11 00873 g002
Figure 3. Area of rural homesteads surveyed by questionnaire and unmanned aerial vehicle (UAV) in Zones A and B: (a) distribution of rural homesteads surveyed through a questionnaire in Zone A; (b) rural homesteads interpreted by UAV in Zone A; (c) distribution of rural homesteads surveyed through a questionnaire in Zone B; and (d) rural homesteads interpreted by UAV in Zone B. The orange dotted line is the scope of the survey. The yellow dotted line is the questionnaire survey path.
Land 11 00873 g003
Figure 4. Difference in rural homestead areas obtained using a questionnaire and a UAV. Different letters represent a significant difference between the control and the treatment groups (N = 31, p < 0.01).
Land 11 00873 g004
Figure 5. Positive correlation between the difference in the areas measured from the survey regarding the property size. Gray lines are regression lines with a 95% confidence interval.
Land 11 00873 g005
Table 1. Questionnaire on rural homestead.
NumberQuestionOptions or Unites
Q1Your gender1 = male; 0 = female
Q2Your ageYears
Q3How many years of school education have your received?Years in school
Q4Your employment1 = agriculture; 0 = non-agriculture
Q5What is the area of the homesteadArea of homestead, m2
Q6How many people currently live in the household?Number of individuals
Q7How many years has the residence been build?Years
Table 2. Summary statistics of variables used in analysis.
VariableMinimumMaximumAverageSD
Gender (1 = male; 0 = female)010.580.49
Age (years)328258.9313.01
Education level (years in school)0126.313.96
Employment (1 = agriculture; 0 = non-agriculture)010.310.46
Area of homestead (m2)5017093.2029.13
Number of individuals in the household1104.102.27
Years for residence been built (years)1642913.97
Table 3. Survey bias index (SBI) of rural homestead survey in the questionnaire and UAV. V U A V is the area of a rural homestead obtained by the UAV (m2), V q u e s t i o n n a i r e is the area of a rural homestead obtained by the self-reported questionnaire (m2), and n is the number of rural homesteads surveyed (12 and 19 in Zones A and B, respectively).
Survey Areas 0 n V U A V , i ( m 2 ) 0 n V q u e s t i o n n a i r e , i ( m 2 ) 0 n V G a p , i ( m 2 ) S B I
Zone A1652.121237.29425.560.515
Zone B2013.751662.85361.630.258
Study area3676.602889.41787.190.439
Publisher’s Note: MDPI stays neutral with regard to jurisdictional claims in published maps and institutional affiliations.

