Article

Evaluation of Medical Carrying Capacity for Megacities from a Traffic Analysis Zone View: A Case Study in Shenzhen, China

1
Key Laboratory for Urban Habitat Environmental Science and Technology, School of Urban Planning and Design, Peking University, Shenzhen 518055, China
2
Key Laboratory for Earth Surface Processes, Ministry of Education, College of Urban and Environmental Sciences, Peking University, Beijing 100871, China
3
School of Public Administration, Inner Mongolia University, Hohhot 010070, China
*
Author to whom correspondence should be addressed.
Land 2022, 11(6), 888; https://doi.org/10.3390/land11060888
Submission received: 17 May 2022 / Revised: 6 June 2022 / Accepted: 9 June 2022 / Published: 11 June 2022
(This article belongs to the Special Issue Right to the City as a Response to Pandemics and Climate Challenges)

Abstract

:
Sustainable Development Goals propose to build inclusive, safe, resilient, and sustainable cities and human settlements, which requires us to scientifically evaluate the carrying capacity of current urban public service facilities, but there is still a lack of in-depth exploration of urban public medical service facilities. Therefore, this paper, within the mobile phone signaling data, improved the potential model and carrying capacity evaluation model of public medical facilities, explored the spatial pattern distribution of public medical resources in Shenzhen, and analyzed the current situation of carrying capacity of public medical resources. The study showed that: (1) the overall spatial distribution of public medical resources in Shenzhen is uneven, showing a pattern of multicenter aggregation and multilevel development; (2) the service potential of public medical facilities has obvious spatial variations, with Futian District, Dapeng New District, and Nanshan District showing more obvious high-gravitational-value aggregation centers; (3) medical facilities in Shenzhen are never empty, but the problems of medical underloading and overloading are severe, and spatial allocation and utilization efficiency need to be further optimized. The research results can provide a scientific basis for the research on the allocation and sustainable construction of medical resources in megacities.

1. Introduction

Medical public resources are one of the important resources for the survival and development of cities, which is a necessary prerequisite for urban residents to enjoy good health protection [1]. After the Corona Virus Disease 2019 (COVID-19) outbreak, many countries experienced a run on medical care [2,3], with local medical supplies unable to meet the need for treatment. This particularly inspires us to focus on a reasonable assessment of the service potential and carrying capacity of healthcare resources. In the context of the normalization of COVID-19 prevention and control [4,5], judging the service potential of medical resources and measuring whether medical resources are overloaded is conducive to improving medical resource allocation efficiency [6] and utilization, so as to respond to the daily medical needs of urban residents as well as the medical needs of special disease pandemics.
The issue of healthcare resources has long received extensive attention from scholars, with domestic and international studies focusing on accessibility [7,8,9], allocation efficiency [10,11,12,13], and spatial equity [14,15,16,17]; the evaluation of the carrying capacity of healthcare resources that integrates the supply and demand of health care resources has not been explored in depth. Early studies were mostly based on surveys or statistical data [18]. The carrying capacity of medical resources was often used as an indicator to evaluate their allocation [19,20], which provides a certain basis for the study of the carrying capacity of health care. Its calculation is relatively simple, often using the size of the population that can be served by medical facilities as a single evaluation criterion [21,22], and mostly portraying the population in statistical terms, which is not fine-grained data and has limited guidance for urban planning.
The carving out of population is essential for studying the carrying capacity of healthcare services, with a smaller study unit better reflecting spatial differences in the likelihood of residents accessing care. Most of the studies that have been conducted use districts or streets where statistical census data are available as the unit of study [23,24,25], while a few studies refine the unit of analysis to the community [26,27,28]. Therefore, it is necessary to further refine the study scale to accurately measure the carrying state of medical services, so that the refinement of the population scale can provide a reference for solving the current problems of medical resource allocation and planning in megacities. In some areas, there is a mismatch between the high population size and the number of medical services provided [23,28], the aging population is serious, but the distribution of medical facilities is not differentiated [29,30], and the standard of the 15 min community living circle is not reached [31]. Therefore, it is necessary to comprehensively assess the current state of urban medical service carrying on a fine scale and use it as a basis to reasonably plan the future distribution of medical resources. The advent of the Big Data era has provided new opportunities for medical resource allocation research [8,32,33]. Researchers have since conducted several studies on medical services as a resource. Data such as urban point of interest (POI) and mobile phone signaling have significant advantages in providing precise geographic location information of medical institutions [34] and portraying the travel characteristics of residents [35]. The spatio-temporal characteristics of residents’ daily activities are expressed in the form of large and complex smart device data, which provides more comprehensive support for exploring the current supply and demand of medical resources. Traffic analysis zone (TAZ) is a management unit formed by the government to study the traffic and travel characteristics of citizens, taking into account the consistency of administrative division, land use, and socio-economic characteristics, based on the natural division of roads, rivers, railroads, and other structures [36,37]. Within the TAZ space there are similar traffic characteristics and strong traffic associations [38,39], which can better express the travel characteristics of residents in their daily activities. The TAZ division method is based on street boundaries, considering traffic travel, floating cars, and other multisource data using a Geographic Information System (GIS) platform to analyze traffic influencing factors such as road network flow, and considering the similarity of the origin–destination (OD) behavior of travel activities. Clustering algorithms [40,41] are usually used to divide finer units.
As the first special economic zone (SEZ) in China, the growth history of Shenzhen is a microcosm of China’s urban development, and the local adoption of a multilevel referral system that represents the common practice in China [42]. Since the reform and open-up, the urbanization process of Shenzhen has been advancing rapidly. According to the data of the seventh national census, the resident population of Shenzhen reached 17.56 million in 2020 [43]. At the same time, the problems caused by the population boom are gradually emerging [44], raising concerns about Shenzhen’s public infrastructure [23,45,46]. Research on optimizing the allocation of healthcare resources in Shenzhen has been increasing in recent years, mainly applying the two-step floating catchment area method (2SFCA) [42,44,47] and the potential model [24] to explore the accessibility and equity of different levels of healthcare facilities in Shenzhen. However, most studies are limited to high-level hospitals and do not take community health service centers (CHSCs) into account [48]. The available studies show that medical institutions in megacities are not able to provide services to meet the needs of residents in the whole region due to different spatial allocation and degree of investment, and there are still limitations, especially in precisely serving local residents [49]. For example, Zhao [28] indicated that there is unequitable spatial accessibility in the Beijing health care service system; evidence from the Changning District in Shanghai showed that the accessibility of health care resources is not strong in some areas [26], and the rationalization of health care resource layout needs to be enhanced. Catherine [50] suggested that in the UK there are COVID -19 inequities in the accessibility of vaccination sites at the community level. Similar results have been found in studies of health care resource services in Shenzhen [44,47].
Thus, based on urban POI and mobile phone signaling big data, taking Shenzhen as an example, this paper proposes a framework for assessing the carrying capacity of public medical resources under a refined spatial scale, considering population size and travel characteristics, and studies the carrying state of medical institutions in Shenzhen on a fine scale with the help of mobile signaling TAZ population data and an improved potential model. The questions of interest are: (1) What is the current spatial configuration of public medical facilities in urban space? (2) What is the attractiveness of public medical facilities to the surrounding settlements? (3) What is the carrying capacity of public medical resources services? It is expected to provide the supply and demand of medical resources in megacities under the normalized prevention and control of the COVID-19 epidemic in China and provide a theoretical basis for the current situation evaluation and future planning of public medical resources in similar cities.

2. Materials and Methods

2.1. Study Area

The area of this study is Shenzhen (22°27′–22°52′ N, 113°46′–114°37′ E), which is situated in South China. Shenzhen is a sub-provincial city in Guangdong Province. The city has 10 districts, with a total area of 1997.47 km2 and a total resident population of 17.56 million as of 2020. Shenzhen adopts a hierarchical diagnosis and treatment system to build a two-tier system of community-level and high-level hospitals [42]. The details are shown in Figure 1 [51].
As of 2018, the city counted 671 public health care facilities at all levels and 944 TAZs (2019 data), as shown in Figure 2. Among them, there are 6 primary hospitals, 13 secondary hospitals, 42 tertiary hospitals, a total of 604 CHSCs and 6 unclassified nonprofit medical institutions.
This paper explores the carrying capacity of health care services mainly for public hospitals, primary hospitals, and CHSCs, which are all public nonprofit health care institutions. Although the socially managed hospitals are also an important part of Shenzhen’s medical service system, there is still a significant gap in the number, efficiency of utilization, and proportion of its medical and health resources compared with public hospitals [52]. In 2020, the number of socially managed medical institutions in Shenzhen was about 3500, accounting for 76.46% of the total number of medical institutions in the city, while the number of beds available in socially managed hospitals accounted for no more than 20%, and the number of consultations accounted for only 6.86% of the total number of consultations in the city, with socially managed institutions accounting for more than half of the overall number of institutions carrying less than 10% of the service volume [53]. In general, there is a phenomenon of redundant inputs and insufficient outputs in socially managed hospitals [54]. In addition, socially managed hospitals are for-profit institutions, most of which are not included in the health insurance system, and the cost of treatment is expensive [55], so they are not the first choice of the residents who visit them. As for the high-income group, the demand for hospital service level is high [56], but the public still has stereotypical impressions of socially managed hospitals, such as poor medical quality and excessive publicity [57]. A survey has shown that urban residents in the Pearl River Delta region, including Shenzhen, visit socially managed hospitals less frequently [58], and therefore are not included in the scope of this study. As for the emergency center, the municipal emergency center in Figure 1 is responsible for the overall planning and construction standards of prehospital emergency care, and the citywide emergency medical command and dispatch, etc. [59]. The emergency stations equipped in other high-grade public hospitals receive dispatch from the city emergency center and wre covered in the study.

2.2. Data Sources

The research data included the basic characteristics of medical institutions in Shenzhen, POI data from medical institutions, mobile phone signaling data from Shenzhen, road network data, and administrative division data. All were obtained using the Geographic Coordinate System (GCS) Beijing 1954 coordinate system. The data sources and acquisition methods are shown in Table 1.

2.3. Methods

The framework of medical resources carrying capacity assessment in this paper can be divided into three parts. Firstly, kernel density analysis and a spatial autoregressive model are used to study the overall allocation and distribution of medical resources in Shenzhen. Secondly, mobile phone signaling data is combined with the potential model in order to analyze the attractiveness of each medical institution to residents. Finally, the gravitational force analysis results are substituted into the public medical resource carrying capacity evaluation model to determine the carrying status of each medical facility in order to explore the rationality of medical allocation in each region. The research framework is shown in Figure 3.

2.3.1. Kernel Density Estimation

Kernel density estimation [60], proposed by Rosenblatt (1955) and Emanuel Parzen (1962), is a nonparametric method for estimating spatial density. The kernel density estimation method can be used to visually express the spatial distribution characteristics of public medical resources in Shenzhen. The basic formula is as follows:
f ( x ) = 1 n h i = 1 n K ( x x i h )
where f(x) denotes the kernel density estimate, n is the number of hospital samples, h is the search radius, K is the kernel function, and xxi denotes the estimated distance between two hospital points.

2.3.2. Spatial Autocorrelation Model

The Getis–Ord Gi* index [61,62] is a widely used local spatial autocorrelation statistic that can identify spatial clustering with statistically significant high and low values. It is commonly used to analyze the cold and hotspots of a statistic. In this study, this index was used to evaluate the clustering and dispersion states of medical institutions, identify types of spatial clustering patterns of public medical institutions in Shenzhen, and explore their local autocorrelation properties.

2.3.3. Improved Potential Model

The potential model, also called the gravitational model, draws on the law of gravity to illustrate the interaction of regional societies and economies [63]. The potential model is mostly used to study the accessibility of settlements to various infrastructures. As for the original potential model, its basic expression is as follows.
A i = j = 1 n A i j = j = 1 n M j D i j β
where Aij denotes the potential of facility point j with respect to settlement i, and n denotes the number of medical facility points. Ai indicates the cumulative sum of the attractiveness of all medical facilities in the system to the residents, i.e., the accessibility of the resident i to all medical facilities, with larger values indicating better spatial accessibility of the residents. Mj denotes the service capacity of facility point j, which is often expressed by the number of beds in medical institutions or the total number of health technicians. Because the community health stations have no formal beds, this study selected the total number of health technicians as an indicator. D i j β denotes the travel distance to reach facility point j for residential point i at a friction factor β. The study refers to the existing literature and takes β as 2 [6,63], and then uses ArcGIS platform to construct OD cost matrix using road network to calculate D i j β with the method of Network Analysis [64].
Since residents have a merit-based mechanism for accessing healthcare and have a preference for high-grade healthcare facilities that can provide quality services, it is necessary to take the grade scale of healthcare services into account. Moreover, as residents have a travel threshold for medical treatment, except for special cases, medical treatment points that exceed a certain distance and time are not selected. For this reason, this paper adds the threshold variable of limited travel distance in the model to limit the limit distance of medical treatment for residents. Finally, because of the competition between the population around the same medical facility for the resources of the facility, the size of the medical population needs to be considered as well. In previous studies, there was still uncertainty in obtaining the location and size of settlements. One of the reasons for this is the restrictive nature of data acquisition; therefore, most of the current studies are conducted with administrative centers instead of population centers of gravity [63,65], with the study units being mostly census units. In this paper, we refine the study unit to the TAZ and develop the study by using the mass center of the zone as the population center of gravity to express the intra resident variability in access to health care.
For this purpose, the specific equation of the improved potential model used in this paper is as follows:
A i j = S i j M j D i j β V j , V j = i = 1 m S i j P i D i j β , S i j = { k j W i j       D i j D j 0               D i j D j , W i j = 1 ( D i j D j ) β
where Vj is the population size factor, and Pi denotes the population of TAZ i. The factor m denotes the number of residential points, that is, the number of TAZs, and Sij represents the influence coefficient of facility point j on the scale of settlement i. Kj denotes the medical facility grade coefficient of facility j, and the coefficients of CHSCs, unclassified hospitals, and primary, secondary, and tertiary hospitals were set to 1–5, respectively. Wij denotes the grade scale decay coefficient and D j denotes the limiting travel distance to facility j. Referring to existing studies in cities of the same level as Shenzhen [66,67], the proposed maximum time for residents to travel to receive medical services was set to 30 min. Data published by the Shenzhen Municipal Bureau of Transportation indicated that the average speed of travel in Shenzhen city in 2018 was about 30 km/h, and therefore, 15 km was chosen as the travel threshold for residents.

2.3.4. Carrying-Capacity Evaluation Model

This study analyses the carrying capacity of each medical facility based on the improved potential model. Define Pij as the probability that TAZ i selects facility point j under the following basic formula:
P i j = A i j j = 1 n A i j
The number of residents who select and travel to the health care facility is used as the actual size of the carrying population, which is basically calculated as the product of the probability of selecting facility point j in TAZ i and the population size of TAZ i. The theoretical population carrying capacity of medical facilities at all levels as specified in the Urban Planning Standards and Guidelines of Shenzhen [68] was taken as the theoretical population served, according to which the theoretical population carrying capacity of CHSCs, unclassified hospitals, and primary hospitals was set to 50,000; the theoretical population carrying capacities of secondary and tertiary hospitals were set to 120,000 and 200,000, respectively. With reference to existing studies [69], this study constructed an evaluation model of the service provision capacity of medical facilities using the ratio between the actual and theoretical population carrying capacities. The Medical Carrying-Capacity Index is denoted as MCCIj, and the theoretical size of the population served (Medical Carrying Population) is denoted as MCPj, with the following equation:
M C C I j = P i j × P i M C P j
When MCCIj = 0, it means that the medical facility is in an unloaded state; MCCIj in the range (0,1) means that the medical facility is lightly loaded. The closer MCCIj is to 0, the greater the wastage of medical resources. When MCCIj = 1, this means that the carrying capacity of the medical facility is in a relatively balanced state, and MCCIj > 1 means that the medical facility is overloaded. According to the wholeness of healthcare services and the specificity of healthcare service recipients, and with reference to expert experience [70,71], the healthcare service carrying state can be divided into the following stages (Table 2).

3. Results

3.1. Spatial Differentiation Characteristics of Public Medical Facilities

3.1.1. Density Distribution Characteristics of Public Medical Facilities

In general, according to the results of kernel density estimation (Figure 4), public medical facilities in Shenzhen show the spatial distribution characteristics of “block aggregation, multi-center, hierarchical development, and uneven spatial configuration”. There are four high-density centers, which are distributed in five districts (Bao’an, Pingshan, Futian, Luohu, and Nanshan Districts). These districts show relatively obvious clusters of medical facilities, which provide relative scale advantages, and decreasing concentrations of facilities from multiple centers to surrounding areas. Especially in the eastern part of the Futian District and the western part of the Luohu District, medical facilities show the characteristics of contiguous clustering and distribution. In other districts, the scale of medical facilities is relatively small and scattered. In addition, the overall density of medical facilities is high in the west and low in the east, which is consistent with other research results [48].
Futian District, which is the seat of the Shenzhen government, is the political, economic, and cultural center of Shenzhen development. With its prosperous businesses, high population density, and excellent support facilities, the high-density kernel of medical facilities covers almost the whole district and provides obvious advantages for medical treatment. Luohu District, which has the second-highest population density and many mature businesses, is one of the earlier-developed districts in Shenzhen. The medical facilities in its western part are distributed in a row with those in the Futian District and decrease in density from the center to the outside. The density of medical facilities in the whole district is high in the west and low in the east. Nanshan District is a new science and technology district with a per capita GDP of CNY 395,000 in 2019 [72] and a concentration of talent, where medical facility density is relatively high. Bao’an District has the largest area, but regional development is uneven, and medical facilities are concentrated only in a small area in the north. Pingshan District has a narrow shape, with several CHSCs in the district. The distribution of medical facilities in other districts is relatively scattered.

3.1.2. Cold and Hotspot Distribution Characteristics of Public Healthcare Facilities

According to the Getis–Ord Gi* index (Figure 5), there are obvious high-value clusters and no low-value cold spots for public healthcare facilities in Shenzhen. Specifically, the clustering and dispersion of public medical facilities is expressed using six cold and hotspot categories at the 99%, 95%, and 90% confidence levels. Darker colors indicate stronger high- or low-value clustering of the medical facilities in the region. The hotspots of public medical facilities in Shenzhen are scattered in the northern and southern parts of the Bao’an District, central Nanshan District, Futian District, western Luohu District, northeastern Pingshan District, and part of the Longgang District. These areas are high-value clusters of medical facilities in Shenzhen and are also important nodes in the spatial structure of medical services. All these observations passed the significance test at the 0.01 level. Medical facility hotspots are sporadically distributed in these areas. Other areas passed the confidence tests but had no hotspots. The overall size of hotspots is relatively small, occupying less than one-tenth of the overall city area. There are no cold-spot distribution areas with strong significance.
Overall, the results for cold and hotspot distribution calculated by Gi* are consistent with the results for kernel density. The hotspots are clustered in economically developed and densely populated areas such as the Futian, Luohu, and Nanshan Districts. These areas have a contiguous distribution of medical facilities and relatively well-developed support facilities and have therefore become the centers of medical facility hotspots. There are no significant and strong cold spots for medical facilities in Shenzhen, which is due to the large number and high density of CHSCs. These centers cover almost the whole city, resulting in little variation in the overall density of public medical facilities around the city and no low-value medical facility clusters.

3.2. Service Potential Characteristics of Public Medical Facilities

The geometric center of mass of the vector surface of each traffic cell was used as the population center of gravity in this study. The OD cost matrix was created based on the ArcGIS Network module. The parameters were substituted into the improved potential model, and the model calculated the gravitational values and divided them into ten classes according to their numerical size using the natural breakpoint method. The results obtained are shown in Figure 6. Combined with an analysis chart of the gravitational value of each medical facility point, this shows that the service potential of public medical facilities has obvious regional variations. Specifically, Futian District, Dapeng New District, and Nanshan District show high-gravitational-value aggregation centers. Less-pronounced aggregation centers are found in the Yantian, Luohu, Pingshan, and Longgang Districts, and the Guangming, Bao’an, and Longhua Districts have lower-gravitational-value aggregation centers.
The results of nuclear density analysis (Figure 4) and spatial autocorrelation analysis (Figure 5) reveal that the Futian, Luohu, and Nanshan Districts have obvious advantages in the scale and number of medical facilities. Their attractiveness to the surrounding TAZ residential points is also relatively high, and their service potential is high, giving the residents of these three districts obvious advantages in access to medical care. Specifically, Futian District, with its dense distribution of medical facility points containing 10 hospitals of tertiary scale, occupies close to one-quarter of the city. The service potential of medical facilities in this district is high, and their gravitational value is relatively higher. In contrast, the distribution of medical facilities in the Guangming and Longhua Districts is relatively limited, with only four tertiary hospitals in total. Their service potential is relatively low as a result, with weak attractiveness and poor radiation capacity to the surrounding TAZs.
Note that the medical facilities in the Bao’an District also constitute an evident cluster and that the number of medical facilities is relatively large, with nine hospitals of grade 2 or above. However, the service potential of its medical facility cluster is relatively weak. On the other hand, the Dapeng New District has a small number of medical facilities, with only two medical institutions above level 2 and no medical institutions above level 3, but its medical service potential is large, which gives it a strong attraction for residents seeking medical treatment. This is related to the amount of population that needs to be radiated in both areas. The Dapeng New Area is sparsely populated, making medical care less stressful.

3.3. Evaluation of the Service Carrying Capacity of Public Medical Facilities

As calculated in this study (Figure 7), the overall medical facility carrying-capacity distribution in Shenzhen is within the range of [0.004, 4.496]. Except for the Dapeng New District, there is medical service overloading in all districts of Shenzhen, and no overall medical facilities are empty. The medical facility carrying-capacity distribution has significant spatial variability. On the whole, different levels of medical facilities have different performance.
Among them, a total of eight medical facilities are seriously overloaded, distributed in the Bao’an, Longhua, Longgang, and Guangming Districts. These healthcare facilities have a carrying-capacity index greater than 3, which requires additional high-grade medical sites around to meet the needs of residents. The highest value of the carrying-capacity index, 4.96, was found in the third hospital of the Bao’an District People’s Hospital. The population it serves in practice is close to five times its theoretical population carrying capacity. The services they must provide far exceed those needed by their theoretical population served, and therefore the medical facility is under high pressure from overloading. A total of 20 medical facilities had moderately overloaded services with a fragile medical system, while 8 medical facilities were mildly overloaded. Overloaded medical facilities are more densely distributed in the central and western part of Shenzhen, mostly in areas with dense traffic neighborhoods and large population sizes. Medical services in these areas are in short supply and cannot meet the daily needs of residents. A total of 8 relatively balanced medical facilities, distributed in Nanshan, Luohu, Longgang, the southern part of the Futian District, and the northern part of the Longhua District, are areas of medical facilities in good carrying condition, medical resources resilient, and with the ability to respond to health emergencies. Fifteen medical facilities are in a moderately lightly loaded condition, with the actual number of people choosing to visit the facility below the ideal carrying level. Most medical facilities in Shenzhen have a carrying-capacity index of less than 0.5 and are in a lightly loaded state. Especially in the Dapeng New District, except for Kwai Chung People’s Hospital, the service carrying-capacity index of all medical facilities is less than 0.25, which is close to no load. This phenomenon is especially obvious in the CHSCs.
When the potentials of medical service facilities in each district (Figure 6) were combined for analysis, the Futian, Luohu, and Nanshan Districts were found to be very attractive to the surrounding residential communities, leading to high medical resource utilization in some areas. The medical overloading problem is prevalent, and the demand exceeds the supply. On the other hand, the service potential of medical resources in the Dapeng New Area and in the Pingshan, Longgang, and Yantian Districts is relatively high, but the carrying-capacity indices in these areas are for the most part low, indicating a certain degree of resource waste and the ability of these medical resources to support a larger population. A few medical facilities are overloaded in these districts, which means that allocation of medical facilities is uneven and that allocation efficiency needs to be improved. Most of Longhua and Guangming District have low medical facility service potential with relatively low medical facility competitiveness. Almost all medical facilities here are lightly loaded in terms of resource carrying capacity and basically meet the needs of residents.
There are obvious differences in the service-carrying status levels of medical facilities (Figure 8). Among the 529 medical facilities with a carrying capacity of less than 0.25, fewer than 1% are medical facilities above the first level. The phenomenon of light loading of medical facilities is mostly observed in low-grade medical facilities such as CHSCs. For example, the average carrying-capacity index of community health, first-class community health, and second-class community health sites does not exceed 0.2. Community health centers occur at high density and encompass most of the city. However, these low-grade medical facilities cannot attract residents to go there, and the actual population served is much lower than the theoretical carrying capacity, leading to a certain degree of resource waste. Second, public health services are provided by high-grade medical institutions, which have a serious oversupply of high-grade, high-quality medical resources. As the level of a medical facility increases, the average value of its carrying state also gradually increases. All medical facilities above the first level are overloaded to various degrees, and the overloaded medical facilities account for more than 60% of the tertiary hospitals, which are visited by many residents and are in short supply.
Overall, medical overloading occurs in multiple districts. The overall medical configuration is relatively uneven, with some areas unable to meet the needs of residents. Except for the CHSCs, the carrying capacity of medical resources in Shenzhen is centered in the central and western parts of the city and gradually decreases to the east and west, thus gradually reducing the efficiency of medical resource utilization. The carrying-capacity index of Shenzhen’s CHSCs is low, the utilization rate is low, and resources need to be optimized and integrated.

4. Discussion

4.1. Characteristics of Healthcare Resources Carrying in Shenzhen

The overall public medical service in Shenzhen shows a polycentric development pattern, with the density of medical facilities being higher in the west and lower in the east. The service potential agglomeration centers of medical facilities in Shenzhen are scattered in various districts and vary in size. The gravitational value connection line between each medical point and the TAZ is radially gathered in medical facilities with a high-grade scale, which is related to the superior service quality of the high-grade hospitals themselves and a larger radiating population. Multiple medical facilities are overloaded, and firstly, the reasons for this are analyzed in conjunction with the population size distribution map of the district (Figure 2), mainly for the following two reasons. First, the supply of medical resources is insufficient, and the population density near medical facilities is too high, so the limited medical resources cannot meet the needs of residents, which require additional medical points, such as the Futian District, the eastern part of the Luohu District, and some areas of the Bao’an District. Second, there is a preference for residents to seek medical treatment, and residents flock to tertiary-quality medical resources service facilities in large numbers, leading to the overload of services in tertiary medical facilities by more than half. At this point, it is recommended that its surrounding lightly loaded medical facilities provide more quality services to attract residents to visit.
Secondly, the trend of residents’ mobility between job and housing plays an important role in the impact on the distribution and carrying state of healthcare resources. Specifically, the historical development of Shenzhen has led it to become a typical megacity with a polycentric structure [73,74]. In 1980, Shenzhen was established as an SEZ with only the Futian, Nanshan, Luohu, and Yantian Districts included, i.e., the former SEZ [48]. The former SEZ became an urban center, and its development was earlier, with a large influx of population for employment, along with a large number of medical support, so there were medical services hotspots (Figure 5) with high density in the former SEZ (Figure 4). With the development of the city, most of the employed population gathered within the former SEZ [75], and the demand for medical services exceeded the supply, resulting in medical overload in the former SEZ despite the fact that it has a far greater number of medical institutions than that outside of the SEZ. In 2010, the SEZ was extended to the whole city, and the Bao’an District and Longgang District in northern Shenzhen have rapidly developed with high-tech industrial processing, modern agriculture, and other industries, forming several urban subcenters [74]. Residents living in the suburbs have begun to choose jobs near the suburbs, which leads to short-term employment flows concentrated around the subcenters [73], and thus, medical support facilities are gradually built and gathered, finally forming hotspots for the concentration of medical institutions (Figure 5). However, medical overload still exists due to the late development of areas outside the former SEZ, where medical facility support has not been self-contained yet.
Thirdly, from the perspective of medical planning and medical institutions themselves, Shenzhen adopts a hierarchical diagnosis and treatment system, which is proposed based on the problem that it is difficult and expensive for residents to go to hospitals, which can also disperse the medical pressure of large hospitals to a certain extent. However, the medical facilities of CHSCs are poor, and most residents are unable to meet their needs there, resulting in wasted resources of CHSCs. High-level medical institutions still have the problem of short supply and demand overload. Overall, the current medical services provided in Shenzhen fail to meet residents’ demand, and there is a mismatch between residents’ actual demand and theoretical supply, leaving medical allocation efficiency to be improved, which is consistent with the results of many current papers [25,44,47].
For this study, although previous studies have used 2SFCA and other methods to study the accessibility of medical resources [23] and the balance of supply and demand [48] in Shenzhen on the fine scale of community, they have not taken community health service centers (CHSCs) into account, which creates a certain error. In fact, Shenzhen adopts a hierarchical diagnosis and treatment system, and the first choice is the CHSCs. Therefore, the inclusion of the CHSCs into the public medical service resource system in this study can provide more reasonable and effective suggestions for the future planning and construction of Shenzhen. Secondly, compared with the 2SFCA model, the improved potential model focuses more on the impact of spatial impedance on service capacity, which is more conducive to depicting residents’ travel characteristics. Third, although Wu et al. [48] studied the regional carrying capacity of medical resources in Shenzhen, they did not classify medical institutions. The carrying capacity of medical institutions at different levels is different. The research is still limited to guiding future medical planning. On this basis, this study improves the description of carrying capacity to a single medical institution and evaluates the medical service carrying capacity of medical institutions by using the theoretical service population and actual carrying population scale of each medical institution, which can better describe the characteristics of medical service carrying capacity in Shenzhen and provide a basis for guiding the construction of medical services in the future.

4.2. Refined Population Portrayal

Most previous studies used basic indicators such as the average number of hospital beds per 1000 people and the number of licensed physicians per 1000 people to measure the carrying capacity of healthcare facilities [21,22,69] and only the size of the population that can be served by healthcare facilities as a measure. This study combines an improved potential model to calculate infrastructure carrying capacity, which not only includes the number of hospital beds as an indicator but also takes into account factors such as the competitive advantage of hospital class, the limit distance of population travel, and the competition mechanism among residents. The combination of planning and residents’ actual travel choices can better restore real-life scenarios, help evaluate the carrying status of each hospital, and guide the construction and planning of future hospitals.
Moreover, the study refines the scale to the TAZs and combines the mobile phone signaling resident population data for analysis and exploration, which can better portray the travel characteristics of residents compared with previous studies. The TAZs, which have a certain degree of traffic association and similarity in space, are advantageous as scales for population size factors in the potential model. Compared with communities and census units, using the TAZs as the study unit is more refined and can better express the differences in residents’ access to health care. As compared with ordinary residential communities, the same TAZ has similar traffic characteristics within the same TAZ [38,39], such as traffic intensity and traffic status, etc. In this way, using the TAZs combined with road networks can more accurately characterize residents’ travel routes, thus enhancing the reliability of evaluation results. In this paper, only the medical system of Shenzhen is used as the research object, but the research method in this paper is universal since the implementation of hierarchical medical systems is now common in China [28].

4.3. Outlook and Limitations of the Study

The Potential Model is a complex tool often used to study the accessibility of healthcare services [76,77,78], characterizing how convenient it is for residents to reach a healthcare facility, and is a scientific and rational way to analyze improving the allocation of health care resources [44]. This study applies the model to the evaluation of carrying capacity, delineates the stage status of medical facilities, and uses Shenzhen as an example to guide subsequent specific medical planning in conjunction with its overall medical resource distribution, which has certain guiding significance in the context of the normalization of epidemic prevention and control. Compared with another commonly used model, the 2SFCA model, they are both typical models for evaluating the parity of access to public facilities and resources in cities [79]. It has been noted that the 2SFCA model is essentially a special case of the gravity model [29,80], which is simpler to calculate. However, compared with it, the potential model can integrate the residents’ demand and spatial barriers, such as time and distance, and can accurately reflect the residents’ access to facility resources in a smaller study unit [63], which is superior in studying the carrying capacity characteristics of healthcare facilities. The improved potential model with the addition of hospital size and mobile phone signaling the TAZ factor can better express the residents’ travel to medical care characteristics.
However, there are still some points to note in the use of the improved potential model. Regarding the value of the β parameter in the potential model, a more ideal and objective approach is to obtain it by regressing the number of people using different distances from medical facilities [63], which requires the use of OD data for residents’ daily choice of medical facility, making it more difficult to achieve. In contrast, several previous studies [81,82] have shown that the value of β is mostly concentrated between [0.9, 2.0]. Therefore, this study set the value of the travel friction coefficient β to 2 by referring to medical resource-related surveys in Shanghai [6], a city of the same level.
As for the question of how to measure the migration of the population to other medical services outside the neighborhood because of special medical needs. While the daily medical needs are addressed in the neighborhoods, residents migrate to higher-level hospitals when they have special needs. The medical treatment system in Shenzhen itself is a hierarchical system, and this paper examines each level in the study, covering many different needs. The carrying capacity is also examined for this relatively stable demand, and a small number of residents seek medical treatment from far away due to very special needs, even to other provinces and cities, which are not included in the scope of this paper due to the limitation of data. In future research, we will try to take into account the special medical needs and special mobility of residents. Furthermore, the study in this paper only explores the total health care behavior of the resident population, and in subsequent studies, specific analyses need to be conducted for different age levels and gender of the population composition, combined with the attribute categories of hospitals, to optimize the allocation of health care resources to different categories of people.

4.4. Policy Recommendations

The results of this study indicate that many hospitals in Shenzhen are currently overloaded and unable to meet the demand of residents for medical care. Additionally, in the context of the normalization of the COVID-19 outbreak prevention and control, hospitals should be expanded to meet the needs of residents and develop the capacity to respond to health emergencies. Specifically, Futian District and the eastern part of the Luohu District, where high-level medical resources are arranged adjacently to produce nuclear density centers, are still in short supply of medical resources and need additional medical facilities to meet the needs of residents in the district. Additionally, the Dapeng New District needs to integrate medical resources and improve the efficiency of medical resources utilization. While the medical facilities in the Bao’an District have a low service potential, some of them are severely overloaded and need additional high-grade medical facilities to attract residents to them. The CHSCs distributed over a large area of the city are lightly loaded and have low utilization rates. It is recommended that some CHSCs be merged or eliminated within the travel range of residents and additional high-grade medical facilities be installed to improve the utilization level of medical resources. Of course, medical resources in every city except for Shenzhen should be assessed comprehensively by applying our methodology to meet the needs of residents for medical care.

5. Conclusions

In the context of the COVID-19 global pandemic, medical resources are tight, and achieving a rational allocation of medical resources is an urgent problem to be solved. Based on this, this paper proposes a framework for studying the carrying capacity of medical resources in megacities using an improved potential model and a carrying capacity evaluation model and validates the results using Shenzhen city as a research example with certain reliability. The research can provide references for improving the utilization rate of medical resources in other megacities, optimizing the planning and allocation of urban medical resources, and formulating relevant policies under epidemic prevention and control. The main conclusions obtained are as follows:
(1)
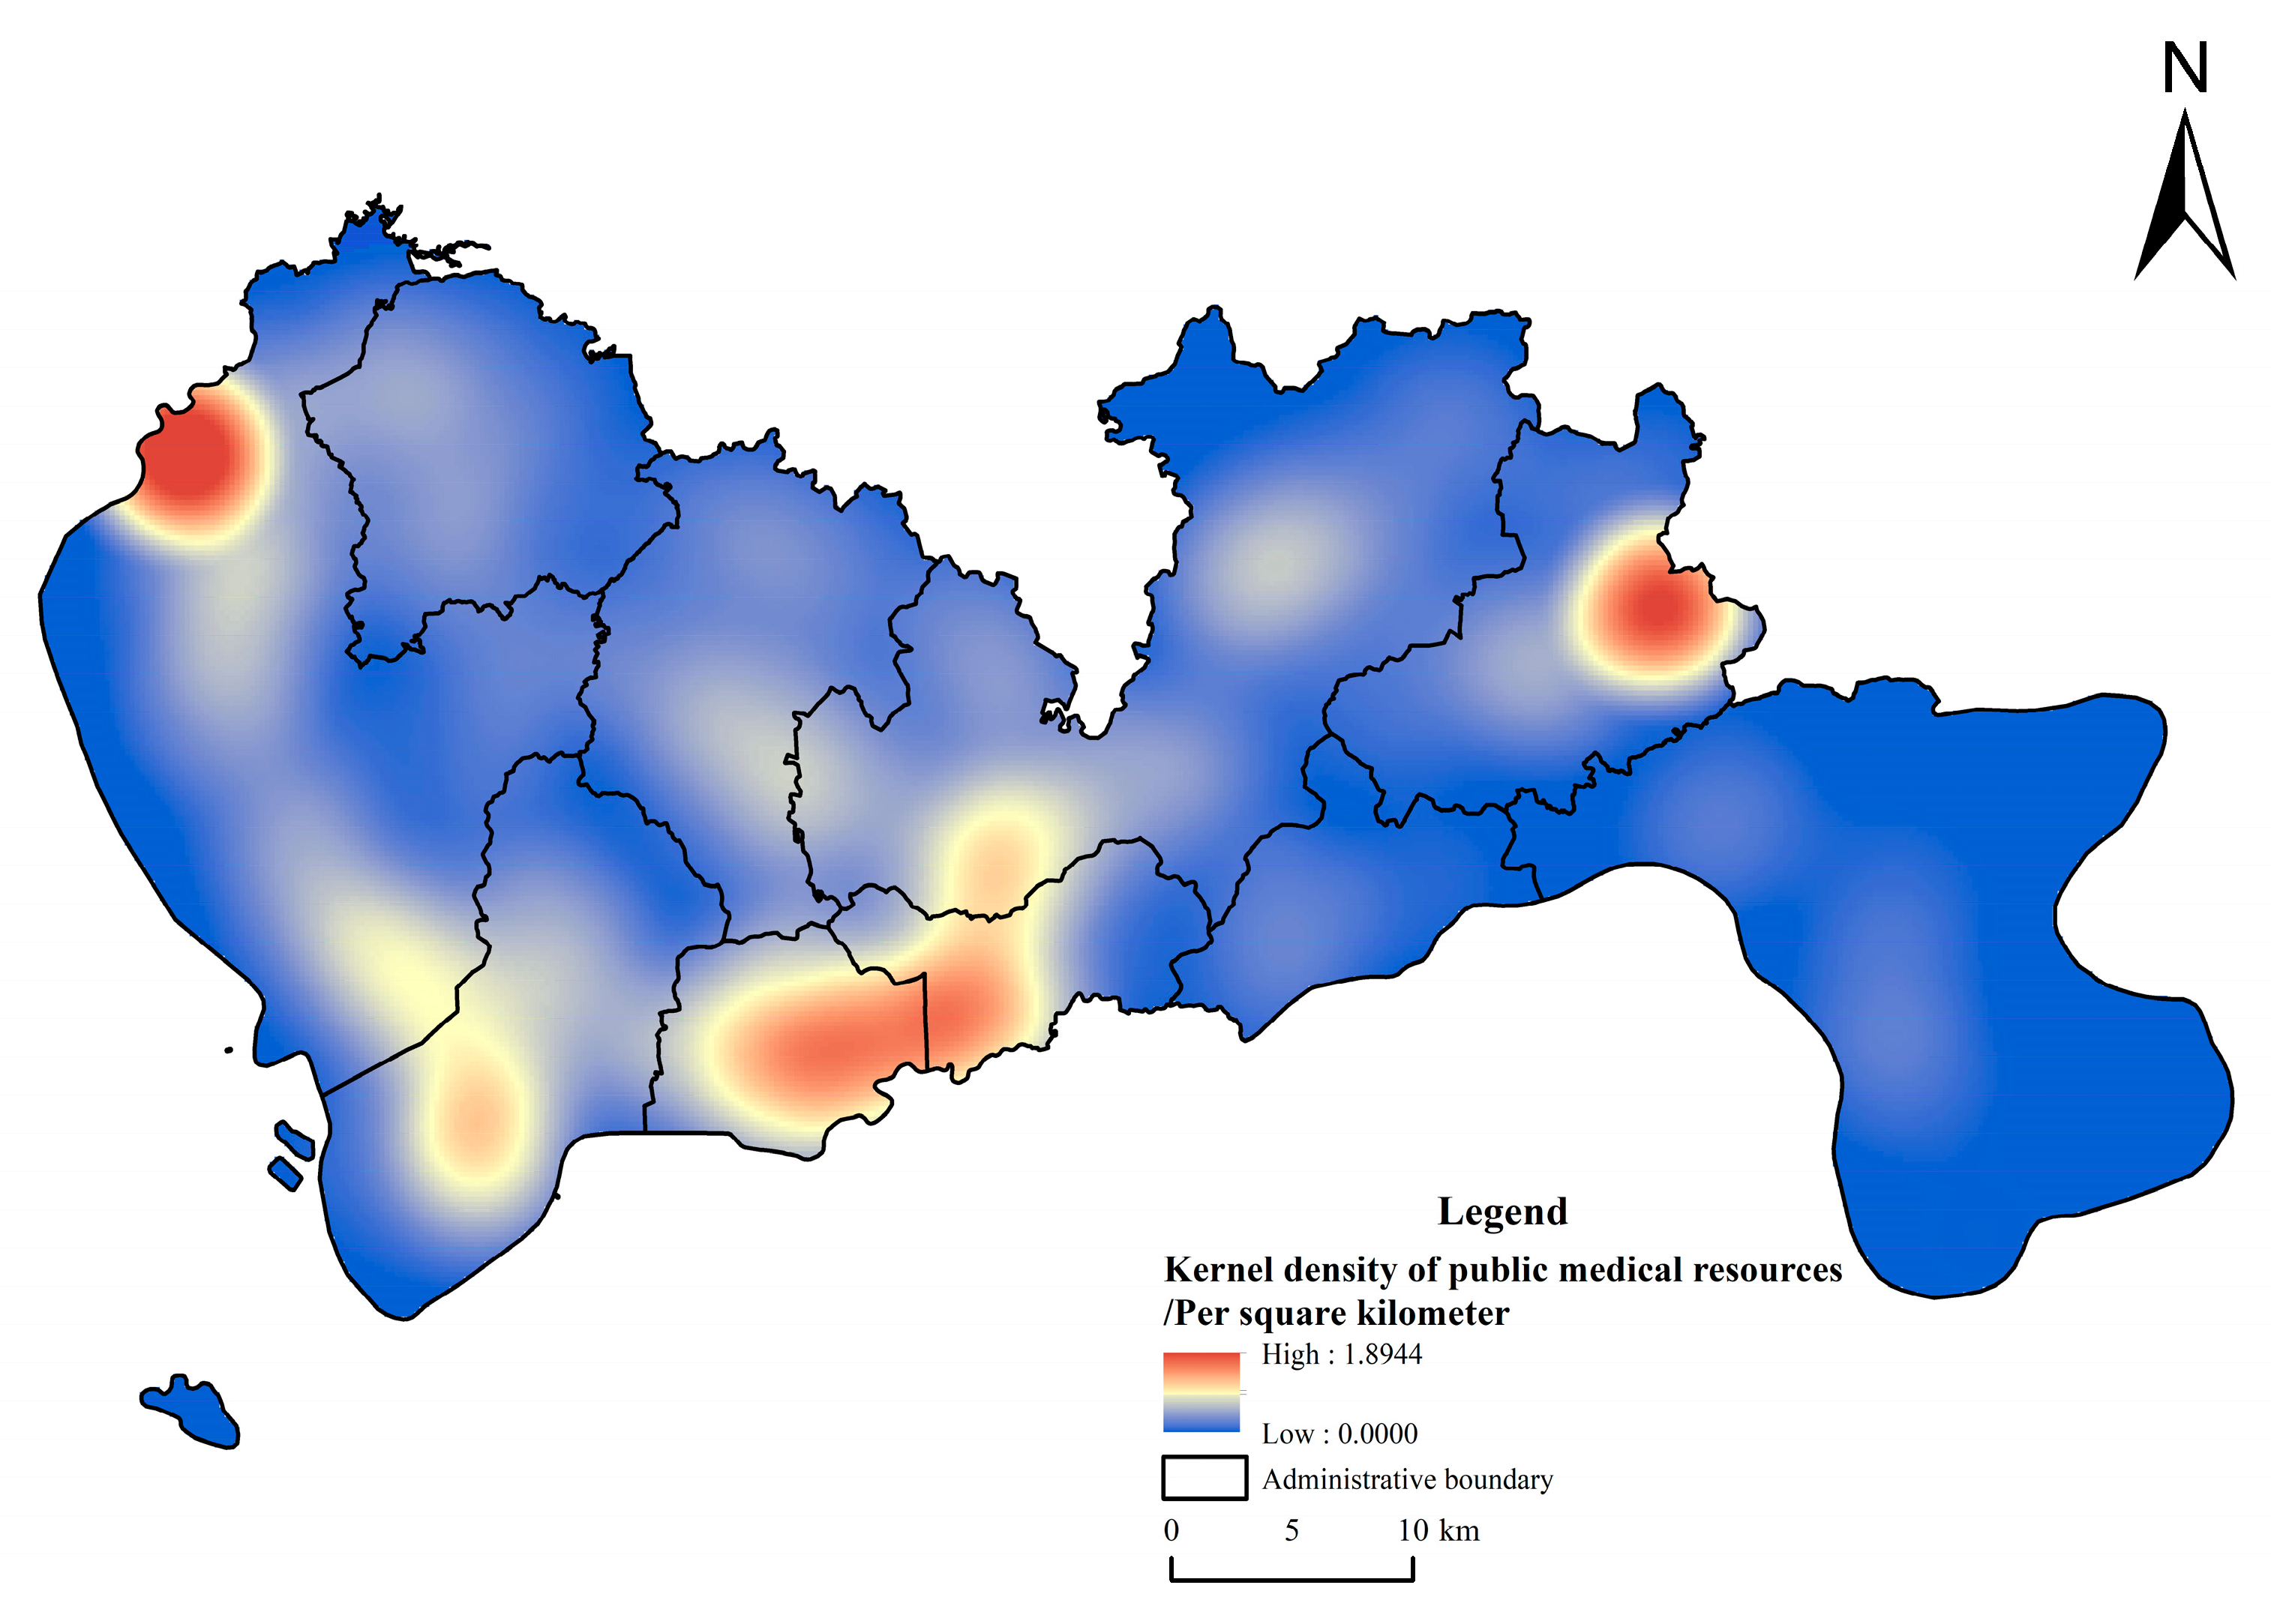
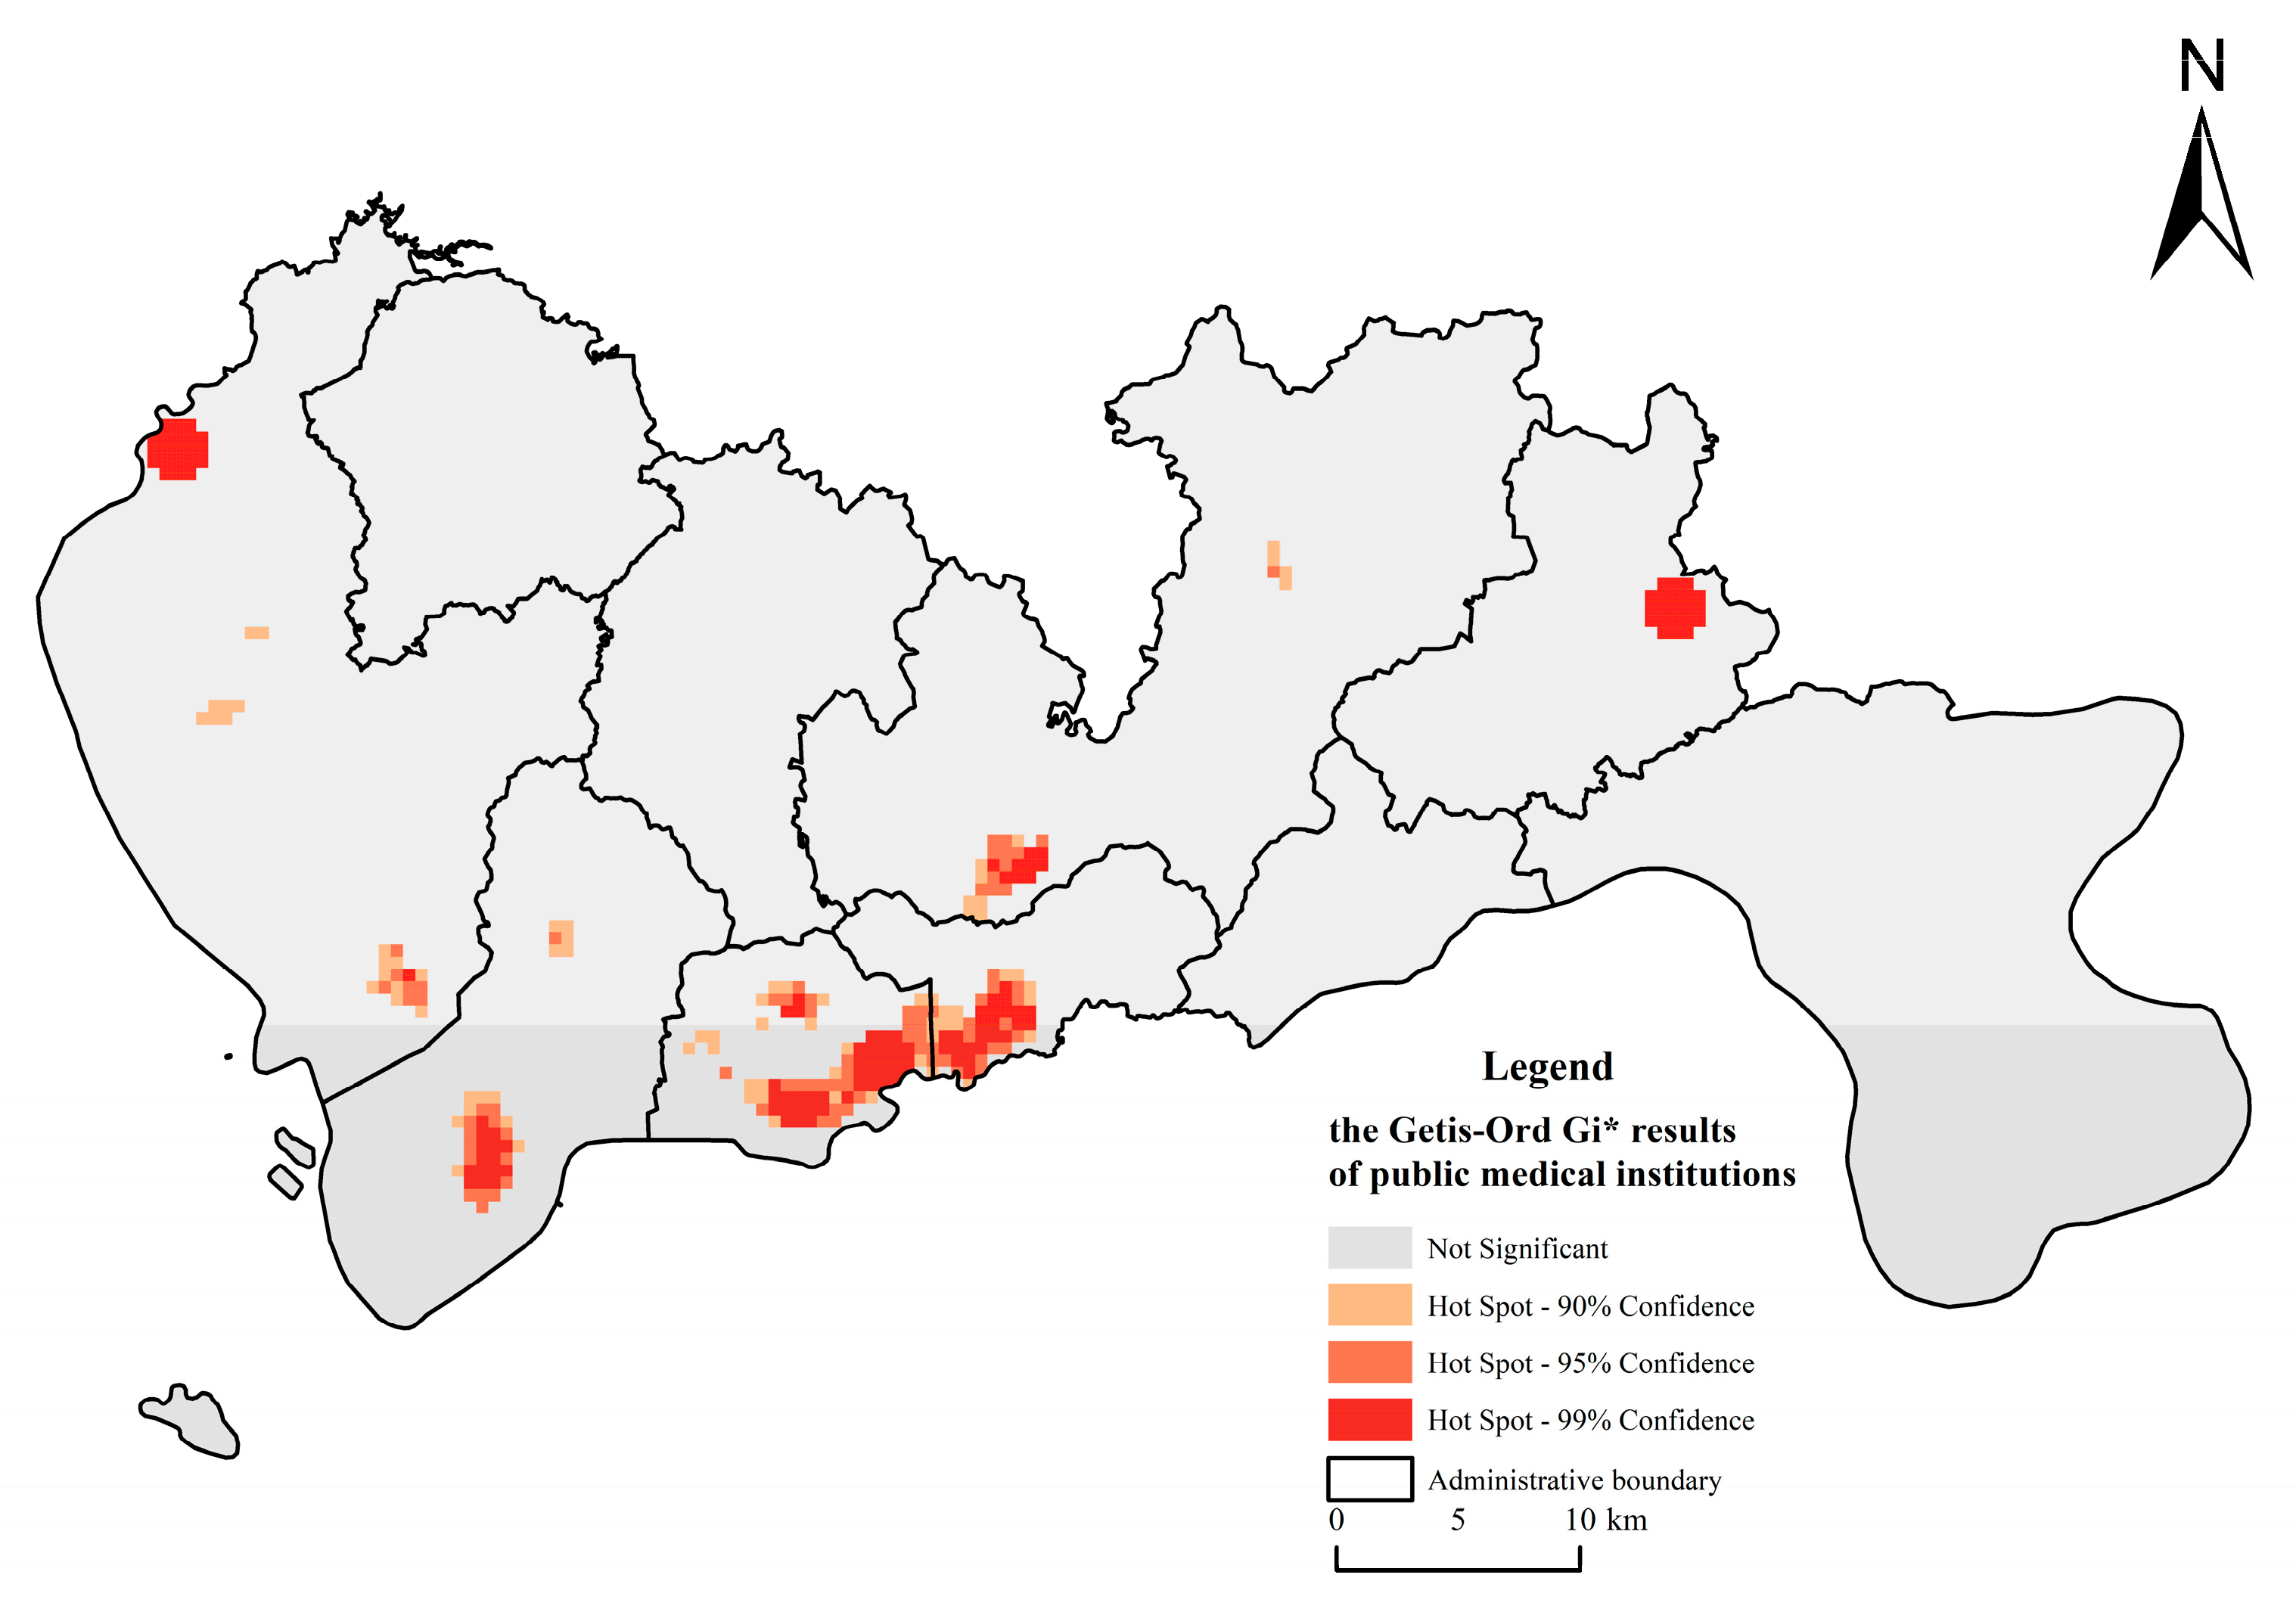
The spatial distribution of public medical resources in Shenzhen is uneven. Medical resources generally show a blocklike aggregation and a multicenter and hierarchical development pattern, and local aggregation hotspots are scattered in different districts of the city. Specifically, these districts include the northern and southern parts of the Bao’an District, the central part of Nanshan District, Futian District, the western part of Luohu District, the northeastern part of Pingshan District, and some parts of the Longgang District.
(2)
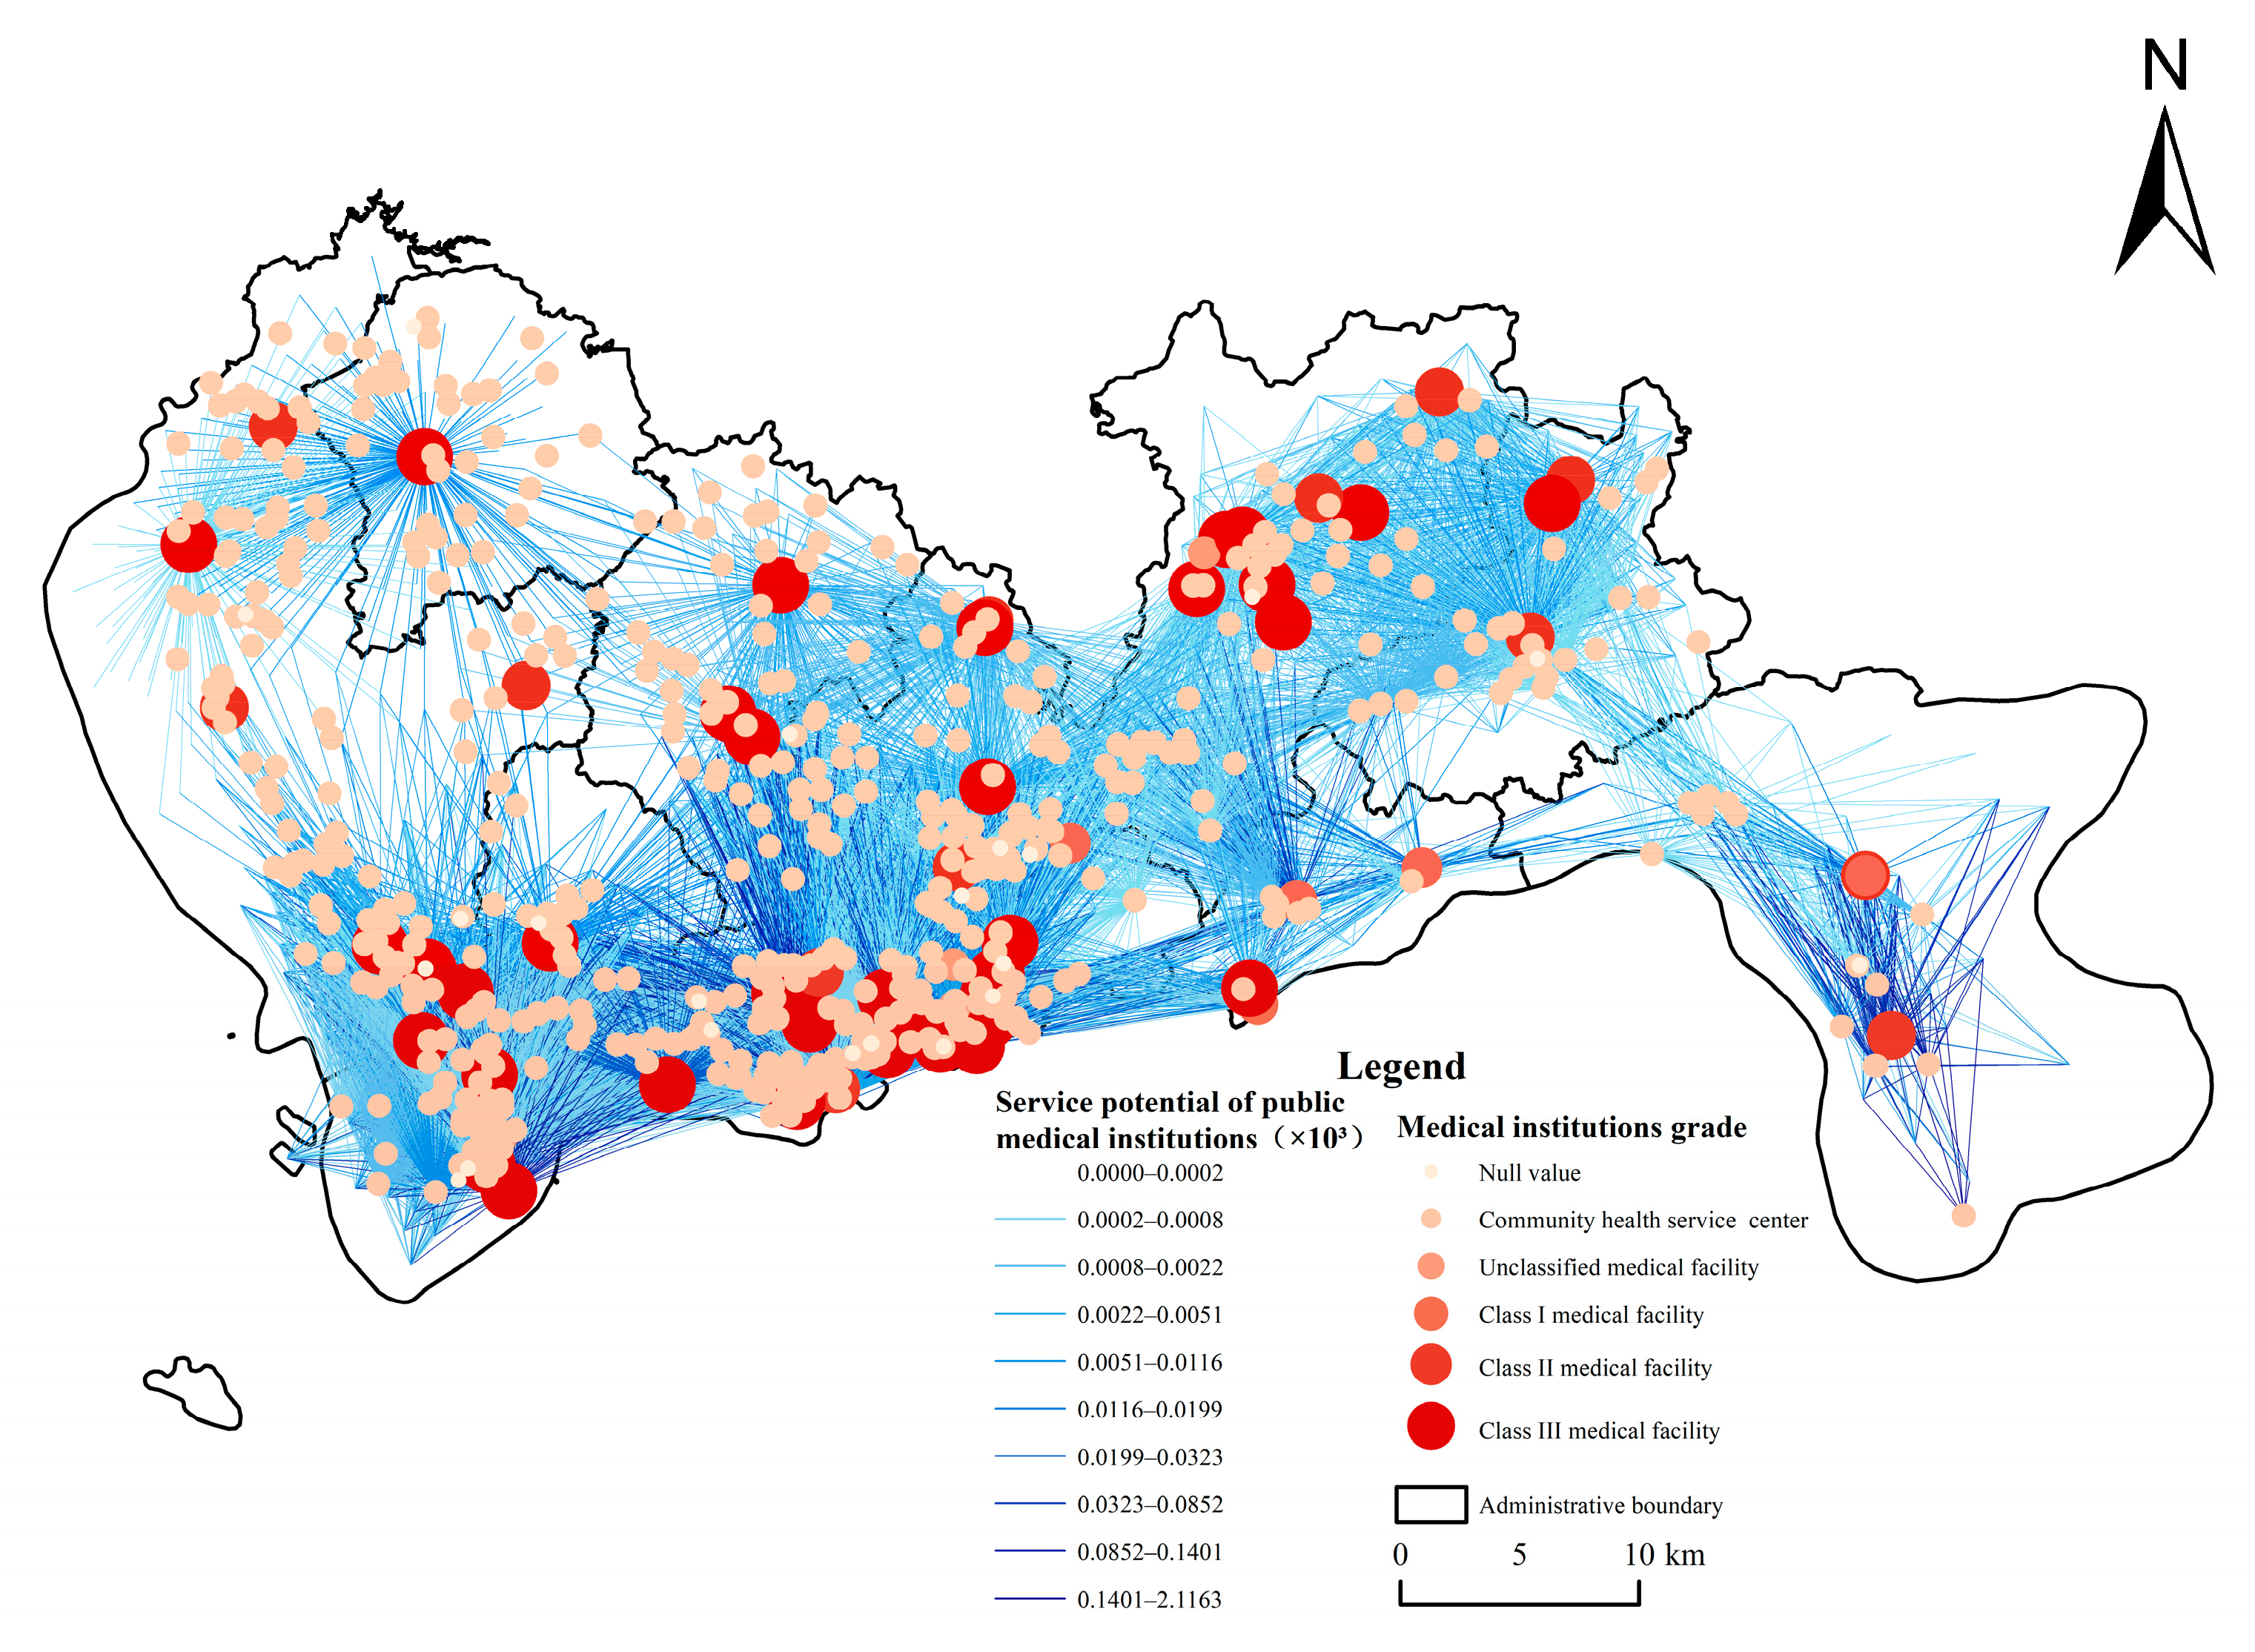
The service potential of public medical facilities in Shenzhen has obvious geographical variations at the regional level due to the quality of services and the size of the radiated population. Specifically, the southwestern part of Shenzhen, such as the Futian and Nanshan Districts, and the eastern part of Shenzhen, such as the Dapeng New District, show the characteristics of a high-level gravitational value cluster. The northwestern Guangming, Bao’an, and Longhua Districts have lower gravitational value for their medical facilities.
(3)
Overall, public medical facilities in Shenzhen are not empty, but several public medical facilities in each district of Shenzhen, except for the Dapeng New District, are overloaded with service demands. The current spatial allocation of medical facilities is unreasonable, with large swaths of CHSCs lightly loaded due to a mismatch between residents’ preferences for medical care and the supply and demand for medical resource services. It is likely to become necessary to merge or cancel low-grade medical facilities such as CHSCs and to add high-grade medical institutions to optimize the spatial allocation pattern.
(4)
The incorporation of the medical institution rank factor can better express the difference in service quality provided by different levels of hospitals. In the future, merging low-utility, lightly loaded CHSCs and increasing the number of high-grade medical services will be the main direction of policy formulation. At the same time, the improved potential model and infrastructure carrying-capacity evaluation model based on the population data of mobile signaling of the TAZ can effectively express the residents’ medical behavior, and then evaluate the infrastructure carrying capacity of megacities such as Shenzhen, guide future infrastructure construction, and provide the basis for building sustainable cities and communities.

Author Contributions

Conceptualization and supervision, J.W.; conceptualization, methodology, writing—original draft preparation, and visualization, T.Y.; methodology, validation, and writing—review and editing, H.W. (Han Wang); validation, writing—review and editing, supervision and funding acquisition, H.W. (Hongliang Wang); resources, J.F.; writing—review and editing, Y.Z. All authors have read and agreed to the published version of the manuscript.

Funding

This research was funded by the Guangdong Basic and Applied Basic Research Foundation, grant number 2020A1515110847.

Institutional Review Board Statement

Not applicable.

Informed Consent Statement

Not applicable.

Data Availability Statement

Not applicable.

Conflicts of Interest

The authors declare no conflict of interest.

References

  1. Chen, J.; Bai, Y.; Zhang, P.; Qiu, J.; Hu, Y.; Wang, T.; Xu, C.; Gong, P. A Spatial Distribution Equilibrium Evaluation of Health Service Resources at Community Grid Scale in Yichang, China. Sustainability 2020, 12, 52. [Google Scholar] [CrossRef]
  2. Zhang, D.; Huang, J.; Luo, C. From “Hospital Runs” to “Health Care for All”: The Impact of the Public Health Policy Change. China J. Econ. 2021, 8, 182–206. (In Chinese) [Google Scholar] [CrossRef]
  3. Yin, G.; Song, H.; Wang, J.; Nicholas, S.; Maitland, E. The COVID-19 Run on Medical Resources in Wuhan China: Causes, Consequences and Lessons. Healthcare 2021, 9, 1362. [Google Scholar] [CrossRef] [PubMed]
  4. Carroll, N.; Conboy, K. Normalising the “New Normal”: Changing Tech-Driven Work Practices under Pandemic Time Pressure. Int. J. Inf. Manag. 2020, 55, 102186. [Google Scholar] [CrossRef] [PubMed]
  5. Li, Y.; Chen, W. The Development and Transformation of China’s Human Resource Service Industry in the Post-Epidemic Era: Based on the Context Analysis of Policies about Human Resources Service under the Normalization of Epidemic Prevention and Control. Hum. Resour. Dev. China 2020, 37, 18–32. (In Chinese) [Google Scholar] [CrossRef]
  6. Wu, T.; Tang, C.; Zhang, R.; Wang, X. GDCL Evaluation Method for Service Carrying Capacity of Medical Facilities from the Perspective of Residents’Choice Behavior: A Case Study of Basic Public Health Service. Geogr. Geo-Inf. Sci. 2020, 36, 64–69. [Google Scholar] [CrossRef]
  7. Zhang, D.; Zhang, G.; Zhou, C. Differences in Accessibility of Public Health Facilities in Hierarchical Municipalities and the Spatial Pattern Characteristics of Their Services in Doumen District, China. Land 2021, 10, 1249. [Google Scholar] [CrossRef]
  8. Xia, T.; Song, X.; Zhang, H.; Song, X.; Kanasugi, H.; Shibasaki, R. Measuring Spatio-Temporal Accessibility to Emergency Medical Services through Big GPS Data. Health Place 2019, 56, 53–62. [Google Scholar] [CrossRef]
  9. Ye, K.-H.; Lee, W.-S. Medical Accessibility Analysis by Optical Store and Ophthalmic Clinic Distribution (Centering on Special and Metropolitan Cities). J. Korean Ophthalmic Opt. Soc. 2016, 21, 159–171. [Google Scholar] [CrossRef]
  10. Han, C.; Wang, Y.; Qu, D.; Han, K.; Wang, J.; Zhang, Z. Study on the Dynamic Impact of the Gap between Urban and Rural Medical and Health Resources Allocation in China Based on State Space Model. Chin. J. Health Stat. 2020, 37, 757–760. (In Chinese) [Google Scholar]
  11. Withanachchi, N.; Uchida, Y.; Nanayakkara, S.; Samaranayake, D.; Okitsu, A. Resource Allocation in Public Hospitals: Is It Effective? Health Policy 2007, 80, 308–313. [Google Scholar] [CrossRef] [PubMed]
  12. Zhang, P.; Ren, X.; Zhang, Q.; He, J.; Chen, Y. Spatial Analysis of Rural Medical Facilities Using Huff Model: A Case Study of Lankao County, Henan Province. Int. J. Smart Home 2015, 9, 161–168. [Google Scholar] [CrossRef]
  13. Yang, S.; Tian, S. Analysis of Health Resource Allocation Efficiency of Township Hospitals in China. Proc. J. Phys. Conf. Ser. 2021, 1774, 12021. [Google Scholar] [CrossRef]
  14. Chen, Y.; Yin, Z.; Xie, Q. Suggestions to Ameliorate the Inequity in Urban/Rural Allocation of Healthcare Resources in China. Int. J. Equity Health 2014, 13, 34. [Google Scholar] [CrossRef]
  15. Roadevin, C.; Hill, H. How Can We Decide a Fair Allocation of Healthcare Resources during a Pandemic? J. Med. Ethics 2021, 47, 84. [Google Scholar] [CrossRef]
  16. Fu, S.; Liu, Y.; Fang, Y. Measuring the Differences of Public Health Service Facilities and Their Influencing Factors. Land 2021, 10, 1225. [Google Scholar] [CrossRef]
  17. MacInko, J.; Lima-Costa, M.F. Horizontal Equity in Health Care Utilization in Brazil, 1998–2008. Int. J. Equity Health 2012, 11, 33. [Google Scholar] [CrossRef]
  18. Bai, X.; Cheng, Y. Differences in Regional Medical Resources Allocation, Medical Condition, and Individual Health. J. Xi’an Jiaotong Univ. (Soc. Sci.) 2019, 39, 80–89. [Google Scholar] [CrossRef]
  19. Wang, J.; Liu, Y. Spatial Layout Analysis of General Hospitals in Central City Districts of Tianjin Based on GIS. Geogr. Geo-Inf. Sci. 2018, 34, 25–30. (In Chinese) [Google Scholar] [CrossRef]
  20. Zhang, C.; Zhao, X.; Ni, J.; Wu, Y.; Li, X. Fairness Analysis of Health Resources Allocation in Sichuan Province Based on Agglomeration Degree. Mod. Prev. Med. 2020, 47, 3530–3535. (In Chinese) [Google Scholar]
  21. Yang, L.; Li, S. Influencing Factors and Improvement of Unbalanced Allocation of Urban and Rural Medical Resources. Econ. Perspect. 2016, 9, 57–68. (In Chinese) [Google Scholar]
  22. Lei, P.; Feng, Z.; Ding, J.; Duan, R.; Yu, H.; Liu, Q. Evaluation of the Status Quo of Medical Resource Allocation and Service Utilization in China. Health Econ. Res. 2019, 36, 50–55. (In Chinese) [Google Scholar]
  23. Zhu, L.; Zhong, S.; Tu, W.; Zheng, J.; He, S.; Bao, J.; Huang, C. Assessing Spatial Accessibility to Medical Resources at the Community Level in Shenzhen, China. Int. J. Environ. Res. Public Health 2019, 16, 242. [Google Scholar] [CrossRef] [PubMed]
  24. Yin, C.; He, Q.; Liu, Y.; Chen, W.; Gao, Y. Inequality of Public Health and Its Role in Spatial Accessibility to Medical Facilities in China. Appl. Geogr. 2018, 92, 50–62. [Google Scholar] [CrossRef]
  25. Tao, Z.; Yao, Z.; Kong, H.; Duan, F.; Li, G. Spatial Accessibility to Healthcare Services in Shenzhen, China: Improving the Multi-Modal Two-Step Floating Catchment Area Method by Estimating Travel Time via Online Map APIs. BMC Health Serv. Res. 2018, 18, 345. [Google Scholar] [CrossRef] [PubMed]
  26. Cheng, M.; Tao, L.; Lian, Y.; Huang, W. Measuring Spatial Accessibility of Urban Medical Facilities: A Case Study in Changning District of Shanghai in China. Int. J. Environ. Res. Public Health 2021, 18, 9598. [Google Scholar] [CrossRef]
  27. Qu, X.; Qi, X.; Wu, B. Disparities in Dental Service Utilization among Adults in Chinese Megacities: Do Health Insurance and City of Residence Matter? Int. J. Environ. Res. Public Health 2020, 17, 6851. [Google Scholar] [CrossRef] [PubMed]
  28. Zhao, P.; Li, S.; Liu, D. Unequable Spatial Accessibility to Hospitals in Developing Megacities: New Evidence from Beijing. Health Place 2020, 65, 102406. [Google Scholar] [CrossRef]
  29. Luo, J.; Chen, G.; Li, C.; Xia, B.; Sun, X.; Chen, S. Use of an E2SFCA Method to Measure and Analyse Spatial Accessibility to Medical Services for Elderly People in Wuhan, China. Int. J. Environ. Res. Public Health 2018, 15, 1503. [Google Scholar] [CrossRef]
  30. Cheng, L.; Yang, M.; De Vos, J.; Witlox, F. Examining Geographical Accessibility to Multi-Tier Hospital Care Services for the Elderly: A Focus on Spatial Equity. J. Transp. Health 2020, 19, 100926. [Google Scholar] [CrossRef]
  31. Xin, J. Measurement of Construction for Elderly-Care Facilities Based on 15-Minute Community Living Circle Planning. Remote Sens. Inf. 2019, 34, 118–223. (In Chinese) [Google Scholar] [CrossRef]
  32. Chen, P.T. Medical Big Data Applications: Intertwined Effects and Effective Resource Allocation Strategies Identified through IRA-NRM Analysis. Technol. Forecast. Soc. Chang. 2018, 130, 150–164. [Google Scholar] [CrossRef]
  33. Kong, X.; Liu, Y.; Wang, Y.; Tong, D.; Zhang, J. Investigating Public Facility Characteristics from a Spatial Interaction Perspective: A Case Study of Beijing Hospitals Using Taxi Data. ISPRS Int. J. Geo-Inf. 2017, 6, 38. [Google Scholar] [CrossRef]
  34. Zhou, N. Research on Urban Spatial Structure Based on the Dual Constraints of Geographic Environment and POI Big Data. J. King Saud Univ.-Sci. 2022, 34, 101887. [Google Scholar] [CrossRef]
  35. Zhao, Y.; Wang, N.; Luo, Y.; He, H.; Wu, L.; Wang, H.; Wang, Q.; Wu, J. Quantification of Ecosystem Services Supply-Demand and the Impact of Demographic Change on Cultural Services in Shenzhen, China. J. Environ. Manag. 2022, 304, 114280. [Google Scholar] [CrossRef]
  36. Tong, D.; Sun, Y.; Xie, M. Evaluation of Green Space Accessibility Based on Improved Gaussian Two-Step Floating Catchment Area Method:A Case Study of Shenzhen City, China. Prog. Geogr. 2021, 40, 1113–1126. (In Chinese) [Google Scholar] [CrossRef]
  37. Xu, Y.; Zhou, R.; Dai, L.; Wang, Y.; Wang, X. Spatial Differences and the Impacts of the Separation between Jobs and Residential Locations: Evidence from Household Survey Data in Luohe City. Urban Dev. Stud. 2014, 21, 52–58. (In Chinese) [Google Scholar] [CrossRef]
  38. Lv, Y.; Qin, Y.; Jia, L.; Dong, H.; Jia, X.; Sun, Z. Dynamic Traffic Zone Partition Based on Cluster Analysis of Taxi GPS Data. Logist. Technol. 2010, 29, 86–88. (In Chinese) [Google Scholar] [CrossRef]
  39. Li, X.; Yang, X.; Chen, H. Study on Traffic Zone Division Based on Spatial Clustering Analysis. Comput. Eng. Appl. 2009, 45, 19–22. [Google Scholar] [CrossRef]
  40. Song, L.; Zhu, J.; Liu, X.; Chen, J.; Xian, K. Optimization Method of Traffic Analysis Zones Division in Public Transit Corridor. J. Transp. Syst. Eng. Inf. Technol. 2020, 20, 34–40. (In Chinese) [Google Scholar] [CrossRef]
  41. Xing, X.; Huang, W.; Song, G.; Xie, K. Traffic Zone Division Using Mobile Billing Data. In Proceedings of the 2014 11th International Conference on Fuzzy Systems and Knowledge Discovery, FSKD 2014, Xiamen, China, 19–21 August 2014; pp. 692–697. [Google Scholar]
  42. Cheng, G.; Zeng, X.; Duan, L.; Lu, X.; Sun, H.; Jiang, T.; Li, Y. Spatial Difference Analysis for Accessibility to High Level Hospitals Based on Travel Time in Shenzhen, China. Habitat Int. 2016, 53, 485–494. [Google Scholar] [CrossRef]
  43. Shenzhen Bureau of Statistics. Data of the Seventh National Census of Shenzhen in 2020; Shenzhen Bureau of Statistics: Shenzhen, China, 2020. [Google Scholar]
  44. Hu, W.; Li, L.; Su, M. Spatial Inequity of Multi-Level Healthcare Services in a Rapid Expanding Immigrant City of China: A Case Study of Shenzhen. Int. J. Environ. Res. Public Health 2019, 16, 3441. [Google Scholar] [CrossRef] [PubMed]
  45. Li, L.; Du, Q.; Ren, F.; Ma, X. Assessing Spatial Accessibility to Hierarchical Urban Parks by Multi-Types of Travel Distance in Shenzhen, China. Int. J. Environ. Res. Public Health 2019, 16, 1038. [Google Scholar] [CrossRef]
  46. Chang, Z.; Diao, M. Inter-City Transport Infrastructure and Intra-City Housing Markets: Estimating the Redistribution Effect of High-Speed Rail in Shenzhen, China. Urban Stud. 2021, 59, 870–889. [Google Scholar] [CrossRef]
  47. Jin, M.; Liu, L.; Tong, D.; Gong, Y.; Liu, Y. Evaluating the Spatial Accessibility and Distribution Balance of Multi-Level Medical Service Facilities. Int. J. Environ. Res. Public Health 2019, 16, 1150. [Google Scholar] [CrossRef] [PubMed]
  48. Wu, J.; Fu, J.; Wang, H.; Zhao, Y.; Yi, T. Identifying Spatial Matching between the Supply and Demand of Medical Resource and Accessing Carrying Capacity: A Case Study of Shenzhen, China. Int. J. Environ. Res. Public Health 2022, 19, 2354. [Google Scholar] [CrossRef] [PubMed]
  49. Wang, Y.; Xie, Y.; Liu, R.; Zhang, H. Population Prediction and Resource Allocation in Megacities from the Optimum Population Perspective:A Case Study of Beijing, Shanghai, Guangzhou and Shenzhen. Acta Geogr. Sin. 2021, 76, 352–366. [Google Scholar] [CrossRef]
  50. Duffy, C.; Newing, A.; Górska, J. Evaluating the Geographical Accessibility and Equity of COVID-19 Vaccination Sites in England. Vaccines 2022, 10, 50. [Google Scholar] [CrossRef]
  51. Shenzhen Municipal Health Commission. Medical Institution Establishment Planning in Shenzhen (2016–2020); Shenzhen Municipal Health Commission: Shenzhen, China, 2017. [Google Scholar]
  52. He, D.; Wang, J.; Wang, X.; Xie, C.; Jin, C. The Status Quo of Development on Private Medical Institutions in China. Chin. J. Health Policy 2014, 7, 8–13. [Google Scholar] [CrossRef]
  53. Shenzhen Municipal Health Commission Summary of Health Statistics of Shenzhen in 2020. Available online: http://wjw.sz.gov.cn/ (accessed on 7 October 2021). (In Chinese)
  54. Li, X.; Chen, Y.; Zhu, Y.; Feng, J.; Liu, Z. Private Hospitals Operated in DEA-Tobit Model in Shenzhen: Operating Efficiency and Influencing Factors. Chin. J. Hosp. Adm. 2017, 33, 876–880. [Google Scholar] [CrossRef]
  55. Li, X.; Chen, Y.; Zhu, Y.; Feng, J.; Yang, Y.; Gao, Y.; Feng, Z. PEST-SWOT Analysis of the Development for Private Hospitals in Shenzhen City. Chin. Hosp. Manag. 2017, 37, 36–38. [Google Scholar]
  56. Xiao, J.; Yang, H.; Liu, R.; Chen, Q. Study on Ecological Environment of Private Hospitals. Chin. Health Econ. 2013, 32, 59–62. [Google Scholar]
  57. Zhao, Y.; Zhu, M. Development Trend, Difficulties and Opportunities of Private Hospitals in China. Her. Med. 2019, 38, 276–278. [Google Scholar]
  58. Xiao, J.; Yang, Y.; Liu, R.; Guo, J.; Chen, Q. Analysis on the Cognition of Urban Residents to Private Hospitals in the Pearl River Delta. Health Econ. Res. 2013, 3, 45–46. (In Chinese) [Google Scholar] [CrossRef]
  59. Shenzhen Center for Prehospital Care Introduction to Shenzhen Emergency Center. Available online: http://wjw.sz.gov.cn/szsjjzx/jggk_161338/zxjj_161339/content/post_3130351.html (accessed on 1 June 2022).
  60. Anderson, T.K. Kernel Density Estimation and K-Means Clustering to Profile Road Accident Hotspots. Accid. Anal. Prev. 2009, 41, 359–364. [Google Scholar] [CrossRef]
  61. Feng, Y.; Chen, X.; Gao, F.; Liu, Y. Impacts of Changing Scale on Getis-Ord Gi* Hotspots of CPUE: A Case Study of the Neon Flying Squid (Ommastrephes Bartramii) in the Northwest Pacific Ocean. Acta Oceanol. Sin. 2018, 37, 67–76. [Google Scholar] [CrossRef]
  62. Getis, A.; Aldstadt, J. Constructing the Spatial Weights Matrix Using a Local Statistic. Geogr. Anal. 2004, 36, 90–104. [Google Scholar] [CrossRef]
  63. Cheng, M.; Lian, Y. Spatial Accessibility of Urban Medical Facilities Based on Improved Potential Model: A Case Study of Yangpu District in Shanghai. Prog. Geogr. 2018, 37, 266–275. (In Chinese) [Google Scholar]
  64. Mirzahossein, H.; Sedghi, M.; Motevalli Habibi, H.; Jalali, F. Site Selection Methodology for Emergency Centers in Silk Road Based on Compatibility with Asian Highway Network Using the AHP and ArcGIS (Case Study: I. R. Iran). Innov. Infrastruct. Solut. 2020, 5, 1–14. [Google Scholar] [CrossRef]
  65. Song, Z.; Cheng, W.; Che, Q.; Zhang, L. Measurement of Spatial Accessibility to Health Care Facilities and Defining Health Professional Shortage Areas Based on Improved Potential Model—A Case Study of Rudong County in Jiangsu Province. Sci. Geogr. Sin. 2010, 30, 213–219. [Google Scholar] [CrossRef]
  66. Yang, Z.; Chen, Y.; Qian, Q.; Hu, Y.; Huang, Q. Evaluation of the Matching Degree of Public Medical Service Level Based on Population Spatialization:A Case Study of Guangzhou. Geogr. Geo-Inf. Sci. 2019, 35, 74–82. [Google Scholar] [CrossRef]
  67. Tong, S.; Chen, H. Evaluation of Accessibility of Medical Facilities Based on Street Scale—A Case Study in Shenzhen City. Health Econ. Res. 2017, 2, 31–34. (In Chinese) [Google Scholar] [CrossRef]
  68. Shenzhen Municipal People’s Government. Shenzhen Urban Planning Standards and Guidelines; Shenzhen Municipal People’s Government: Shenzhen, China, 2014. [Google Scholar]
  69. Zhao, N.; Shen, J.; Jia, L. An Empirical Study on Infrastructure Carrying Capacity and Carrying Condition of Beijing. Urban Stud. 2009, 16, 68–75. [Google Scholar] [CrossRef]
  70. Song, Y.; Yu, D. Evaluation of Comprehensive Capacity of Resources and Environments in Poyang Lake Eco-Economic Zone. Chin. J. Appl. Ecol. 2014, 25, 2975–2984. (In Chinese) [Google Scholar]
  71. Wu, C.; Wang, W. Evaluation of Infrastructure Carrying Capacity of National Central Cities and Diagnosis of Its Obstacles. Bull. Soil Water Conserv. 2020, 40, 260–267. (In Chinese) [Google Scholar] [CrossRef]
  72. Shenzhen Bureau of Statistics. Shenzhen Statistical Yearbook; China Statistics Press: Shenzhen, China, 2020; ISBN C832.653-54. [Google Scholar]
  73. Guo, S.; Pei, T.; Xie, S.; Song, C.; Chen, J.; Liu, Y.; Shu, H.; Wang, X.; Yin, L. Fractal Dimension of Job-Housing Flows: A Comparison between Beijing and Shenzhen. Cities 2021, 112, 103120. [Google Scholar] [CrossRef]
  74. Song, Y.; Chen, Y.; Pan, X. Polycentric Spatial Structure and Travel Mode Choice: The Case of Shenzhen, China. Reg. Sci. Policy Pract. 2012, 4, 479–493. [Google Scholar] [CrossRef]
  75. Jianatiguli, K.; Wang, X.; Meng, X. Comparative Study of Jobs-Housing Spatial Structure of Beijing and Shenzhen. Comp. Study Jobs-Hous. Spat. Struct. Beijing Shenzhen 2014, 21, 35–44. [Google Scholar] [CrossRef]
  76. Gharani, P.; Stewart, K.; Ryan, G.L. An Enhanced Approach for Modeling Spatial Accessibility for in Vitro Fertilization Services in the Rural Midwestern United States. Appl. Geogr. 2015, 64, 12–23. [Google Scholar] [CrossRef]
  77. Pu, Q.; Yoo, E.H.; Rothstein, D.H.; Cairo, S.; Malemo, L. Improving the Spatial Accessibility of Healthcare in North Kivu, Democratic Republic of Congo. Appl. Geogr. 2020, 121, 102262. [Google Scholar] [CrossRef]
  78. Schuurman, N.; Bérubé, M.; Crooks, V.A. Measuring Potential Spatial Access to Primary Health Care Physicians Using a Modified Gravity Model. Can. Geogr. 2010, 54, 29–45. [Google Scholar] [CrossRef]
  79. Liu, X.; Lin, Z.; Huang, J.; Gao, H.; Shi, W. Evaluating the Inequality of Medical Service Accessibility Using Smart Card Data. Int. J. Environ. Res. Public Health 2021, 18, 2711. [Google Scholar] [CrossRef] [PubMed]
  80. Luo, W.; Wang, F. Measures of Spatial Accessibility to Health Care in a GIS Environment: Synthesis and a Case Study in the Chicago Region. Environ. Plan. B Plan. Des. 2003, 30, 865–884. [Google Scholar] [CrossRef] [PubMed]
  81. Peeters, D.; Thomas, I. Distance Predicting Functions and Applied Location-Allocation Models. J. Geogr. Syst. 2000, 2, 167–184. [Google Scholar] [CrossRef]
  82. Yang, N.; Chen, S.; Hu, W.; Wu, Z.; Chao, Y. Spatial Distribution Balance Analysis of Hospitals in Wuhan. Int. J. Environ. Res. Public Health 2016, 13, 971. [Google Scholar] [CrossRef] [PubMed]
Figure 1. Shenzhen public healthcare service system. 1 Hospitals are divided into public hospitals and social hospitals. This paper only discusses public hospitals. 2 Tertiary hospitals can provide the highest quality of care and have advantages in function, facilities, and technical strength, followed by secondary hospitals.
Land 11 00888 g001
Figure 2. Distribution of medical resources and TAZs in Shenzhen in 2018.
Land 11 00888 g002
Figure 3. The research framework of the study.
Land 11 00888 g003
Figure 4. Estimated kernel density of public medical resources in Shenzhen in 2018.
Land 11 00888 g004
Figure 5. Analysis of cold and hotspots of public medical resources in Shenzhen in 2018.
Land 11 00888 g005
Figure 6. Potential/gravitational attraction of public medical services in Shenzhen.
Land 11 00888 g006
Figure 7. Evaluation results for the carrying capacity of public medical services in Shenzhen.
Land 11 00888 g007
Figure 8. Boxplot of the carrying capacity of public medical resources at different levels in Shenzhen.
Land 11 00888 g008
Table 1. Data Sources.
Name of DataContentsSource
Data on basic characteristics of three-tier hospitalsIncluding information on the name of the institution, level, category, size, number of beds, number of health technicians, address, administrative division, etc.http://www.sz.gov.cn/ (accessed on 13 May 2021)
Data on basic characteristics of community health service centers (CHSCs) 1Including information on the name, level, address, and administrative division of the institution.http://wjw.sz.gov.cn/ (accessed on 9 May 2021)
Healthcare point of interest (POI) dataLatitude and longitude informationhttps://www.amap.com/ (accessed on 1 May 2021)
Shenzhen mobile phone signaling traffic analysis zone (TAZ) dataIncluding TAZ vector surface data, TAZ number, population number, and population density (person/km2) data.China Mobile Communications Group Co., Ltd.
Road Network Data 2Main Road NetworkOpen Street Map
1 With reference to the “Shenzhen Community Health Service Institution Setting Standards” published by the Shenzhen Municipal Health Commission, a uniform number of beds and health technicians are assigned to each level of CHSCs. 2 Road network data are used in the improved potential model calculations.
Table 2. Medical service carrying status.
Range of ValuesDegree of Medical Resources Carrying CapacityStatus of Medical Resources
[0, 0.5]Severely light loadWaste
(0.5, 0.8]Moderately light loadInefficiency
(0.8, 1.2]Relatively balancedGood elasticity
(1.2, 1.5]Mild overloadGeneral
(1.5, 3]Moderate overloadFragility
(3, +∞)Severe overloadBreakdown
Publisher’s Note: MDPI stays neutral with regard to jurisdictional claims in published maps and institutional affiliations.

