Article

The Impact of the Accessibility of Transportation Infrastructure on the Non-Farm Employment Choices of Rural Laborers: Empirical Analysis Based on China’s Micro Data

College of Economics and Management, China Agricultural University, Beijing 100083, China
*
Author to whom correspondence should be addressed.
Land 2022, 11(6), 896; https://doi.org/10.3390/land11060896
Submission received: 12 May 2022 / Revised: 5 June 2022 / Accepted: 10 June 2022 / Published: 12 June 2022

Abstract

:
Non-agricultural employment plays a significant role in alleviating regional poverty. Using the micro data of the China Labor-Dynamics Survey (CLDS), this paper empirically analyzes the impact of the accessibility of rural transportation infrastructure on the non-agricultural employment choices of rural laborers by using the entropy method and the ordered Logit model. The results show that there is a significant positive correlation between the accessibility of rural transportation infrastructure and the non-agricultural employment of rural laborers. The study also finds that the laborers participating in non-agricultural employment in villages with good transportation infrastructure will prefer to be employed in nearby locations, and the development of the rural non-agricultural economy is an important reason. Further analysis clearly shows that gender, the family dependency ratio, and rural terrain characteristics affect the choices made by laborers with respect to non-agricultural employment. Based on the research results, focusing on a transportation and industry model and considering the construction of transportation infrastructure as a guide, especially in areas with poor terrain, promoting the development of rural non-agricultural industries can help solve the problem in rural areas and in women’s employment where family members or accompanying personnel are left behind, and can promote the orderly transfer of rural laborers.

1. Introduction

The continuous transfer of rural laborers to cities is an essential step in realizing agricultural modernization and promoting urbanization. Non-agricultural employment can increase the income of rural residents, alleviate rural poverty, narrow the income gap between urban and rural areas, provide sufficient laborers for urban modernization, and stimulate the consumer market. According to the China Migrant Workers Monitoring and Investigation Report, the total number of migrant workers nationwide in 2020 was 285.6 million, a decrease of 5.17 million over the previous year, and the scale was 98.2% of the previous year. Despite the large-scale and continuous transfer of rural laborers, the proportion of agricultural laborers in China is still relatively high at the current stage, and the task of promoting non-agricultural employment of surplus agricultural laborers is urgent [1]. Therefore, it is of great significance to explore the influencing factors of the non-agricultural employment of rural laborers.
The academic community has carried out extensive discussions on this topic. Agricultural land is a key influencing factor. Qiu and Luo [2] found that changes in crop planting types and non-agricultural family income structures weaken the inhibitory effect of land tenure instability on the non-agricultural employment of rural laborers. Zhu and Zhang [3] believe that it varies from person to person, and the confirmation of forest land rights has enhanced the willingness of young laborers and laborers with a junior high school education and above to work outside villages. In addition, the fragmentation of both farmland and land acquisition promotes the off-farm work of rural residents [4,5]. Home care for minors inhibits off-farm employment and working hours among middle-aged adults [6]. Engagement in family care for the elderly will also have an inhibitory effect on rural women’s off-farm employment [7]. In addition, the relocation program for poverty alleviation [8], the development of production outsourcing services [9], agricultural mechanization [10], education [11], and Internet use [12] all have an impact on the non-agricultural employment of rural laborers.
Some studies pay attention to the impact of transportation infrastructure on the non-agricultural employment of rural laborers. Most studies have affirmed the role of transportation infrastructure construction in promoting the non-agricultural employment of rural laborers [13,14,15,16,17]. Deng et al. [18] used the cross-sectional data of farmers and the Probit model to measure the transportation infrastructure by the length of hardened roads per capita in the village and the passage of provincial or county roads through the village. They demonstrated that the construction of transportation infrastructure has an impact on rural residents’ local non-agricultural employment and non-agricultural employment in other places. Based on the micro data of 4000 households in rural Indonesia, Gibson and Olivia [19] represented the transportation infrastructure by the distance and road conditions from the countryside to the provincial capital, and they used Tobit, Probit, and Poisson regression to demonstrate that the road has an impact on the non-agricultural employment and income of rural residents. Luo et al. [20] took the distance from the village to the nearest expressway as the key independent variable, and they empirically found that the improvement of rural expressway accessibility can significantly promote the non-agricultural employment of rural laborers. In the case of India, Asher and Novosad [21] used fuzzy breakpoint regression to prove that, although rural roads did not promote the economic development of rural India, they promoted the development of rural transportation services and enterprises and the transfer of laborers. Luo et al. [22] used the econometric model including road density and the non-agricultural employment of rural residents to verify that the change in the growth rate of non-farm work is partly due to the productivity gap between industrial and agricultural laborers and partly due to the promotion of rural infrastructure. A quasi-natural experimental study based on the construction of high-speed railways at the county level by Zhang et al. [23] found that the operation of high-speed railways led to a 3% transfer of local agricultural laborers to non-agricultural industries. Of course, some scholars hold the opposite view.
The reform and opening-up policy has led to the migration of rural laborers in China, which has lasted for more than 40 years. In the mid and late 1990s, the Chinese government concentrated its efforts on major projects and carried out unprecedented rural infrastructure construction, including road construction. The impact of transportation infrastructure construction on rural laborers cannot be ignored. Although there is abundant literature on the non-agricultural employment of rural laborers, there are still the following shortcomings: First, there are few domestic studies on the impact of transportation infrastructure construction on the non-agricultural employment of rural laborers, and most of them appear to be a path analysis of factors affecting farmers’ income, which may also be limited by the difficulty of obtaining micro data. Second, the measurement of the accessibility of rural transportation infrastructure is relatively simple, such as the density of roads in the provinces and cities where rural areas are located, whether there are roads, and the distance from the nearest expressway. Third, the research on the non-agricultural employment of rural laborers is insufficient. Limited to whether non-agricultural employment or income changes, studies do not reflect the specific impact of the accessibility of transportation infrastructure on the non-agricultural employment of rural residents after reducing transportation costs, such as the detailed workplace. This paper uses China Labor-Force Dynamics Survey (CLDS) micro data, taking into account both in-village and out-of-village traffic conditions to measure the accessibility of rural transport infrastructure. From the micro-individual level, we discuss the impact of the accessibility of transportation infrastructure on whether rural residents have non-agricultural employment and the locations of non-agricultural employment. Heterogeneity analysis is conducted at individual, household, and village levels.

2. Framework and Basic Facts

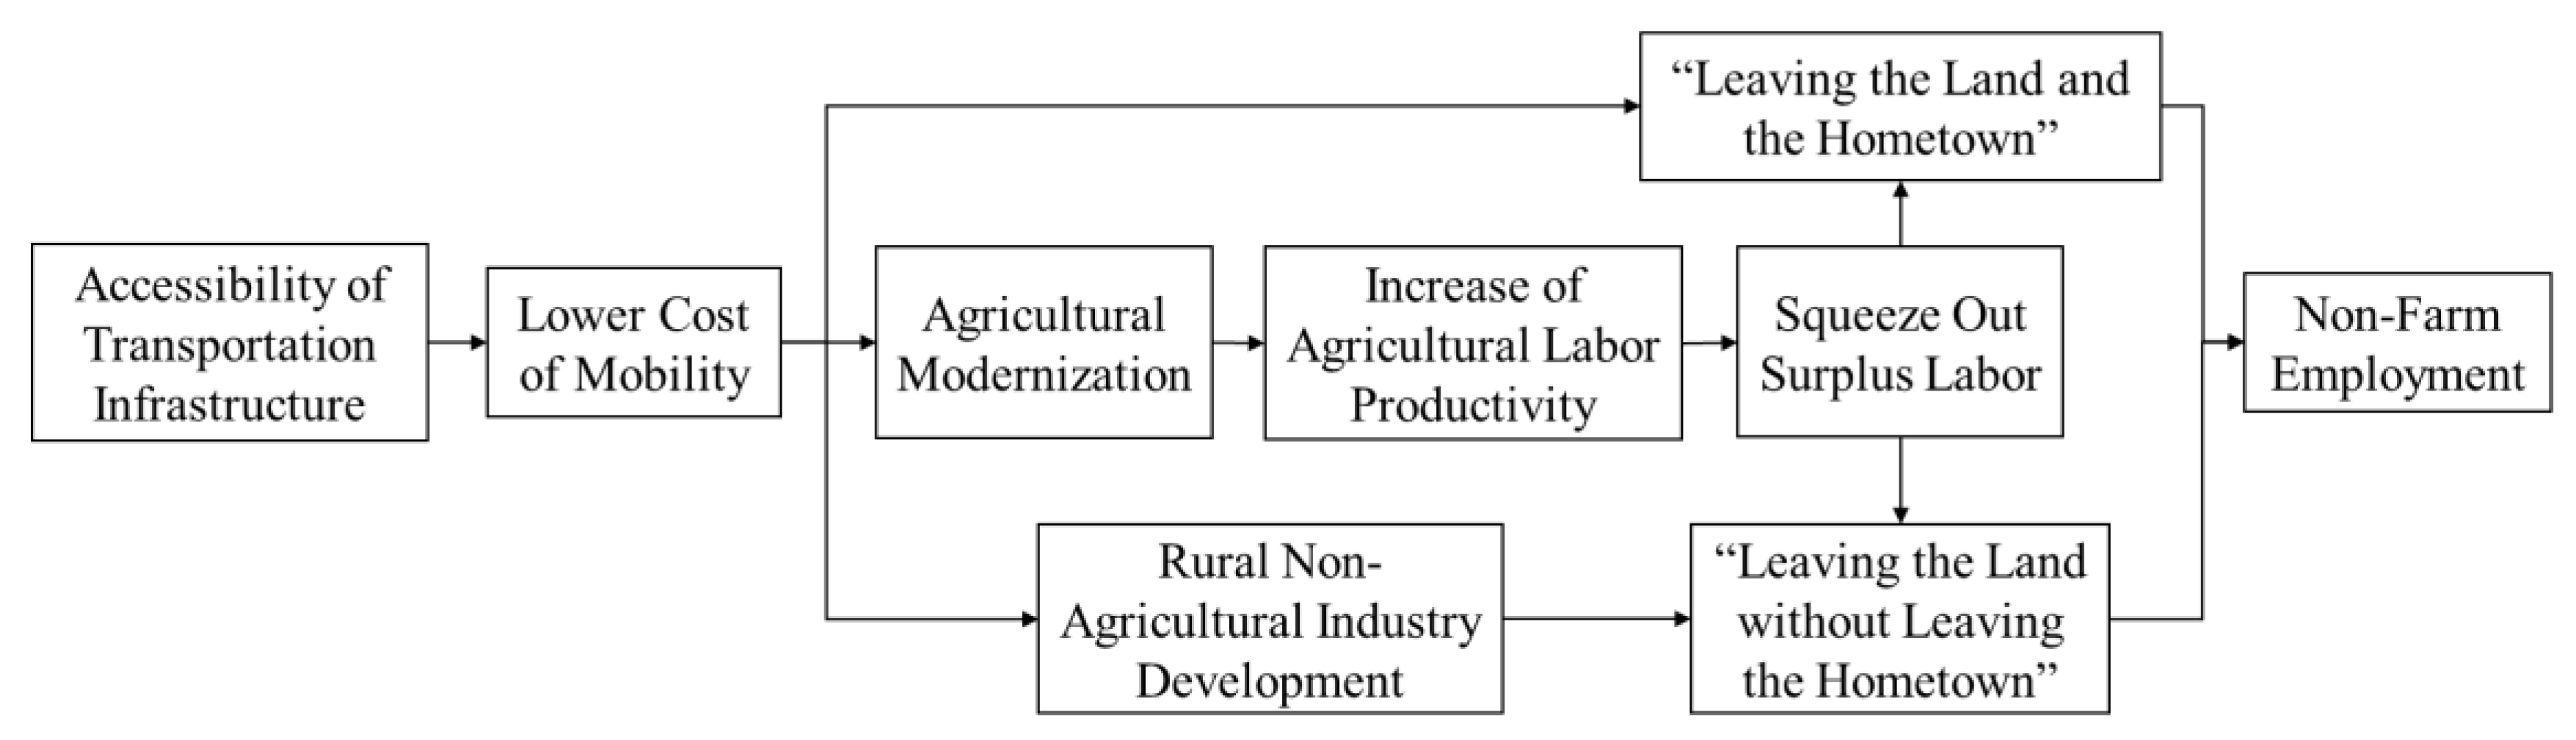
2.1. Theoretical Framework

According to the dual economic structure theory, the main motivation for the non-agricultural employment of rural laborers is to increase income. The greater the income gap between urban and rural areas, the greater the attractiveness of non-agricultural employment to agricultural laborers. By reducing the mobility cost, transportation infrastructure promotes the transfer of rural laborers from agriculture with a labor demand spillover and a low income to an industry or service industry with a strong labor demand and a high income.
Specifically, on the one hand, rural laborers’ participation in non-agricultural employment is motivated by a high salary [24]; on the other hand, laborers take into account the cost of participating in non-agricultural employment, including the mobility cost, the time cost between urban and rural areas, the search costs of looking for work, the psychological cost of leaving agriculture and moving away from family members, and the economic cost of taking care of family members or accompanying personnel that are left behind [22]. Therefore, the impact of the accessibility of transportation infrastructure on non-agricultural employment can be summarized in three aspects, as shown in Figure 1. Firstly, the accessibility of transportation infrastructure reduces the mobility cost of rural laborers and greatly shortens the time–space distance between urban and rural areas, which reduces the resistance of labor force transfer to cities. This situation of non-agricultural employment in other places is referred to as “leaving the land and the hometown.” Secondly, transportation infrastructure construction promotes agricultural growth [25] and has a spatial spillover effect [26,27]. According to research, the developed road traffic promotes the cross-regional operation of agricultural machinery [28], improves the efficiency of agricultural production [29,30], and reduces the demand for labor factors while promoting agricultural modernization [31]. The surplus labor force considers non-agricultural employment by comparing the expected benefits of non-agricultural and agricultural employment [32]. Thirdly, the accessibility of transportation infrastructure reduces transportation costs and transaction costs, which attracts industrial development [33] and agglomeration [34,35], alleviates the problem of resource misallocation, and adjusts the industrial structure [36]. It not only drives enterprises to land in rural areas, but also facilitates villagers to develop characteristic industries such as tourism and homestays based on the advantages of rural geographical locations and resources [37]. Therefore, while saving the cost of mobility, it also reduces the cost of job search and the psychological construction cost of leaving the homeland. This non-agricultural employment situation among rural laborers is called “leaving the land without leaving the hometown.”

2.2. Basic Facts

Since 2012, China has vigorously promoted the high-quality development of the Four Good Rural Roads, with 2.357 million kilometers of newly built and renovated rural roads, and the total mileage of rural roads had increased to 4.38 million kilometers by the end of 2020, accounting for 84.3% of the total mileage of national highways. According to the monitoring and investigation report of migrant workers released by the National Bureau of Statistics every year, although affected by the epidemic prevention and control measures in 2020, the number of migrant workers decreased by 1.8%. By 2019, the total number of migrant workers had reached 290.77 million. The proportion of migrant workers engaged in the tertiary industry was 51%. In terms of employment locations, there were 116.52 million non-agricultural farmers working locally and 174.25 million non-agricultural farmers working far away from their homes. Among the non-agricultural farmers who work far away from their homes, 99.17 million were employed in the local province, accounting for 56.9%, and the rest had moved to other provinces.
By sorting out the development of transportation infrastructure and the non-agricultural employment of rural residents, it is not difficult to see that the two are developing in parallel, as shown in Figure 2. Increasingly, rural laborers are choosing places of employment closer to home. Combining theoretical and factual analysis, transportation infrastructure construction reduces transportation costs and promotes non-agricultural employment for rural residents. However, whether it is because of agricultural production or the development of the rural non-agricultural economy needs to be further verified by an econometric model.

3. Materials and Methods

3.1. Data

The data used in this study come from the China Statistical Yearbook and the China Labor Force Dynamics Survey (CLDS) from 2014 to 2016 organized by the Science Survey Center of Sun Yat-sen University. The survey covers 29 provinces and cities in China (except Hong Kong, Macao, Taiwan, Tibet, and Hainan), and the survey respondents are laborers aged 15–64. The content focuses on the current situation of, and changes in, laborer education, employment, labor rights, and occupational mobility. At the same time, the political, economic, and social conditions of the communities where the laborers are located are systematically monitored. Based on the needs of the research, we used the family code of rural individual data and the village code of family data as key variables to match the data in a many-to-one manner, then merged the data of different years, and added the GDP data from the statistical yearbooks. After excluding irrelevant and missing samples, 12,040 valid samples were obtained.

3.2. Variables

3.2.1. Non-Farm Employment Options

The choice of non-agricultural employment for rural residents includes whether non-agricultural employment was chosen ( o f a r m ) and the location of non-agricultural employment ( w o r k p l a c e ). Non-agricultural employment refers to jobs other than agriculture, forestry, animal husbandry, and fishery. Setting 1 means that rural residents choose non-agricultural employment, and 0 means the opposite. If rural residents choose non-agricultural employment, the location of the non-agricultural employment of rural residents can be classified as “their own village,” “other villages in their own township,” “other townships in the county/district (excluding county/district city),” “county/district city,” or “outside the county/district” according to their distance from home. The integer value from near to far is 1 to 5, respectively.

3.2.2. Accessibility of Transportation Infrastructure

In order to better measure the accessibility of transportation infrastructure, this paper starts from two levels: outside the village and inside the village. The accessibility of transportation infrastructure outside the village is indicated by whether the village has roads ( r o a d ) and whether the village has bus stops ( b u s t o p ). If the fact is “yes,” it is set to 1; otherwise, it is 0. The accessibility measurement indicators of traffic infrastructure in the village include whether the traffic roads in the village have streetlamps ( s l a m p ) and a pavement hardening ratio ( h a r o a d ). If there are streetlamps, it is set to 1; otherwise, it is 0. Finally, by integrating the traffic infrastructure inside and outside the village, a comprehensive index ( a c c e s s ) to measure the accessibility of rural traffic infrastructure is obtained.

3.2.3. Other Control Variables

Following the principle of exogenous control variables as much as possible, the following variables were selected. (1) At the individual level, the age ( a g e ), gender ( g e n d e r ), education ( e d u c a t i o n ), marital status ( m a r r i a g e ), and health ( h e a l t h ) of rural residents were selected as control variables. Among them, the gender of rural residents uses 1 to represent women and 0 to represent men. The education level is divided into five situations: no schooling, primary school, junior middle school, senior high school, and junior college and above, which are expressed by 1 to 5, respectively. The higher the education level, the greater the value. There are mainly six marital statuses: unmarried, married once, remarried, divorced, widowed, and cohabitating. For convenience in measurement, 1 means married and 0 means not married. The self-rated health status is replaced by a number from 1 to 5, where 1 means very healthy and 5 means very unhealthy. (2) At the family level, family size ( f m s i z e ) and the family dependency ratio ( r a i s e r a t e ) were selected as control variables. The family dependency ratio includes the juvenile dependency ratio and the elderly dependency ratio, which are calculated by dividing the total number of family members under the age of 15 and over the age of 64 by the size of the family. (3) At the village level, the total area of agricultural land ( l a n d , thousand mu), the distance between the village and the nearest county/district government ( d c i g o v , km), the distance between the village and the nearest township government/street ( d v i g o v , km), terrain ( t e r r a i n ), whether the village is a suburb of a large or medium-sized city ( s u b u r b s ), and whether the village is the location of a township government ( r o g o v ) were selected as control variables. The terrain includes plains, hills, and mountainous areas, and the options are 1 for “yes” and 0 for “no.” (4) At the regional level, the per capita GDP (10000 yuan) of the provinces and cities where the village is located was selected as the control variable. The main variables involved in this paper and their descriptive statistics are shown in Table 1.

3.3. Comprehensive Index of Transportation Infrastructure Accessibility

The entropy method is an objective weighting method suitable for calculating comprehensive evaluation indicators [38,39]. The greater the relative change and dispersion of specific indicators, the greater the impact on the research object, the greater the information entropy, and the closer the weight value is to 1; otherwise, it tends toward 0. Based on the above ideas, this study comprehensively considers the indicators of rural transportation infrastructure, including r o a d , b u s t o p , s l a m p , and h a r o a d , to calculate the comprehensive accessibility of rural transportation infrastructure ( a c c e s s ). The above specific indicators were standardized, and the weight of each traffic infrastructure accessibility indicator was calculated. All indicators used in this paper are positive indicators. According to the weighted calculation of the standardized values of each index, a comprehensive score of the accessibility of transportation infrastructure can be obtained.

3.4. Econometric Models

Firstly, the panel Logit model is used to discuss the impact of the accessibility of transportation infrastructure on the non-agricultural employment choices of rural residents, and the following basic model is set:
o f a r m i t = α 0 + α 1 t r a f f i c i t + X i t β + f i + ε i t
In Equation (1), the explained variable o f a r m i t is whether rural residents are employed in non-agricultural areas, and t r a f f i c i t is the accessibility of transportation infrastructure, including the comprehensive indicator a c c e s s i t of the accessibility of transportation infrastructure and the sub-indicators r o a d i t , b u s t o p i t , s l a m p i t , and h a r o a d i t . X i t is the vector of other control variables at individual, family, village, and regional levels. f i is the individual fixed effect, α 0 is the intercept term, α i is the coefficient of the corresponding variable, and ε i t is the error term.
Based on rural residents choosing non-agricultural employment, this paper further discusses the impact of transportation infrastructure on the employment location of rural residents. Since the explained variables are multi-classified ordered variables, the ordered Logit model is adopted as follows:
w o r k p l a c e i t * = α 0 + α 1 t r a f f i c i t + X i t β + f i + ε i t
In Equation (2), w o r k p l a c e i t * is the latent variable of the non-agricultural employment location of the villagers, so the selection criteria of the explained variable are as follows:
w o r k p l a c e i t = { 1 ,   w o r k p l a c e i t * < δ 1 2 ,   δ 1 w o r k p l a c e i t * < δ 2 3 ,   δ 2 w o r k p l a c e i t * < δ 3 4 ,     δ 3 w o r k p l a c e i t * < δ 4 5 ,     δ 4 w o r k p l a c e i t *
In Equation (3), w o r k p l a c e i t is the non-agricultural employment location of the i rural laborers in year t . The quantity assignment is defined as follows: 1 = their own village, 2 = other villages in their own township, 3 = other townships in the county/district (excluding county/ district city), 4 = county/district city, and 5 = outside the county/ district. δ 1 , δ 2 , δ 3 , δ 4 , and δ 5 are estimated by the model.
Finally, this study uses a panel Logit model to examine the impact of the transportation infrastructure on non-agricultural employment. The explained variable is rural non-farm economy (binary variable: 0 = no; 1 = yes). The explanatory variables include the comprehensive indicator a c c e s s i t of the accessibility of transportation infrastructure and the sub-indicators r o a d i t , b u s t o p i t , s l a m p i t , and h a r o a d i t .

4. Results and Analysis

4.1. Comprehensive Measurement of Accessibility of Transportation Infrastructure

The entropy method was used to calculate the weight of each indicator and the comprehensive accessibility of transportation infrastructure. The results are shown in Table 2. Due to differences in the samples used to study whether a rural laborer is employed in non-agricultural employment and where non-agricultural employment is located, the weights of each indicator and comprehensive scores of transportation infrastructure accessibility were calculated separately for the two studies. It can be seen from the table that public transportation and streetlights in rural areas have a greater impact on the comprehensive accessibility of transportation infrastructure. The order of importance is b u s t o p > s l a m p > h a r o a d > r o a d . The comprehensive accessibility of transportation infrastructure varies greatly among rural laborers, with a difference of nearly 143 times between the maximum and minimum values.

4.2. Regression Results

The regression results are presented in Table 3, mainly including the impact of transportation infrastructure accessibility on rural laborers’ non-agricultural employment (Columns 1–2) and non-agricultural work locations (Columns 3–4). Column 1 estimates the impact of transportation infrastructure accessibility on the off-farm employment of rural laborers. It is not difficult to see that the greater the accessibility of transportation infrastructure, the more willing rural laborers are to take non-agricultural employment. Column 2 shows the impact of specific village transportation infrastructure. A road having streetlights and road hardening are positively correlated with rural laborers’ non-agricultural employment, and it is significant at 1%. From Column 3, it can be seen that there is a negative correlation between the accessibility of transportation infrastructure and the choice of rural laborers’ non-agricultural employment location. The higher the accessibility of transportation infrastructure, the closer the non-agricultural employment location selected by rural laborers. Different from the possible conclusions of general research, this study concludes that the accessibility of transportation infrastructure has a highly significant inhibitory effect on the long-distance non-agricultural employment of rural residents. This may be because the development of transportation infrastructure not only promotes the non-agricultural employment of rural laborers, but also promotes the development of the non-agricultural economy in rural areas. Rural residents can obtain non-agricultural employment without leaving home, which needs to be further verified. A similar conclusion is obtained based on Column 4. Rural roads promote the off-farm employment of rural laborers away from home, while streetlights and road hardening in the village promote rural laborers with off-farm work in nearby locations. Overall, the estimated results preliminarily prove that the accessibility of transportation infrastructure has a significant impact on rural laborers’ non-agricultural employment choices. The measurement results of Columns 1 and 2 are basically the same in terms of coefficient value, direction, and significance. The measurement results of Columns 3 and 4 are also similar, which shows the robustness of the model used.
Table 3 also reflects the impact of other control variables on the choice of non-agricultural employment of rural laborers. Most of the estimated coefficients are in line with the economic explanation. For example, the age of rural laborers is negatively correlated with non-agricultural employment at the 1% level; that is, the older the age, the less likely farmers are to be employed in non-agricultural jobs, and the more likely they are to work nearby their own villages. Similar conclusions have been drawn in terms of gender of rural laborers. Compared with women, men are more likely to participate in non-agricultural employment, and possibly out of household chores, women are more inclined to non-agricultural employment within their own townships. The rural laborers with higher education levels are also more likely to participate in non-agricultural employment. Health level, family dependency ratio, rural location and economic level are also important factors affecting the choice of non-agricultural employment of rural laborers.

4.3. Heterogeneity Analysis

We further analyzed the differential impact of transportation infrastructure accessibility on the off-farm employment choices of heterogeneous rural laborers. On the one hand, the more minors and elderly members there are that need to be taken care of, the more restrictive the off-farm employment of family laborers is [40], and laborers face the opportunity cost of a declining labor participation rate and income loss due to this family support [41]. As the main bearers of family care and housework, rural women face more difficult pressures and conflicts between family and work [7]. On the other hand, terrain affects the input and output of agricultural production. Areas with higher slopes require more costs and labor in irrigation and machinery use. This input–output difference caused by differences in terrain conditions further expands with the non-agricultural employment of laborers [42]. Therefore, we discuss the heterogeneity of the impact of transportation infrastructure accessibility on non-agricultural employment choices from the perspective of laborer gender, the family dependency ratio, and rural terrain.

4.3.1. Gender

Table 4 shows the impact of transportation infrastructure accessibility on off-farm employment choices for farmers of different genders. Although the accessibility of transportation infrastructure significantly promotes off-farm employment and nearby employment for both female and male laborers, female laborers are more sensitive to the accessibility of transportation infrastructure. The possible reason is that male laborers are more often migrant workers, and female laborers are more reluctant to be in non-agricultural employment because of housework and care tasks. When the accessibility of transportation infrastructure is high, female laborers can still take care of the family after they work, so the non-agricultural employment potential of female laborers is greater.

4.3.2. Family Dependency Ratio

We arranged the family dependency ratio from small to large and divided it into three equal parts: low, medium, and high. According to Table 5, the promotion effect of the accessibility of transportation infrastructure on non-agricultural employment is largest for laborers with a medium family dependency ratio. Farmers with a high family dependency ratio are more sensitive to the accessibility of transportation infrastructure than farmers with a low family dependency ratio. The higher the family dependency ratio, the more significant the impact on laborers’ choices of non-agricultural employment location. This is because the higher the family dependency ratio, the heavier the economic burden on farmers. Laborers not only need to take care of their families, but also need more money. The accessibility of transportation infrastructure has increased the willingness of laborers to participate in non-agricultural employment in nearby locations.

4.3.3. Terrain

Table 6 shows the impact of transportation infrastructure accessibility on the off-farm employment choices of rural laborers in different terrains. The data show that the greater the terrain slope, the greater the effect of the accessibility of transportation infrastructure on the possibility of non-agricultural employment. Rural laborers in mountainous areas are more sensitive to the accessibility of transportation infrastructure than rural laborers in plains and hills. Rural laborers in hilly areas are more sensitive to the accessibility of transportation infrastructure than rural laborers in plains. The steep terrain has led to difficulties in the development of agriculture and the non-agricultural economy. Improving the accessibility of transportation infrastructure has facilitated farmers’ non-agricultural employment outside mountain areas. In addition, in the process of transportation infrastructure development, the plain and hilly terrain promotes the local non-agricultural employment of rural laborers, and the mountainous terrain promotes the outflow of rural laborers. This may be due to the fact that areas with gentler slopes are more likely to develop a non-agricultural economy with the help of transportation infrastructure construction, which provides a foundation for rural laborers to find nearby non-agricultural employment.

4.4. Impact Path Analysis

According to theoretical analysis and empirical results, the study focuses on the path of “the accessibility of transportation infrastructure affects rural [laborers’] non-agricultural employment by promoting rural non-agricultural economic development.” The results are shown in Table 7. Taking the rural non-agricultural economy of the village as the explained variable, Columns 1 and 2 present the impact of the comprehensive accessibility of transportation infrastructure on the development of the rural non-agricultural economy. Regardless of whether control variables are added or not, the regression finds that high accessibility of transportation infrastructure has a positive impact on rural non-agricultural economic development, and it is significant at the 1% level. Columns 3 and 4 reflect the impact of specific transportation infrastructure indicators on rural non-agricultural economic development. The results show that the road outside the village is negatively correlated with the development of the rural non-agricultural economy, which may be due to multicollinearity, but the construction of transportation infrastructure in the village will promote the development of the rural non-agricultural economy. Overall, the results support the view that improving the accessibility of transportation infrastructure can promote the development of that economy; that is, it is shown that “the accessibility of transportation infrastructure affects rural [laborers’] non-agricultural employment by promoting rural non-agricultural economic development.”

5. Conclusions and Discussion

Based on the panel data at the provincial level and the micro individual level, this paper empirically analyzes the impact of the accessibility of transportation infrastructure on the non-agricultural employment choices of rural laborers by using the entropy method and an ordered Logit model. This study shows that the accessibility of transportation infrastructure, especially streetlights and road hardening in the village, can promote the non-agricultural employment of rural laborers and is positively correlated with the nearby employment of rural laborers, which can inhibit the long-distance and cross-regional employment choices of laborers. Further heterogeneity analysis shows that female laborers are more sensitive to the accessibility of transportation infrastructure. Farmers with a higher family dependency ratio are more vulnerable to the impact of transportation infrastructure due to family care and are more inclined to take non-agricultural employment in nearby locations. The accessibility of transportation infrastructure has a greater impact on farmers in mountainous areas, promoting their non-agricultural employment far away from their homes. The accessibility of transportation infrastructure reduces transportation and transaction costs, and the path analysis confirms that the construction of transportation infrastructure promotes the development of the non-agricultural economy in rural areas and provides support for farmers who choose “leaving the land without leaving the hometown.”
China’s agriculture is still in a state of insufficient modernization, with surplus laborers and low incomes. In order to change this situation, we should firmly promote the high-quality development of the Four Good Rural Roads. The spatial spillover effect of rural transportation infrastructure on agricultural growth can be used to promote the increase of farmers’ incomes and the non-agricultural transfer of surplus laborers. At the same time, we should pay attention to the rights of women and problems of old and young people in rural areas being left behind, improve and upgrade the road network system, attract and promote industries to settle in rural areas, especially in mountainous areas with large slopes, ensure that there are industries in rural areas, and enable rural laborers who choose non-agricultural employment to choose “leaving the land without leaving the hometown.” For rural laborers who choose “leaving the land and the hometown,” efforts should be made to reduce the time and space cost between urban and rural areas, ensure the living conditions of migrant farmers in cities, and effectively improve their sense of security and happiness. Finally, institutional reform and a layout of urban–rural transportation integration can improve the rural health and education system, promote the development of the logistics system, and contribute to the creation of beautiful, livable villages.

Author Contributions

Conceptualization, Q.H., X.Z. and R.W.; methodology, Q.H.; software, Q.H.; formal analysis, Q.H.; resources, Q.H.; data curation, Q.H.; writing—original draft preparation, Q.H.; writing—review and editing, X.Z. and R.W.; visualization, Q.H.; supervision, X.Z. and R.W.; project administration, X.Z. and R.W. All authors have read and agreed to the published version of the manuscript.

Funding

This research was funded by the Beijing Natural Science Foundation of China (No. 9212011), the Beijing Social Science Foundation of China (No. 21JCC099), and the Youth Fund for Humanities and Social Sciences Research of the Ministry of Education of China (No. 19YJC630231).

Institutional Review Board Statement

Not applicable.

Informed Consent Statement

Not applicable.

Data Availability Statement

The data presented in this study are available from the first author on request.

Conflicts of Interest

The authors declare that there is no conflict of interest.

References

  1. Cai, F. Has China’s mobility exhausted its momentum? Chin. Rural Econ. 2018, 34, 2–13. [Google Scholar]
  2. Qiu, T.; Luo, B. Does land reallocation negatively affect rural labor migration to non-agricultural sectors? China Rural Surv. 2017, 38, 57–71. [Google Scholar]
  3. Zhu, J.; Zhang, L. Can farmland right confirmation enhance the willingness of rural laborers to be migrant workers? An empirical analysis based on China Labor Force Dynamic Survey. Contemp. Econ. Manage. 2019, 41, 30–36. [Google Scholar]
  4. Jia, L.; Petrick, M. How does land fragmentation affect off-farm labor supply: Panel data evidence from China. Agric. Econ. 2014, 45, 369–380. [Google Scholar] [CrossRef] [Green Version]
  5. Ma, S.; Mu, R. Forced off the farm? Farmers’ labor allocation response to land requisition in China. World Dev. 2020, 132, 104980. [Google Scholar] [CrossRef]
  6. Mao, S.; Connelly, R.; Chen, X. Stuck in the middle: Off-Farm employment and caregiving among middle-aged rural Chinese. Fem. Econ. 2018, 24, 100–121. [Google Scholar] [CrossRef] [Green Version]
  7. Fan, H.; Xin, B. Elderly care and rural women’s non-farm employment in China: Micro data evidence from China. Chin. Rural Econ. 2019, 35, 98–114. [Google Scholar]
  8. Zhang, H.; Luo, Y. Research on the effect of poverty alleviation through relocation on employment: From the perspective of labor transfer and employment quality. Chin. J. Popul. Sci. 2021, 35, 13–25+126. [Google Scholar]
  9. Zheng, X.; Lin, Q. The impact of the development of production outsourcing services on the allocation of rural labor—Based on the perspective of farm household heterogeneity. J. Agrotechnical Econ. 2021, 40, 101–114. [Google Scholar] [CrossRef]
  10. Chen, J.; Chen, Y.; Luo, M. Impact of agricultural machinery application on rural labor transfer: An analysis based on CLDS data. J. Agro-For. Econ. Manag. 2021, 20, 326–336. [Google Scholar]
  11. Zhang, H.; Zhang, L.; Luo, R.; Li, Q. Does education still pay off in rural China: Revisit the impact of education on off-farm employment and wages. China World Econ. 2008, 16, 50–65. [Google Scholar] [CrossRef]
  12. Zhang, J.; Zhu, J. Using the Internet and degree of rural labor transfer—Research of the influence on family division. Financ. Econ. 2020, 64, 93–105. [Google Scholar]
  13. Lokshin, M.; Yemtsov, R. Has rural infrastructure rehabilitation in Georgia helped the poor? World Bank Econ. Rev. 2005, 19, 311–333. [Google Scholar] [CrossRef] [Green Version]
  14. Khandker, S.R.; Bakht, Z.; Koolwal, G.B. The poverty impact of rural roads: Evidence from Bangladesh. Econ. Dev. Cult. Chang. 2009, 57, 685–722. [Google Scholar] [CrossRef] [Green Version]
  15. Winters, P.; Davis, B.; Carletto, G.; Covarrubias, K.; Quiñones, E.J.; Zezza, A.; Azzarri, C.; Stamoulis, K. Assets, Activities and rural income generation: Evidence from a multicountry analysis. World Dev. 2009, 37, 1435–1452. [Google Scholar] [CrossRef]
  16. Bai, Y.; Zhou, T.; Ma, Z.; Zhang, L. Does road accessibility benefit rural poor? Evidence on the extent of household off-farm employment from 2004 to 2018. China Agric. Econ. Rev. 2021, 13, 639–672. [Google Scholar] [CrossRef]
  17. Mottaleb, K.A.; Rahut, D.B. Impacts of improved infrastructure on labor allocation and livelihoods: The case of the Jamuna Multipurpose Bridge, Bangladesh. Eur. J. Dev. Res. 2019, 31, 750–778. [Google Scholar] [CrossRef]
  18. Deng, M.; Luo, R.; Zhang, L. Road infrastructure construction and non-agricultural employment of rural labor force -- Based on a survey of 2000 farmers in five provinces. J. Agrotechnical Econ. 2011, 30, 4–11. [Google Scholar] [CrossRef]
  19. Gibson, J.; Olivia, S. The effect of infrastructure access and quality on non-farm enterprises in rural Indonesia. World Dev. 2010, 38, 717–726. [Google Scholar] [CrossRef] [Green Version]
  20. Luo, R.; Zhang, L.; Wang, X.; Qiao, F.; Sylvia, S. Highway and off-farm participation in rural China. Econ. Surv. 2013, 4, 44–48. [Google Scholar]
  21. Asher, S.; Novosad, P. Rural roads and local economic development. Am. Econ. Rev. 2020, 110, 797–823. [Google Scholar] [CrossRef] [Green Version]
  22. Luo, Y.; Luo, X.; Wang, L. Rural infrastructure, labor productivity gap between industry and agriculture, and non-agricultural employment. Manag. World 2020, 36, 91–121. [Google Scholar]
  23. Zhang, J.; Li, R.; Yu, H. Transportation information improvement, transfer of agricultural labor force and structural transformation. Chin. Rural Econ. 2021, 37, 28–43. [Google Scholar]
  24. Zhang, K.; Deng, X.; Shen, Q.; Qi, Y. Agricultural technological progress, rural labor transfer and farmers’ income—An analysis of grouping PVAR model based on agricultural labor productivity. J. Agrotechnical Econ. 2017, 36, 28–41. [Google Scholar] [CrossRef]
  25. Wang, Z.; Sun, S. Transportation infrastructure and rural development in China. China Agric. Econ. Rev. 2016, 8, 516–525. [Google Scholar] [CrossRef]
  26. Luo, S.; He, K.; Zhang, J. Can road constructure promote agricultural growth? An analysis based on the perspective of cross-regional operation of agricultural machinery. Chin. Rural Econ. 2018, 34, 67–83. [Google Scholar]
  27. Tong, T.; Yu, T.H.E.; Cho, S.H.; Jensen, K.; Ugarte, D.D.L.T. Evaluating the spatial spillover effects of transportation infrastructure on agricultural output across the United States. J. Transp. Geogr. 2013, 30, 47–55. [Google Scholar] [CrossRef]
  28. Zhou, J.; Chen, Y.; Ruan, D. The influence of topographic conditions on the regional imbalance of agricultural mechanization development—An empirical analysis based on the county-level panel data of Hubei province. Chin. Rural Econ. 2013, 29, 63–77. [Google Scholar]
  29. Chankrajang, T.; Vechbanyongratana, J. Canals and orchards: The impact of transport network access on agricultural productivity in nineteenth-century Bangkok. J. Econ. Hist. 2020, 80, 996–1030. [Google Scholar] [CrossRef]
  30. Kiprono, P.; Matsumoto, T. Roads and farming: The effect of infrastructure improvement on agricultural intensification in South-Western Kenya. Agrekon 2018, 57, 198–220. [Google Scholar] [CrossRef]
  31. Chen, Z.; Cui, R.; Zhou, T.; Liu, H.; Luo, J. Relationship of coupling coordination between transportation and agricultural modernization in Hebei province. Econ. Geogr. 2020, 40, 152–159. [Google Scholar]
  32. Hong, W.; Luo, B. Farmland reallocation, intertemporal constraint and labor migration. Acad. Res. 2020, 63, 84–92. [Google Scholar]
  33. Liu, C.; Liu, C.; Sun, T. Transportation infrastructure, financial constraint and county industry development: Evidence from China’s national trunk highway system. Manag. World 2019, 35, 78–88+203. [Google Scholar]
  34. Zhou, H.; Hu, H.; Xie, C. Transportation infrastructure, industrial layout and regional income -- A spatial econometric analysis based on China’s provincial panel data. Inq. Econ. Iss. 2018, 39, 1–11. [Google Scholar]
  35. Deng, T.; Wang, D.; Wu, D. Transport infrastructure, spatial spillover and manufacturing industry agglomeration—Panel data analysis based on Chinese provincial sub-sectors. Reg. Econ. Rev. 2017, 33, 33–40. [Google Scholar]
  36. Zhou, H.; Hu, H.; Xie, C.; Dai, Y. Regional resource misallocation and transportation infrastructure: Empirical evidence from China. Ind. Econ. Res. 2017, 16, 100–113. [Google Scholar]
  37. Guo, J. Research on rural poverty reduction effect of traffic infrastructure. Guizhou Agric. Sci. 2013, 41, 213–217. [Google Scholar]
  38. Lv, K.; Li, C.; Zhang, C. Analysis of regional agricultural insurance development level based on principal component analysis and entropy method—Data from China’s provincial level from 2008 to 2013. J. Agrotech. Econ. 2016, 35, 4–15. [Google Scholar] [CrossRef]
  39. Zhao, H.; Yu, F. Evaluation of agricultural green development level in main grain producing areas based on entropy method. Reform 2019, 32, 136–146. [Google Scholar]
  40. Lu, W.; Wu, L. Non-agricultural employment behavior of part-time farmers and its gender differences. Chin. Rural Econ. 2011, 27, 54–62+81. [Google Scholar]
  41. Fast, J.E.; Williamson, D.L.; Keating, N.C. The hidden costs of informal elder care. J. Fam. Econ. Issues 1999, 20, 301–326. [Google Scholar] [CrossRef]
  42. Li, Q.; Yang, Z. The impact of off-farm employment of rural labor on planting decisions—A study perspective based on land topography. Chin. J. Agric. Resour. Reg. Plan. 2020, 41, 186–192. [Google Scholar]
Figure 1. The influence mechanism of the accessibility of transportation infrastructure on non-agricultural employment.
Land 11 00896 g001
Figure 2. Transportation infrastructure construction and non-agricultural employment of rural residents. Note: The total highway mileage data come from the 2019 China Traffic Yearbook, and the total migrant worker data come from the 2013 and 2020 national migrant worker monitoring and investigation report of the National Bureau of Statistics. The horizontal axis in the figure is the year.
Land 11 00896 g002
Table 1. Descriptive statistics of variables.
Variable NameVariable MeaningMeanMinimumMaximumStd. Dev.
o f a r m Whether non-agricultural employment was chosen0.324010.468
w o r k p l a c e Location of non-agricultural employment1.499151.122
r o a d Outside villagesIs there a road?0.972010.165
b u s t o p Is there a bus stop?0.321010.467
s l a m p In villagesAre there streetlights on all roads?0.368010.482
h a r o a d Proportion of hardened pavement0.618010.293
a g e Age48.024159612.973
g e n d e r Gender0.470010.499
e d u c a t i o n Education level2.510150.985
m a r r i a g e Marriage0.903010.296
h e a l t h Health2.474151.000
f m s i z e Family size5.8271313.064
r a r a t e Family dependency ratio0.218010.209
l a n d Total area of agricultural land (thousand mu)6.6350176.80013.554
d c i g o v Distance between the village and the nearest county/district government (km)26.2770115.00021.917
d v i g o v Distance between the village and the nearest township government/street (km)7.2960500.00029.017
s u b u r b s Is it a suburb of a large or medium-sized city?0.090010.286
r o g o v Is it the location of the township government?0.143010.350
t e r r a i n Terrain1.770130.841
G D P Provincial per capita GDP (10000 yuan)4.6952.31510.7961.709
Note: Calculated based on CLDS data in 2014 and 2016.
Table 2. Indicator weight and comprehensive accessibility level of transportation infrastructure.
Weight of Transportation Infrastructure IndicatorsComprehensive Accessibility of Transportation Infrastructure
R o a d B u s t o p S l a m p H a r o a d MeanStd. Dev.MinimumMaximum
o f a r m 0.0190.5240.4010.0560.3670.3630.0071.000
w o r k p l a c e 0.0270.5410.3790.0530.5200.3780.0081.000
Note: Calculated based on CLDS data in 2014 and 2016.
Table 3. Ordered Logit regression results.
Non−Farm EmploymentLocation of Non−Farm Employment
(1)(2)(3)(4)
a c c e s s 1.084 ***
(0.146)
−0.412 ***
(0.101)
r o a d −0.080
(0.276)
0.537 **
(0.207)
b u s t o p 0.088
(0.098)
−0.095
(0.073)
s l a m p 0.898 ***
(0.105)
−0.263 ***
(0.073)
h a r o a d 0.651 ***
(0.149)
−0.748 ***
(0.145)
a g e −0.124 ***
(0.008)
−0.123 ***
(0.008)
−0.046 ***
(0.003)
−0.045 ***
(0.003)
g e n d e r −0.943 ***
(0.101)
−0.938 ***
(0.098)
−0.488 ***
(0.064)
−0.486 ***
(0.064)
e d u c a t i o n 0.872 ***
(0.070)
0.830 ***
(0.067)
0.002
(0.034)
0.004
(0.035)
m a r r i a g e −0.084
(0.161)
−0.056
(0.156)
−0.154
(0.097)
−0.181 *
(0.098)
h e a l t h −0.274 ***
(0.047)
−0.260 ***
(0.045)
0.055
(0.038)
0.047
(0.038)
f m s i z e −0.024
(0.016)
−0.023
(0.015)
0.015
(0.010)
0.014
(0.010)
r a r a t e −0.424 *
(0.228)
−0.372 *
(0.221)
−0.051
(0.163)
−0.054
(0.164)
l a n d −0.019 ***
(0.005)
−0.018 ***
(0.005)
0.0003
(0.005)
0.001
(0.006)
d c i g o v −0.036 ***
(0.003)
−0.034 ***
(0.003)
−0.008 ***
(0.003)
−0.009 ***
(0.003)
d v i g o v 0.006 ***
(0.001)
0.005 ***
(0.001)
−0.002 *
(0.001)
−0.002
(0.001)
s u b u r b s 0.784 ***
(0.154)
0.738 ***
(0.151)
−0.161 *
(0.090)
−0.203 **
(0.092)
r o g o v 0.093
(0.126)
−0.022
(0.124)
−0.499 ***
(0.093)
−0.436 ***
(0.096)
t e r r a i n 0.227 ***
(0.065)
0.218 ***
(0.064)
0.050
(0.054)
0.052
(0.054)
GDP0.630 **
(0.268)
0.617 **
(0.267)
−0.358
(0.226)
−0.466 **
(0.231)
TimeControlled
AreaControlled
Wald chi2332.280353.610726.730770.500
Prob > chi20.0000.0000.0000.000
Sample size12,02712,02738993899
Note: The values in brackets are robust standard errors, *, **, and ***, respectively, indicate significant at the levels of 10%, 5%, and 1%. Calculated based on CLDS data in 2014 and 2016.
Table 4. Gender heterogeneity analysis.
GenderFemaleMale
Non−Farm EmploymentLocation of Non−Farm EmploymentNon−Farm EmploymentLocation of Non−Farm Employment
a c c e s s 1.368 ***
(0.264)
−0.324 **
(0.163)
0.950 ***
(0.178)
−0.499 ***
(0.131)
Other variablesControlled
TimeControlled
AreaControlled
Wald chi290.080457.410239.270461.660
Prob > chi20.0000.0000.0000.000
Sample size5621153963702360
Note: The values in brackets are robust standard errors, **, and ***, respectively, indicate significant at the levels of 5%, and 1%. Calculated based on CLDS data in 2014 and 2016.
Table 5. Family dependency ratio heterogeneity analysis.
Family Dependency RatioLowMediumHigh
Non−Farm EmploymentLocation of Non−Farm EmploymentNon−Farm EmploymentLocation of Non−Farm EmploymentNon−Farm EmploymentLocation of Non−Farm Employment
a c c e s s 0.751 ***
(0.248)
−0.345 *
(0.185)
1.787 ***
(0.355)
−0.455 **
(0.181)
1.154 ***
(0.245)
−0.496 ***
(0.171)
Other variablesControlled
TimeControlled
AreaControlled
Wald chi292.700427.01066.610322.750106.640602.770
Prob > chi20.0000.0000.0030.0000.0000.000
Sample size404713054096129538491299
Note: The values in brackets are robust standard errors, *, **, and ***, respectively, indicate significant at the levels of 10%, 5%, and 1%. Calculated based on CLDS data in 2014 and 2016.
Table 6. Terrain heterogeneity analysis.
TerrainPlainHillMountain Areas
Non−Farm EmploymentLocation of Non−Farm EmploymentNon−Farm EmploymentLocation of Non−Farm EmploymentNon−Farm EmploymentLocation of Non−Farm Employment
a c c e s s 0.629 ***
(0.181)
−1.003 ***
(0.149)
1.067 **
(0.488)
−0.240
(0.285)
1.760 ***
(0.343)
1.161 **
(0.518)
Other variablesControlled
TimeControlled
AreaControlled
Wald chi2188.170632.22039.730223.13083.530202.220
Prob > chi20.0000.0000.2300.0000.0000.000
Sample size59572043287811903177666
Note: The values in brackets are robust standard errors, **, and ***, respectively, indicate significant at the levels of 5%, and 1%. Calculated based on CLDS data in 2014 and 2016.
Table 7. Path analysis.
Rural Non−Farm Economy
(1)(2)(3)(4)
a c c e s s 2.209 ***
(0.550)
1.528 ***
(0.551)
r o a d −0.743
(0.840)
−1.939 *
(1.007)
b u s t o p 0.836 **
(0.352)
0.332
(0.442)
s l a m p 0.920 ***
(0.335)
0.844 **
(0.349)
h a r o a d 0.984 *
(0.585)
1.005 *
(0.604)
Other variablesNoYesNoYes
TimeNoYesNoYes
AreaNoYesNoYes
Wald chi216.15025.75018.46027.340
Prob > chi20.0000.5330.0010.605
Sample size329304329304
Note: The values in brackets are robust standard errors, *, **, and ***, respectively, indicate significant at the levels of 10%, 5%, and 1%. Calculated based on CLDS data in 2014 and 2016.
Publisher’s Note: MDPI stays neutral with regard to jurisdictional claims in published maps and institutional affiliations.

