Article

Land Use Multi-Functionality and Zoning Governance Strategy of Densely Populated Areas in the Upper Reaches of the Yellow River: A Case Study of the Lanzhou–Xining Region, China

1
College of Resources and Environment, Gansu Agricultural University, Lanzhou 730070, China
2
Gansu Key Laboratory of Resource Environment and Sustainable Development of Oasis, Lanzhou 730070, China
3
College of Geography and Environment Science, Northwest Normal University, Lanzhou 730070, China
*
Author to whom correspondence should be addressed.
Land 2022, 11(6), 897; https://doi.org/10.3390/land11060897
Submission received: 10 May 2022 / Revised: 4 June 2022 / Accepted: 10 June 2022 / Published: 12 June 2022
(This article belongs to the Section Urban Contexts and Urban-Rural Interactions)

Abstract

:
With rapid urbanization, the interactions between human and land are becoming more and more intense, which leads to increasingly diversified land use and intensifies the conflicts among land use functions (LUFs). However, land use multi-functionality (LUMF) of densely populated areas (DPAs) in less developed regions has not been studied in depth. The objective of our study is to build a multi-functional conceptual framework for land use, and establish a comprehensive evaluation indicator system to assess LUMF. We took the Lanzhou–Xining Region (LXR) as a case area, which is a DPA in the upper reaches of the Yellow River. We established 36 indicators from the dimensions of status and trend of agricultural, economic, social, and ecological functions, to perform analysis on the LUMF using the entropy weight method (EWM) and the coupling degree method (CDM). The results show that land use in the LXR is multi-functional, that LUFs are developing in an uneven manner, and that the spatial distribution of LUFs differs greatly. We find that the multi-functional level of land use in the LXR is low. There are no dominant functions in 12 counties and districts. There are spatial conflicts among LUFs. To maintain sustainable land use, we proposed a functional zoning scheme and put forward corresponding governance strategies.

1. Introduction

Densely populated areas (DPAs) in less developed regions are urban–rural fringe areas, which have multiple land use characteristics of both urban and rural areas. From the rural perspective, DPAs are the invaded countryside [1], while from the urban perspective, DPAs provide resources and reserve land for urban development [2]. This has reflected the multiple attributes of land use in DPAs in less developed regions.
Land use functions (LUFs) refer to the private and public products and services that the land provides to human [3,4,5]. Due to scarcity of land resources, complexity of distribution, multi-dimensionality of utilization and diversified of human needs, land use presents multi-functionality. Land use multi-functionality (LUMF) is generally indicated by LUFs, and describes how land use can provide diverse goods and services to satisfy human diversified demands with limited land resource through multifunctional land use [3,4,6,7]. Moreover, clarifying LUFs is a prerequisite for coordinating regional land use and optimizing the spatial layout of land use [8,9,10,11]. On the aspect of regional spatial governance, land use functional zoning based on multi-functional analysis also arouses great interest of governments and planners.
The classification of LUFs is the foundation for the study of LUMF [12]. The concept of multi-functional land use originates from agricultural study, which refers to the multi-functional agriculture (MFA) based on agricultural production functions [13]. The establishment and development of multi-functional agriculture is generally rooted in rural areas and is closely related to agricultural land [14,15]. Therefore, the study on multi-functionality of land use in agriculture mostly focused on rural areas, plains, and commercial grain bases [16,17,18,19]. The ecosystem service function classification system is established in the Millennium Ecosystem Assessment, providing a reference for the classification of ecological functions [20,21]. Such classification is associated with specific types of land use and is mostly used to assess LUMF in ecologically fragile or ecologically important areas [22,23,24]. In the context of carbon neutrality becoming a widespread global consensus, assessment of ecological functions has become the focus of LUMF.
To keep a balance between the three dimensions of sustainable development [25,26], scholars have classified LUFs into economic, social, and environmental (ecological) functions [27,28,29,30,31]. In 2012, the coordinated development strategy of “production-living-ecological space” was proposed in the construction strategy of Beautiful China, which has attracted much attention from the government, scholars, and planners [32], and the evaluation of multi-functionality of land use from the perspective of “production, living and ecology” has further enriched the classification of land functions [33,34,35,36].
The classification of LUFs has been widely discussed. Due to the complexity and diversity of land resources and land use, different scholars perform studies from different perspectives, and the identification and classification of LUFs also differ greatly [37]. The existing studies on LUFs focus on the following two aspects. One of these two aspects is on the evaluation of a single LUF which is associated with a specific land use type, such as the multi-functionality of arable land in agricultural areas, agricultural multi-functionality, and ecological service functions in ecologically fragile areas. Such studies focus on the dominant functions in typical regions [7,14,15,17,20,38,39]. However, the identification of dominant functions in less developed regions with mixed land use characteristics is insufficient. Second, an indicator system is established, to evaluate the multi-functionality of the urban and rural land. The study on the urban multi-functionality is mostly linked to the functional zoning of urban land in the built-up area of the city. Great emphasis is placed on rapidly urbanizing areas, such as megacities, metropolitan areas, and urban agglomerations [23,40,41,42]. Rural multi-functionality is mostly associated with agricultural multi-functionality, focusing on rural multi-functional patterns, processes, mechanisms, and transformations in national, provincial, and economically developed regions [43,44,45]. Due to large differences in the land use between urban and rural regions, the existing studies of multi-functionality in urban and rural areas are established as two independent indicator systems. There is few report on land multi-functionality in DPAs of less developed regions.
The land use type is an explicit expression of LUF, and the LUF pattern also includes many implicit features [12]. With the LUF study shifting from single-function assessment to multi-functional assessment, it is necessary to establish a multi-factor indicator system to reflect the multi-functionality of land use. Social, economic, and environmental factors not only affect the functional level of land use [4,10,14,16,25,34,46,47], but also affect land use efficiency with their changing trends [48,49], leading to a fluctuation in LUFs, which in turn affects the transformation and upgrading of LUFs. Most of the multi-factor indicator systems that have been established are status indicator systems, and few studies have incorporated trend indicators into the indicator system to reflect the influence of the change trend of each indicator on the LUFs. Most studies have evaluated the trade-offs and synergies between LUFs, and proposed functional zoning and management strategies based on the similarities and differences of land use sub-functions [50,51]. However, zoning is not a simple clustering process, but a result of multi-objective optimization of various types of functions [52]. Zoning methods that comprehensively consider the dominant LUFs, the integrated level of LUFs, and the degree of coupling of land use sub-functions are not yet available in the existing functional zoning studies.
Rapid urbanization, industrialization, and population growth in China have led to rapid changes in land use, with LUFs varying from one to another [53,54]. LUFs can be integrated and symbiotic and can also create conflicts and contradictions [18]. The study of LUMF aims at ensuring sustainable land use, which is the basis for the decision-making of urban–rural co-governance. However, relevant studies pay less attention to DPAs in less developed regions. What are the characteristics of land use in DPAs? Whether the land use in less developed regions has multi-functional characteristics is a question worth discussing.
In response to the above shortcomings, the paper’s key objectives are as follows:
(1)
To construct a conceptual framework for LUMF in DPAs in less developed region;
(2)
To establish a comprehensive evaluation indicator system for evaluation of land use multi-functionality;
(3)
To reveal the functional level of land use and its spatial differentiation characteristics, and perform coupling analysis on LUFs;
(4)
To put forward an improved method for identifying dominant functions of all counties (districts) in the study area;
(5)
To propose land use function schemes and corresponding governance strategies.

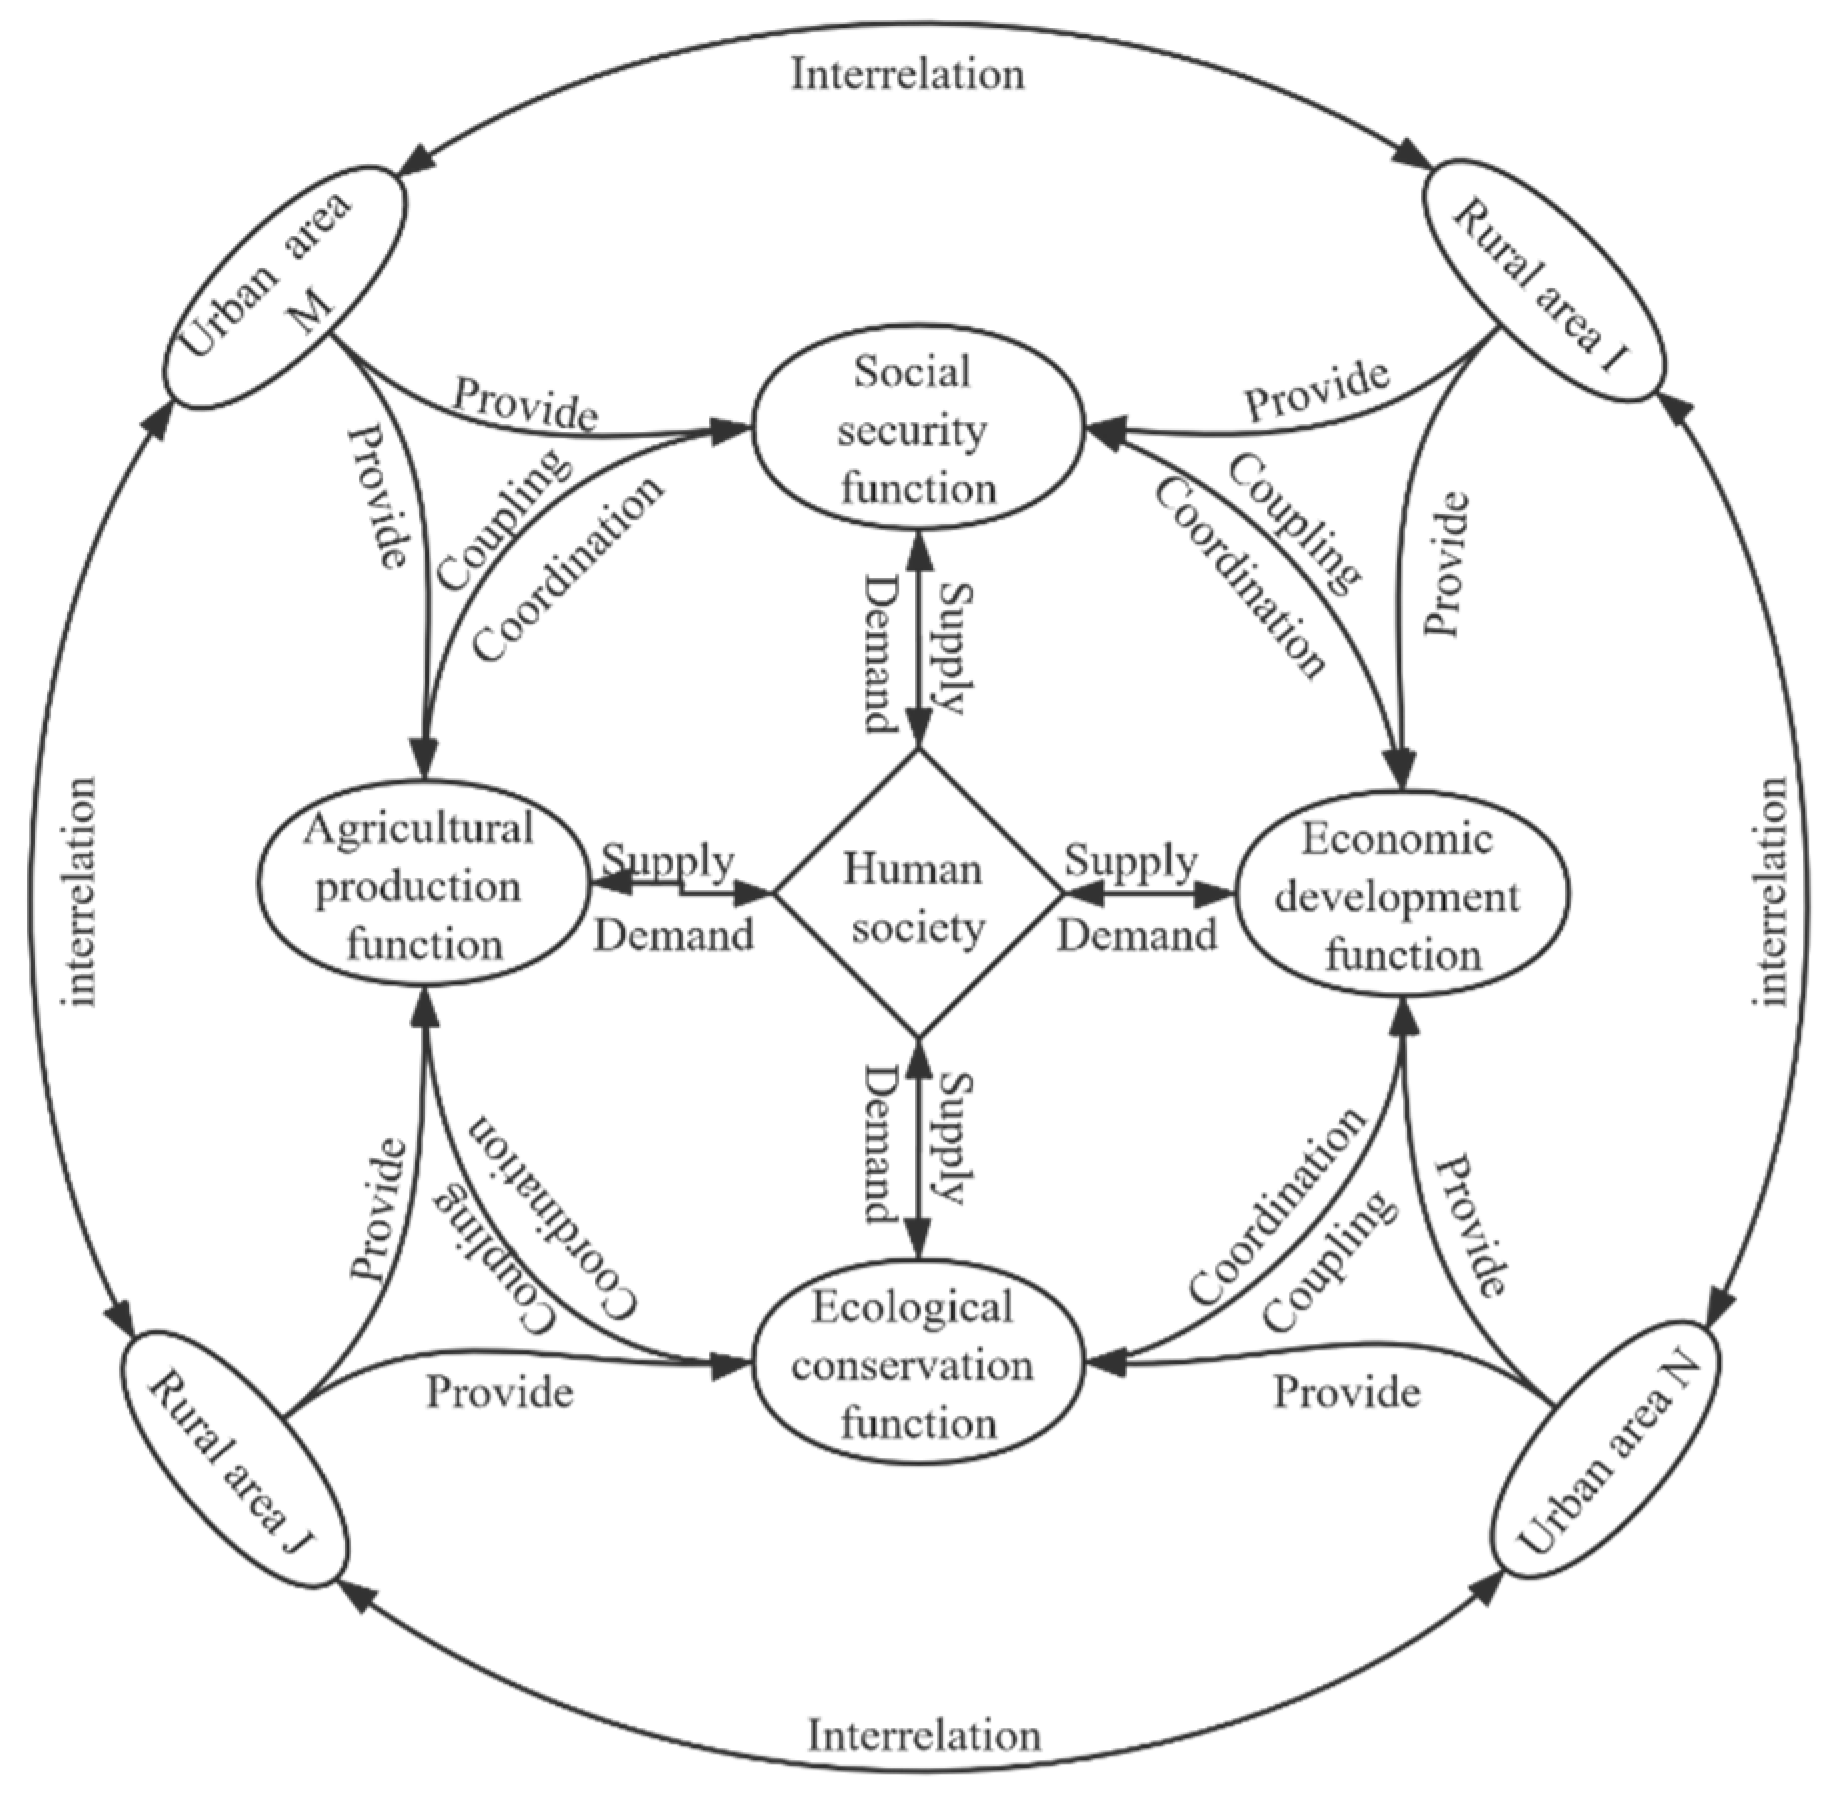
2. Conceptual Framework

The rapid urbanization process has led to continuous encroachment of urban space on rural space and intensified spatial conflicts. The process of intensifying spatial conflicts over land use involves the transition of land use. LUFs vary from one to another, and there are varying degrees of coordinated coupling of various functions. LUFs are the result of the interaction between various elements of the land supply system and the human demand system [4,5,6]. From the perspective of land use types, land in DPAs consists of urban and rural construction land, urban settlements, rural settlements, arable land, forest land, grassland, unused land, and other types of land, with mixed land use characteristics. From the perspective of LUFs, cities are dominated by economic development and social security functions; villages are mostly dominated by agricultural production and ecological maintenance functions. Different counties in the DPAs have different land use patterns, varying land use intensities, different types of functions and products provided by the land, and different abilities to guarantee human needs. From the perspective of supply and demand, the LUF is a link between the land supply system and the human demand system [10,51] (Figure 1).
As an important activity in rural areas, agricultural production provides agricultural by-products, ensures national food safety, improves farmers’ livelihoods, etc. [55]. The economic development function refers to the ability of densely populated urban areas to implement economic development and industrial transformation and upgrading, which is an important function to promote regional high-quality development and is influenced by capital investment, technology levels, production efficiency, and policy factors. The social security function plays an important role in maintaining housing, living, employment, and social stability of urban and rural residents, and is an important representation of social progress. Since the implementation of China’s western development strategy in 1999, policies and investments have pushed ahead of economic development in the western region, prompted the upgrading of industrial structure and orderly urbanization in the Lanzhou–Xining Region (LXR) [56], transformed people’s lives from subsistence to well-off, and improved the level of economic development and social security capacity. The ecological maintenance function aims at providing ecological products for human, protect biodiversity, regulate climate, and guarantee regional ecological security [57]. As human’s demand for a better ecological environment increases, the importance of ecological maintenance functions in the development of national and regional ecological civilization (In October 2007, the report of the 17th National Congress of the Communist Party of China formally put forward the development strategy of building ecological civilization. The representation of ecological civilization is to build a resource-saving and environment-friendly society based on the carrying capacity of resources and environment, which is guided by natural laws and aimed at sustainable development) continues to rise.
The evaluation of LUMF involves natural, economic, social, resource, environmental, ecological, and other systems. Due to data limitations, this paper focuses on the evaluation of four aspects: agricultural production function (PF), economic development function (DF), social security function (SF), and ecological maintenance function (EF). In this paper, counties (districts) in DPAs in the LXR in the upper reaches of the Yellow River are taken as evaluation units. A comprehensive evaluation indicator system for the evaluation of land use multi-functionality is established from the dimensions of status and trend to reveal the functional level of land use and its spatial differentiation characteristics, identify the dominant functions of all counties (districts), perform coupling analysis of LUFs, and propose land use function schemes and corresponding governance strategies. The analysis framework is shown in Figure 2.

3. Materials and Methods

3.1. Overview of the Study Area and Data Source

3.1.1. Overview of the Study Area

Located on the upper reaches of the Yellow River, the LXR is on the passage that leads to the central plains of China, which stretches to Central Asia and Tibet. It occupies an important position in the construction of “the Belt and Road” and the national strategy of ecological protection and high-quality development of the Yellow River basin. The Lanzhou–Xining Urban Cluster Development Plan (the Plan) was approved by the State Council in 2018. The scope of this study is consistent with the scope of the Plan. There are 40 study units in total (Figure 3).
The LXR is a DPA in the upper reaches of the Yellow River, which covers an area of 9.75 × 10⁴ km2, accounting for 8.20% of the total land area of the Gansu and Qinghai provinces. The resident population of the region accounted for 37.34% of the total population of the Gansu and Qinghai provinces in 2018. The GDP there accounted for 49.73% of the total GDP of the two provinces, with obvious population and economic agglomeration characteristics. In 2018, the urbanization rate of the LXR was 53.18%, which means that half of the population lives in the city and half in the countryside, with obvious characteristics of mixed urban and rural land use. Generally speaking, the LXR is a DPA and a core area of economic development in the upper reaches of the Yellow River.

3.1.2. Data Source

Agricultural, social, and economic indicators come from statistical data. Statistical data are extracted from the Gansu Development Yearbook, Gansu Rural Yearbook, Qinghai Statistical Yearbook, Qinghai Yearbook, and statistical bulletins of national economic and social development of counties and cities in the Qinghai province from 2014 to 2018. The land use data comes from the Data Center of Resources and Environmental Sciences of Chinese Academy of Sciences (http://www.resdc.cn/, accessed on 15 July 2019), with a spatial resolution of 30 m. The NPP data are from the MOD17A3HGF.006 data set (with a spatial resolution of 500 m × 500 m) provided by the US Geological Survey (https://www.usgs.gov/, accessed on 10 August 2019). The land use data and NPP data are mainly used to calculate ecological indicators.

3.2. Building of Indicator System

By reference to the multi-functional evaluation indicator system built by Liu et al. [58], Luo et al. [59], Liu et al. [52], Meng et al. [6], and Long et al. [45], based on the principles of feasibility, rationality, and validity, an indicator system is built from the dimensions of development status (S) and development trend (T) (Table 1).

3.3. Methods

3.3.1. Calculation of Index Weight

The index weight is determined with the entropy weight method (EWM) [32,62,63,64,65]. The sum of index weights of a single function is 1, with the status and trend accounting for 50%, respectively. Specific steps are as follows:
(1) Data standardization
To eliminate the influence of dimensions, 36 indexes are normalized by the polar planting method, and the calculation formula is as follows:
X i j = X i j M i n X i j M a x X i j M i n X i j     ( Positive   indicator ) X i j = M a x X i j X i j M a x X i j M i n X i j     ( Negative   indicator )
where X i j is the initial value of the indicator, i = 1…m, j = 1…n; m and n are the number of research units and the number of indicators, respectively; X i j is the standardized value of X i j ; and M a x X i j and M i n X i j are the maximum value and minimum value of the j indicator of county i, respectively. In this paper, the urban–rural income ratio is the only negative indicator, with others being positive indicators.
(2) Calculation of the composite standardized value Z i j
Z i j = X i j j = 1 n X i j
(3) Calculation of the entropy value for the jth indicator
H j = ( ln m ) 1 i = 1 m Z i j ln Z i j
H j is the information entropy value of the jth index. As a logarithm is not taken for the original data in this paper, if Z i j = 0, in order to make ln Z i j meaningful, a minimal value (0.000001) is assigned to Z i j .
(4) Calculation of the weight of indicator j
W j = ( 1 H j ) / ( k j = 1 k H j )
W j is the weight value of the jth index; k is the number of indexes for evaluation of a single function. The weight values are shown in Table 1.

3.3.2. Calculation of LUF Indexes

A single LUF index is a comprehensive embodiment of the development status and trend of a certain function, and it is the sum of the function status value and the trend value [59]. The calculation formulas are as follows:
S = V i r s = j = 1 k X i j W j r s T = V i r t = j = 1 l X i j W j r t V = V i r = S + T = V i r s + V i r t
where V i r s and V i r t represent the status value and trend value of function r in county i, respectively. The status values of the four functions are summarized as SPFV, SDFV, SSFV, and SEFV; the trend values of the four functions are summarized as TPFV, TDFV, TSFV, and TEFV. X i j is the normalized value of the jth index of county i. W j r s and W j r t are the weights of the jth index in the status and trend of function r, and k is the number of status and trend of function r. V i r Is the index value of function r in country i. The four LUFs are summarized as PFV, DFV, SFV, and EFV. The value of a single land use function index is between 0 and 1. A value closer to 1 indicates a higher function level, and vice versa. LUFs are classified according to quartile (Table 2) to judge the spatial differentiation of LUF.
A radar diagram (Figure 4) was drawn to express and evaluate the land use multi-functional index using a multi-dimensional evaluation model, with each dimension of the radar diagram representing a different land use function index value. The area (S) of the polygon of each type of LUF is the land use multi-functional index (M), whose value ranges from 0 to 1. A value closer to 1 indicates a stronger comprehensive function. In this model, different LUFs can be compared in the same framework to identify the strengths and weaknesses of various LUFs and the level of multi-functionality.

3.3.3. Zoning Methods for LUFs

There are coupled interactions between LUFs that promote and coerce each other. To further analyze the spatial consistency and variability of LUFs of each county and district, dominant functions and the coupling degree model (CDM) are used to perform optimized zoning for the LUFs in the LXR [66,67,68]. The CDM is as follows:
C = 4 × { P F V × D F V × S F V × E F V ( P F V + D F V + S F V + E F V ) 4 } 1 / 4
C is the land use function coupling value, which ranges from 0 to 1 [68], and a larger value indicates a stronger interaction and influence between LUFs.
The dominant functions of each county are identified based on V i r s and V i r t . If the dominant functions of a county are not clear, based on the premise of defining the dominant functions, the urban cluster in the LXR is further divided into optimization and upgrading areas, key upgrading areas, potential upgrading areas, synergistic optimization areas, and moderate optimization areas, according to the multi-functional land use index and coupling degree values (Table 3).

4. Result Analysis

4.1. General Characteristic of LUFs

The land use in the LXR is multi-functional (Figure 5), and the average value of the LUF index in each county shows the characteristics of EFV (0.454) > SFV (0.353) > PFV (0.293) > DFV (0.164). The LXR has the strongest EF, which is consistent with the actual development of the upper reaches of the Yellow River with emphasis on ecological construction. It has the weakest DF, which is consistent with the general characteristics that the economic development level in the less developed regions in western China lags behind for a long period of time. The average value of the LUF index varies greatly, which indicates that the level of LUF in each county is quite different, and all kinds of functions develop unevenly in space.
The multi-functional index of land use is calculated according to the multi-dimensional evaluation model, which is between 0.078 and 0.402 (Table 4). The multi-functional index of land use in each county is less than 0.5, indicating that the overall level of LUF is low. The multi-functional index in the Honggu District, the Pingchuan District, Dongxiang County, and Jishishan County is less than 0.1, making these four counties and districts with the lowest level of LUF in the study area. Dongxiang County and Jishishan County are the two poorest counties in the Gansu province. The low level of LUFs is closely linked with the low level of social and economic development and harsh natural conditions in these two counties. Honggu District and Pingchuan District are typical resource-based regions. Resource depletion leads to economic decline, population loss, land abandonment, decline in land productivity, and utilization efficiency, highlighting the short-board effect of LUF.

4.2. Spatial Differentiation Characteristics of LUFs

4.2.1. Agricultural Production Function

The agricultural production function index (PFV) is between 0.045 and 0.718, with an average of 0.293. The PFV range is large, which indicates that the level of PF among counties (districts) is quite different, with obvious spatial differentiation (Figure 6a).
High-value counties (PFV ≥ 0.460) are distributed in a contiguous space. The western area is concentrated in the agricultural triangle where the Huangshui River basin and the Yellow River basin converge, and the eastern area is concentrated in the irrigation areas along the Yellow River with rich water resources and favorable irrigation conditions. The low-value counties (PFV ≤ 0.460) can be divided into two categories: one category of counties is located in the farming-pastoral ecotone (such as Jianzha County, Tongren County, and Guide County, which have both farming and animal husbandry structures, but the farming–pastoral–industrial chain is short, with a low secondary value and a low level of agricultural production) and the other category of counties are located in the Lanzhou–BaiYin metropolitan area and Xining–Haidong metropolitan area.

4.2.2. Economic Development Function

The economic development function index (DFV) is between 0.038 and 0.828, with an average of 0.164. Among the four types of LUFs, the DFV has the smallest average value and the largest range, indicating that the DF gap between counties (districts) is the biggest, and the spatial differentiation characteristics are the most obvious (Figure 6b).
The Western Development Strategy and “the Belt and Road Initiative” have played a strong role in promoting the economic development of the LXR. However, capital, technology, and policies are mostly concentrated in regional central cities. Therefore, the high-value areas (PFV ≥ 0.193) are distributed in the central urban areas of Lanzhou, Xining, and Linxia, with a polar nuclear spatial structure formed in the space, presenting an obvious siphon effect of the economic center on the surrounding areas. The peripheral counties and districts are connected in series by rivers and traffic lines to form economic function buffer zones. Counties outside the buffer zones with further weakened DF are called peripheral areas. The DF weakens from the core area to the transition area and then to the peripheral areas, with obvious spatial heterogeneity.

4.2.3. Social Security Function

The social security function index (SFV) is between 0.118 and 0.737, with an average of 0.353. The average of SFV is the largest, indicating that the gap of SF between counties (districts) is relatively small. It can be seen from Figure 6c that the downtown areas of the Lanzhou and Xining region are high-value areas of SF, which is consistent with the spatial distribution of high-value areas of economic functions of land use. Jishishan County and Dongxiang County are the two counties with the lowest level of social security in the study area, which is consistent with the fact that these two counties are deep poverty-stricken counties supported by the State. Generally speaking, in counties and districts with high DF, their SF level is also high, and vice versa. The consistency of the spatial distribution of the two functions reflects the close relationship between social security and economic development.

4.2.4. Ecological Maintenance Function

The ecological maintenance function index (EFV) ranges from 0.164 to 0.708, with an average of 0.454. Among the four functions, the average value of EFV is the largest, indicating that the overall level of EF is the highest. Most counties in the western part of the study area are in high-value areas (Figure 6d). These counties are located in national key ecological function areas of Sanjiangyuan and Qilian Mountains, enjoying an important ecological position. In addition, these counties have a high altitude and steep terrain, and there are large areas of woodland, grassland, and other types of land with high ecological service value and strong ecological function. Counties and districts in the eastern part of the study area are mainly urbanized areas and major agricultural production areas, and the urban industrial development and agricultural production activities cause the ecological space to be occupied. There are conflicts between production, living, and ecological space, and the EF is worse than that in the western part of the study area. Generally speaking, EFV is high in the west and low in the east, showing a spatial distribution pattern which is strong in the west and weak in the east.

4.3. Identification of Dominant LUFs

The supply and demand of LUFs in different counties and districts are different, and the intensity of land use is different; thus, their dominant functions are different. Strictly speaking, the dominant functions should have a high status value and trend value. Status and trend are of equal importance in this paper (with the weight accounting for 50% respectively). Therefore, 25% is taken as a demarcation point to divide the plane coordinate system into four quadrants, and the function in the first quadrant is the dominant function of land use (Figure 7).
It can be seen from Figure 7 that a few counties and districts fall into the first quadrant, some of which have unilateral advantages in development status or trend. Most counties and districts fall into the third quadrant, which are counties and districts with LUFs with neither the advantages of the present situation nor the advantages of the functional evolution. In order to better serve the zoning management of land use, according to the low level of LUF in the LXR, the status index and the trend index are added together, and a single-function index greater than 0.5 is taken as a judgment criterion for the dominant function in less developed regions. The identification results are shown in Figure 8.
In total, five dominant functions of land use are identified based on the above methods. Counties and districts with dominant PFs include the Anding District, Longxi, and Jingyuan, which are mainly distributed in the eastern part of the LXR. There are seven counties and districts with dominant SFs, including the downtown areas of Lanzhou, Xining, and the Baiyin District. There are four counties and districts with dominant agricultural and ecological functions, which are distributed within the Yellow River–Huangshui River Valley. Counties and districts with dominant economic–social functions include the Chengguan District and the Chengxi District, both of which have high economic development level and social security ability, where economic development has a strong driving effect on urbanization. There are 12 counties with dominant EF, which are distributed within the Qinghai province. There are 12 counties without dominant functions, which are distributed within the Gansu province, where the LUFs need to be further optimized.
Based on the types of dominant functions and their spatial distribution, it can be found that emphasis is placed on economic development and social security in urbanized areas. Agricultural production and ecological maintenance occupy a more prominent position in major agricultural production areas and important ecological function areas. Dominant functions identified are basically consistent with those of the main functional zoning in the Gansu and Qinghai provinces. Generally speaking, the dominant functions of the western counties are clear, while counties in the eastern part have no clear dominant functions, so it is necessary to further adjust the land use direction and optimize the LUF.

4.4. Functional Zoning of Land Use

Since the reform and opening up, the gap between urban and rural areas in China has been widening [69,70]. Globalization and urbanization lead to frequent interaction between urban and rural land use [71], the mutual conversion of LUFs, and the different degree of coordination and coupling of sub-functions of land use [72]. The analysis of land use function is intended to clarify the interaction law of LUFs, alleviate the conflict of LUFs [34], and serve urban and rural spatial governance. The coupling degree of LUFs is calculated with Formula 6, further revealing the interaction degree of LUFs. The coupling degree of LUFs ranges from 0.631 to 0.965, and the coupling value is divided into three levels with the natural breakpoint method: low, medium, and high (Figure 9).
It can be found, based on the multi-functionality index of land use (Table 4), that the multi-functionality index of some counties is high, but the coupling degree of each sub-function is low, which indicates that functions restrict each other and the synergistic effect has not yet appeared. For example, the Chengguan District ranks the first among all counties and districts in terms of the multi-functionality index; however, it ranks the last but one in terms of the coupling degree, mainly because that it has a high level of economic development and social security, yet it has a relatively low agricultural production and ecological conservation levels. Limited by the land use in the valley basin, the spatial differentiation of each function is obvious, with functions mutually constrained, resulting in a low coupling degree. On the contrary, in some counties, each single-function index is low, but the functions promote each other, showing characteristics of high coupling. For example, the maximum value of the LUF index of Yuzhong County is 0.397, but its coupling value is the largest. In other words, all functions have a low-level promoting effect.
LUFs are divided into five zones according to the functional zoning methods of land use proposed in this paper (Figure 10).
Eight counties and districts are classified as priority promotion zones, all of which are distributed in the Gansu province in the eastern part of the study area. Geographically, most of these counties and districts are located in the transition zone between the warm temperate zone and the middle temperate zone, between the arid zone and the semi-arid zone, and between the pastoral zone and the agricultural zone. There is a weak development foundation in these counties and districts, without dominant functions and with evident rural characteristics.
Four counties and districts are classified as key promotion zones. Spatially, these counties and districts are adjacent to Lanzhou, making them important radiation areas of the Lanzhou–Baiyin metropolitan area. They have location advantages for development and policy advantages for national new district construction.
Six counties and districts are classified as potential promotion zones with dominant functions at the county level. The level of other LUFs other than the dominant functions is low, and secondary functions are loosely connected with dominant functions, so they are in a period of transforming and developing LUFs.
Four counties and districts are classified as collaborative optimization zones, where there is high multi-functionality index of land use, and dominant functions have a strong leading role in regional development. However, the coordinated development level of various functions is poor and the coupling degree is low.
Eighteen counties and districts are classified as moderate optimization zones, which are distributed within the Qinghai province and dominated by ecological conservation and agricultural production. All functions promote each other with a high coupling degree.

4.5. Zoning Governance Strategies

There are differences in land use patterns, industrial structures, and resource characteristics among different functional zones, and there are also differences in the direction and emphasis of zoning governance. The following suggestions are proposed according to the LUF characteristics.
Priority promotion zone: Fully tap regional characteristics can enhance the level of rural social civilization based on the assessment of the current situation of regional issues concerning agriculture, rural areas, and farmers. According to the strategy of “demonstration of thousands of villages and renovation of thousands of villages” and the construction strategy of beautiful countryside, it is important to strengthen the construction of infrastructure and public service facilities in rural areas, improve the quality of living environment, and enhance the social security. According to the characteristics of the natural and geographical transition zone, it is necessary to explore local resources and products with regional characteristics; promote the establishment of industries with local characteristic; promote agricultural efficiency and increase farmers’ income on the basis of ensuring the production of grain and agricultural products; strengthen ecological restoration and environmental protection in national key ecological function areas and at edges of deserts; implement ecological migration; and guide people in ecologically fragile areas to be resettled in different places moderately so as to enhance the EF.
Key promotion zone: On the basis of making use of policy advantages and highlighting industrial advantages, it is important to accelerate the formation of leading functions of land use and boost regional high-quality development; promote the organic linkage between the main urban areas of Lanzhou, the Yuzhong Ecological Innovation City, and the Lanzhou New Area; promote the migration of people to the east and industrial enterprises to the north; build pastoral complexes and agricultural demonstration parks according to the location advantages enjoyed by urban fringes to form a new pattern of modern urban agriculture development; accelerate the industrial enterprises in the main urban area of Lanzhou to “go out of the city and enter the industrial park”; improve the scientific and technological innovation ability in the fields of green chemicals, new materials, trade logistics, etc.; promote the integration and development of new and old urban areas; and improve the efficiency of land use.
Potential promotion zone: It is necessary to speed up the adjustment of agricultural and pastoral industrial structure; optimize the industrial layout; develop modern agriculture and pastoral industry with plateau characteristics; extend the industrial chain, fundamentally enhance the regional PF according to the characteristics of natural geography and industrial development; strengthen the construction of clean energy bases and study on the multi-energy complementary feature of clean energy; improve the efficiency of green development by focus on the large-scale development of new energy; accelerate the transformation and upgrading of resource-based industries; handle the relationship between economic development and ecological protection; establish an innovative system for urban development and transformation; actively explore the path and mode of industrial transformation and upgrading; promote the integrated development of industrial functions and urban functions; and enhance the urban development potential by relying on the existing industrial base.
Collaborative optimization zone: Chengguan District and Anning District have two of the highest levels of urbanization and extremely low levels of agricultural production in the study area, which accords with the general law of LUF evolution in urbanized areas, where the existing land use pattern can be continued. Land use in Jianzha County and Datong County is dominated by ecological functions. However, the DF level is low, and the contradiction between ecological protection and economic development is still prominent. In these counties and districts, the relationship between the urban ecological environment management, ecological construction, and integrated urban–rural development needs to be handled; the spatial conflicts of production, life, and ecology need to be reduced while promoting the new urbanization process; and the layout of infrastructure, public resources, and major productive forces needs to be optimized in order to ensure orderly development of production and living spaces, the rational protection of ecological space, and the gradual realization of the coordinated development of urban and rural functions.
Moderate optimization zone: To achieve the goal of the “two highs and one priority” (high-quality development, high-quality life, and development based on the principle of giving priority to ecological protection) strategy, the relatively weak DF and SF should be appropriately optimized in this area; an ecological economic system with industrial ecologization and ecological industrialization as the core system needs to be established, and the entry threshold of rural industrial development and the criteria for negative list of environmental access needs to be raised to take a path of low-carbon and sustainable development; and the bottom line of cultivated land protection needs to be strictly followed to ensure regional food safety, strictly control the ecological bottom line, and build an ecological security pattern.

5. Discussion

5.1. The Overall Level of Multi-Functionality

Building an evaluation indicator system is the foundation of revealing the characteristics of LUMF. Numerous studies have transformed from a single-indicator evaluation to multi-indicator evaluation, but most of these indicators involved in the studies are status indicators [5,10,21,34]. Considering that the LUF pattern is affected by the change trend of indicators, we propose a comprehensive evaluation indicator system from the dimensions of status and trend. Our results showed that the land use in the LXR is multi-functional, but the overall level of multi-functionality is low. As far as a single LUF is concerned, the EF is the strongest and the DF is the weakest. These results are consistent with the basic characteristics that the development of the upper reaches of the Yellow River focuses on ecological protection and the economic development of less developed regions lags behind for a long time, which indicates that the indicators established in this paper are reasonable, and can be applied to similar researches in underdeveloped regions.
By comparing the development status and evolution trend of LUFs (Figure 11), it is found that the status index and trend index of LUFs are low, among which the status index and trend index of DF are the lowest, being 0.064 and 0.089, respectively, and the trend index of EF is the highest, being only 0.300, which further reflects that the multifunctional level of land use in the LXR is low from the dimensions of status and trend. In addition, it can be seen from Figure 11 that the status index of LUF is lower than its trend index, e.g., the status index of PF is 0.132, which is lower than the trend index of 0.161. The status index values of other three types of LUFs are also lower than their trend index values. In other words, compared with the current level of LUFs, the trend of LUF transformation is obvious. Compared with status indicators in a single dimension, trend indicators have advantages in revealing the hidden characteristics of land use, which are reasonable and innovative.
The CDM has advantages in explaining rules of interactions between various systems [68]; therefore, we use it to analyze the interactive relationship between LUFs. The overall level of multi-functionality of land use in the LXR is not high, but the spatial differentiation of LUFs among counties is large. For example, the PFV, DFV, SFV, and EFV values of Yuzhong County are 0.397, 0.158, 0.311, and 0.361, respectively. There is little difference among the four types of LUFs. The PFV, DFV, SFV, and EFV values of Fuzhu County are 0.718, 0.096, 0.198, and 0.708, respectively, with PFV and EFV values being much higher than DFV and SFV values. However, in the Chengguan District, the PFV, DFV, SFV, and EFV values are 0.056, 0.837, 0.685, and 0.197, respectively, indicating that the levels of economic development and social security capability are high. The results show that all kinds of functions develop in a balanced way in Yuzhong County; PF and EF have strong advantages in Fuzhu County, while the DF and SF values are very high in the Chengguan District. The multi-functional degree of land use varies with the development mode of each county and district.
In this paper, the overall coupling degree of land use functions is calculated and graded, but the coupling characteristics between two sub-functions are not analyzed, which can not reveal the interaction between land use sub-functions. In the future, further research on trade-off analysis of land use functions should be performed to reveal the interaction mechanism of land use functions.

5.2. The Conflicts of Land Use

Rapid social–economic transitions serve as an engine to promote integrated urban–rural development [73], but it has profoundly influenced the agricultural production system [44]. In our study, with the continuous advancement of urbanization and industrialization, the agricultural production space is constantly squeezed out; the arable land resources are reduced; and, for example, the PFs of the An’ning District and the Chengxi District are gradually disappearing. In other words, there are spatial distribution consistencies and spatial conflicts among LUFs.
A comparison between Figure 6b,c shows that the spatial distribution of the DFV and SFV is consistent. In other words, the area with high economic development levels has high social security. The study by Sun et al. [74] and Li et al. [75] finds that economic development and social development in western China are positively correlated with each other. This paper further reveals the coordination between SF and DF, as well as the consistency of spatial distribution.
The urbanization of land leads to increasing conflicts between urban and rural land use functions, highlighting the contradiction between LUFs [76]. Generally speaking, urbanized areas mainly focus on industrial production, and agricultural areas mainly focus on providing agricultural products. Ecological areas mainly focus on ecological maintenance functions. In areas with key ecological functions, development production activities are strictly prohibited. Therefore, conflicts between economic development function and ecological maintenance function are also the most obvious [19,21,77,78].
A comparison between Figure 6b,d shows that there is also a spatial conflict between the DF and the EF in less developed regions. The high-value counties of the DFV are mainly regional central cities, which are distributed in the Yellow River valley, being regions with a low EFV value. On the contrary, most counties located in the western part of the study area have a higher EFV value, but a lower DFV value. Similarly, a comparison between Figure 6a,b finds that there is also a spatial conflict between agricultural production and ecological maintenance functions. Economic development and agricultural production strongly disturb the EF [21], and threaten the sustainable use of land in urban areas in the upper reaches of the Yellow River. Therefore, it is necessary to enhance people’s awareness to deal with regional conflicts in land use functions.

5.3. Policy Implications

In the process of urbanization, coordinating various land use functions and improving land use efficiency are the core objectives of implementing land space governance. Existing researches consider that the overlap of LUFs gives rise to conflicts [79,80]. In fact, the overlap of different LUFs does not necessarily lead to conflicts [21]. In our study, DF and SF are highly concentrated in Lanzhou and Xining river valleys, but the DFV and the SFV are mutually coordinated and do not show conflict characteristics. This indicates that a land use type may have multiple LUFs, and different regions are dominated by different functions. With in-depth study of LUMF, more emphasis should be placed on the zonal governance [81,82].
The LXR is a region spanning the Gansu and Qinghai provinces, which is a key area jointly built by the Gansu province and the Qinghai province. In 2018, the State Council issued the Lanzhou–Xining Urban Cluster Development Plan. In 2021, the Communist Party of China Central Committee and the State Council issued the Outline of Ecological Protection and High-Quality Development Planning for the Yellow River Basin. The implementation of the Plan and National Strategy brings major opportunities for the development of the LXR. It is suggested that Gansu and Qinghai provinces should jointly strive for preferential policies from the state, and establish a coordinated development mechanism for the LXR. Governments in these two provinces should strengthen efforts to construct the Lanzhou–Baiyin metropolitan area and Xining–Haidong metropolitan area, continue to promote infrastructure connectivity, cooperate to build a regional ecological security pattern, and promote the establishment of characteristic agricultural bases. They should take a series of measures to improve land use efficiency and improve the overall level of land use functions.

6. Conclusions

This paper takes the LXR in the upper reaches of the Yellow River as a case study area. Based on an analysis of the supply and demand characteristics of land use functions, an analysis framework of LUMF is proposed. We establish a comprehensive evaluation indicator system to assess the multi-function level of land use and propose a functional zoning scheme by integrating the EWM and CDM. The results are conducive to understanding land use characteristics of DPA in less developed regions, which can provide a basis for improving land use efficiency.
From the perspective of methodology, the comprehensive evaluation indicator system proposed from the dimensions of status and trend opens a new horizon to assess LUMF. Status and trend indicator weights account for 50%, respectively; thus, the status quo and trend of land use function are equally important. The application of the EWM can reduce the influence of subjective consciousness on evaluation results, which is an important aspect in multi-functionality assessment in less developed regions. This method enables us to further understand the hidden influencing factors of land use functions revealed by trend indicators. The results showed that the multi-functional level in the LXR is low from the dimensions of status and trend, and the multi-functional degree varies with the development mode of each county and district.
According to the characteristics of low-level LUFs and uneven spatial development in the LXR, we propose an improved method for the identification of dominant functions. We add the status index and the trend index together, and take a single-function index greater than 0.5 as a criterion for the evaluation of dominant functions. This approach can be used as an important reference for the identification of dominant functions in less developed regions. The results showed that there are five dominant functions. Among the 40 research units, 28 counties and districts have the advantages of dominant functions, and there are 12 counties and districts without dominant functions, indicating that LUFs in the LXR need to be further optimized.
The spatial distribution of agricultural production, economic development, social security, and ecological maintenance functions in the LXR differs greatly. The high-value areas of PF are concentrated in the irrigation area along the Yellow River and the Yellow River–Huangshui River Triangle. The DF and SF present a core-periphery distribution structure, and the EF is high in the west and low in the east. The SF coordinates with the DF, with consistent spatial distribution. Economic development and agricultural production strongly disturb the EF with obvious characteristics in terms of spatial conflicts. Identifying counties and districts with polarization and conflict characteristics can help to improve and transform land use functions.
Based on the analysis of land use multi-functional index, dominant functions, and coupling degree of LUFs, the LUF zoning scheme and governance strategies were proposed. LUF zones are classified into five types. In the priory promotion zone, focus is placed on solving the problems of agriculture, rural areas, and farmers. In key promotion zone, emphasis is placed on the interactive development with regional central cities. In the potential promotion zone, regional development and transformation are promoted. In the collaborative optimization zone, we need to reduce the space conflicts between the “production space, living space and ecological space”, and in the moderate optimization zone, we take a road of low-carbon and sustainable development.
In the foreseeable future, the promotion of China’s Western Development Strategy may lead to the continuous adjustment of social and economic development modes. This indicates that numerous studies need to be carried out to explore the man–land relationship from the land use perspective. This study can provide useful references for similar studies in other DPAs in the upper reaches of the Yellow River in terms of a conceptual framework, index system innovation, dominant functions, and zoning study methods. The results can be applied at the regional level, e.g., by policy-makers in the Gansu and Qinghai province, and can also be used as theoretical support for urban and rural co-governance in other DPAs in less developed regions.

Author Contributions

Conceptualization, J.L. and P.S.; data curation, J.L. and X.Z.; formal analysis, J.L. and X.Z.; funding acquisition, X.Z. and P.S.; investigation, J.L. and X.Z.; methodology, J.L. and X.Z.; project administration, X.Z. and P.S.; resources, J.L.; software, J.L. and X.Z.; supervision, P.S.; validation, J.L. and X.Z.; visualization, J.L.; writing—original draft, J.L.; writing—review and editing, X.Z. and P.S. All authors have read and agreed to the published version of the manuscript.

Funding

This research was funded by the National Natural Science Foundation of China (No. 42101276, 41661035, and 41771130); the science and technology project of the Gansu province (No. 20JR5RA529); and Key Laboratory of Resource Environment and Sustainable Development of Oasis, Gansu province (GORS202104).

Institutional Review Board Statement

Not applicable.

Informed Consent Statement

Not applicable.

Data Availability Statement

The data presented in this study are available on request from the first author.

Acknowledgments

We sincerely thank the reviewers for their valuable feedback and helpful comments and suggestions.

Conflicts of Interest

The authors declare no conflict of interest.

References

  1. Bourne, L.S.; Bunce, M.; Taylor, L.; Luka, N.; Maurer, J. Contested ground: The dynamics of peri-urban growth in the Toronto region. Can. J. Reg. Sci. 2003, 26, 251–270. [Google Scholar]
  2. Friedberger, M. The rural-urban fringe in the late twentieth century. Agric. Hist. 2000, 72, 502–514. [Google Scholar] [CrossRef]
  3. de Groot, R. Function-analysis and valuation as a tool to assess land use conflicts in planning for sustainable, multi-functional landscapes. Landsc. Urban Plan. 2006, 75, 175–186. [Google Scholar] [CrossRef]
  4. Wiggering, H.; Dalchow, C.; Glemnitz, M.; Helming, K.; Müller, K.; Schultz, A.; Stachow, U.; Zander, P. Indicators for multifunctional land use—Linking socio-economic requirements with landscape potentials. Ecol. Indic. 2006, 6, 238–249. [Google Scholar] [CrossRef]
  5. Verburg, P.H.; Van De Steeg, J.; Veldkamp, A.; Willemen, L. From land cover change to land function dynamics: A major challenge to improve land characterization. J. Environ. Manag. 2009, 90, 1327–1335. [Google Scholar] [CrossRef]
  6. Meng, J.J.; Cheng, H.R.; Li, F.; Han, Z.Y.; Wei, C.J.; Wu, Y.D.; You, N.W.; Zhu, L.K. Spatial-temporal trade-offs of land multi-functionality and function zoning at finer township scale in the middle reaches of the Heihe River. Land Use Policy 2022, 115, 106019. [Google Scholar] [CrossRef]
  7. Meng, J.J.; Wang, Q.; Li, F.; Guo, L.R. Assessing multifunctional land use in the middle reach of the Heihe River basin based on spatial variances. Geogr. Res. 2019, 38, 369–382. (In Chinese) [Google Scholar] [CrossRef]
  8. Steinhäußer, R.; Siebert, R.; Steinführer, A.; Hellmich, M. National and regional land use trade-offs in Germany from the perspective of stakeholders. Land Use Policy 2015, 49, 183–194. [Google Scholar] [CrossRef]
  9. Slee, B. Social indicators of multifunctional rural land use: The case of forestry in the UK. Agric. Ecosyst. Environ. 2007, 120, 31–40. [Google Scholar] [CrossRef]
  10. Zou, L.L.; Liu, Y.S.; Yang, J.X.; Yang, S.F.; Wang, Y.S.; Zhi, C.; Hu, X.D. Quantitative identification and spatial analysis of land use ecological-production-living functions in rural areas on China’s southeast coast. Habitat Int. 2020, 100, 102182. [Google Scholar] [CrossRef]
  11. Liu, P.J.; Hu, Y.C.; Jia, W.T. Land use optimization study based on FLUS model and ecosystem services–setting Jinan City as an example. Urban Clim. 2021, 40, 100984. [Google Scholar] [CrossRef]
  12. Zhang, Y.N.; Long, H.L.; Tu, S.S.; Ma, L.; Wang, L.Z. Spatial identification of land use functions and their tradeoffs/synergies in China: Implications for sustainable land management. Ecol. Indic. 2019, 107, 105550. [Google Scholar] [CrossRef]
  13. Vereijken, P.H. Multifunctionality: Applying the OECD Framework, A Review of Literature in The Netherlands. Paris Oecd P 2001, 1–27. Available online: https://edepot.wur.nl/39821 (accessed on 9 May 2022).
  14. Wilson, G.A. The spatiality of multifunctional agriculture: A human geography perspective. Geoforum 2009, 40, 269–280. [Google Scholar] [CrossRef]
  15. Zhang, S.Y.; Hu, W.Y.; Li, M.R.; Guo, Z.X.; Wang, L.Y.; Wu, L.H. Multiscale research on spatial supply-demand mismatches and synergic strategies of multifunctional cultivated land. J. Environ. Manag. 2021, 299, 113065. [Google Scholar] [CrossRef]
  16. Marsden, T.; Sonnino, R. Rural development and the regional state: Denying multifunctional agriculture in the UK. J. Rural Stud. 2008, 24, 422–431. [Google Scholar] [CrossRef]
  17. Tao, J.; Fu, M.C.; Sun, J.J.; Zheng, X.Q.; Zhang, J.J.; Zhang, D.X. Multifunctional assessment and zoning of crop production system based on set pair analysis-A comparative study of 31 provincial regions in mainland China. Commun. Nonlinear Sci. Numer. Simul. 2014, 19, 1400–1416. [Google Scholar] [CrossRef]
  18. Rallings, A.M.; Smukler, S.M.; Gergel, S.E.; Mullinix, K. Towards multifunctional land use in an agricultural landscape: A trade-off and synergy analysis in the Lower Fraser Valley, Canada. Landsc. Urban Plan. 2019, 184, 88–100. [Google Scholar] [CrossRef]
  19. Jiang, G.H.; Wang, M.Z.; Qu, Y.B.; Zhou, D.Y.; Ma, W.Q. Towards cultivated land multifunction assessment in China: Applying the “influencing factors-functions-products-demands” integrated framework. Land Use Policy 2020, 99, 104982. [Google Scholar] [CrossRef]
  20. Monti, M.A.; Brigolin, D.; Franzoi, P.; Libralato, S.; Pastres, R.; Solidoro, C.; Zucchetta, M.; Pranovi, F. Ecosystem functioning and ecological status in the Venice lagoon, which relationships? Ecol. Indic. 2021, 133, 108461. [Google Scholar] [CrossRef]
  21. Zou, L.L.; Liu, Y.S.; Wang, J.Y.; Yang, Y.Y. An analysis of land use conflict potentials based on ecologi-cal-production-living function in the southeast coastal area of China. Ecol. Indic. 2021, 122, 107297. [Google Scholar] [CrossRef]
  22. Huang, X.; Chen, Y.; Ma, J.; Chen, Y. Study on change in value of ecosystem service function of Tarim River. Acta Ecol. Sin. 2010, 30, 67–75. [Google Scholar] [CrossRef]
  23. Li, C.; Wu, Y.M.; Gao, B.P.; Zheng, K.J.; Wu, Y.; Li, C. Multi-scenario simulation of ecosystem service value for optimization of land use in the Sichuan-Yunnan ecological barrier, China. Ecol. Indic. 2021, 132, 108328. [Google Scholar] [CrossRef]
  24. Felipe-Lucia, M.R. Modelling dynamic ecosystem services. Nat. Sustain. 2021, 4, 928–929. [Google Scholar] [CrossRef]
  25. Zepharovich, E.; Ceddia, M.G.; Rist, S. Social multi-criteria evaluation of land-use scenarios in the Chaco Salteño: Complementing the three-pillar sustainability approach with environmental justice. Land Use Policy 2021, 101, 105175. [Google Scholar] [CrossRef]
  26. Singh, S.; Upadhyay, P.S.; Powar, S. Developing an integrated social, economic, environmental, and technical analysis model for sustainable development using hybrid multi-criteria decision making methods. Appl. Energy 2022, 308, 118235. [Google Scholar] [CrossRef]
  27. Pérez-Soba, M.; Petit, S.; Jones, L.; Bertrand, N.; Briquel, V.; Omodei-Zorini, L.; Contini, C.; Helming, K.; Farrington, J.H.; Mossello, M.T.; et al. Land Use Functions—A Multifunctionality Approach to Assess the Impact of Land Use Changes on Land Use Sustainability BT. In Sustainability Impact Assessment of Land Use Changes; Helming, K., Pérez-Soba, M., Tabbush, P., Eds.; Springer: Berlin/Heidelberg, Germany, 2008; pp. 375–404. ISBN 978-3-540-78648-1. [Google Scholar]
  28. Paracchini, M.L.; Pacini, C.; Jones, M.L.M.; Pérez-Soba, M. An aggregation framework to link indicators associated with multifunctional land use to the stakeholder evaluation of policy options. Ecol. Indic. 2011, 11, 71–80. [Google Scholar] [CrossRef]
  29. Reidsma, P.; König, H.; Feng, S.; Bezlepkina, I.; Nesheim, I.; Bonin, M.; Sghaïer, M.; Purushothaman, S.; Sieber, S.; van Ittersum, M.; et al. Methods and tools for integrated assessment of land use policies on sustainable development in developing countries. Land Use Policy 2011, 28, 604–617. [Google Scholar] [CrossRef]
  30. Helming, K. Impact Assessment for Multifunctional Land Use BT. In Novel Measurement and Assessment Tools for Monitoring and Management of Land and Water Resources in Agricultural Landscapes of Central Asia; Mueller, L., Saparov, A., Lischeid, G., Eds.; Springer International Publishing: Cham, Switzerland, 2014; pp. 223–234. ISBN 978-3-319-01017-5. [Google Scholar]
  31. Xue, Z.C.; Zhen, L.; Miah, M.G.; Shoyama, K. Impact assessment of land use functions on the sustainable regional development of representative Asian countries–A comparative study in Bangladesh, China and Japan. Sci. Total Environ. 2019, 694, 133689. [Google Scholar] [CrossRef]
  32. Zhou, D.; Xu, J.C.; Wang, L.; Lin, Z.L. Assessing urbanization quality using structure and function analyses: A case study of the urban agglomeration around hangzhou bay (UAHB), China. Habitat Int. 2015, 49, 165–176. [Google Scholar] [CrossRef]
  33. Li, G.D.; Fang, C.L. Quantitative function identification and analysis of urban ecological-production-living spaces. Acta Geogr. Sin. 2016, 71, 49–65. (In Chinese) [Google Scholar] [CrossRef]
  34. Zhou, D.; Xu, J.C.; Lin, Z.L. Conflict or coordination? Assessing land use multi-functionalization using production-living-ecology analysis. Sci. Total Environ. 2017, 577, 136–147. [Google Scholar] [CrossRef] [PubMed]
  35. Sylla, M.; Hagemann, N.; Szewranski, S. Mapping trade-offs and synergies among peri-urban ecosystem services to address spatial policy. Environ. Sci. Policy 2020, 112, 79–90. [Google Scholar] [CrossRef]
  36. Bai, R.; Shi, Y.; Pan, Y. LandUse classifying and identification of the production-living-ecological space of island villages—a case study of islands in the western sea area of Guangdong Province. Land 2022, 11, 705. [Google Scholar] [CrossRef]
  37. de Groot, R.; Hein, L. Concept and valuation of landscape functions at different scales BT. In Multifunctional Land Use: Meeting Future Demands for Landscape Goods and Services; Mander, Ü., Wiggering, H., Helming, K., Eds.; Springer: Berlin/Heidelberg, Germany, 2007; pp. 15–36. ISBN 978-3-540-36763-5. [Google Scholar]
  38. Spataru, A.; Faggian, R.; Docking, A. Principles of multifunctional agriculture for supporting agriculture in metropolitan peri-urban areas: The case of Greater Melbourne, Australia. J. Rural Stud. 2020, 74, 34–44. [Google Scholar] [CrossRef]
  39. Dewi, S.; van Noordwijk, M.; Ekadinata, A.; Pfund, J.L. Protected areas within multifunctional landscapes: Squeezing out intermediate land use intensities in the tropics? Land Use Policy 2013, 30, 38–56. [Google Scholar] [CrossRef]
  40. Song, J.C.; Tong, X.Y.; Wang, L.Z.; Zhao, C.L.; Prishchepov, A.V. Monitoring finer-scale population density in urban functional zones: A remote sensing data fusion approach. Landsc. Urban Plan. 2019, 190, 103580. [Google Scholar] [CrossRef]
  41. Kumakoshia, Y.; Koizumib, H.; Yoshimura, Y. Diversity and density of urban functions in station areas. Comput. Environ. Urban 2021, 89, 101679. [Google Scholar] [CrossRef]
  42. Zhou, L.; Dang, X.W.; Sun, Q.K.; Wang, S.H. Multi-scenario simulation of urban land change in Shanghai by random forest and CA-Markov model. Sustain. Cities Soc. 2020, 55, 102045. [Google Scholar] [CrossRef]
  43. Jiang, T.H.; Shi, G.Q.; Zhang, Y.N. Multifunctional rural transition along China’s Yangtze River Transect: Spatial differentiation and economic relevance. Environ. Sci. Pollut. Res. 2021, 28, 60726–60740. [Google Scholar] [CrossRef]
  44. Zhu, C.M.; Lin, Y.; Zhang, J.; Gan, M.Y.; Xu, H.W.; Li, W.Y.; Yuan, S.F.; Wang, K. Exploring the relationship between rural transition and agricultural eco-environment using a coupling analysis: A case study of Zhejiang Province, China. Ecol. Indic. 2021, 127, 107733. [Google Scholar] [CrossRef]
  45. Long, H.L.; Ma, L.; Zhang, Y.N.; Qu, L.L. Multifunctional rural development in China: Pattern, process and mechanism. Habitat Int. 2022, 121, 102530. [Google Scholar] [CrossRef]
  46. Zasada, I. Multifunctional Peri-urban agriculture—A review of societal demands and the provision of goods and services by farming. Land Use Policy 2011, 28, 639–648. [Google Scholar] [CrossRef]
  47. Seifloo, T.B.; Yuzer, M.A. A methodology for estimation of land use changes in an urban area with the emergence of a new impact factor. MethodsX 2020, 7, 101013. [Google Scholar] [CrossRef]
  48. Prabhakar, S.V.R.K. A succinct review and analysis of drivers and impacts of agricultural land transformations in Asia. Land Use Policy 2021, 102, 105238. [Google Scholar] [CrossRef]
  49. Zhao, J.M.; Zhu, D.L.; Cheng, J.; Jiang, X.; Lun, F.; Zhang, Q. Does regional economic integration promote urban land use efficiency? Evidence from the Yangtze River Delta, China. Habitat Int. 2021, 116, 102404. [Google Scholar] [CrossRef]
  50. Zhu, C.M.; Dong, B.Y.; Li, S.N.; Lin, Y.; Shahtahmassebi, A.R.; You, S.X.; Zhang, J.; Gan, M.Y.; Yang, L.X.; Wang, K. Identifying the trade-offs and synergies among land use functions and their influencing factors from a geospatial perspective: A case study in Hangzhou, China. J. Clean. Prod. 2021, 314, 128026. [Google Scholar] [CrossRef]
  51. Zhang, J.; Li, S.N.; Lin, N.F.; Lin, Y.; Yuan, S.F.; Zhang, L.; Zhu, J.X.; Wang, K.; Gan, M.Y.; Zhu, C.M. Spatial identification and trade-off analysis of land use functions improve spatial zoning management in rapid urbanized areas, China. Land Use Policy 2022, 116, 106058. [Google Scholar] [CrossRef]
  52. Liu, C.; Xu, Y.; Huang, A.; Liu, Y.; Wang, H.; Lu, L.; Sun, P.; Zheng, W. Spatial identification of land use multifunctionality at grid scale in farming-pastoral area: A case study of Zhangjiakou City, China. Habitat Int. 2018, 76, 48–61. [Google Scholar] [CrossRef]
  53. Long, H.L.; Liu, Y.S. Rural restructuring in China. J. Rural Stud. 2016, 47, 387–391. [Google Scholar] [CrossRef]
  54. Fan, Y.T.; Jin, X.B.; Gan, L.; Jessup, L.H.; Pijanowski, B.C.; Yang, X.H.; Xiang, X.M.; Zhou, Y.K. Spatial identification and dynamic analysis of land use functions reveals distinct zones of multiple functions in eastern China. Sci. Total Environ. 2018, 642, 33–44. [Google Scholar] [CrossRef] [PubMed]
  55. Long, H.L.; Ge, D.Z.; Zhang, Y.N.; Tu, S.S.; Qu, Y.; Ma, L. Changing man-land interrelations in China’s farming area under urbanization and its implications for food security. J. Environ. Manag. 2018, 209, 440–451. [Google Scholar] [CrossRef]
  56. Zhuo, C.F.; Deng, F. How does China’s Western Development Strategy affect regional greeneconomic efficiency? Sci. Total Environ. 2020, 7070, 135939. [Google Scholar] [CrossRef] [PubMed]
  57. Van Huylenbroeck, G.; Vandermeulen, V.; Mettepenningen, E.; Verspecht, A. Multifunctionality of agriculture: A review of definitions, evidence and instruments. Living Rev. Landsc. Res. 2007, 1, 1–43. [Google Scholar] [CrossRef]
  58. Liu, Y.S.; Liu, Y.; Chen, Y.F. Territorial multi-functionality evaluation and decision-making mechanism at county scale in China. Acta Geogr. Sin. 2011, 66, 1379–1389. (In Chinese) [Google Scholar] [CrossRef]
  59. Luo, Y.L.; Li, T.S.; Zhang, C.X.; Zhai, Z.Y. Town territorial multi-functionality evaluation and the dominant function orientation: A case of Jinhu County. Hum. Geogr. 2016, 31, 94–101. (In Chinese) [Google Scholar] [CrossRef]
  60. Xie, G.D.; Zhang, C.X.; Zhang, C.S.; Xiao, Y.; Lu, C.X. The value of ecosystem services in China. Resour. Sci. 2015, 37, 1740–1746. (In Chinese) [Google Scholar]
  61. Li, X.; Fang, B.; Yin, R.M.; Song, H.F. Spatial-temporal change and collaboration/trade-off relationship of “produc-tion-living-ecological” functions in county area of Jiangsu province. J. Nat. Resour. 2019, 34, 2363–2377. (In Chinese) [Google Scholar] [CrossRef]
  62. Ji, Y.; Huang, G.H.; Sun, W. Risk assessment of hydropower stations through an integrated fuzzy entropy-weight multiple criteria decision making method: A case study of the Xiangxi River. Expert Syst. Appl. 2015, 42, 5380–5389. [Google Scholar] [CrossRef]
  63. Shemshadi, A.; Shirazi, H.; Toreihi, M.; Tarokh, M.J. A fuzzy VIKOR method for supplier selection based on entropy measure for objective weighting. Expert Syst. Appl. 2011, 38, 12160–12167. [Google Scholar] [CrossRef]
  64. Wang, Q.; Yuan, X.; Zhang, J.; Gao, Y.; Hong, J.; Zuo, J.; Liu, W. Assessment of the sustainable development capacity with the entropy weight coefficient method. Sustainability 2015, 7, 13542–13563. [Google Scholar] [CrossRef] [Green Version]
  65. Li, Y.; Li, D. Assessment and forecast of Beijing and Shanghai’s urban ecosystem health. Sci. Total Environ. 2014, 487, 154–163. [Google Scholar] [CrossRef] [PubMed]
  66. Bellin, A.; Majone, B.; Cainelli, O.; Alberici, D.; Villa, F. A continuous coupled hydrological and water resources management model. Environ. Model. Softw. 2016, 75, 176–192. [Google Scholar] [CrossRef]
  67. Tomal, M. Evaluation of coupling coordination degree and convergence behavior of local development: A spatiotemporal analysis of all Polish municipalities over the period 2003–2019. Sustain. Cities Soc. 2021, 71, 10299. [Google Scholar] [CrossRef]
  68. Li, Y.F.; Li, Y.; Zhou, Y.; Shi, Y.L.; Zhu, X.D. Investigation of a coupling model of coordination between urbanization and the environment. J. Environ. Manag. 2012, 98, 127–133. [Google Scholar] [CrossRef]
  69. Liu, Y.S.; Li, Y.H. Revitalize the world’s countryside. Nature 2017, 548, 275–277. [Google Scholar] [CrossRef]
  70. Shan, L.P.; Yu, A.T.W.; Wu, Y.Z. Strategies for risk management in urban–rural conflict: Two case studies of land acquisition in urbanizing China. Habitat Int. 2017, 59, 90–100. [Google Scholar] [CrossRef]
  71. United Nations, Department of Economic and Social Affairs, Population Division. World Urbanization Prospects: The 2018 Revision (ST/ESA/SER.A/420); United Nations: New York, NY, USA, 2019. [Google Scholar]
  72. Tu, S.S.; Long, H.L. Rural restructuring in China: Theory, approaches and study prospect. J. Geogr. Sci. 2017, 27, 1169–1184. [Google Scholar] [CrossRef]
  73. Liu, Y.S. Research on the urban-rural integration and rural revitalization in the new era in China. Acta Geogr. Sin. 2018, 73, 637–650. (In Chinese) [Google Scholar] [CrossRef]
  74. Sun, X.; Zhu, B.; Zhang, K.; Zeng, S.; Li, H.; Wang, K.; Dong, B.; Zhou, Z.F.; Zhou, C.C. New indices system for quan-tifying the nexus between economic-social development, natural resources consumption, and environmental pollution in China during 1978–2018. Sci. Total Environ. 2022, 804, 150180. [Google Scholar] [CrossRef]
  75. Li, Q.; Zhao, Y.; Li, S.; Zhang, L. Spatial-temporal characteristics of the coupling coordination of social security and economic development in China during 2002–2018. Reg. Sustain. 2021, 2, 116–129. [Google Scholar] [CrossRef]
  76. Yu, A.T.W.; Wu, Y.Z.; Shen, J.H.; Zhang, X.L.; Shen, L.Y.; Shan, L.P. The key causes of urban-rural conflict in China. Habitat Int. 2015, 49, 65–73. [Google Scholar] [CrossRef]
  77. Kangas, K.; Brown, G.; Kivinen, M.; Tolvanen, A.; Tuulentie, S.; Karhu, J.; Markovaara-Koivisto, M.; Eilu, P.; Tarvainen, O.; Simil, J.; et al. Land use synergies and conflicts identification in the framework of compatibility analyses and spatial assessment of ecological, socio-cultural and economic values. J. Environ. Manag. 2022, 316, 115174. [Google Scholar] [CrossRef] [PubMed]
  78. Li, S.N.; Zhu, C.M.; Lin, Y.; Dong, B.Y.; Chen, B.J.; Si, B.; Li, Y.J.; Deng, X.D.; Gan, M.Y.; Zhang, J.; et al. Conflicts between agricultural and ecological functions and their driving mechanisms in agroforestry ecotone areas from the perspective of land use functions. J. Clean. Prod. 2021, 317, 128453. [Google Scholar] [CrossRef]
  79. Stockdale, A.; Barker, A. Sustainability and the multifunctional landscape: An assessment of approaches to planning and management in the Cairngorms National Park. Land Use Policy 2009, 26, 479–492. [Google Scholar] [CrossRef]
  80. Lovell, S.T.; DeSantis, S.; Nathan, C.A.; Olson, M.B.; Méndez, V.E.; Kominami, H.C.; Erickson, D.L.; Morris, K.S.; Morris, W.B. Integrating agroecology and landscape multifunctionality in Vermont: An evolving framework to evaluate the design of agroecosystems. Agric. Syst. 2010, 103, 327–341. [Google Scholar] [CrossRef]
  81. Saarikoski, H.; Raitio, K.; Barry, J. Understanding ‘successful’ conflict resolution: Policy regime changes and new interactive arenas in the Great Bear Rainforest. Land Use Policy 2013, 32, 271–280. [Google Scholar] [CrossRef]
  82. Ye, C.; Liu, Z.M. Rural-urban co-governance: Multi-scale practice. Sci. Bull. 2020, 65, 778–780. [Google Scholar] [CrossRef]
Figure 1. Linkage role of LUFs in the human–land system.
Land 11 00897 g001
Figure 2. Analysis framework.
Land 11 00897 g002
Figure 3. Study area.
Land 11 00897 g003
Figure 4. Multi-dimensional evaluation model.
Land 11 00897 g004
Figure 5. Values of LUFs of 40 counties and districts in LXR.
Land 11 00897 g005
Figure 6. Spatial differentiation of LUFs.
Land 11 00897 g006
Figure 7. Quadrant diagram of LUFs.
Land 11 00897 g007
Figure 8. Types of dominant functions.
Land 11 00897 g008
Figure 9. Classification of coupling degrees.
Land 11 00897 g009
Figure 10. Governance zones of LUFs.
Land 11 00897 g010
Figure 11. Average value of status and trend index of EFV, SFV, DFV, and PFV.
Land 11 00897 g011
Table 1. Multi-functional evaluation indicator system and weight of indicators.
Functional LayerSituational LayerIndicator LayerIndicator Connotation or Calculation MethodIndex Weight
Agricultural production function (PF)StatusOutput value of primary industry PS1 (RMB 10,000)Reflecting the overall level of agricultural development in each county.0.0934
Area of cultivated land PS2 (hectares)Reflecting the supply capacity of cultivated land resources in grain production.0.1213
Planting area of crops PS3 (hectares)Reflecting the supply of land resources in the production of non-food crops in an indirect way.0.1286
Total grain output PS4 (tons)Reflecting the food supply situation.0.1566
TrendGrowth rate of output value of primary industry Pt1 (%)The average growth in the past five years, reflecting the agricultural development trend.0.0995
Grain yield growth rate Pt1 (%)The average growth in the past five years, reflecting the sustainable supply capacity of grain.0.0524
Change rate of land reclamation rate Pt1 (%)The average value of the last five years, reflecting the utilization efficiency and structural changes of land resources.0.1307
Change rate of grain supply–demand ratio Pt1 (%)To be calculated according to the grain output/(total population × 0.4) [58], reflecting the supply and demand of production.0.2173
Economic development function (DF)StatusGDP dt1 (RMB 10,000)Reflecting the overall economic development in each county.0.0978
Per capital GDP dt2 (RMB)Reflecting the output level of each county.0.0467
General budgetary revenue dt3 (RMB 10,000)Reflecting the economic operation efficiency.0.0972
Fixed-asset investment in urban area dt4 (RMB 10,000)Reflecting the urban economic development capacity.0.0576
Output value of tertiary industry dt5 (RMB 10,000)Reflecting the overall development level of the service sector.0.1314
Area of urban land dt6 (hectares)Reflecting the level of land use security for economic development.0.0693
TrendEconomic growth rate ds1 (%)The average growth rate in the past five years, reflecting the general trend of economic growth.0.0470
Growth rate of output value of tertiary industry ds2 (%)The average growth rate in the past five years, reflecting the growth trend of THE tertiary industry.0.0852
Per capita GDP growth rate ds3 (%)The average growth rate in the past five years, reflecting the sustainability of regional output and creativity. 0.0440
Growth rate of fiscal revenue ds4 (%)The average growth rate in the past five years, reflecting the economic operation trend.0.3135
Industrial structure ds5The proportion of total output value of second and third industries in GDP, reflecting the industrial structure evolution trend.0.0103
Social security function (SF)StatusPer capita balance of urban and rural residents wt1 (RMB)Reflecting the affluence of urban and rural residents.0.1039
Total retail sales of consumer goods per capita wt2 (RMB)Reflecting the improvement of social purchasing power, consumption level, and material and cultural life level.0.1385
Number of beds in health facilities for every 10,000 people wt3 (Nr.)The number of beds in health institutions/resident population, reflecting the medical and health level.0.0666
Basic education attraction wt4 (people)The number of primary and secondary students in school, reflecting the quality difference in basic education and education equity.0.0717
Transport network density wt5 (km/km2)The highway mileage/area of each county, reflecting the supporting capacity of transportation infrastructure to regional development.0.0707
Population urbanization rate wt6 (%)The urbanization rate of permanent population, reflecting the urbanization level.0.0487
TrendGrowth rate of permanent population ws1 (%)The average growth rate in the past five years, reflecting the regional population attraction0.0734
The change rate of employment in the secondary and tertiary industries ws2 (%)The accession rate of employment in secondary and tertiary industries over the last five years.0.2741
Income growth rate of urban and rural residents ws3 (%)Reflecting the improvement in the living standards of the residents.0.0503
Urban–rural income ratio ws4Reflecting the trend of integrated urban and rural development.0.1021
Ecological maintenance function (EF)StatusEcological service value et1 (RMB 10,000)The value of ecological service calculated by the reference [60]. 0.2589
Average ecological service value of land et2 (RMB 10, 000/km2)Ecological service value per unit area, reflecting the ability of ecological construction and level of ecological protection.0.0457
Forest coverage et3 (%)Reflecting the richness of forest resources and the status of ecological balance.0.1293
Carbon sequestration capacity of vegetation et4 (ton)The NPP value, reflecting the capacity of natural carbon sequestration and the positive impact of vegetation on the environment.0.0661
TrendBiological abundance index es1Calculations according to the land use type assignment: Abio × (0.35 × Sforst + 0.21 × Sgrassland + 0.28 × Swaters + 0.11 × Sfarmland + 0.04 × Sland for construction + 0.01 × Sunused land)/Sregion [61], reflecting the biological diversity and ecological governance level.0.1502
Green Development Index es2With the green development index and public satisfaction index in the annual evaluation results of ecological civilization progress used, reflecting the regional transformation and development, public participation, public perception, and ecological awareness 10.1303
Public satisfaction index es30.2195
Note: 1 Green development index and public satisfaction index are from the bulletin of annual evaluation results of ecological civilization construction in the Gansu and Qinghai provinces.
Table 2. Classification criteria for LUFs.
Classification CriteriaPFVDFVSFVEFV
Q1 = (n + 1)/40.1490.0690.2230.318
Q2 = (n + 1)/20.2240.0970.2710.436
Q3 = 3(n + 1)/40.4600.1920.4680.579
Table 3. Zoning methods for LUFs.
Dominant FunctionsClassification of Land Use Multi-Functional Index (M)Classification of Coupling Degree (C)Zoning RulesZoning Type
NoLowMedium, highM = low and C ≥ mediumOptimization and upgrading areas
MediumMedium, highM = medium and C ≥ mediumKey upgrading areas
YesLowLow, medium, highM = low and C ≥ lowPotential upgrading areas
Medium, highLowM ≥ medium and C = lowSynergistic optimization areas
Medium, highMedium, highM ≥ medium and C ≥ mediumModerate optimization areas
Table 4. Comprehensive index value of LUFs.
Counties/DistrictsIndex ValueCounties/DistrictsThe Index ValueCounties/DistrictsIndex ValueCounties/DistrictsIndex Value
Chengguan0.380Pingchuan0.078Jishishan0.086Minhe0.293
Qilihe0.281Jingyuan0.178Chengdong0.211Huzhu0.373
Xigu0.220Jingtai0.151Chengzhong0.273Hulong0.195
An’ning0.214Anding0.277Chengxi0.402Xunhua0.195
Honggu0.099Longxi0.165Chengbei0.262Haiyan0.183
Yongdeng0.138Weiyuan0.164Datong0.206Tongren0.148
Gaolan0.122Lintao0.184Hunagzhong0.327Jianzha0.180
Yuzhong0.196Linxia0.147Huangyuan0.147Gonghe0.260
Lanzhou New Area0.167Yongjing0.126Ledu0.294Guide0.138
Baiyin0.148Dongxiang0.096Ping’an0.261Guinan0.140
Publisher’s Note: MDPI stays neutral with regard to jurisdictional claims in published maps and institutional affiliations.

