1. Introduction
Global economies have been struggling to achieve sustainable development, especially with the increasing global climate change [
1]. To achieve their sustainability goals, countries should formulate development paths suited to their national conditions, according to the United Nations (UN) sustainable development goals (SDGs) framework. Currently, China has 34 provincial-level administrative regions, with significant regional differences. Therefore, it is necessary to develop different sustainable development paths and policies according to the ecological resource endowment of each region [
2]. Notably, the spatial distribution and development process of ecological resources is the foundation of sustainable development and their assessment can provide valuable insights to help countries and their regions set and achieve their individual sustainability goals [
3,
4].
Ecological resources refer to all the resources in the ecosystem that are used for the survival, reproduction, and development of organisms and human beings, including woodland, cultivated land, and grassland resources [
5,
6]. Current studies on ecological resources involve several aspects, including the evaluations of ecological resources and ecosystem services [
7]. Systematic ecological resource assessment starts from the ecosystem service classification system constructed by Costanza et al. (1997), who identified 16 ecosystem types and 17 ecosystem service functions on a global scale to further estimate the value of ecological resources [
8]. Then scholars introduced land use into ecological resource assessment, and explored the interrelationship between ecology and economy, culture, and urban development [
9,
10,
11,
12]. The research methods of ecological resource development are also diversified, such as econometric, spatial analysis, and machine learning [
5,
6,
13,
14,
15,
16]. Ecosystem service types can be grouped into nine categories, by calculating the equivalent value of ecosystem services per unit area of six types of China’s terrestrial ecosystems [
17]. In addition, the categories of ecosystem services have been constantly improved, such as water supply having been added to the supply service, and environmental purification having been added to the regulation service [
18,
19,
20]. Some scholars estimated the ecosystem service value of China’s land, grassland, surface water, and plateau, respectively, based on the ecosystem service value equivalent factor table [
21,
22,
23,
24,
25]. Due to the rise of remote sensing technology in recent years, the estimation of the ecosystem service value has become diversified and multiscale [
11,
14,
26]. However, the ecosystem service value method is controversial; for example, there are huge differences in the accounting results obtained using different methods, the ecological resource accounting results vary widely in different regions, and the actual value of ecological resource cannot be accurately reflected [
27,
28,
29,
30]. According to the background of ecological environment quality, the degree of human influence on the ecological environment, and the suitability of humans to the ecological environment, a multiscale ecological environment quality evaluation has been conducted [
10,
26,
31,
32,
33].
In general, most of the existing studies on ecological resources focus on ecosystem service value and ecological environment quality. The distribution of ecological resources has significant spatial heterogeneity and regional characteristics [
2]. Thus, spatial differences have a certain degree of impact on the quality of the ecological environment and the choice of sustainable development paths [
2,
17,
34]. Therefore, it is important to explore the spatiotemporal distribution patterns and characteristics of ecological resources from a regional perspective. In line with this requirement, we selected Guizhou Province in China to assess the development characteristics and spatial pattern of regional ecological resources to provide valuable insights for the region’s sustainable development.
Guizhou has natural advantages, including ecological resources and value and forest and grassland resources. However, the regions experience a few shortcomings regarding the development of ecological resources, such as uneven spatial and temporal distribution and strong ecological environment heterogeneity in different regions, which undoubtedly pose challenges for the protection, development, and rational utilization of ecological resources. Notably, the ecological environment protection and sustainable development of Guizhou can serve as an important reference value for other provinces in central and western China. However, it is challenging to plan a clear development path for the ecological resources in Guizhou Province and other regions. Based on the ecological resource data of mountains, water, forests, fields, and lakes in Guizhou Province, in this study, we adopted the entropy and spatial analysis methods to explore the spatiotemporal distribution and evolution characteristics of the ecological resource in the province. In particular, we provided a reliable decision-making basis for the sustainable and high-quality development of Guizhou Province, which can be used as a peer reference for similar regions.
The rest of the article is structured as follows:
Section 2 describes the methods and data sources. In
Section 3, we have presented the application results, and, finally, in
Section 4, we have summarized the major conclusions and policy implications of our study.
2. Materials and Methods
2.1. Study Area
Guizhou Province (24°37′–29°13′ N, 103°36′–109°35′ E) has a total area of 176,200 km
2. As the hinterland of the inland region of southwest China, Guizhou Province is a transportation hub and an important part of the Yangtze River Economic Belt (
Figure 1). As of 2021, Guizhou had a total of six prefecture-level cities and three autonomous prefectures, with a resident population of 38.5621 million. The regional gross domestic product (GDP) is as high as RMB 1676.934 billion, of which the added values of the primary, secondary, and tertiary industries are RMB 228.056, 605.845, and 843.033 billion, respectively. The topography of Guizhou is high in the west and low in the east, and it slopes from the center to the north, east, and south.
2.2. Research Methods
This study adopts a hybrid method to identify and evaluate the spatio-temporal pattern and development characteristics of ecological resources in Guizhou Province. The research design is shown in
Figure 2.
2.2.1. Constructing Ecological Resource Evaluation Index System
The core of ecological resources consists of mountains, water, forests, fields, lakes, and grass [
35]. According to the principles of representativeness, integrity, validity, and scientificity, and based on the actual situation of Guizhou’s ecological resource, in this study, we used woodland resource as the evaluation index of “mountains” and “forests”, water resource as the evaluation index of “water” and “lakes”, cultivated land resources as the evaluation index of “fields”, and grassland resources as the evaluation index of “grass”. The evaluation indicators are shown in
Table 1.
2.2.2. Entropy Method
The entropy method is an objective weighting method that determines the weight of an indicator by judging the dispersion degree of the indicator [
36]. The higher the weight of the indicator, the greater the impact of the indicator on the comprehensive measure and the stronger the representativeness. In this study, the entropy method was used to calculate the cultivated land, woodland, grassland, and water resources. The main steps are explained below:
(1) Four indicators of nine regions in Guizhou Province were selected. The original data matrix = was determined, where the value of the -th index of the -th sample can be expresses as ( = 1, …, ; = 1, …, 9).
(2) The data standardization (homogenization of heterogeneous indicators) applied in this study is explained below:
Positive indicator calculation method: = ( − min)/(max − min).
Inverse indicator calculation method: = (max − )/(max − min).
The proportion of the -th evaluation object under the -th index sample was calculated using the following equation: = /.
The information entropy of the -th index was calculated as follows: = , k = , 0 ≤ ≤ 1.
The information entropy redundancy was calculated using the following equation: = 1 − .
The weight of the -th indicator was calculated as follows: = /.
The single-index evaluation score was calculated as follows: = .
The ecological resource level score of the -th city was calculated using the following equation: = .
In this study, indicator weights were determined based on their importance to the index. Notably, as we used the entropy method to calculate the weights, the ecosystem characteristics of Guizhou Province were slightly adjusted. The calculation results of the weights and sub-weights of each index are shown in
Figure 3. The weight of grassland resources was 32%, which was a key factor in measuring the total amount of ecological resources. Due to severe rocky desertification, in Guizhou, grassland resources, which act as an important ecological barrier to prevent rocky desertification and soil erosion, are relatively scarce. The weight of cultivated land resources was calculated as 27%. As food security is an important guarantee for national security, cultivated land resources are crucial for ensuring national food security and farmers’ long-term livelihoods. The weight of woodland resource was 21%, which ranked third among all the resources analyzed in our study. As a natural and strategic resource of national resources, woodland has several important functions, such as water conservation, climate regulation, and environmental improvement, with extremely high ecological service value. In this study, the weight of water resource was 20%; water resource is the basis of ecology and crucial for maintaining ecosystems.
2.2.3. Kernel Density Analysis
Kernel density estimation is a spatial analysis method used to calculate the density of a feature in its surrounding neighborhood [
37]. The kernel density function can be used to calculate the density contribution of each grid cell within a specified range (a circle with a radius of a certain value) for each known point [
38,
39,
40]. In this study, we use the extraction and analysis tool of ArcGIS to extract cultivated land, grassland, woodland, and water. Convert each index from grid to point by the conversion tool, then use the spatial analysis tool “kernel density” to calculate each feature point within Guizhou Province. Notably, the relative density grades in Guizhou were divided, which reflected the spatiotemporal evolution trend of the province’s ecological resource concentration density. The higher the level of kernel density, the greater the density of ecological resource space distribution. Thus, the kernel density of the region can be expressed as follows:
where
is the kernel density calculation function at the spatial position
;
is the range radius;
is the number of known points in the analysis range; and
is the default weight kernel function. Kernel density estimation assigns different weights to different points in the region; the closer the estimation is to the center point, the higher the weight. Thus, through kernel density estimation, the distribution pattern of different ecological resources in Guizhou Province were visualized clearly, with strong scientific and persuasion.
2.2.4. Quantifying the Indicators of Ecological Resource Change
In this study, we used the annual rate of change index to comprehensively measure the rate of change and intensity of an ecological resource during a certain period. The annual change rate,
, reflects the annual growth rate (annual decline rate) of an ecological resource indicator corresponding to period
. The formula used to calculate the ecological resource indicator,
, can be expressed as follows:
2.2.5. Coefficient of Variation
The coefficient of variation is the percentage of the sample standard deviation to the mean, which can be expressed as follows:
where
represents the coefficient of variation. The ecological resource score coefficient of variation is a relative quantity that describes the degree of variation in the ecological resource score. The larger the value of
the more dramatic the interannual variation in the ecological resource score, and the smaller the value of
the less significant the interannual variation.
2.3. Data Sources
Our study period was 2000–2020 and we used the Landsat (TM5\TM7\TM8) images from five years (2000, 2005, 2010, 2015, and 2020) generated through manual visual interpretation, with a spatial resolution of 1 km × 1 km. The administrative division data of the study area comes from the Chinese administrative division data of the Resource and Environment Data Center of the Chinese Academy of Sciences (2015). The land-use data were acquired from the Resource and Environment Data Center of the Chinese Academy of Sciences (
https://www.resdc.cn/Datalist1.aspx?FieldTyepID=1,3, accessed on 1 May 2022). They include 6 first-class land types such as cultivated land and woodland and 24 s-class land types such as paddy field and dry land. The cultivated land, woodland, grassland, and water involved in this study are obtained by using GIS raster reclass tool, the area data of cultivated land, woodland, grassland, and water in various cities in Guizhou Province were extracted using the calculate areas tool, and the data unit was km
2 (
Table 2). The kernel density analysis uses the remote sensing monitoring spatial distribution data of land-use types in China in 2020, with a spatial resolution of 1 km × 1 km, and the output pixel size of kernel density analysis is 500.
3. Results
3.1. Development Characteristics of Ecological Resources
To further analyze the spatial distribution characteristics of Guizhou’s ecological resource in different periods, we selected five important nodes, namely 2000, 2005, 2010, 2015, and 2020.
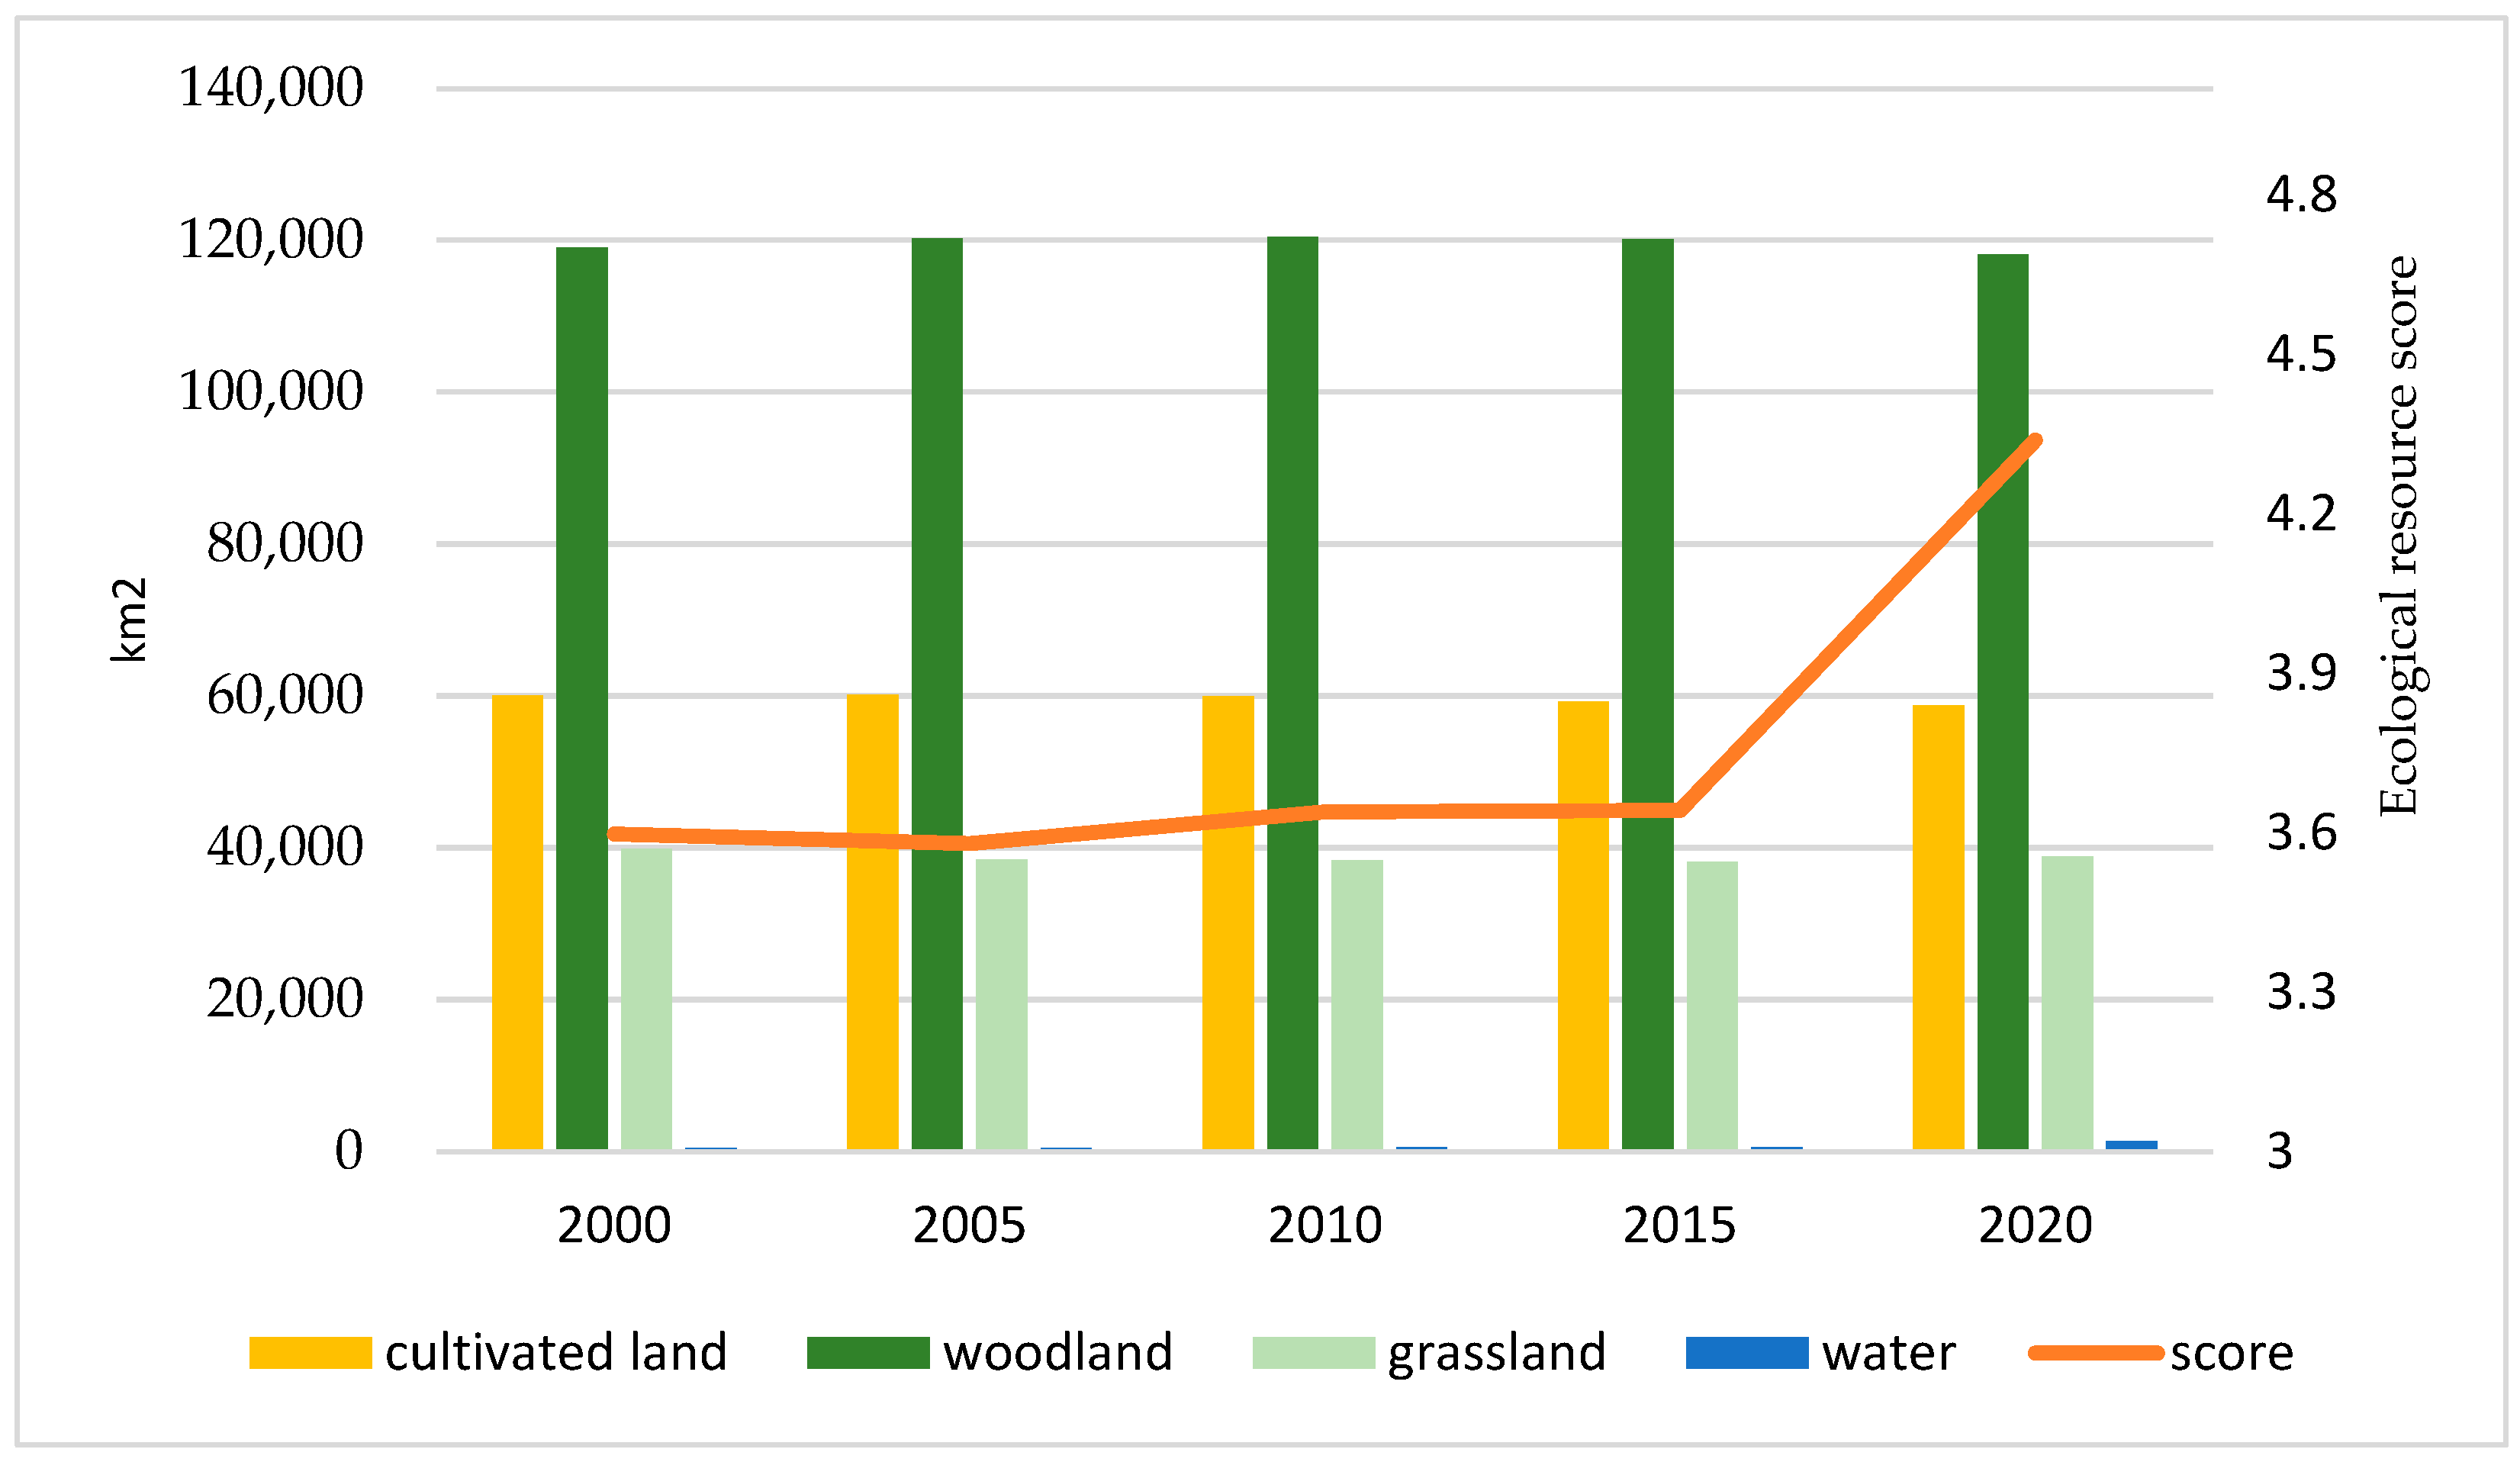
Figure 4 portrays the prevalent conditions of Guizhou’s ecological resource. According to our analysis, Guizhou’s ecological resource scores in 2000, 2005, 2010, 2015, and 2020 were 3.6, 3.58, 3.63, 3.64, and 4.34, respectively. The ecological resource could be divided into three phases, namely, degenerative (2000–2005), recovery (2005–2015), and development (2015–2020). During 2000–2005, Guizhou’s ecological resource score dropped from 3.6 to 3.58; the grassland resources were greatly reduced (by 1350 km
2). This was mainly due to rapid urbanization in Guizhou Province and an increase in the intensity of anthropological activities during the period. Moreover, during this period, grasslands were transformed into cultivated or construction land, resulting in the deterioration of the ecological environment.
During 2005–2015, Guizhou’s ecological resource scores portrayed an upward trend. Among them, water resources portrayed a significant increase. Grassland and cultivated land continued to decline, and the woodland area portrayed a fluctuating downward trend. Although the deterioration of the ecological environment slowed down, the situation was still grim.
During 2015–2020, the score of Guizhou’s ecological resources increased significantly, with an increase of 19.2%. Among them, cultivated land and woodland portrayed a downward trend, while water and grassland resources portrayed an upward trend. Notably, the water resource score increased by 135%, and the ecological resource situation improved significantly. This may be because the Third Plenary Session of the 18th Communist Party of China (CPC) Central Committee promoted the construction of ecological civilizations. Thus, large-scale planting of trees and grasses in Guizhou Province improved the water conservation capacity of the region and alleviated soil erosion.
As shown in
Figure 5, the ecological resource scores of nine cities in Guizhou Province from 2000 to 2020 portrayed an increasing trend, with significant differences. Among them, Anshun City exhibited the largest growth, at 43%, followed by Liupanshui City, with an increase of 37%. Tongren City portrayed the least increment, at 13%. The ecological resource score coefficient of variations in 2000, 2005, 2010, 2015, and 2020 were 0.612, 0.611, 0.602, 0.601, and 0.589, respectively. The coefficient of variation continued to decrease, indicating that the differences in the ecological resources among the nine cities in Guizhou Province continued to decrease.
During the running-in stage from 2000 to 2015, the ecological resources of the nine cities portrayed small changes, but strong fluctuations. In addition to the persistent changes in southwest Guizhou and Liupanshui, we observed that Anshun, southeast Guizhou, and Zunyi portrayed a volatile upward trend, and Bijie, Guiyang, Qiannan, and Tongren exhibited a volatile downward trend. The main reason could be that, during this period, the industry was in a transitional period of transformation and upgrade. Notably, high-consumption and high-pollution development methods have been applied continuously to date and, thus, the stability of ecological resources is relatively weak.
The period from 2015 to 2020 marked the rapid development of ecological resources of the province. The ecological resources of the nine cities all portrayed an upward trend, with obvious changes. During this period, Liupanshui City experienced an increase of 41.5%, followed by Anshun City, which experienced an increase of 39.7%. Notably, at this stage, the construction of ecological civilization was vigorously promoted. Additionally, to enhance the sustainable development of economic development and ecological excellence, green industries having low energy consumption, low emission, and high utilization rate were developed.
3.2. Spatial Distribution and Classification of Ecological Resources
3.2.1. Multiscale Spatial Distribution Characteristics of Ecological Resources
Through ArcGIS, we were able to visualize the spatial pattern characteristics of Guizhou’s ecological resource in 2000, 2005, 2010, 2015, and 2020 (
Figure 5). The ecological resource score can be divided into three levels using natural breaks method: less-developed, 0.1–0.13; relatively enriched region, 0.13–0.36; and enriched regions, 0.36–0.81, which are showed in the colors of light green, medium green, and dark green, respectively, in
Figure 6.
At the provincial scale, Guizhou’s ecological resources portrayed significant uneven distributions. We observed great differences in the ecological resource scores and the variety between regions was significant as well. The spatial distribution of Guizhou´s ecological resource was shown to be heterogeneous in the north and south and more homogeneous in the middle regions. The enriched and relatively enriched regions were mainly concentrated in the north and south of Guizhou Province, while the less-developed region was mainly distributed in the middle of the province. Guizhou’s ecological resources were dominated by woodland resources (accounting for 54% of the total resources), with an area of 119,570 km2. In terms of spatial distribution, woodland resources were more commonly distributed in the east than the west, followed by the cultivated land resources (accounting for 27% of the total resources), with an area of 59,608 km2, with the spatial distribution being more in north, followed by the southern and central regions. Notably, the spatial distribution of grassland resources was relatively scarce (only 17.7% of the total resources), with an area of 38,763 km2, exhibiting higher spatial distribution in the south than the north. Water resources accounted for the least score (0.3%), with an area of 702 km2, even though Guizhou is rich in hydropower resources (due to steep river slopes, large natural drops, and high water-production modulus).
In terms of the urban scale, the distribution levels of ecological resources in the nine prefecture-level cities of Guizhou province in 2000, 2005, 2010, 2015, and 2020 were stable, without any change, which are shown in the histogram in
Figure 5. Bijie, Zunyi, Qiannan, and southeast Guizhou were enriched regions. Among them, Bijie had the most abundant cultivated land and grassland resources in Guizhou Province, accounting for 19.6% and 20% of the province, respectively. This was followed by Zunyi, which also had rich cultivated land and woodland resources; the city also had the most abundant woodland resources in the province. In 2020, the woodland area of Zunyi City was 25,147 km
2, accounting for 21.3% of the province. Tongren and southwest Guizhou were relatively enriched regions. Guiyang, Anshun, and Liupanshui were less-developed regions with respect to ecological resources, with Liupanshui’s ecological resources being the scarcest. With an ecological resource score that ranks last all year round, Liupanshui is the “ecological resource subsidence area” in Guizhou Province. Additionally, the cultivated land, woodland, and grassland resources in Guiyang City were relatively scarce, with the five-year averages being 2842, 4937, and 1907 km
2, respectively. Moreover, the cultivated land and grassland resources continued to decline.
3.2.2. Classification Characteristics of Ecological Resources
To analyze the pattern and characteristics of the distribution of Guizhou’s ecological resources, kernel density estimation was used to identify the spatial pattern of cultivated land, woodland, grassland, and water in the province in 2020. Our study provides a clear understanding of the spatial distribution characteristics of different types of ecological resources in the province. Notably, the distribution could be divided into high, medium, and low-density regions, as shown in
Figure 7.
As shown in
Figure 7a, Guizhou Province consisted of cultivated land, with medium density regions. The high-density regions were mainly distributed in the northern and central regions, namely the Dafang, Jinsha, and Qianxi counties in Bijie City, Zheng’an County in Zunyi City, Anshun City, and Anlong County in southwest Guizhou. The cultivated land areas with low density regions were mainly distributed in the southern and eastern parts of the province.
As shown in
Figure 7b, Guizhou Province consisted of woodland resources, with medium density regions. The high-density regions were distributed in the Dalou Mountains in the north, Miaoling Mountains in the south, and Wuling Mountains in the northeast of the province. The low-density regions were mainly distributed in the western part of the province, namely the central part of southwest Guizhou, northern part of Anshun, and southern part of Bijie.
As shown in
Figure 7c, Guizhou Province consisted of grassland resource with low-density regions. The high- and the medium-density regions were mainly distributed in the Wumeng and Weining County grasslands in the west of the province.
As shown in
Figure 7d, Guizhou Province mostly consisted of water resources with low-density regions. Medium- and high-density regions were scattered in the central and eastern parts of the province, namely the Yangtze River and Pearl River basins.
3.3. Development Assessment of Ecological Resources
3.3.1. Ecological Resources Development Evaluation in Guizhou
In the process of ecological resource development, Guizhou Province portrayed a continuously improvement in the resource development and construction model, owing to the changes in the previous resource-dependent primary development model to improve the quality of ecological resource development. However, the degree of development and utilization of Guizhou’s ecological resources is still low. Some ecological resource development plans pay attention only to the economic benefits of ecological resources, while ignoring their service value. Notably, the province experiences many problems, such as high input, consumption, pollution, and low efficiency. Notably, due to the region’s geological conditions, the topography of Guizhou has the characteristics of high and steep slopes and large drops, which contribute to mountain damage, exposure of rocks, and vegetation destruction in the region. In addition, during the development process, many harmful substances enter the surface water bodies, farmland, and underground aquifers, resulting in serious land and groundwater pollution in the surrounding area. As Guizhou mostly consists of karst landforms, with a complex geological structure and fragile geological environment, indiscriminate mining and excavation in the region, along with backward development methods, can result in underground goafs. Notably, ground and slope excavation can affect the stability of mountains and slopes and change the geological structure of the region, which may, in turn, result in geological and environmental problems, such as surface subsidence, mountain cracking, collapse, landslides, and debris flows, and additionally, induce various geological disasters.
3.3.2. Ecological Resource Development Evaluation of Major Cities
Ecological resources, such as woodland, grassland, and water bodies, in Guiyang City account for 65% of the urban area, and karst landforms render unique landscape features and geographical patterns to the region. With its beautiful ecological environment, peculiar topography, and suitable climate, Guiyang City has taken great efforts to improve tourism in the region and build a strong ecotourism brand. In general, cultural resources gradually transform into tourism resources, and the in-depth integration and development of cultural tourism is thus catalyzed.
Guiyang City is named the best ecotourism destination in China. In 2019, Guiyang City’s domestic and foreign tourists numbered ~229 million, and tourism revenue reached RMB 309.8 billion, with an increase of more than 21% (domestic) and 26% (foreign). In addition, inbound tourists exceeded 700,000 (up 30%) and continued to portray a “blowout” growth trend. Notably, Guiyang City is rich in mineral resources, particularly bauxite (largest in the country). However, the city experiences serious issues related to extensive mineral development and ecological restoration, which has a negative impact on the ecological environment of the region. For example, 12 of the 14 green mines in Xiuwen County suffer from serious ecological damage or lag in ecological restoration. Among them, some areas of the Luohanpo sand and gravel mine of the Sunshine Sand and Gravel Factory have been criticized by the central ecological and environmental protection inspection team for inadequate ecological restoration measures (e.g., covering soil and greening, laying green dust nets, hanging plastic leaves, and other false rectifications).
Zunyi City has abundant cultivated land resources. In 2020, Zunyi City had 2,018,700 tons of grain production (25% of the total output of Guizhou Province), including 544,500 tons of potato production, 1,379,800 tons of grain production, and 94,300 tons of bean production, Therefore, Zunyi City is known as the “granary of northern Guizhou”. Recently, Zunyi City vigorously promoted the development of high-quality agriculture and the upgrading of infrastructure to improve the level of agricultural mechanization, agricultural production conditions, comprehensive grain production capacity, and risk resistance. In recent years, the grain yield per mu of Zunyi City has been at the highest level historically. Among them, the average yield of rice per mu is as high as 425 kg. However, in our study, both the grain area and production in Zunyi City portrayed a downward trend. The grain area of Zunyi City in 2020 was 564,800 hectares, which portrayed a decrease by 71,000 hectares (11.2%) compared to 2016, with an average annual decrease of 2.9%. Moreover, grain output dropped from 3,339,900 tons in 2010 to 2,018,700 tons in 2020, with an output reduction of more than 1 million tons. Notably, due to the decline in the quality of cultivated land, serious arrears in farmland infrastructure, and unreasonable fertilization structure, problems such as decline in soil fertility and serious pollution of grain fields have become increasingly prominent.
With a relatively weak ecological background, Liupanshui City portrayed the lowest five-year average score for ecological resources. In recent years, Liupanshui vigorously implemented land greening, which increased the forest area from 5.5 million mu in 2010 to 9.22 million mu, and the forest coverage rate increased from 37% in 2010 to 62%. However, Liupanshui City, which is located in the ecologically fragile area of the southwest karst region, experienced prominent population–resource–environment contradiction, as well as serious soil erosion and rocky desertification. In 2020, the soil erosion area of Liupanshui City was 3557.19 km2, accounting for 35.88% of the city’s national land area. The four counties and 95 towns and towns in the city all have rocky desertification to varying degrees, with the total rocky desertification area being 3265 km2, accounting for 32.94% of the city’s land area. Additionally, Liupanshui City has abundant coal resources. Additionally, the presence of other high-energy-consumption and high-pollution industries, such as metallurgy, chemical industry, and coking, can cause serious environmental pollution and ecological deterioration in the region. In particular, waste, waste gas, and solid waste have caused great damage to the ecological environment. In 2019, Liupanshui City discharged 466.81 million tons of industrial wastewater, ranking second in the province, after Guiyang City. Additionally, in 2019, Liupanshui City’s industrial exhaust emissions were 267.7 billion m3, ranking second in the province, after Bijie City; moreover, Liupanshui City’s industrial solid waste generation amounted to 31.03 million tons, ranking first in the province.
4. Discussion
Taking Guizhou Province as a typical case, this study analyzes the spatial distribution and evolution characteristics of ecological resources at the mesoscale using a hybrid method of spatial analysis and index evaluation, and draws some novel findings that are different from the macro and micro perspectives [
7,
31,
32,
41] and the methods of economics, management, and ecology [
14,
32,
41,
42].
Guizhou’s ecological resources in 2000–2020 were divided into three phases, namely, degenerative (2000–2005), recovery (2005–2015), and development (2015–2020). The ecological resources portrayed an evolution trend of an initial decline, followed by a sharp rise. Our results revealed that, over the course of 20 years, the ecological resource scores for all nine cities in the province increased. The continuously decreasing coefficient of variation indicated that the differences in ecological resources among the nine cities continued to decrease, with scores portraying a decrease from 3.6 to 3.58 during 2000–2005. Among them, grassland resources decreased relatively more. From 2005 to 2015, the score of Guizhou’s ecological resource portrayed an upward trend. The water resources increased substantially, grassland and cultivated land areas continued to decline, and woodland areas exhibited a fluctuating downward trend, while portraying a slowing trend in the deterioration of the ecological environment. In 2015–2020, the score of Guizhou’s ecological resources increased rapidly (by 19.2%). The cultivated land and woodland areas portrayed a downward trend, while water and grassland resources exhibited an upward trend. Notably, water resources increased by 135%, indicating a significant improvement in the ecological resource conditions.
Guizhou’s ecological resources were mainly composed of cultivated land, woodland, grassland, and water resources, accounting for 93% of the land area of the province. Among them, woodland resources were the most abundant, accounting for 55% of the total resources, followed by cultivated land resources, which accounted for 27%, and grassland and water resources, which accounted for 17% and 0.3% of the total resources, respectively. The spatial distribution of Guizhou’s ecological resource presented a “high in the north and south and low in the middle” pattern. The enriched and relatively enriched regions were mainly concentrated in the north and south of Guizhou Province, and the less-developed region was mainly distributed in the central part of the province.
There were various types of land use in Guizhou Province, with agriculture being the predominant type. Consequently, there were obvious regional differences in the land-use structure. The cultivated land high-density region was mainly distributed in the northern and central areas of Guizhou Province. The woodland high-density region was distributed in the eastern part in a “scattered and mosaic style”. The grassland high density regions were sporadically distributed in western Guizhou Province. The water resource high-density region was mainly distributed in the central and eastern parts of the province.
Over the last few years, Guizhou Province has improved the resource development and construction mode, as well as the quality of ecological resource development, to improve the region’s ecological environment. However, the degree of development and utilization of the ecological resources in Guizhou Province is still low; most of the ecological resource development plans pay attention only to the economic benefits of the ecological resources and ignore their service values. Notably, in the process of ecological resource development, there are serious ecological damages, and untimely restoration is also common.
Local governments across China are making great efforts to promote ecological civilization and high-quality development. Assessment of ecological resources is the basic work for an ecological civilization. The framework of ecological resource assessment based on the hybrid method constructed in this paper, which not only visualizes the spatial distribution characteristics of ecological resources, but also reveals the evolution process and development potential. The case study in Guizhou proves that the framework can be adopted in other regions.
5. Conclusions and Policy Implications
In the context of ecological civilization and sustainable development, in this work, we selected Guizhou Province as our study area and used a spatial analysis method to quantitatively evaluate the distribution pattern and evolution characteristics of the ecological resource development in the region, based on the data from 2000, 2005, 2010, 2015, and 2020; additionally, we developed an index system to distinguish the cultivated land, woodland, grassland, and water resources in the region. This study found that the ecological resources in Guizhou province have been improved and ecological protection has achieved preliminary accomplishment. The spatial distribution of Guizhou´s ecological resource was shown to be heterogeneous in the north and south and more homogeneous in the middle regions. However, the development and utilization degree of ecological resources is still low, and the ecological damage is serious. The Chinese government has put forward the strategy of building an ecological civilization. This study attempts to develop a framework for assessing regional ecological resources as a basis for an ecological civilization and sustainable development. Therefore, this study can be used as a scientific reference by decisionmakers to develop new regulations for ecological resources protection and sustainable development in China.
Based on the findings of this study, we propose the following policy suggestion. On the one hand, there are significant ecological resource differences among different regions in Guizhou Province. Therefore, it is necessary to choose different development models according to the local conditions. For areas with fragile ecological environments and serious soil erosion and rocky desertification, such as Liupanshui, it is necessary to increase investments to promote ecological protection, replace unreasonable development methods, enhance the monitoring of soil erosion and rocky desertification, and implement reasonable engineering, biological, water storage, and soil conservation measures. For areas that experience a decline in woodland resources, such as Anshun, it is necessary to strengthen forest development and management, promote the ecological industrialization and industrial ecologicalization in forestry, build an effective market platform, stimulate the vitality of forestry ecological growth, and improve the responsibility and work systems of forest managers, while implementing relevant policies that can benefit and strengthen forests. As the food production bases in Guizhou, the cultivated land of Bijie and Zunyi has been greatly reduced in recent years. In response to this, it is necessary to coordinate and implement the three control lines of the ecological protection red lines, permanent basic farmland, and urban development boundaries, and coordinate and resolve spatial conflicts. In addition, the relationship between the policy-driven reduction in cultivated land and the improvements in cultivated land and food quality should be emphasized and studied further. In urban areas, with the improvement of living standards, people’s demand for sufficient, high-quality, and pollution-free food has increased. Thus, there is a need to focus on improving the quality and efficiency of agriculture. For example, cities, such as Bijie and Zunyi, should promote the integration of primary, secondary, and tertiary agricultural industries, develop high-quality green industries, and promote the industrialization of modern agriculture. Additionally, areas, such as Guiyang and Anshun, should continue to practice the concept of green development that prioritizes ecology, optimize the relationship between ecological environment and economic development, carry out ecotourism, and build health centers and green projects. With respect to the development of green tourism, the local cultural characteristics should be considered to realize the ideal combination of culture and tourism. For example, Guiyang can integrate its traditional culture into ecotourism. Zunyi can use the brand effect of Guizhou’s tea to apply tea culture to the integrated mode of tea tourism, and southwest Guizhou and Qiannan can combine the culture of ethnic minorities, such as Miao and Buyi, in their tourism.
On the other hand, it is imperative to protect ecological resources. Through measures such as soil and water conservation, biodiversity protection, and ecological restoration, green ecological corridors can be developed. Additionally, to improve the quality and stability of ecosystems, it is necessary to manage landscapes, forests, fields, lakes, grasses, and sand systems, strengthen land-use and spatial planning, while ensuring land-use control, delineating various red lines, building natural reserve systems, increasing investment in ecological protection and restoration, and improving ecological protection compensation mechanisms. In terms of ecological environment protection systems, various ecological civilization systems are established and improved in accordance with the ecological environment of Guizhou Province so as to exert the effectiveness and efficiency of the system and realize the legalization, scientificization, precision, and efficiency of ecological environment protection in Guizhou Province. Regarding the supervision of the ecological environment, there is a need to strengthen the construction of the supervision system, while ensuring that the ecological environment supervision agencies maintain and provide optimal resource guarantee, capacity-building, and legal supervision levels. Additionally, the accountability of government departments and regulatory agencies is crucial for developing effective plans for ecological resource preservation and development.


