
Temporal and Spatial Evolution Characteristics and Its Driving Mechanism of Land Use/Cover in Vietnam from 2000 to 2020

 ,
,  ,
,  and
and
Abstract
:1. Introduction
- (1)
- What are the spatio-temporal patterns of land use/cover in Vietnam during the period 2000–2020?
- (2)
- What are the main drivers of land-use/cover change in Vietnam from 2000 to 2020?
- (3)
- What are the uncertainties in the analysis of land-use/cover change in Vietnam?
2. Data and Methods
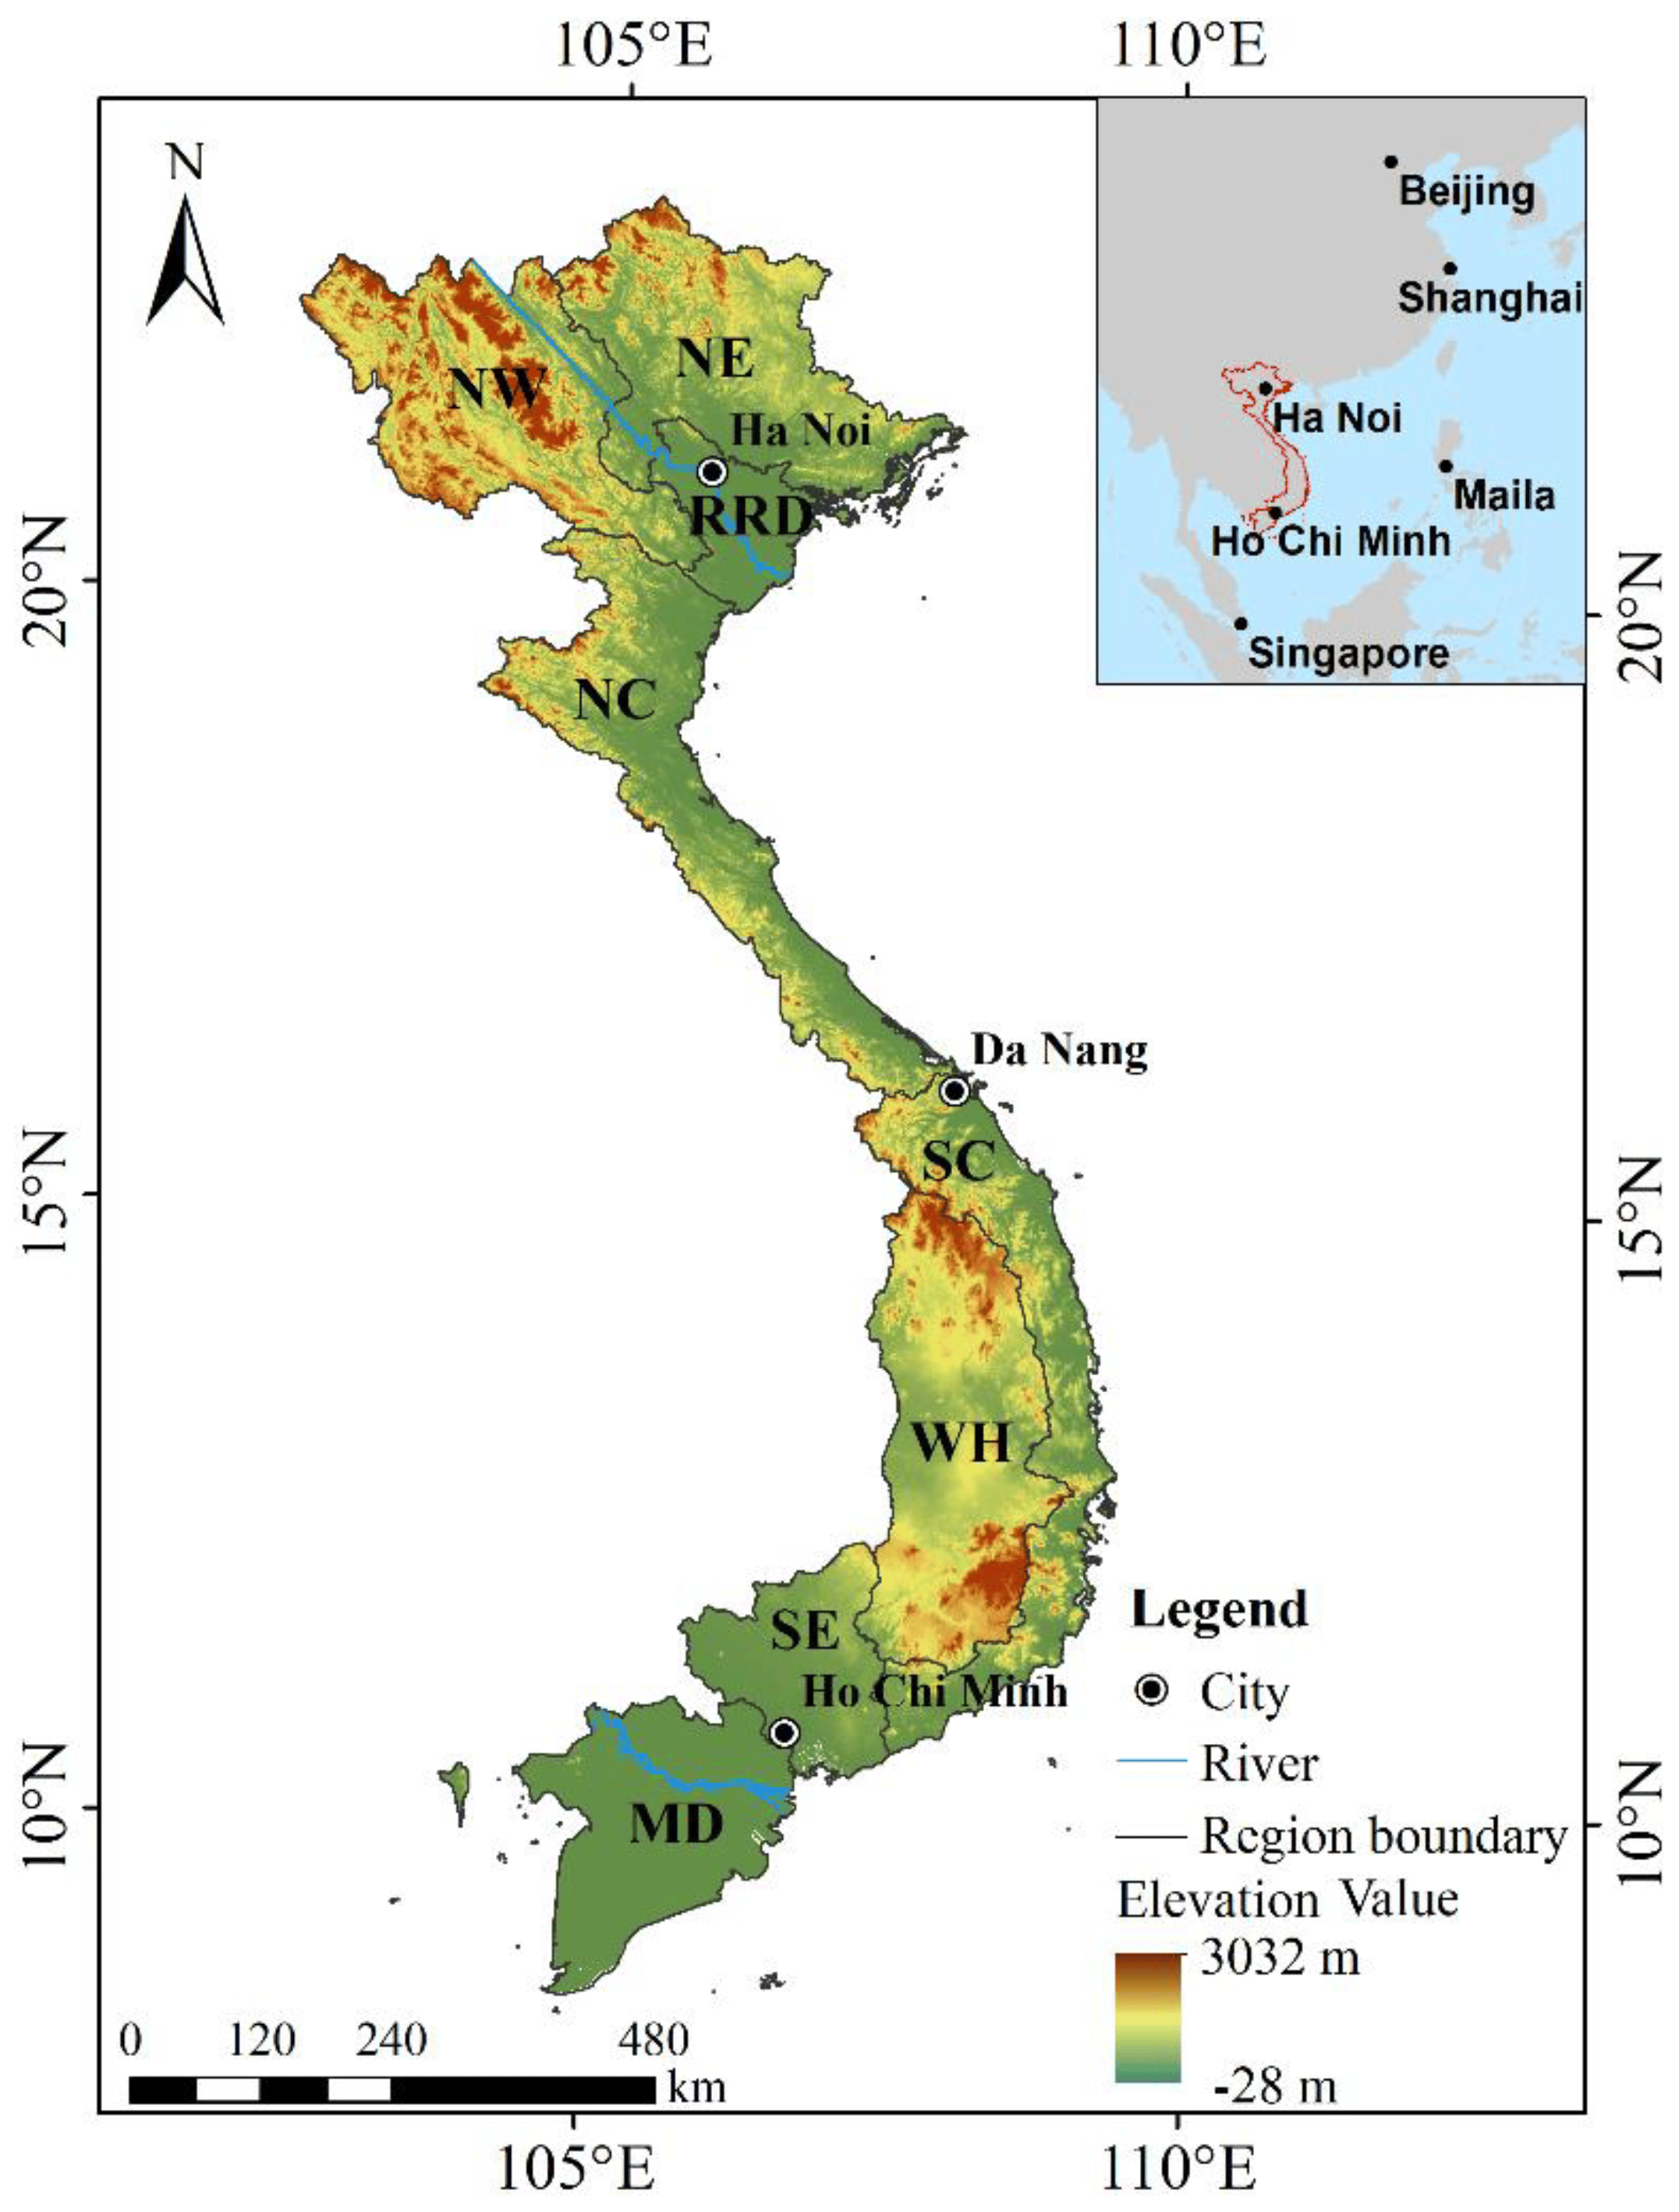
2.1. Study Area
2.2. Data Sources
2.3. LULC Analysis Method
2.4. Analysis of Driving Mechanism
3. Results
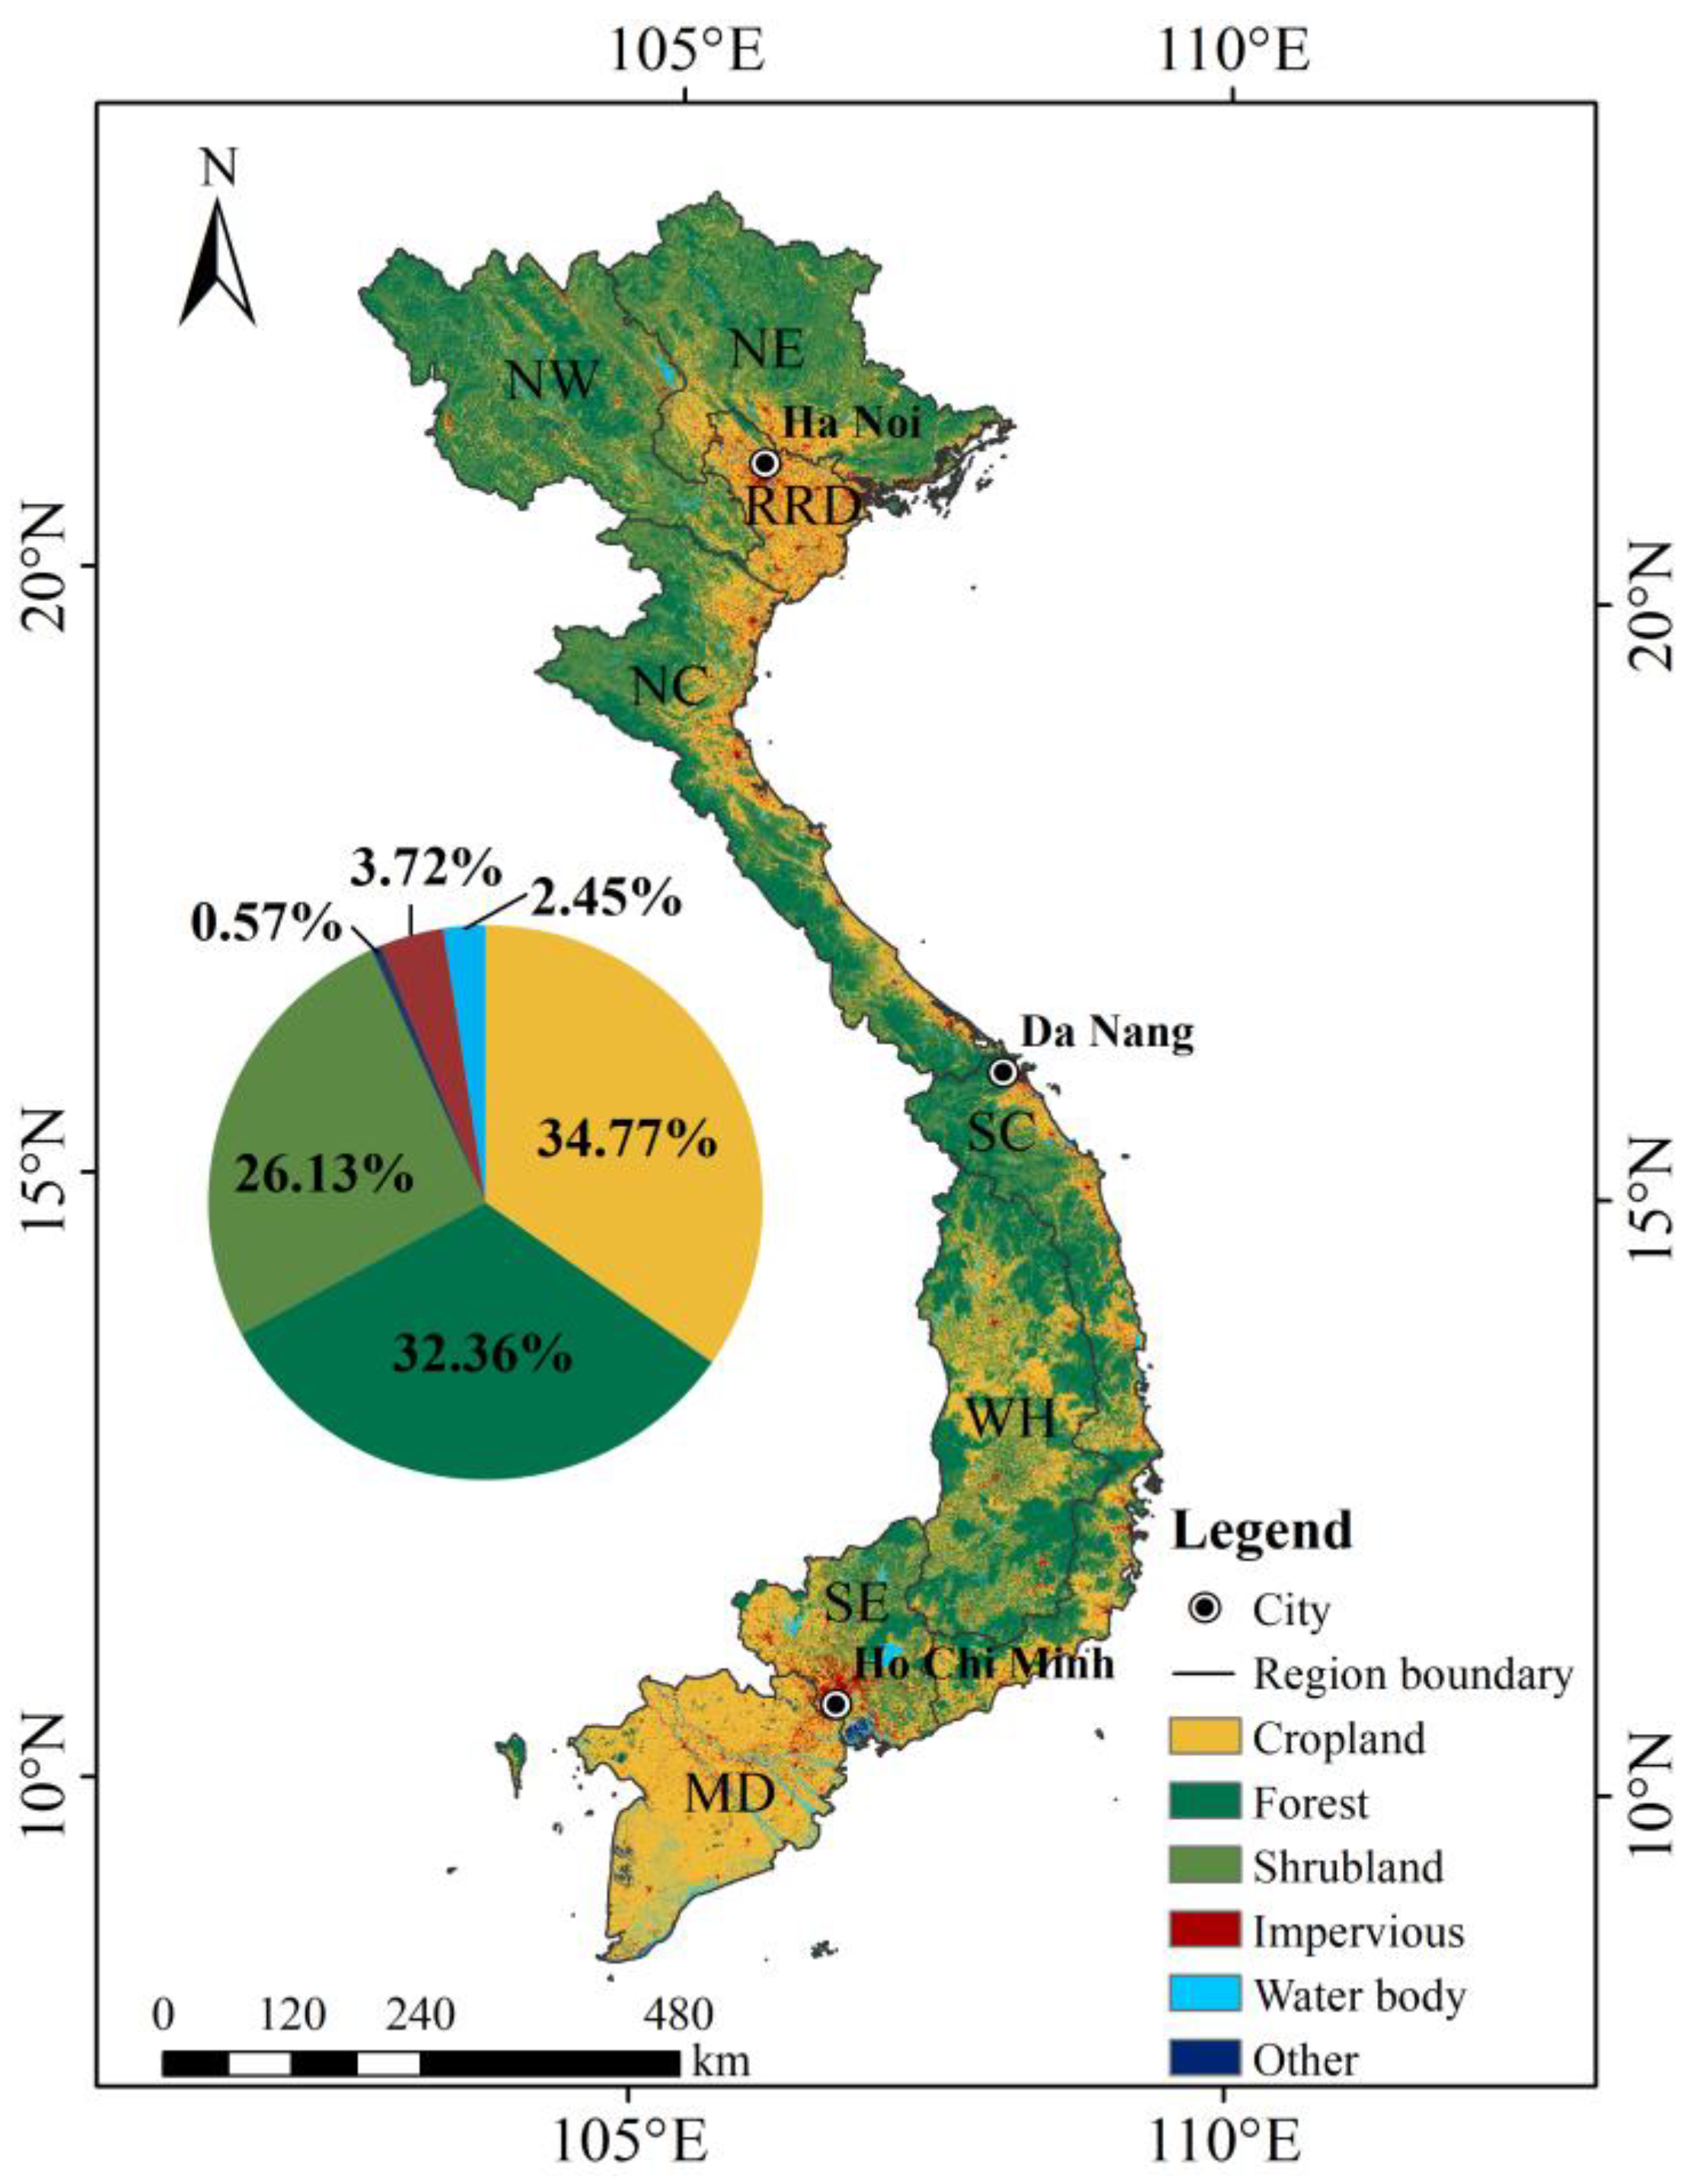
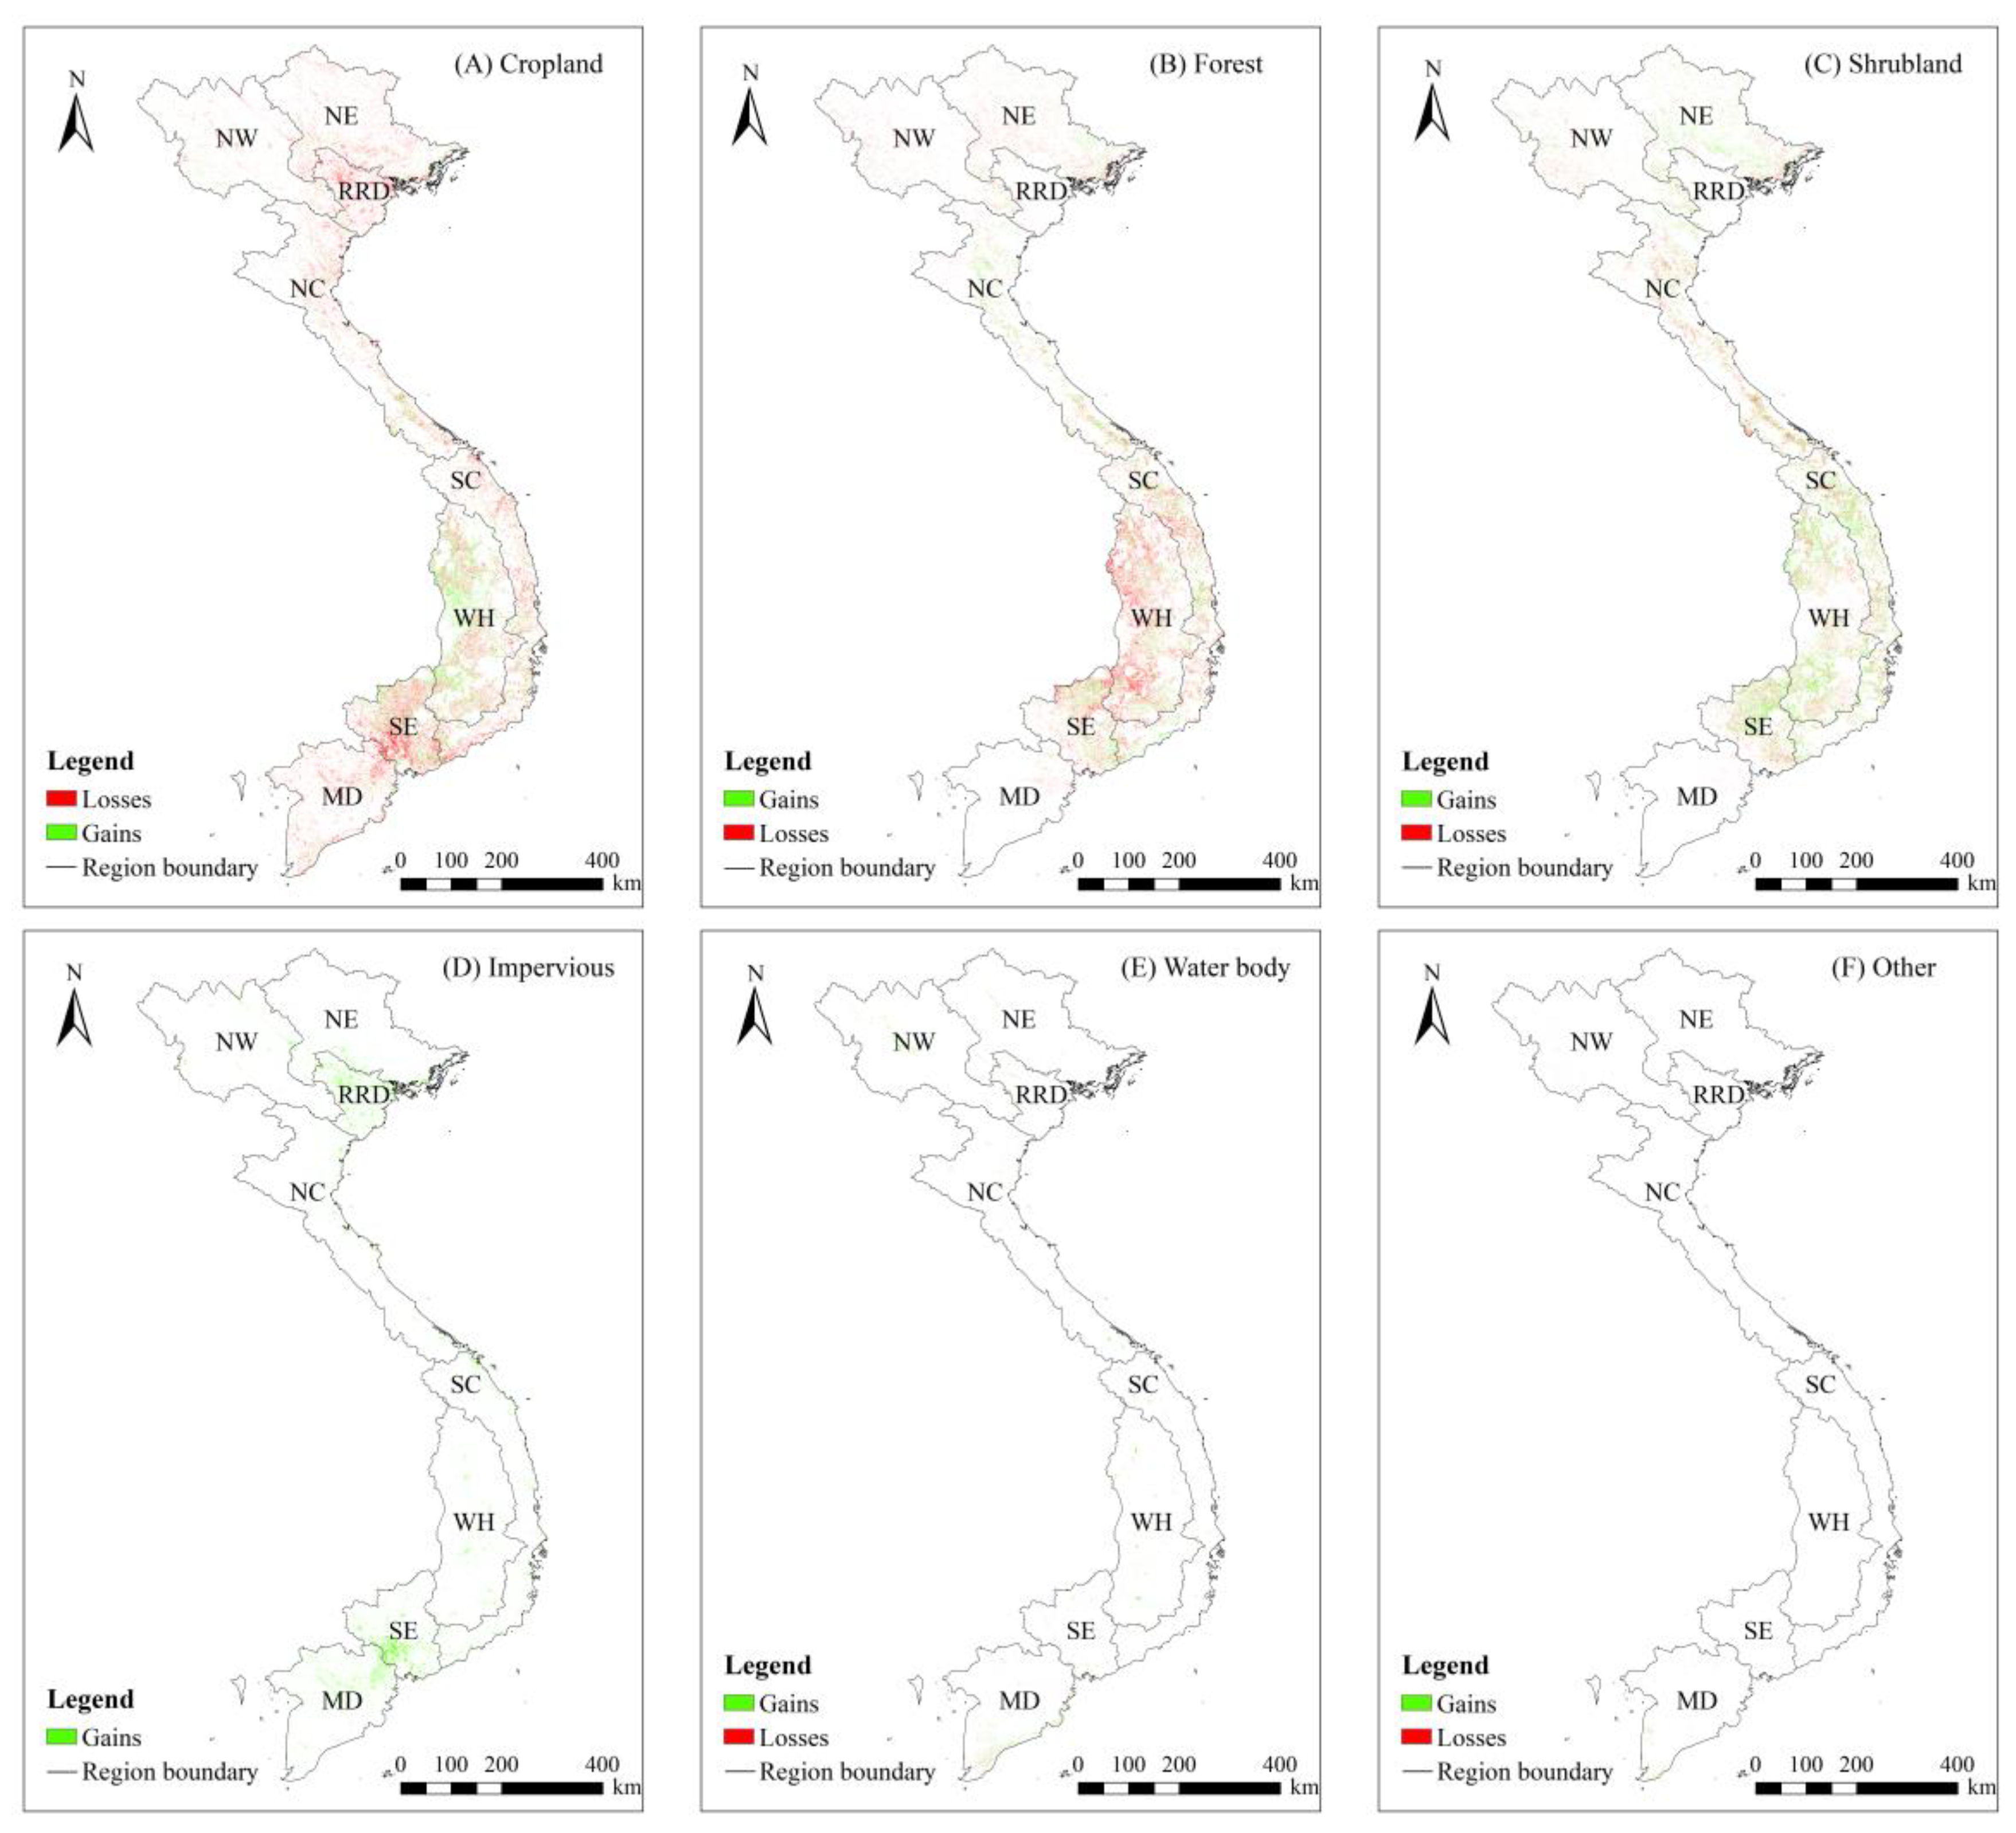
3.1. Spatial Distribution
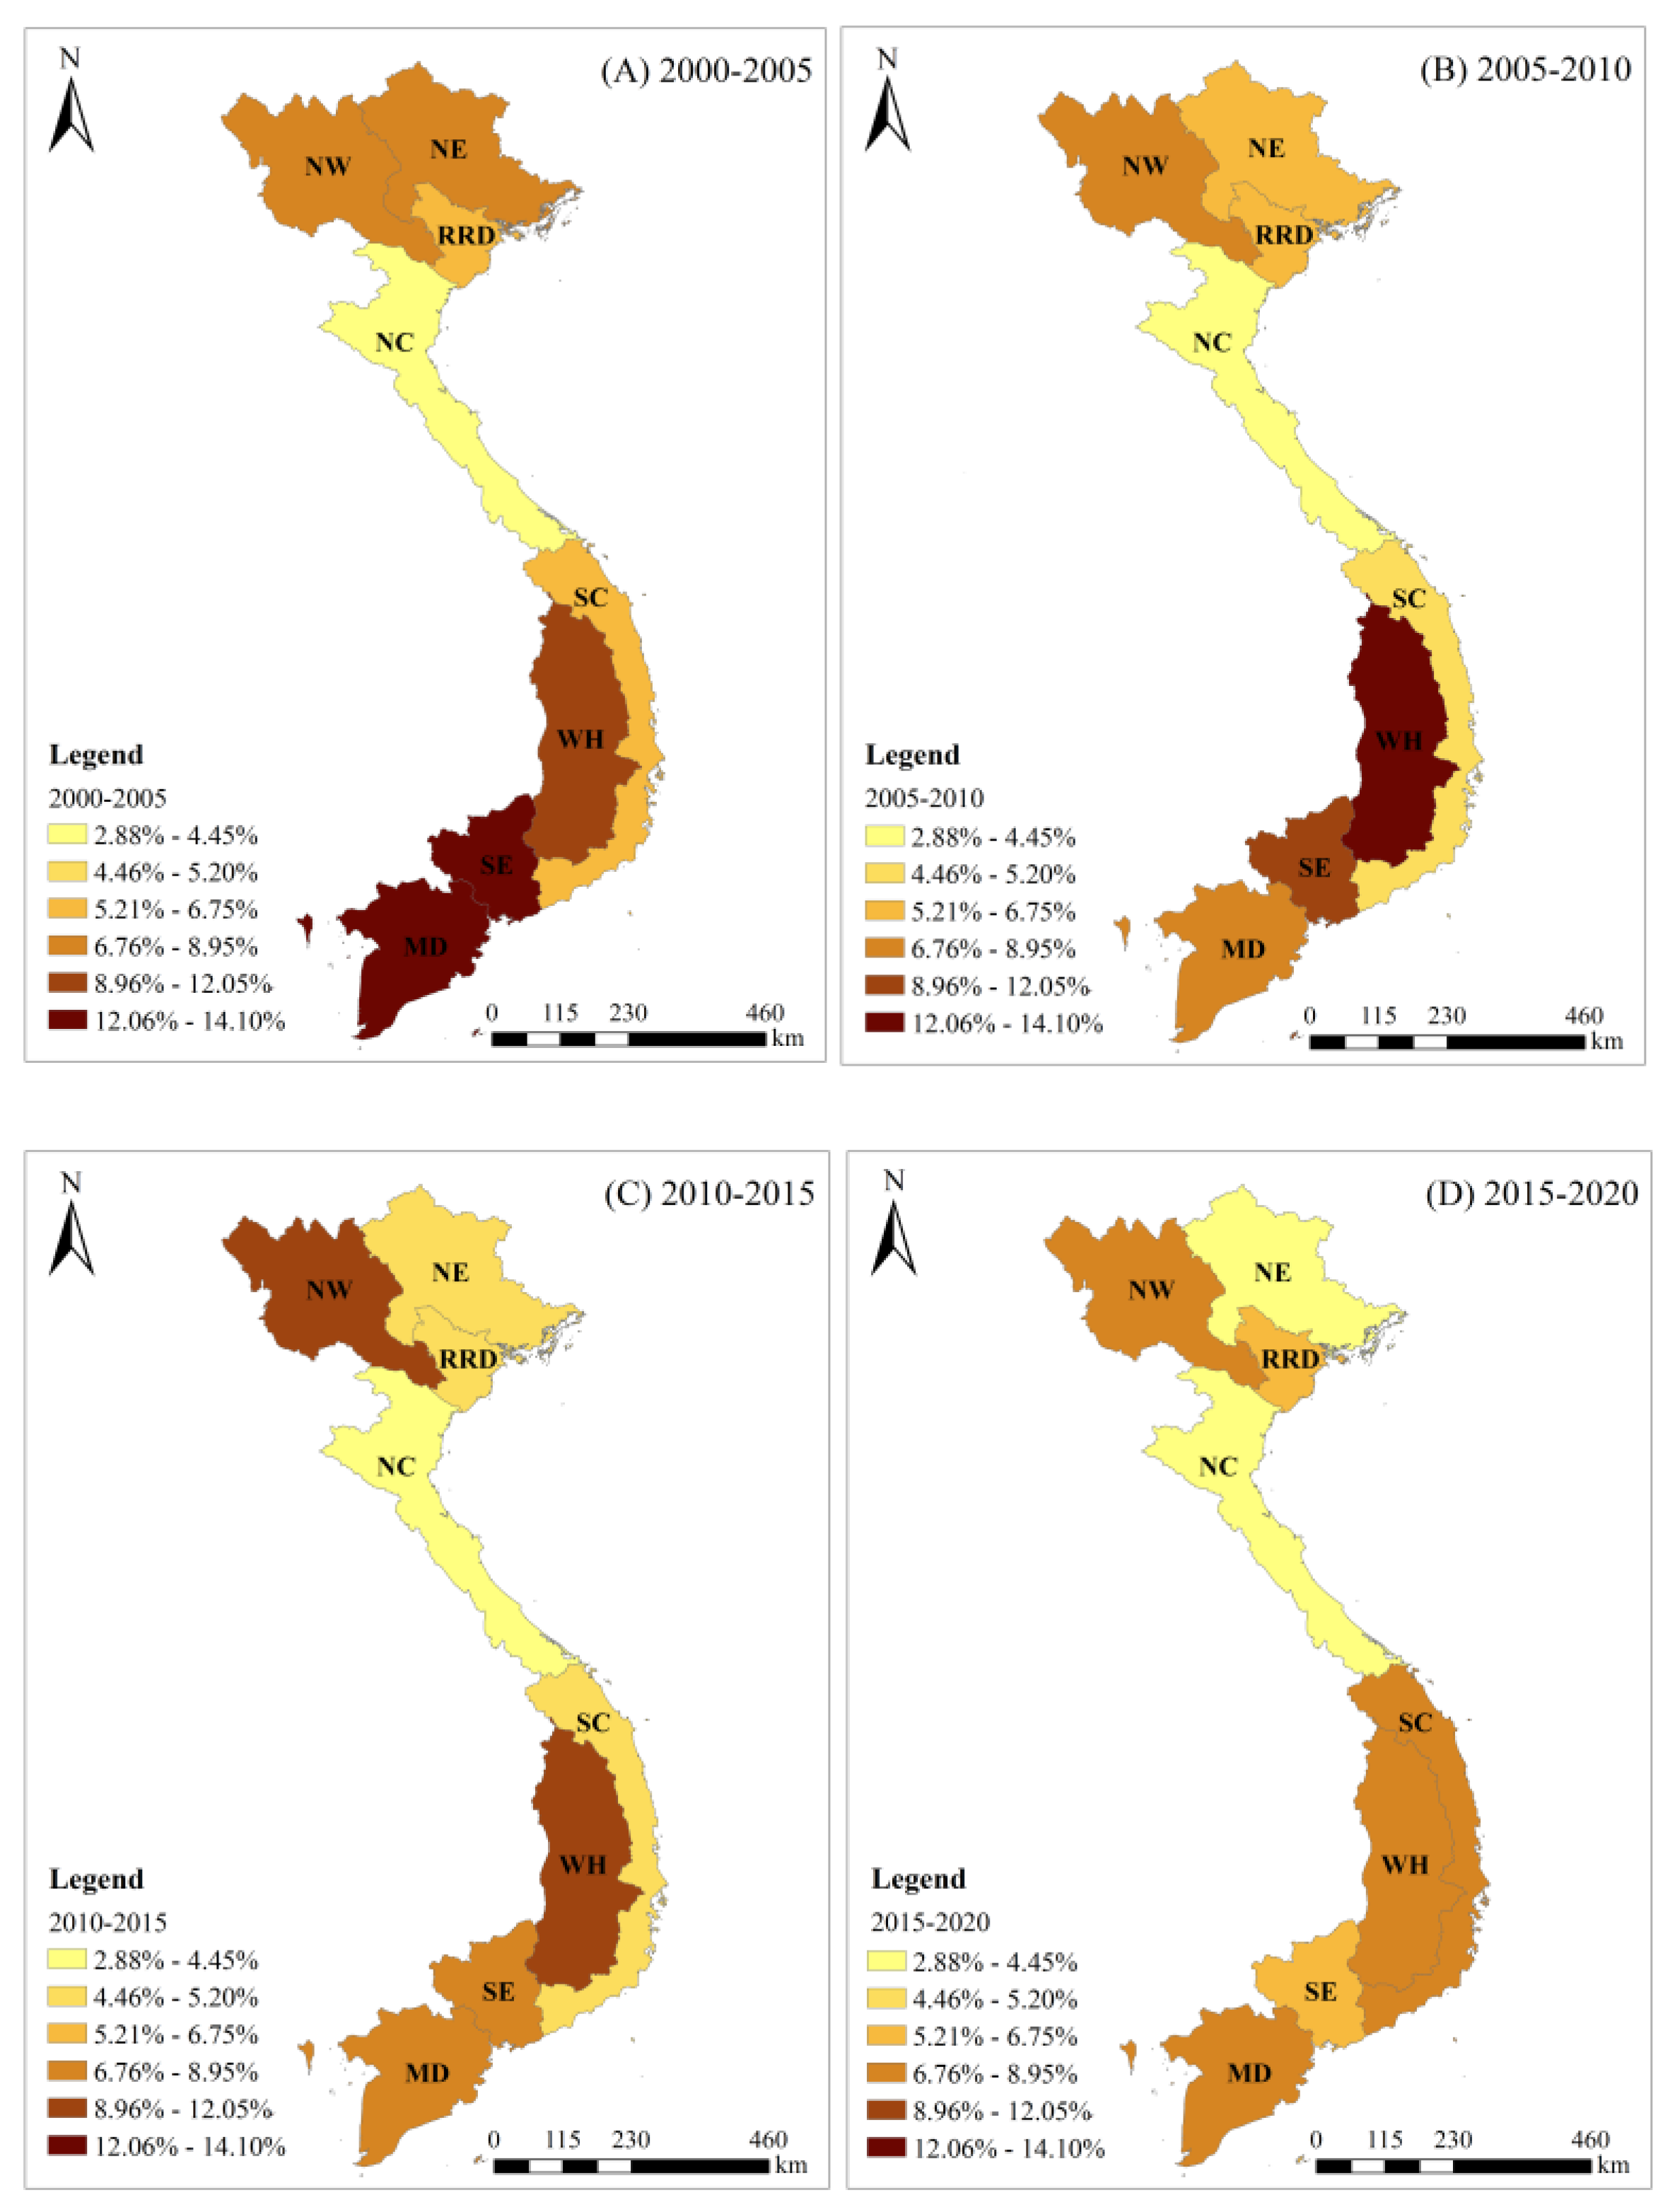
3.2. Spatio-Temporal Dynamic Changes
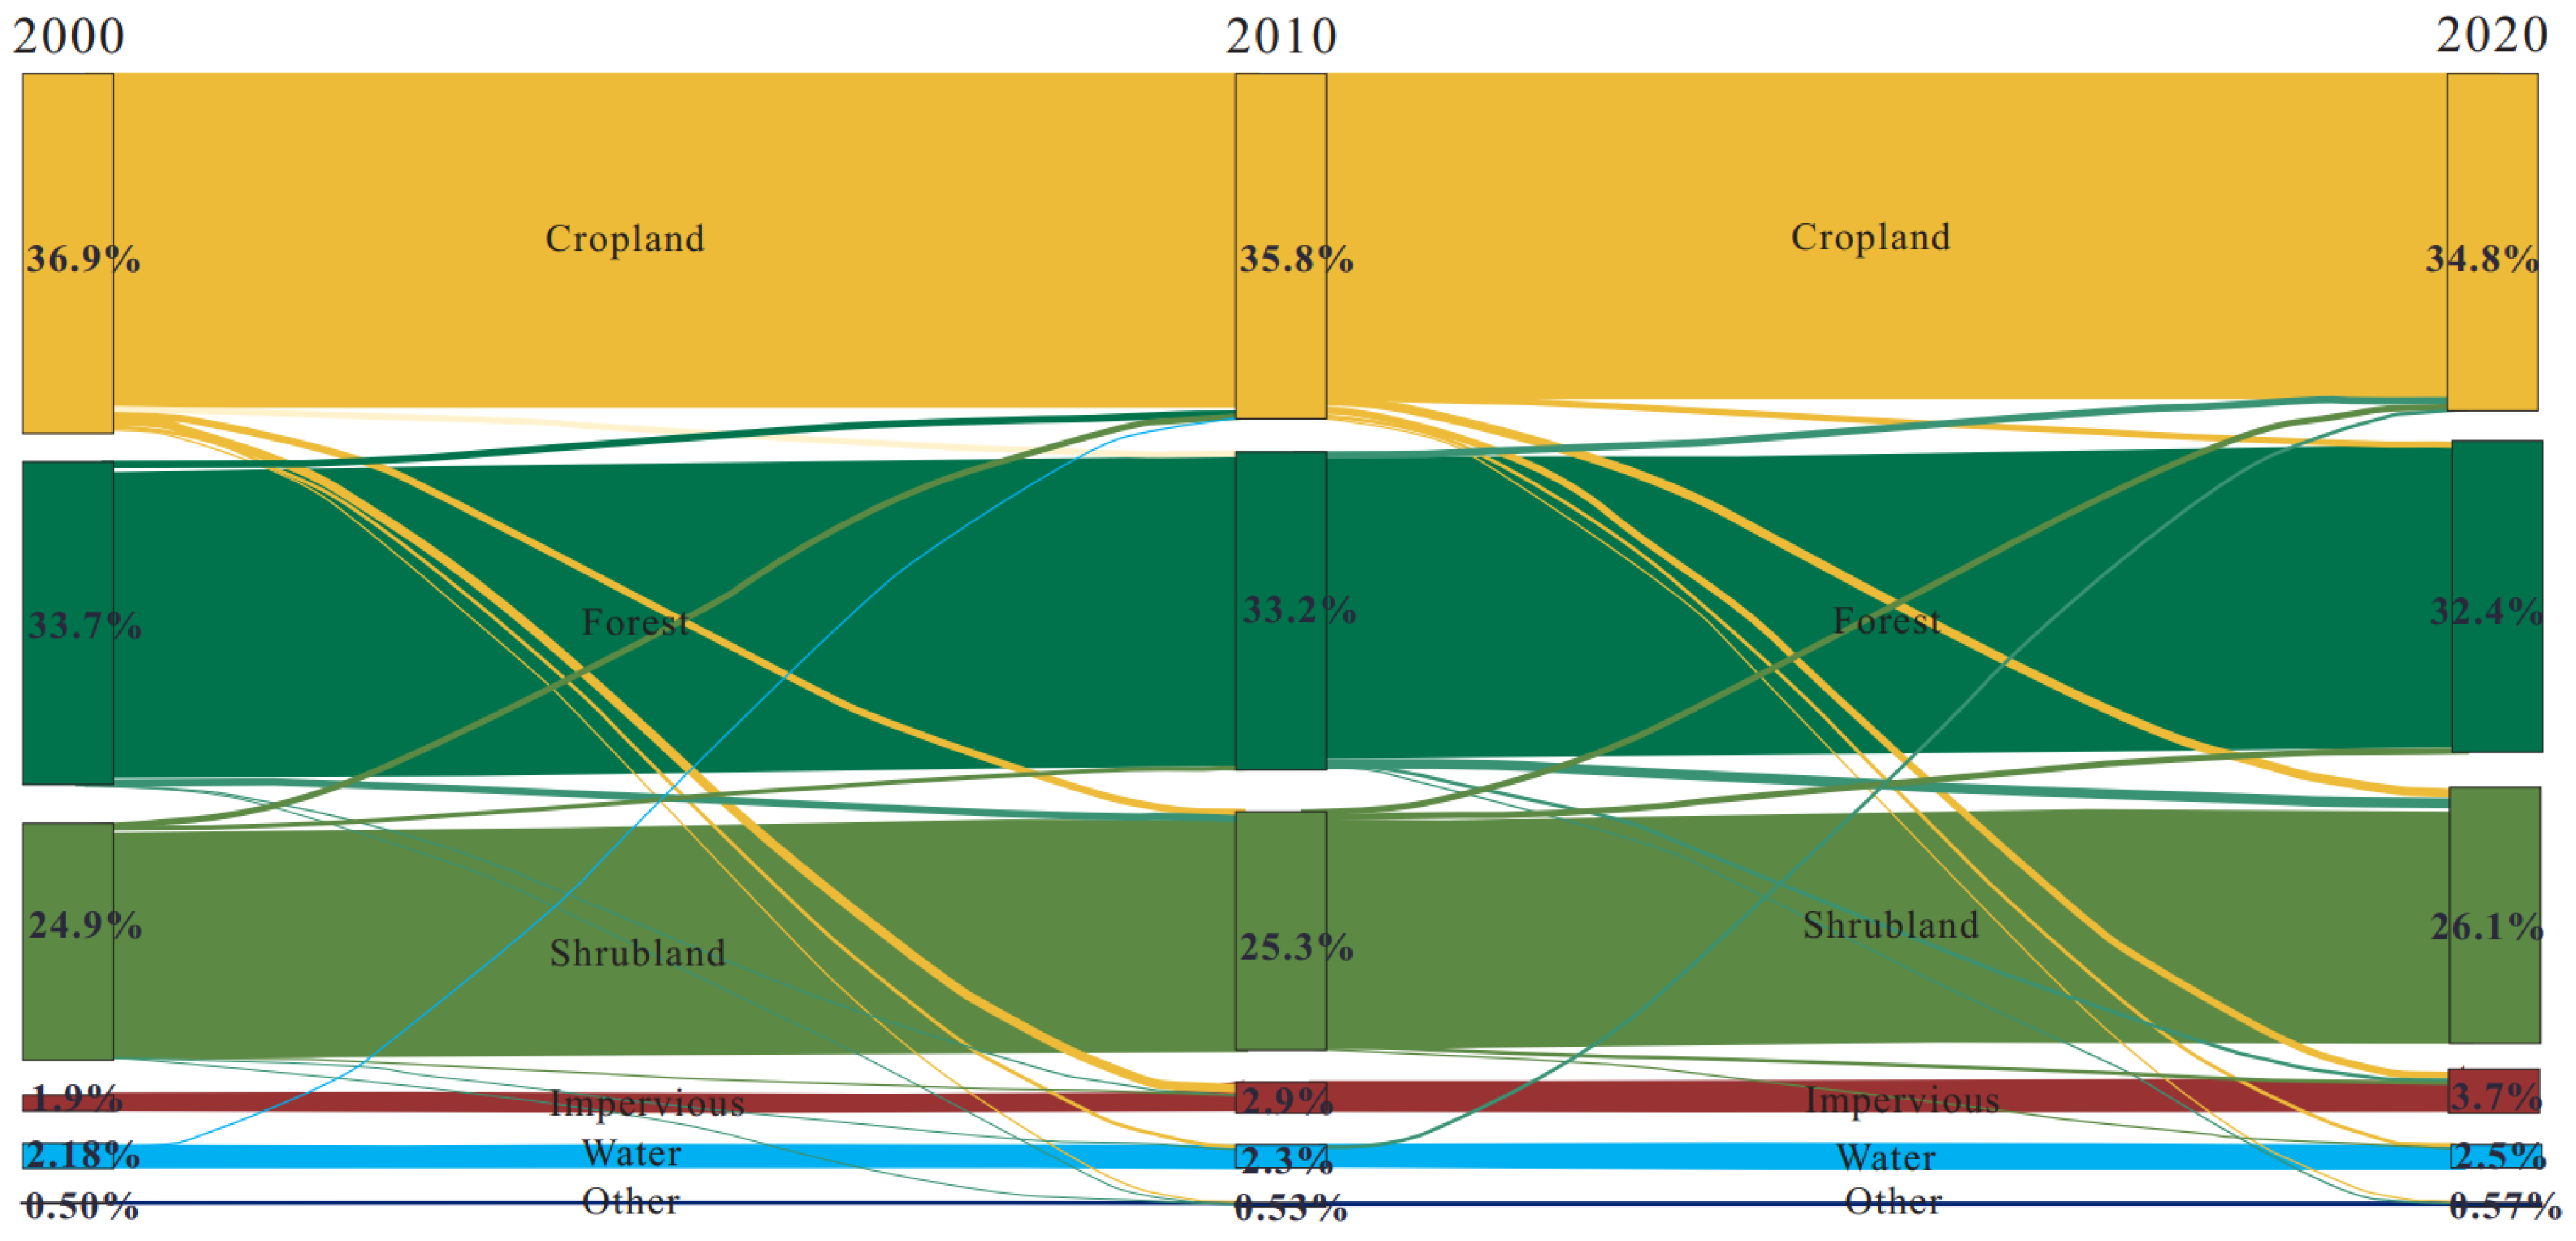
3.3. Source and Destination
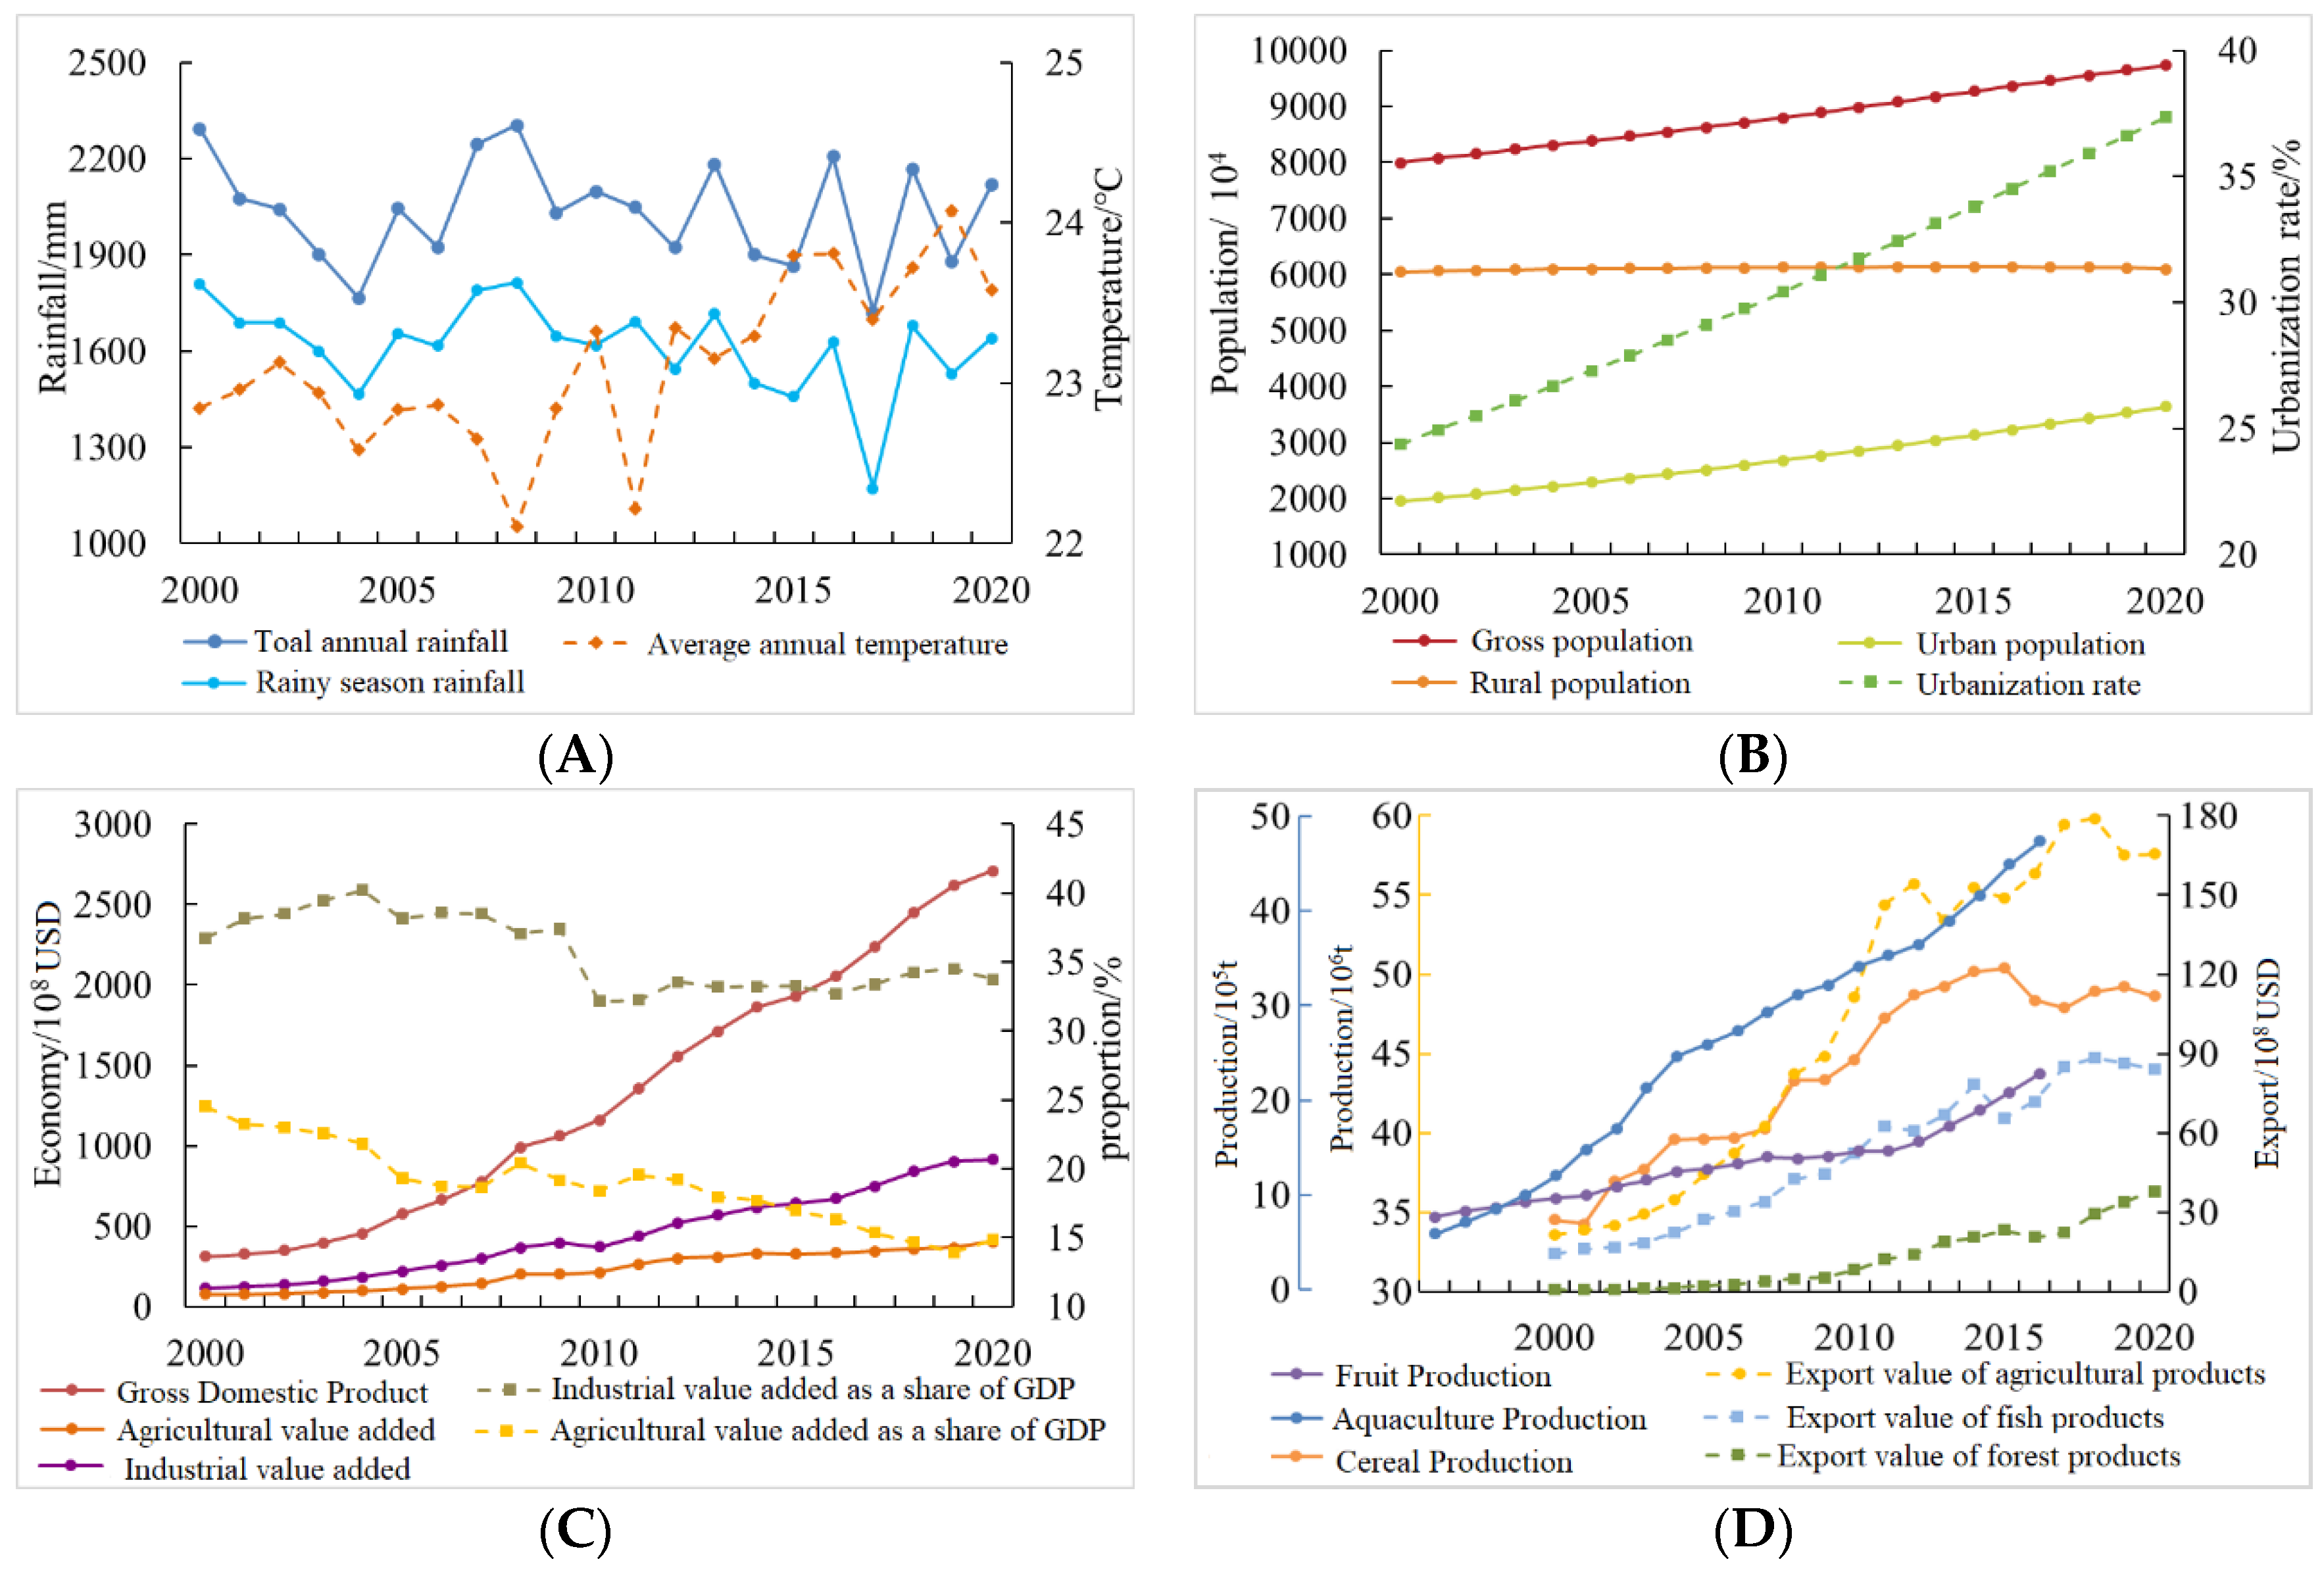
3.4. Economic, Social, and Climate Change
3.5. Driving Forces and Driving Mechanisms of LULC
4. Discussion
4.1. Land Change and Its Impacts and Recommendations
4.2. Drivers of Land Change
4.3. Uncertainty of the Study
5. Conclusions
Author Contributions
Funding
Institutional Review Board Statement
Informed Consent Statement
Acknowledgments
Conflicts of Interest
References
- Perring, M.P.; De Frenne, P.; Baeten, L.; Maes, S.L.; Depauw, L.; Blondeel, H.; Carón, M.M.; Verheyen, K. Global environmental change effects on ecosystems: The importance of land-use legacies. Glob. Chang. Biol. 2016, 22, 1361–1371. [Google Scholar] [CrossRef] [PubMed]
- Gueneralp, B.; Seto, K.C.; Ramachandran, M. Evidence of urban land teleconnections and impacts on hinterlands. Curr. Opin. Environ. Sustain. 2013, 5, 445–451. [Google Scholar] [CrossRef]
- Liu, J.Y.; Deng, X.Z.; Liu, M.L.; Zhang, S.W. Study on the spatial patterns of land-use change and analyses of driving forces in Northeastern China during 1990–2000. Chin. Geogr. Sci. 2002, 12, 299–308. [Google Scholar] [CrossRef]
- Sterling, S.M.; Ducharne, A.; Polcher, J. The impact of global land-cover change on the terrestrial water cycle. Nat. Clim. Chang. 2013, 3, 385–390. [Google Scholar] [CrossRef]
- Boysen, L.R.; Brovkin, V.; Arora, V.K.; Cadule, P.; de Noblet-Ducoudré, N.; Kato, E.; Pongratz, J.; Gayler, V. Global and regional effects of land-use change on climate in 21st century simulations with interactive carbon cycle. Earth Syst. Dyn. 2014, 5, 309–319. [Google Scholar] [CrossRef] [Green Version]
- Lambin, E.F.; Meyfroidt, P. Global land use change, economic globalization, and the looming land scarcity. Proc. Natl. Acad. Sci. USA 2011, 108, 3465–3472. [Google Scholar] [CrossRef] [Green Version]
- Phv, A.; Nc, B.; Ece, C.; Ah, D.; Ph, E.; Om, F.; Hn, G.; Ts, H.; Khe, I.; Ng, J. Land system science and sustainable development of the earth system: A global land project perspective. Anthropocene 2015, 12, 29–41. [Google Scholar]
- Loveland, T.R.; Reed, B.C.; Brown, J.F.; Ohlen, D.O.; Zhu, Z.; Yang, L.; Merchant, J.W. Development of a global land cover characteristics database and IGBP DISCover from 1 km AVHRR data. Int. J. Remote Sens. 2000, 21, 1303–1330. [Google Scholar] [CrossRef]
- Bartholome, E.; Belward, A.S. GLC2000: A new approach to global land cover mapping from Earth observation data. Int. J. Remote Sens. 2005, 26, 1959–1977. [Google Scholar] [CrossRef]
- Friedl, M.A.; Sulla-Menashe, D.; Tan, B.; Schneider, A.; Ramankutty, N.; Sibley, A.; Huang, X. MODIS Collection 5 global land cover: Algorithm refinements and characterization of new datasets. Remote Sens. Environ. 2010, 114, 168–182. [Google Scholar] [CrossRef]
- Bicheron, P.; Defourny, P.; Brockmann, C.; Schouten, L.; Vancutsem, C.; Huc, M.; Bontemps, S.; Leroy, M.; Chard, F.A.; Herold, M. GlobCover—Products Description and Validation Report. Mund. De La Salud 2011, 17, 285–287. [Google Scholar]
- Grekousis, G.; Mountrakis, G.; Kavouras, M. An overview of 21 global and 43 regional land-cover mapping products. Int. J. Remote Sens. 2015, 36, 5309–5335. [Google Scholar] [CrossRef]
- Chen, J.; Liao, A.; Cao, X.; Chen, L.; Mills, J. Global land cover mapping at 30 m resolution: A POKbased operational approach. ISPRS J. Photogramm. Remote Sens. 2015, 103, 7–27. [Google Scholar] [CrossRef] [Green Version]
- Gong, P.; Liu, H.; Zhang, M.; Li, C.; Wang, J.; Huang, H.; Clinton, N.; Ji, L.; Li, W.; Bai, Y.; et al. Stable classification with limited sample: Transferring a 30-m resolution sample set collected in 2015 to mapping 10-m resolution global land cover in 2017. Sci. Bull. 2019, 64, 370–373. [Google Scholar] [CrossRef] [Green Version]
- Liu, L.; Zhang, X.; Gao, Y.; Chen, X.; Mi, J. Finer-Resolution Mapping of Global Land Cover: Recent Developments, Consistency Analysis, and Prospects. Int. J. Remote Sens. 2021, 2021, 5289697. [Google Scholar] [CrossRef]
- Buchhorn, M.; Lesiv, M.; Tsendbazar, N.-E.; Herold, M.; Bertels, L.; Smets, B. Copernicus Global Land Cover Layers—Collection 2. Remote Sens. 2020, 12, 1044. [Google Scholar] [CrossRef] [Green Version]
- Karra, K.; Kontgis, C.; Statman-Weil, Z.; Mazzariello, J.C.; Mathis, M.; Brumby, S.P. Global land use/land cover with Sentinel 2 and deep learning. In Proceedings of the 2021 IEEE International Geoscience and Remote Sensing Symposium IGARSS, Brussels, Belgium, 11–16 July 2021; pp. 4704–4707. [Google Scholar]
- Wang, H.; Yan, H.; Hu, Y.; Xi, Y.; Yang, Y. Consistency and Accuracy of Four High-Resolution LULC Datasets—Indochina Peninsula Case Study. Land 2022, 11, 758. [Google Scholar] [CrossRef]
- Tchuenté, A.T.K.; Roujean, J.-L.; De Jong, S.M. Comparison and relative quality assessment of the GLC2000, GLOBCOVER, MODIS and ECOCLIMAP land cover data sets at the African continental scale. Int. J. Appl. Earth Obs. Geoinf. 2011, 13, 207–219. [Google Scholar] [CrossRef]
- Hu, Y.; Zhang, Q.; Dai, Z.; Huang, M.; Yan, H. Agreement analysis of multi-sensor satellite remote sensing derived land cover products in the Europe Continent. Geogr. Res. 2015, 34, 1839–1852. [Google Scholar]
- Fayaz, A.; Shafiq, M.U.; Singh, H.; Ahmed, P. Assessment of spatiotemporal changes in land use/land cover of North Kashmir Himalayas from 1992 to 2018. Model. Earth Syst. Environ. 2020, 6, 1189–1200. [Google Scholar] [CrossRef]
- Li, Z.; Ren, Y.; Li, J.; Li, Y.; Rykov, P.; Chen, F.; Zhang, W. Land-Use/Cover Change and Driving Mechanism on the West Bank of Lake Baikal from 2005 to 2015—A Case Study of Irkutsk City. Sustainability 2018, 10, 2904. [Google Scholar] [CrossRef] [Green Version]
- Hu, M.; Li, Z.; Wang, Y.; Jiao, M.; Li, M.; Xia, B. Spatio-temporal changes in ecosystem service value in response to land-use/cover changes in the Pearl River Delta. Resour. Conserv. Recycl. 2019, 149, 106–114. [Google Scholar] [CrossRef]
- Parsa, V.A.; Salehi, E. Spatio-temporal analysis and simulation pattern of land use/cover changes, case study: Naghadeh, Iran. J. Urban Manag. 2016, 5, 43–51. [Google Scholar] [CrossRef] [Green Version]
- Lambin, E.F.; Geist, H.J.; Lepers, E. Dynamics of land-use and land-cover change in tropical regions. Annu. Rev. Environ. Res. 2003, 28, 205–241. [Google Scholar] [CrossRef] [Green Version]
- Hu, Y.; Hu, Y. Land Cover Changes and Their Driving Mechanisms in Central Asia from 2001 to 2017 Supported by Google Earth Engine. Remote Sens. 2019, 11, 554. [Google Scholar] [CrossRef] [Green Version]
- Disperati, L.; Virdis, S. Assessment of land-use and land-cover changes from 1965 to 2014 in Tam Giang-Cau Hai Lagoon, central Vietnam. Appl. Geogr. 2015, 58, 48–64. [Google Scholar] [CrossRef]
- Vu, T.T.; Yuan, S. Land-Use and Land-Cover Changes in Dong Trieu District, Vietnam, during Past Two Decades and Their Driving Forces. Land 2021, 10, 798. [Google Scholar] [CrossRef]
- Zhang, X.; Liu, L.; Chen, X.; Gao, Y.; Mi, J. GLC_FCS30: Global land-cover product with fine classification system at 30 m using time-series Landsat imagery. Earth Syst. Sci. Data 2021, 13, 2753–2776. [Google Scholar] [CrossRef]
- Lu, D.; Li, G.; Kuang, W.; Moran, E. Methods to extract impervious surface areas from satellite images. Int. J. Digit. Earth 2014, 7, 93–112. [Google Scholar] [CrossRef]
- Rodell, M.; Kato, H.; Zaitchik, B. Ongoing Development of NASA%27s Global Land Data Assimilation System. In Proceedings of the 2008 American Geophysical Union Joint Assembly, Fort Lauderdale, FL, USA, 30 April 2008. [Google Scholar]
- Ashouri, H.; Hsu, K.L.; Sorooshian, S.; Braithwaite, D.K.; Knapp, K.R.; Cecil, L.D.; Nelson, B.R.; Prat, O.P. PERSIANN-CDR: Daily Precipitation Climate Data Record from Multisatellite Observations for Hydrological and Climate Studies. Bull. Am. Meteorol. Soc. 2014, 96, 197–210. [Google Scholar] [CrossRef] [Green Version]
- Pfaffenbichler, P.; Emberger, G.; Shepherd, S. The integrated dynamic land use and transport model MARS. Netw. Spat. Econ. 2008, 8, 183–200. [Google Scholar] [CrossRef] [Green Version]
- Wang, S.; Liu, J.; Zhang, Z.; Zhou, Q.; Zhao, X. Analysis on spatial-temporal features of land use in China. Acta Geogr. Sin. 2001, 56, 631–639. [Google Scholar]
- Mas, J.-F.; Velazquez, A.; Diaz-Gallegos, J.R.; Mayorga-Saucedo, R.; Alcantara, C.; Bocco, G.; Castro, R.; Fernandez, T.; Perez-Vega, A. Assessing land use/cover changes: A nationwide multidate spatial database for Mexico. Int. J. Appl. Earth Obs. Geoinf. 2004, 5, 249–261. [Google Scholar] [CrossRef]
- Ye, J.; Hu, Y.; Zhen, L.; Wang, H.; Zhang, Y. Analysis on Land-Use Change and Its Driving Mechanism in Xilingol, China, during 2000–2020 Using the Google Earth Engine. Remote Sens. 2021, 13, 5134. [Google Scholar] [CrossRef]
- Ainiyah, N.; Deliar, A.; Virtriana, R. The classical assumption test to driving factors of land cover change in the development region of northern part of west Java. Int. Arch. Photogramm. Remote Sens. Spat. Inf. Sci. 2016, 41, 205. [Google Scholar] [CrossRef] [Green Version]
- Shapiro, S.S.; Wilk, M.B. An analysis of variance test for normality (complete samples). Biometrika 1965, 52, 591–611. [Google Scholar] [CrossRef]
- Hanusz, Z.; Tarasinska, J.; Zielinski, W. Shapiro-Wilk test with known mean. REVSTAT-Stat. J. 2016, 14, 89–100. [Google Scholar]
- Hanh, T.; Thuc, T.; Matthieu, K. Dynamics of Land Cover/Land Use Changes in the Mekong Delta, 1973–2011: A Remote Sensing Analysis of the Tran Van Thoi District, Ca Mau Province, Vietnam. Remote Sens. 2015, 7, 2899–2925. [Google Scholar]
- Nguyen, L.D.; Viet, P.B.; Minh, N.T.; Thy, P.T.M.; Phung, H.P. Change Detection of Land Use and Riverbank in Mekong Delta, Vietnam Using Time Series Remotely Sensed Data. J. Resour. Ecol. 2011, 2, 370–374. [Google Scholar]
- Zeshan, M.T.; Mustafa, M.R.U.; Baig, M.F. Monitoring Land Use Changes and Their Future Prospects Using GIS and ANN-CA for Perak River Basin, Malaysia. Water 2021, 13, 2286. [Google Scholar] [CrossRef]
- Jia, N.; Liu, J.; Kuang, W.; Xu, X.; Jing, N. Spatiotemporal patterns and characteristics of land-use change in China during 2010–2015. J. Geogr. Sci. 2018, 28, 547–562. [Google Scholar]
- Eagle, A.J.; Eagle, D.; Stobbe, T.E.; Kooten, G. Farmland Protection and Agricultural Land Values at the Urban-Rural Fringe: British Columbia’s Agricultural Land Reserve. Am. J. Agric. Econ. 2014. Online Access. [Google Scholar] [CrossRef] [Green Version]
- Xapчeнкo, H.; Kharchenko, N.; Mopкoвинa, C.; Morkovina, S.; Skrynnikova, M. Methodical approach to the creation of a green forest park zone of the city agglomerations. For. Eng. J. 2017, 7, 122–133. [Google Scholar]
- Hou, Y.; Hu, C.; Zang, X.; Tian, C. Thinking on the Intensive Use of Land in the Three-Dimensional City—Enlightening on Urban Construction in Hongkong. Archit. Cult. 2018, 9, 165–167. [Google Scholar]
- Song, X.P.; Hansen, M.C.; Stehman, S.V.; Potapov, P.V.; Tyukavina, A.; Vermote, E.F.; Townshend, J.R. Global land change from 1982 to 2016. Nature 2018, 560, 639–643. [Google Scholar] [CrossRef]
- Huynh, P.T.A.; Le, N.D.; Le, S.T.H.; Nguyen, H.X. Vulnerability of Fishery-Based Livelihoods to Climate Change in Coastal Communities in Central Vietnam. Coast. Manag. 2021, 49, 275–292. [Google Scholar] [CrossRef]
- Qin, L.F. Research on the development of Vietnamese marine fishery. Chin. Fish. Econ. 2016, 34, 4–12. [Google Scholar]
- Trinh, T.A.; Feeny, S.; Posso, A. The Impact of Natural Disasters and Climate Change on Agriculture: Findings from Vietnam. In Economic Effects of Natural Disasters; Academic Press: Cambridge, MA, USA, 2021. [Google Scholar]
- Gao, Y.; Liu, L.; Zhang, X.; Chen, X.; Xie, S. Consistency Analysis and Accuracy Assessment of Three Global 30-m Land-Cover Products over the European Union using the LUCAS Dataset. Remote Sens. 2020, 12, 3479. [Google Scholar] [CrossRef]
- Linyucheva, A.; Kindlmann, P. A review of global land cover maps in terms of their potential use for habitat suitability modelling. Eur. J. Environ. Sci. 2021, 11, 46–61. [Google Scholar] [CrossRef]
- Lin, Y.; Deng, X.; Xing, L.I.; Enjun, M.A. Comparison of multinomial logistic regression and logistic regression: Which is more efficient in allocating land use? Front. Earth Sci. 2014, 8, 512–523. [Google Scholar] [CrossRef]
- Hu, Y.; Gao, M. Evaluations of water yield and soil erosion in the Shaanxi-Gansu Loess Plateau under different land use and climate change scenarios. Environ. Dev. 2020, 34, 100488. [Google Scholar] [CrossRef]
- Zondag, B.; Borsboom, J. Driving forces of land-use change. In Proceedings of the 49th ERSA Conference, Lodz, Poland, 25–29 August 2009. [Google Scholar]
- Lewis, M. Stepwise versus Hierarchical Regression: Pros and Cons. Online Submiss 2007. [Google Scholar]
- Pirasteh, S.; Zenner, E.K.; Mafi-Gholami, D.; Jaafari, A.; Kamari, A.N.; Liu, G.; Zhu, Q.; Li, J. Modeling mangrove responses to multi-decadal climate change and anthropogenic impacts using a long-term time series of satellite imagery. Int. J. Appl. Earth Obs. Geoinf. 2021, 102, 102390. [Google Scholar] [CrossRef]
- Yu, Y.; Cao, Y.; Hou, D.; Disse, M.; Brieden, A.; Zhang, H.; Yu, R. The study of artificial intelligence for predicting land use changes in an arid ecosystem. J. Geogr. Sci. 2022, 32, 717–734. [Google Scholar] [CrossRef]


| Code | Level 1 Classes | GLC_FCS30 LULC ID | Level 2 Classes of GLC_FCS30 |
|---|---|---|---|
| 1 | Cropland | 10 | Rainfed cropland |
| 11 | Herbaceous cover | ||
| 12 | Tree or shrub cover (orchard) | ||
| 20 | Irrigated cropland | ||
| 2 | Forest | 51 | Open evergreen broadleaved forest |
| 52 | Closed evergreen broadleaved forest | ||
| 61 | Open deciduous broadleaved forest (0.15 < fc < 0.4) | ||
| 62 | Closed deciduous broadleaved forest (fc > 0.4) | ||
| 71 | Open evergreen needle-leaved forest (0.15 < fc < 0.4) | ||
| 72 | Closed evergreen needle-leaved forest (fc > 0.4) | ||
| 3 | Shrubland | 120 | Shrubland |
| 121 | Evergreen shrubland | ||
| 4 | Impervious surfaces | 190 | Impervious surfaces |
| 5 | Water body | 210 | Water body |
| 220 | Permanent ice and snow | ||
| 6 | Other | 130 | Grassland |
| 180 | Wetlands |
| Category | Index | Unit |
|---|---|---|
| Climate | X1 Total annual precipitation | mm |
| X2 Rainy season precipitation | mm | |
| X3 Average annual temperature | °C | |
| Social development | X4 Gross population | 10,000 people |
| X5 Rural population | 10,000 people | |
| X6 Urban population | 10,000 people | |
| X7 Urbanization rate | % | |
| Economic development | X8 Gross Domestic Product (GDP) | 100 million (current USD) |
| X9 Agricultural value added | 100 million (current USD) | |
| X10 Industrial value added | 100 million (current USD) | |
| X11 Agricultural value added as a share of GDP | % | |
| X12 Industrial value added as a share of GDP | % | |
| X13 Cereal Production | kt | |
| X14 Aquaculture Production | kt | |
| X15 Fruit Production | kt | |
| X16 Export value of agricultural products | 100 million (current USD) | |
| X17 Export value of forest products | 100 million (current USD) | |
| X18 Export value of fish products | 100 million (current USD) |
| Variables | Description | W-Value | p-Value | Shapiro-Wilk Tables 2 for n = 5 | |
|---|---|---|---|---|---|
| W | p | ||||
| X1 | Total annual precipitation | 0.966 | 0.80 | 0.686 | 0.01 |
| X2 | Rainy season precipitation | 0.941 | 0.61 | ||
| X3 | Average annual temperature | 0.895 | 0.39 | 0.715 | 0.02 |
| X4 | Gross population | 0.984 | 0.93 | ||
| X5 | Rural population | 0.913 | 0.45 | 0.762 | 0.05 |
| X6 | Urban population | 0.980 | 0.92 | ||
| X7 | Urbanization rate | 0.984 | 0.94 | 0.806 | 0.1 |
| X8 | Gross Domestic Product (GDP) | 0.946 | 0.65 | ||
| X9 | Agricultural value added | 0.936 | 0.57 | 0.927 | 0.5 |
| X10 | Industrial value added | 0.946 | 0.65 | ||
| X11 | Agricultural value added as a share of GDP | 0.937 | 0.58 | 0.979 | 0.9 |
| X12 | Industrial value added as a share of GDP | 0.914 | 0.46 | ||
| X13 | Cereal Production | 0.948 | 0.66 | 0.986 | 0.95 |
| X14 | Aquaculture Production | 0.984 | 0.93 | ||
| X15 | Fruit Production | 0.931 | 0.53 | 0.991 | 0.98 |
| X16 | Export value of agricultural products | 0.911 | 0.45 | ||
| X17 | Export value of forest products | 0.884 | 0.36 | 0.993 | 0.99 |
| X18 | Export value of fish products | 0.968 | 0.82 | ||
| Variables | Description | Component | |
|---|---|---|---|
| F1-Economic and Social Development | F2_Climate Change | ||
| X1 | Total annual precipitation | −0.614 | 0.736 |
| X2 | Rainy season precipitation | −0.748 | 0.652 |
| X3 | Average annual temperature | 0.933 | −0.158 |
| X4 | Gross population | 0.990 | 0.129 |
| X5 | Rural population | 0.741 | −0.633 |
| X6 | Urban population | 0.984 | 0.166 |
| X7 | Urbanization rate | 0.989 | 0.131 |
| X8 | Gross Domestic Product (GDP) | 0.970 | 0.229 |
| X9 | Agricultural value added | 0.986 | 0.142 |
| X10 | Industrial value added | 0.963 | 0.243 |
| X11 | Agricultural value added as a share of GDP | −0.939 | 0.060 |
| X12 | Industrial value added as a share of GDP | −0.730 | 0.117 |
| X13 | Cereal Production | 0.975 | −0.222 |
| X14 | Aquaculture Production | 0.989 | 0.133 |
| X15 | Fruit Production | 0.913 | 0.382 |
| X16 | Export value of agricultural products | 0.993 | −0.001 |
| X17 | Export value of forest products | 0.927 | 0.328 |
| X18 | Export value of fish products | 0.991 | 0.114 |
| Variance (%) | 84.04% | 10.75% | |
| Eigenvalues | 15.13 | 1.02 | |
| Cropland | R2 = 0.97, p < 0.05 |
| Impervious | R2 = 0.98, p < 0.001 |
| Shrubland | R2 = 0.97, p < 0.05 |
| Water | R2 = 0.98, p < 0.001 |
| Forest | R2 = 0.99, p < 0.05 |
| Cropland | R2 = 0.99, p < 0.001 |
| Impervious | R2 = 0.99, p < 0.001 |
| Water | R2 = 0.97, p < 0.05 |
Publisher’s Note: MDPI stays neutral with regard to jurisdictional claims in published maps and institutional affiliations. |
© 2022 by the authors. Licensee MDPI, Basel, Switzerland. This article is an open access article distributed under the terms and conditions of the Creative Commons Attribution (CC BY) license (https://creativecommons.org/licenses/by/4.0/).
Share and Cite
Niu, X.; Hu, Y.; Lei, Z.; Yan, H.; Ye, J.; Wang, H. Temporal and Spatial Evolution Characteristics and Its Driving Mechanism of Land Use/Cover in Vietnam from 2000 to 2020. Land 2022, 11, 920. https://doi.org/10.3390/land11060920
Niu X, Hu Y, Lei Z, Yan H, Ye J, Wang H. Temporal and Spatial Evolution Characteristics and Its Driving Mechanism of Land Use/Cover in Vietnam from 2000 to 2020. Land. 2022; 11(6):920. https://doi.org/10.3390/land11060920
Chicago/Turabian StyleNiu, Xiaoyu, Yunfeng Hu, Zhongying Lei, Huimin Yan, Junzhi Ye, and Hao Wang. 2022. "Temporal and Spatial Evolution Characteristics and Its Driving Mechanism of Land Use/Cover in Vietnam from 2000 to 2020" Land 11, no. 6: 920. https://doi.org/10.3390/land11060920
APA StyleNiu, X., Hu, Y., Lei, Z., Yan, H., Ye, J., & Wang, H. (2022). Temporal and Spatial Evolution Characteristics and Its Driving Mechanism of Land Use/Cover in Vietnam from 2000 to 2020. Land, 11(6), 920. https://doi.org/10.3390/land11060920