Article

A Quantitative Survey of Effect of Semi-Natural Habitat Composition and Configuration on Landscape Heterogeneity in Arable Land System

1
College of Land and Environment, Shenyang Agricultural University, Shenyang 110866, China
2
Key Laboratory of Cultivated Land System Protection, Department of Natural Resources of Liaoning Province, Shenyang 110866, China
3
Crop Systems Analysis Group, Wageningen University, Droevendaalsesteeg 1, 6708PB Wageningen, The Netherlands
*
Author to whom correspondence should be addressed.
Land 2022, 11(7), 1018; https://doi.org/10.3390/land11071018
Submission received: 24 May 2022 / Revised: 25 June 2022 / Accepted: 1 July 2022 / Published: 4 July 2022
(This article belongs to the Special Issue Arable Land System Resilience and Sustainable Use-Ways and Methods)

Abstract

:
Arable land systems are complex ecosystems composed of cultivated land and semi-natural habitats. Retaining an appropriate proportion of semi-natural habitats in arable land systems is beneficial for enhancing landscape heterogeneity and biodiversity. However, it is unclear how many semi-natural habitats need to be retained in arable land systems to improve landscape heterogeneity. In this study, the land use data of four counties were used as the data source in the Lower Liaohe Plain, Liaoning Province, and Rao’s quadratic entropy index (Q) was used to quantitatively characterize the landscape heterogeneity. We aimed to explore the minimum proportion of semi-natural habitat required to maintain high landscape heterogeneity and determine the independent and interactive effects of semi-natural habitat composition and configuration on landscape heterogeneity. We found that (1) maintaining a 5% proportion of semi-natural habitats is the minimum threshold for achieving high landscape heterogeneity in arable land systems. Retaining a 10% share of semi-natural habitats is beneficial for both agricultural production and land ecology. (2) The combination of woodland, water and ditches was good for improving landscape heterogeneity. Connectivity in semi-natural habitats is critical to improving landscape heterogeneity. (3) The interaction of semi-natural habitat composition and configuration had a strong effect on landscape heterogeneity (53.1%). Semi-natural habitat configuration was found to be more important than composition for landscape heterogeneity. The role of semi-natural habitat composition and configuration in maintaining landscape heterogeneity and supporting the sustainability of land use therefore needs to be considered in arable land systems.

1. Introduction

Agricultural intensification and increased levels of land-use intensity have led to a decline in landscape heterogeneity (a reduction in and loss of natural and semi-natural habitats) in arable land systems worldwide [1]. Landscape heterogeneity can affect species persistence by supporting larger species pools, providing patch diversity and encouraging biological spillovers between complementary resources at the local and landscape levels [2]. However, as landscape heterogeneity declines, biodiversity is also facing a general decline. In addition to influencing species diversity, a decrease in landscape heterogeneity may also directly impair ecosystem functioning due to reduced cross-habitat exchange of materials and energy [3,4]. Alsterberg et al. found that high heterogeneity ecosystems composed of multiple habitats show higher levels of multiple ecosystem functions than ecosystems with a single habitat [5]. Habitat diversification promotes multiple ecosystem services without compromising yield [6]. Therefore, it is essential to maintain semi-natural habitats in arable land systems.
The retention of appropriate proportions of semi-natural habitats to enhance landscape heterogeneity benefits biodiversity and ecosystem services [7,8]. The presence of semi-natural habitats and landscape heterogeneity are key determinants of the delivery of ecosystems services such as pollination and pest control [9,10] and may be an appropriate way to support the sustainability of arable land systems [11]. Agri-environment schemes (AES) in most European countries aimed at protecting semi-natural habitats can be traced back to 1985 [12]. Moreover, the European Union (EU) allocates a significant budget to promoting the protection of the ecological environment and preventing the loss of semi-natural habitats in arable land systems [13]. The new Common Agricultural Policy (CAP) (period from 2023 to 2027) will help to improve the environment through nine standards of good environmental and agricultural condition (GAEC). GAEC 8 requires farmers to devote a proportion of arable land to non-productive areas and features (among other obligations) in order to improve the biodiversity of arable land systems [14], in line with the Green Deal target to have high-diversity landscape features in at least 10% of non-productive areas by 2030 [15]. In addition, studies found that 20% of semi-natural, non-crop habitat appears to be a rough threshold for enhancing biodiversity and sustaining services [16]. However, there is currently no policy on the protection of semi-natural habitats in arable land systems, nor is there a compensation or incentive mechanism for farmers for the losses caused by the conservation of semi-natural habitats in China. Moreover, the per capita surface of arable land (total arable land/total Chinese population) in China is only 0.007 hm2. Therefore, achieving high landscape heterogeneity with a low proportion of semi-natural habitats combined with the optimal landscape composition and configuration is more suitable for China’s agricultural development, and it is also a goal that is being explored worldwide [17,18]. Nevertheless, if the proportion of semi-natural habitats in arable land systems is too low, the consequence is that, no matter how their composition and configuration are optimized, it is impossible to achieve high landscape heterogeneity. The excessive conversion of arable land to semi-natural habitats may affect food security [19]. Figuring out the threshold for the proportion of semi-natural habitat required to achieve high landscape heterogeneity is key for arable system sustainability. Unfortunately, the threshold for the proportion of semi-natural habitat required to achieve high heterogeneity is currently unclear.
Studies have found that landscape heterogeneity shows differences even under the same proportion of semi-natural habitat [20]. This is because landscape heterogeneity is driven by two aspects: (i) the number and proportion of different cover types (composition heterogeneity) and (ii) their complex spatial arrangement (configuration heterogeneity) [21]. The more diverse the landscape composition, the more complex the landscape configuration, and the higher the heterogeneity of the landscape. However, the landscape composition and configuration are mutually influential and not completely independent. The number of patches (configuration heterogeneity) inherently limits the diversity of cover types (composition heterogeneity) [22]. The composition of semi-natural habitats refers to the types and proportion of semi-natural habitats in an arable land system. Semi-natural habitat configuration refers to the spatial arrangement of semi-natural habitats in an arable land system, such as connectivity and dispersion. The relative importance of independent and interactive to landscape heterogeneity remains unknown.
The objective of this study was to explore the minimum proportion of semi-natural habitat required to achieve high landscape heterogeneity in arable land systems and to determine the independent and interactive effects of semi-natural habitat composition and configuration on landscape heterogeneity. We hypothesized that (1) there is a minimum semi-natural habitat proportion threshold for achieving high landscape heterogeneity in arable land systems, and (2) optimizing the semi-natural composition and semi-natural configuration has different effects on improving the heterogeneity of the landscape.

2. Materials and Methods

2.1. Study Area

This study was carried out in four counties (Changtu County, Dawa County, Dengta County and Zhangwu County) located in the northern, southern, eastern and western parts of the Lower Liaohe Plain (Figure 1). The areas are 4324 km2, 1762 km2, 1170 km2 and 3623 km2, respectively. Changtu County is known for its agricultural productivity and is the country’s largest grain production base. It is also a typical intensive agricultural area of the Lower Liaohe Plain. Cultivated land in the county is spatially concentrated and contiguous, and the scale of the fields is large. Dawa County is located at the estuary of the Lower Liaohe River; the county is mainly dominated by paddy fields, and the shape of the fields is regular. Dengta County is low in the west and high in the east; the east is a remnant of the Changbai Mountains and is a hilly area, mainly woodland. The central and western areas are an alluvial plain, with cultivated land and paddy fields in an interlaced distribution with and different shapes. Zhangwu County is located on the southern edge of Horqin Sandy Land, and the terrain is high in the north and low in the south. In the north, there are more fixed sand dunes formed by wind sand dunes, and between the alluvial plain distributed from northwest to southeast, the terrain is relatively flat and is part of the Songliao Plain. Zhangwu County is the key county in the construction of the Three-North Shelter Forest Program (TNSFP), which is one of the largest and longest ecological restoration programs in the world [23]. Therefore, there are farmland shelterbelts between the fields, and the proportion of semi-natural habitat area is relatively high.

2.2. Semi-Natural Habitat Composition

The composition of semi-natural habitats was characterized by semi-natural habitat types and proportions of semi-natural habitats. Semi-natural habitat types in the arable land systems according to land use types were divided into five types: woodland, grassland, waters, ditch and rural road. The calculation of the proportion of semi-natural habitats first requires the determination of the analytical scale. On the one hand, landscape ecology research believes that ensuring that the study scale does not lose the information of fine non-arable land patches but comprehensively reflects the sample landscape pattern is the key to determining the research scale. In general, landscape samples with an area of 2 to 5 times the average patch area are optimal [24]. On the other hand, the scale of 1 km × 1 km is considered meaningful for the activity density and the diversity of arthropods in arable land systems [25]. Consequently, the scale of 1 km × 1 km was determined as the scale for the analysis in this study. The results at this scale can also better provide a basis for the protection of biodiversity in arable land systems. Land use data with an accuracy of 1:5000 were used as the data source, and the fishing net tool in ArcMap10.2 was used to set a grid of 1 km × 1 km. Grids containing land for commercial land and other construction land were excluded, and less than 50% of the semi-natural habitats were extracted. Finally, a total of 1196 grids (1 km × 1 km) were retained, and the proportion of semi-natural habitat area within each grid was calculated.

2.3. Semi-Natural Habitat Configuration

Most of the landscape metrics and indices were used concerning biodiversity and habitat analysis, as well as the evaluation of the landscape pattern (landscape composition and landscape configuration) and its change [26]. We used seven landscape indices to characterize the configuration of semi-natural habitats (Table 1). The aggregation index (AI) measures the aggregation or adjacency of the same patches, where the smaller the value, the more dispersed the landscape. The patch cohesion index (COHESION) characterizes the connectedness of the corresponding patch type. The landscape division index (DIVISION) equals the probability that two randomly chosen places in the landscape under investigation are not situated in the same contiguous habitat patch. The DIVISION is negatively correlated with the effective mesh size. The mean Euclidean nearest neighbor index (ENN_MN) equals the distance (m) to the nearest neighboring patch of the same type, based on the shortest edge-to-edge distance. The landscape shape index (LSI) is the ratio between the actual landscape edge length and the hypothetical minimum edge length. The mean shape index (SHAPE) describes the ratio between the actual perimeter of the patch and the hypothetical minimum perimeter of the patch. The splitting index (SPLIT) describes the number of patches if all patches in the landscape were to be divided into equally sized patches [27]. To calculate the landscape index, we converted vector data of land-use into raster data (5 m × 5 m) using ArcGIS 10.2 (Environmental Systems Research Institute, Redlands, CA, USA, 2013). The landscape index was calculated using FRAGSTATS 4.2 (University of Massachusetts, McGarigal et al., USA, 2012).

2.4. Landscape Heterogeneity

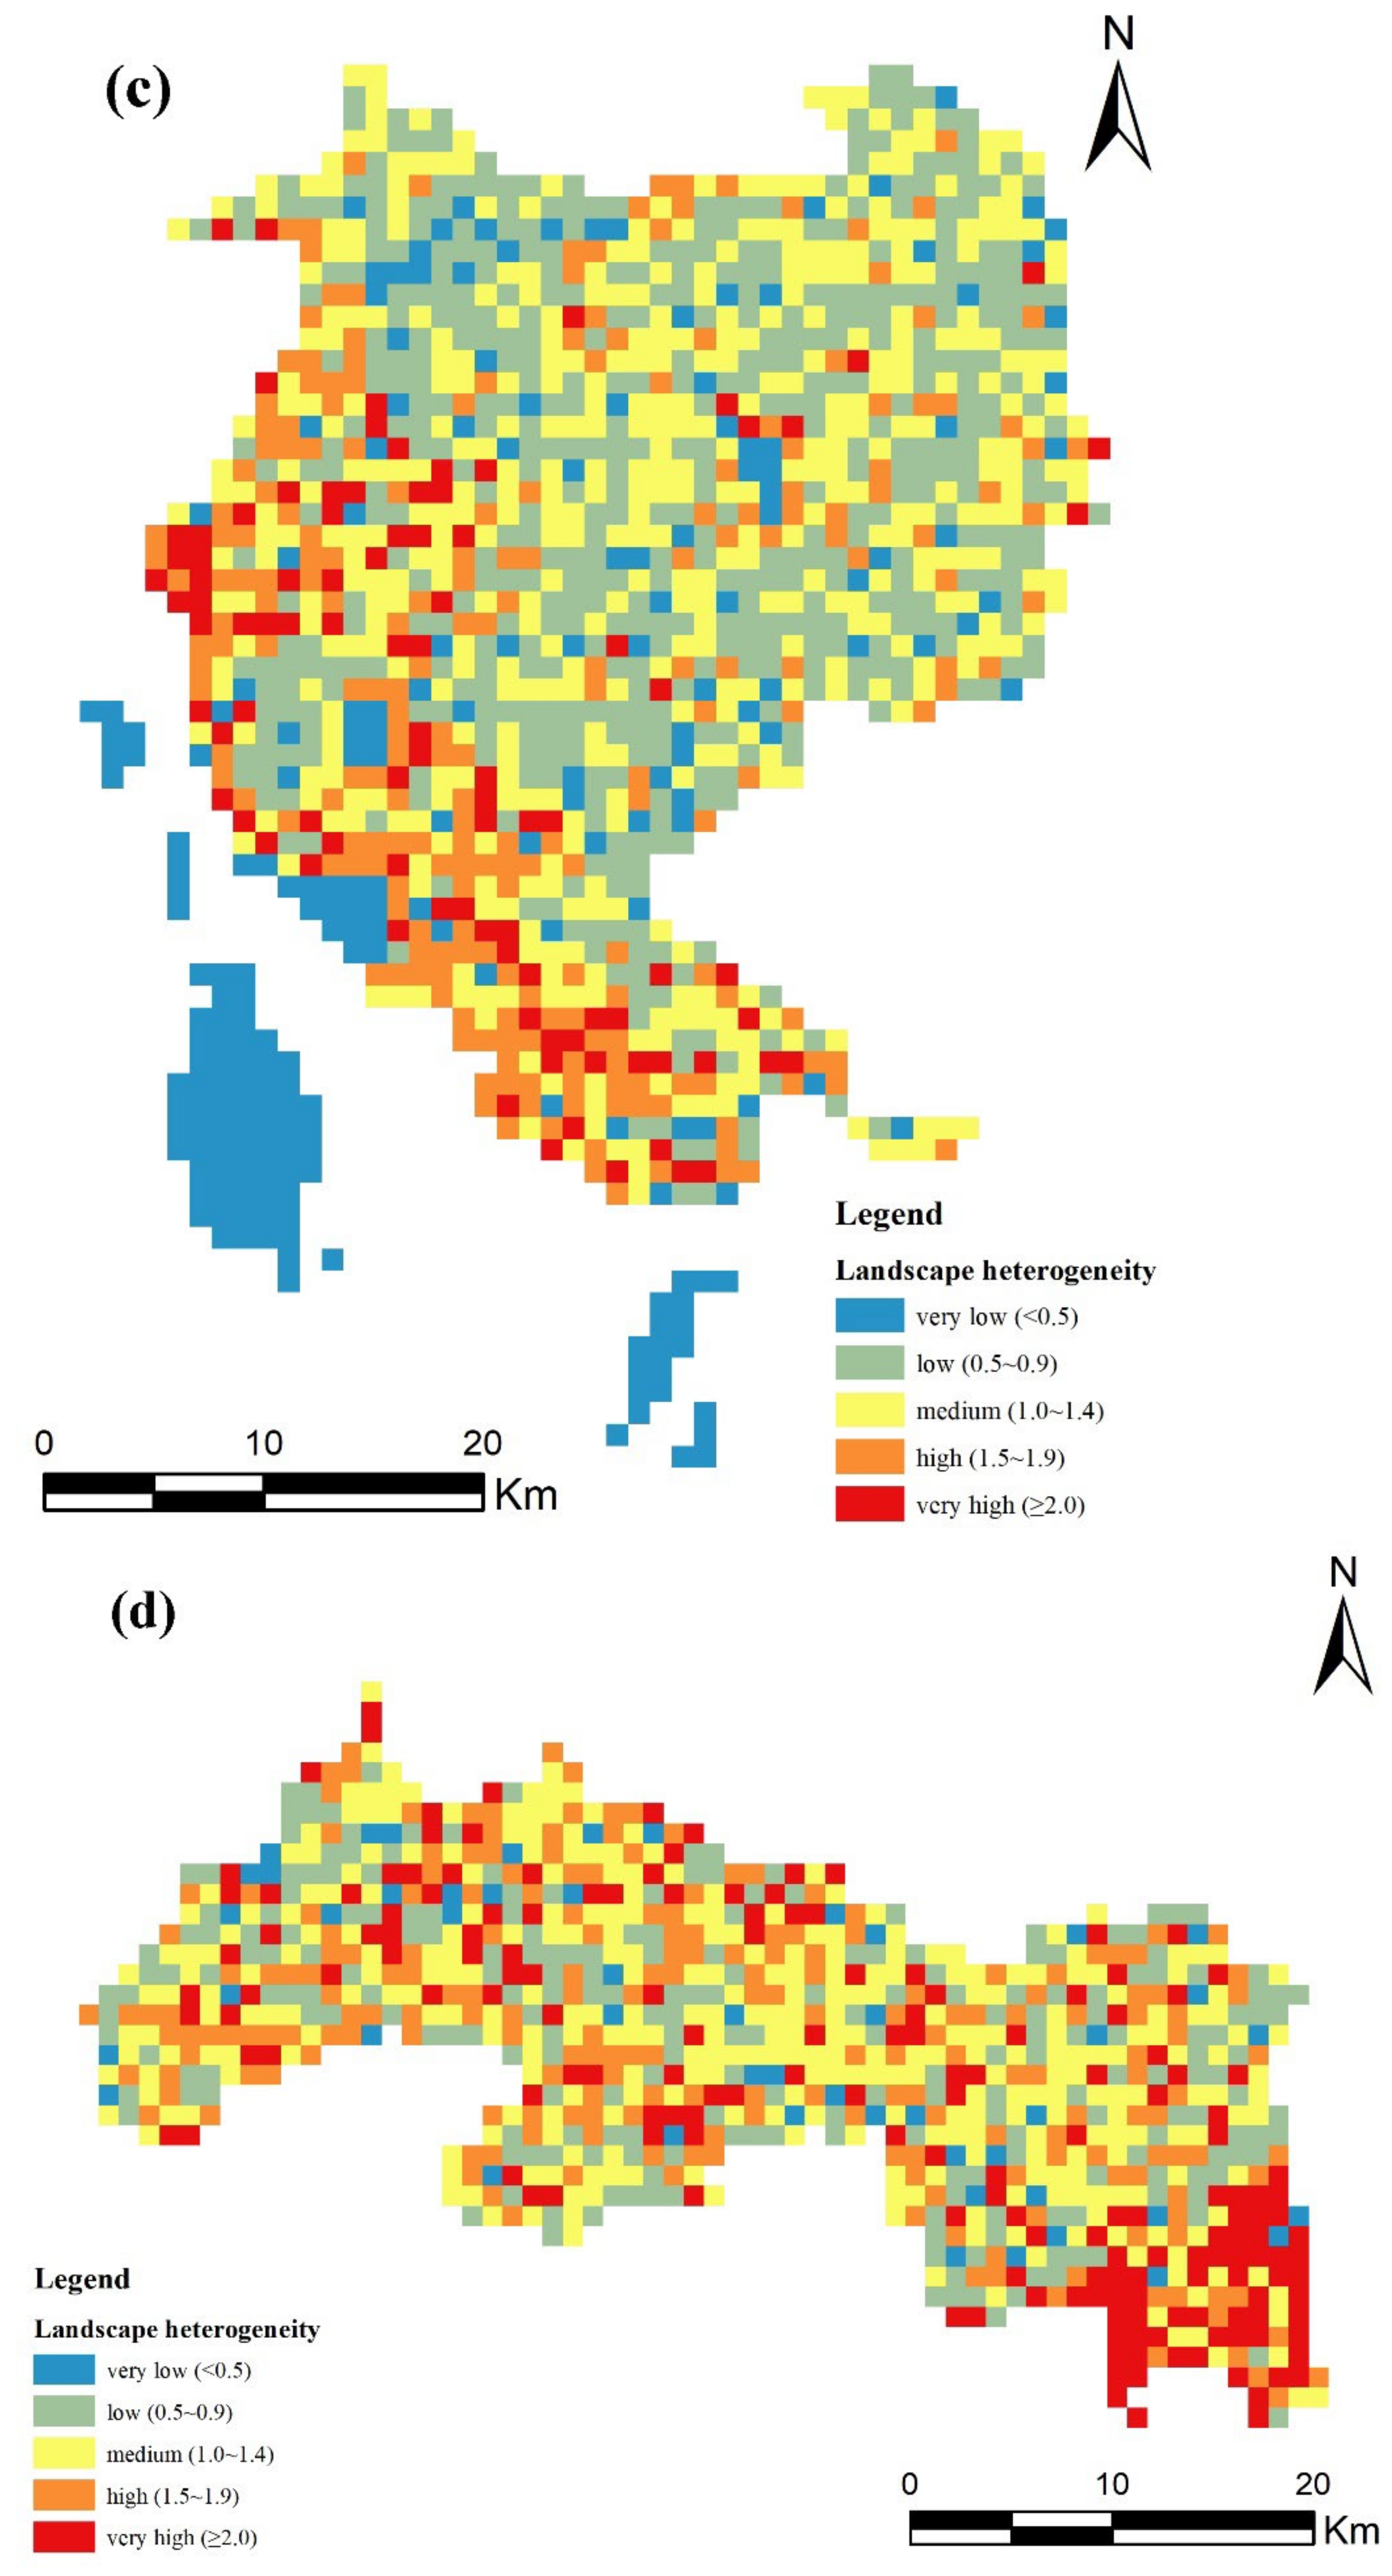
The landscape heterogeneity was quantitatively characterized using Rao’s quadratic entropy index, which is a comprehensive and useful metric for characterizing landscape heterogeneity and environment heterogeneity [28,29]. The calculation process was as follows: firstly, we divided each grid into four regions, according to the quality dimensions (descriptors) of each region, to calculate the semantic dissimilarity between two regions. Secondly, the quadratic entropy index (Q) was calculated to represent the landscape heterogeneity of each grid (Appendix A) (the formulas used are shown below). Landscape heterogeneity was divided into five levels: very high (≥2.0), high (1.5~1.9), medium (1.0~1.4), low (0.5~0.9) and very low (<0.5).
d C A , C B = i U W i S A i S B i 2
where d C A , C B is the semantic dissimilarity between regions A and B , U is the domain composed of all the considered quality dimensions, W i is the weight of each quality dimension/descriptor, and S is the score of this descriptor for each region C A , C B in the conceptual space.
Q = A U B U d C A , C B p A p B
where d C A , C B is the semantic dissimilarity between regions A and B , U is the domain composed of all the considered quality dimensions, and p A and p B are the proportions of areas of regions A and B .

2.5. Statistical Analysis

Regression analysis was used to explore the relationship between the proportion of semi-natural habitats and landscape heterogeneity. Regression analysis is a statistical method used to explore the quantitative relationship between explanatory variables and response variables, which can be divided into linear regression analysis and non-linear regression analysis according to the type of relationship between explanatory variables and response variables. The merits of the regression model fit are usually measured by the goodness of fit (R2); the maximum value of R2 is 1, where the closer the R2 value is to 1, the better the fit of the model, and the higher the degree of interpretation of the explanatory variable to the response variable. In this paper, the proportion of semi-natural habitats was used as the explanatory variable and landscape heterogeneity as the response variable for regression analysis. Analyses were carried out using SPSS 25.0. In addition, biota-environment (BIOENV) was used to explore the potential relationships between the composition and configuration characteristics of semi-natural habitats and landscape heterogeneity. Variation partitioning analysis (VPA) was used to determine the independent and interactive effects of semi-natural habitat composition and configuration on landscape heterogeneity in arable land systems. VPA is an unbiased decomposition of the total variance of the response variables into subvariances determined by the combination of individual explanatory variables. The above analysis was carried out using the Vegan package in R [30].

3. Results

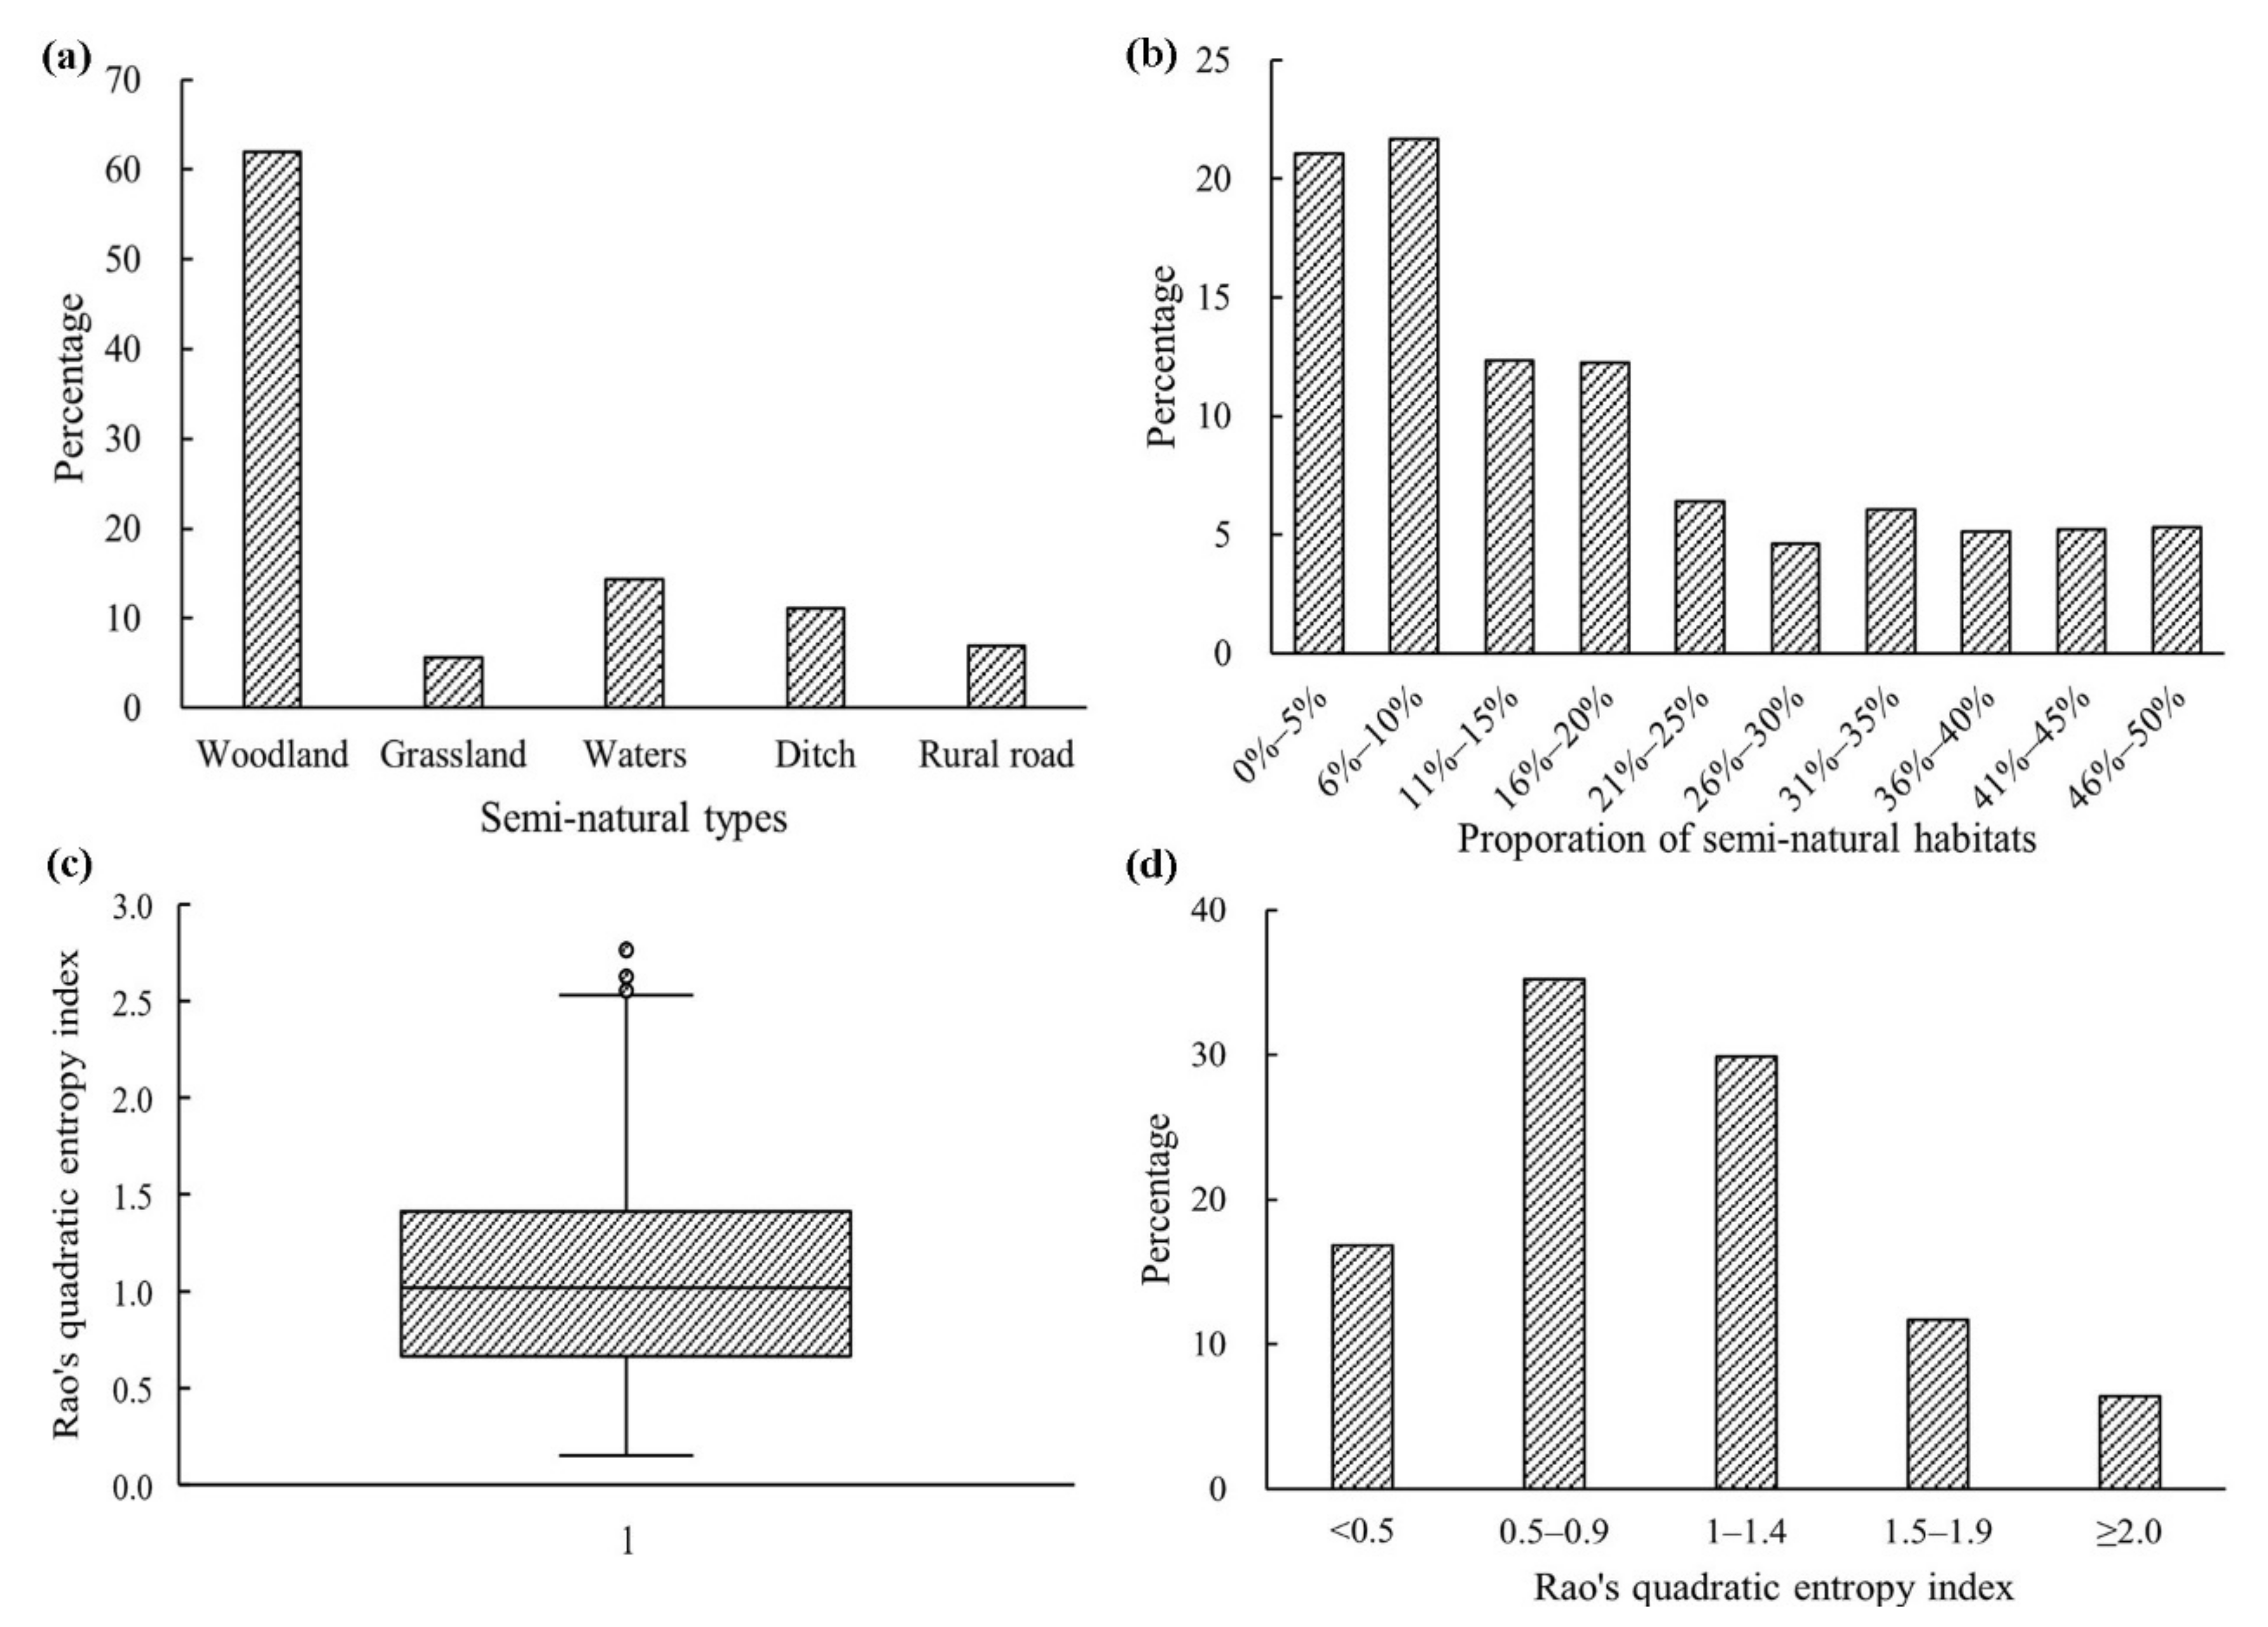
The results show that the proportion of semi-natural habitats in the study area was mainly distributed in the ranges of 0–5% and 6–10%, accounting for 43% of the total. The semi-natural habitat types in the arable land systems were mainly woodland, accounting for 62% of the total area of the semi-natural habitat. The minimum value of landscape heterogeneity was 0.2, and the maximum value was 2.8. The landscape heterogeneity in the study area was mainly concentrated at the low level (0.5–0.9), accounting for 35.2% (Figure 2).
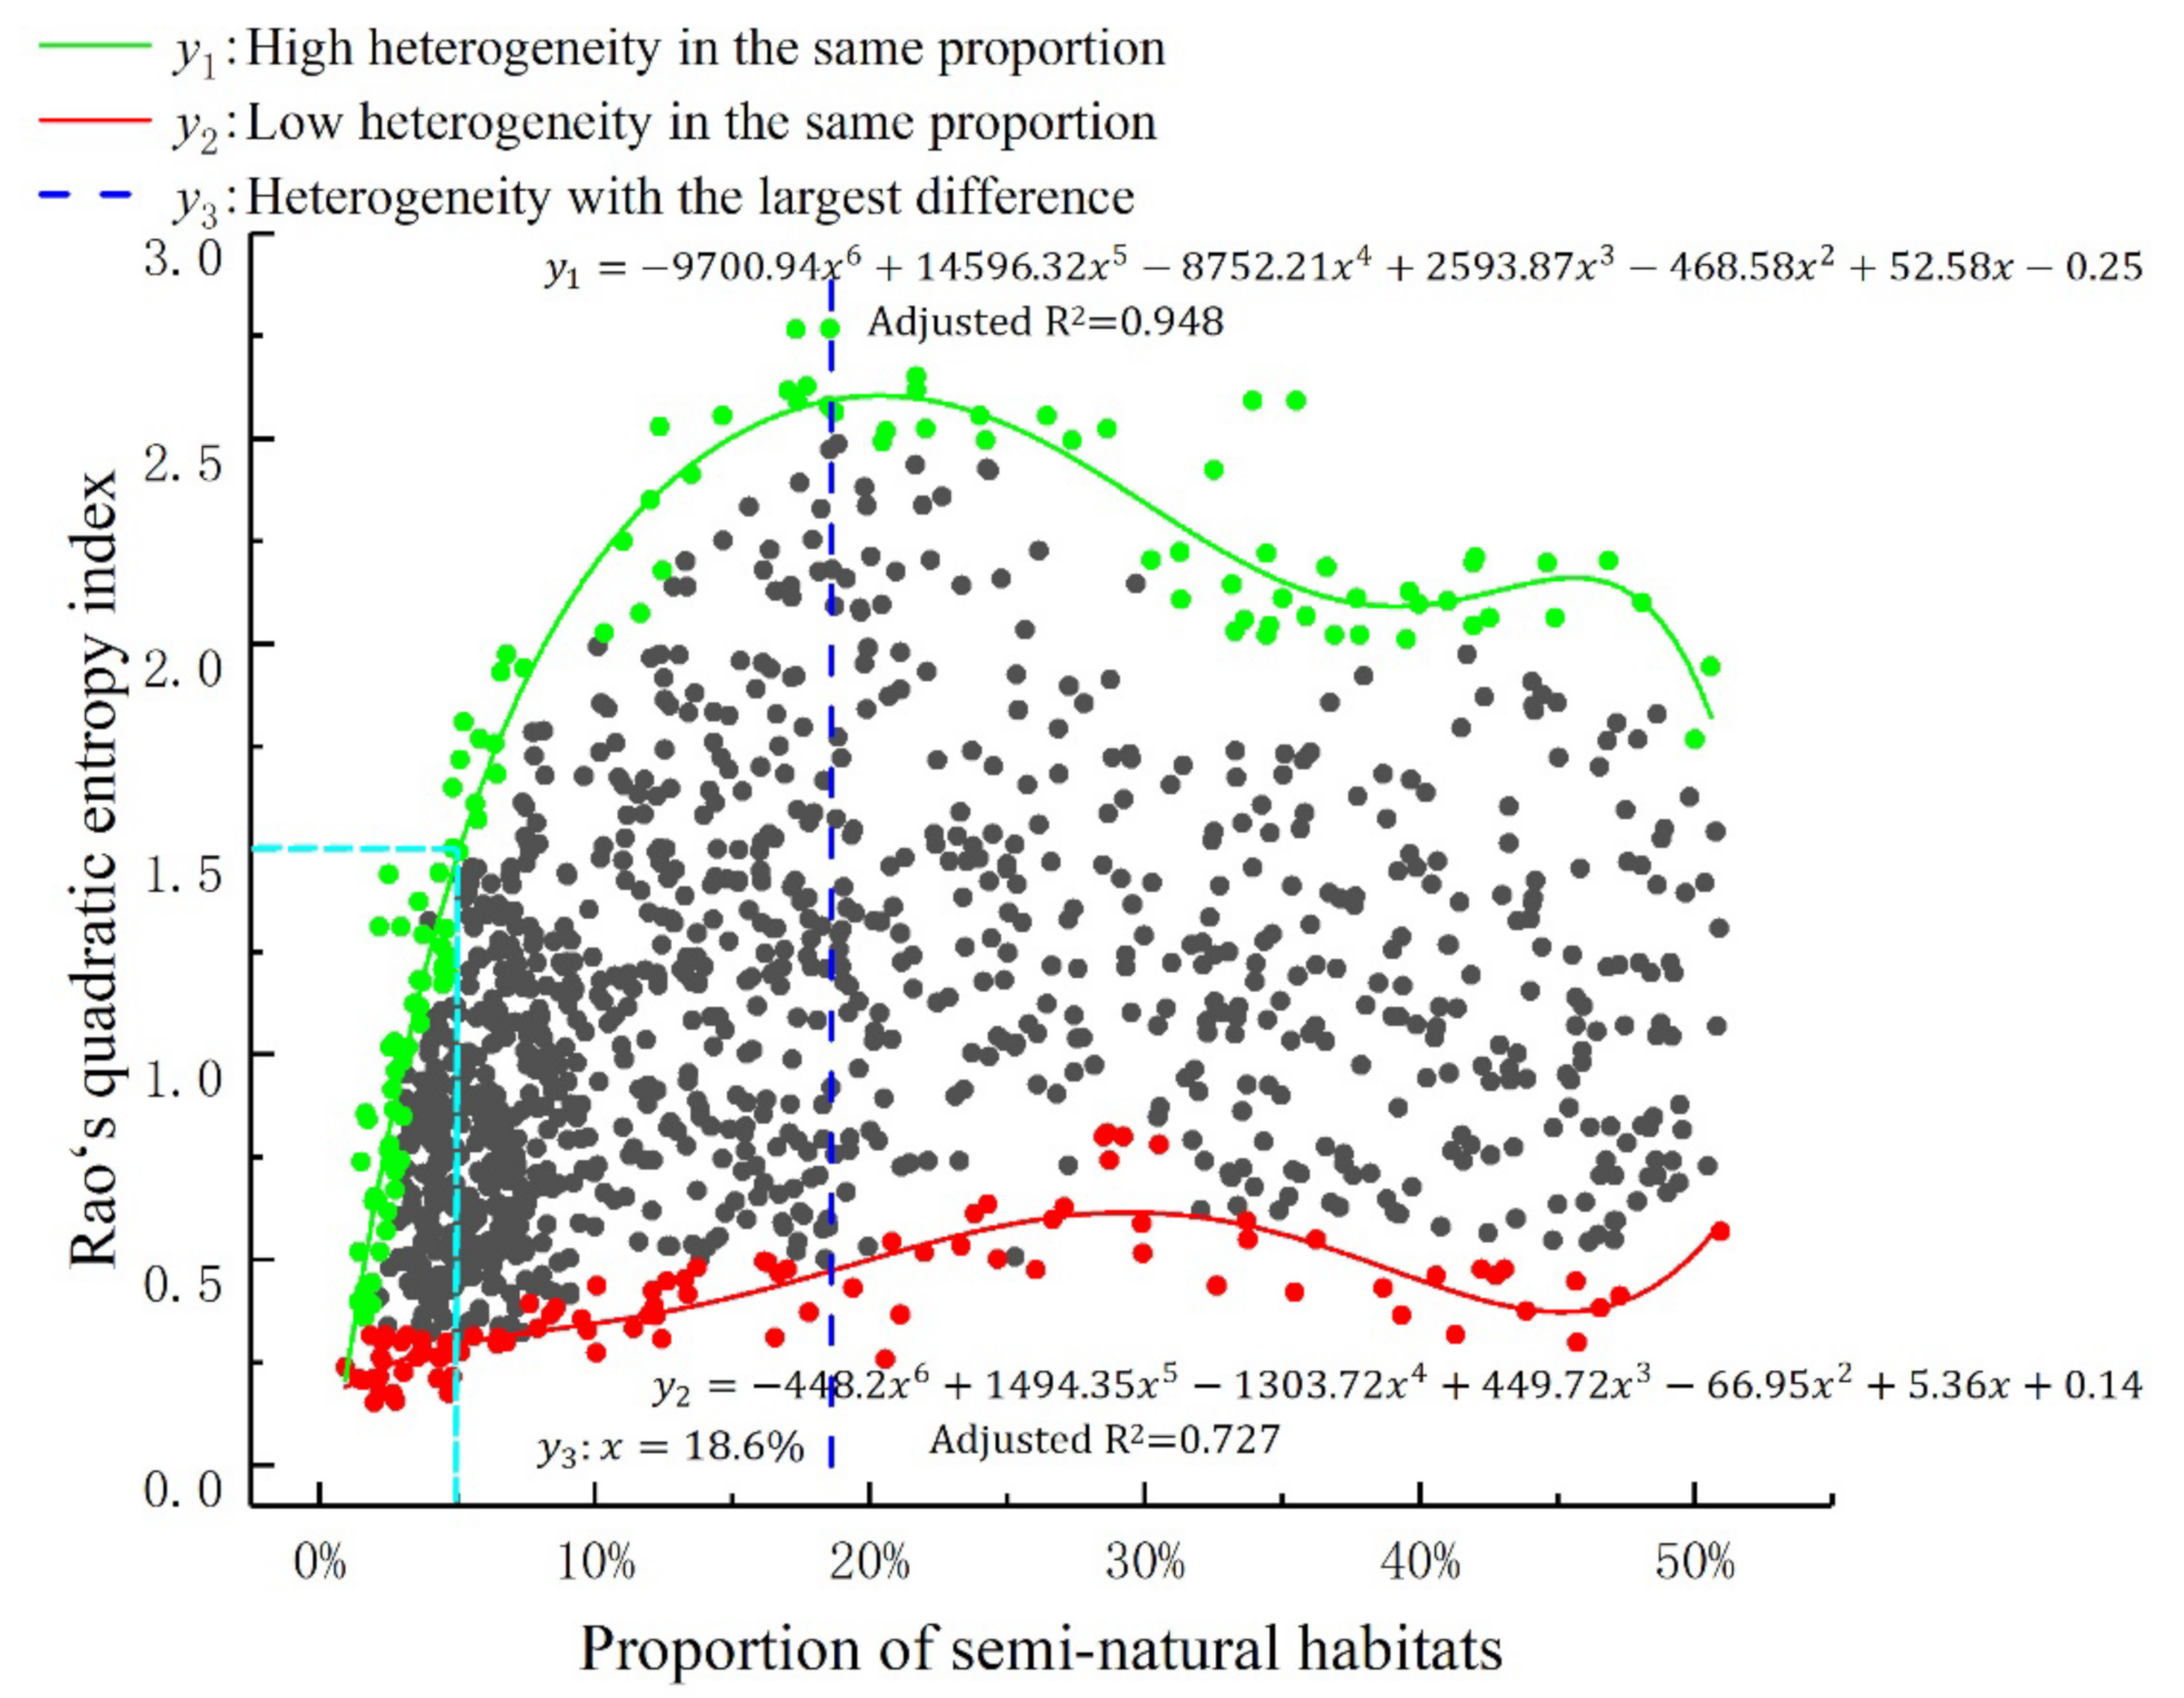
In order to explore the relationship between the proportion of semi-natural habitats and the heterogeneity of the landscape, the landscape heterogeneity corresponding to each proportion of semi-natural habitat ratio was ranked, and 115 high landscape heterogeneity points and 95 low landscape heterogeneity points at each proportion were selected for regression analysis, respectively. The regression analysis showed that the relationship between semi-natural habitat proportions and landscape heterogeneity is nonlinear. Landscape heterogeneity varied in the same proportions of semi-natural habitats. The goodness-of-fit degrees were 0.948 and 0.727. This result indicates that the proportion of semi-natural habitats explains a higher degree of landscape heterogeneity. The regression of high heterogeneity in the same proportion amplitude shows a tendency to increase first, then decrease and then increase. When the proportion of semi-natural habitats is 19%, the difference in landscape heterogeneity is maximized. In addition, we found that, when the proportion of semi-natural habitats is less than 5%, the landscape heterogeneity is at a low or medium level, and the landscape heterogeneity cannot reach a high level regardless of the composition and configuration of the semi-natural habitats in the arable land system (Figure 3). Consequently, a semi-natural habitat proportion of 5% is the minimum threshold for achieving high landscape heterogeneity in arable land systems. Moreover, the curve sharply increases when the proportion of seminatural vegetation goes from 0% to approximately 10%; then, the rate of increase slows down. This indicates that when semi-natural vegetation share is low, a relatively modest increase in this range produces a high benefit in terms of heterogeneity.
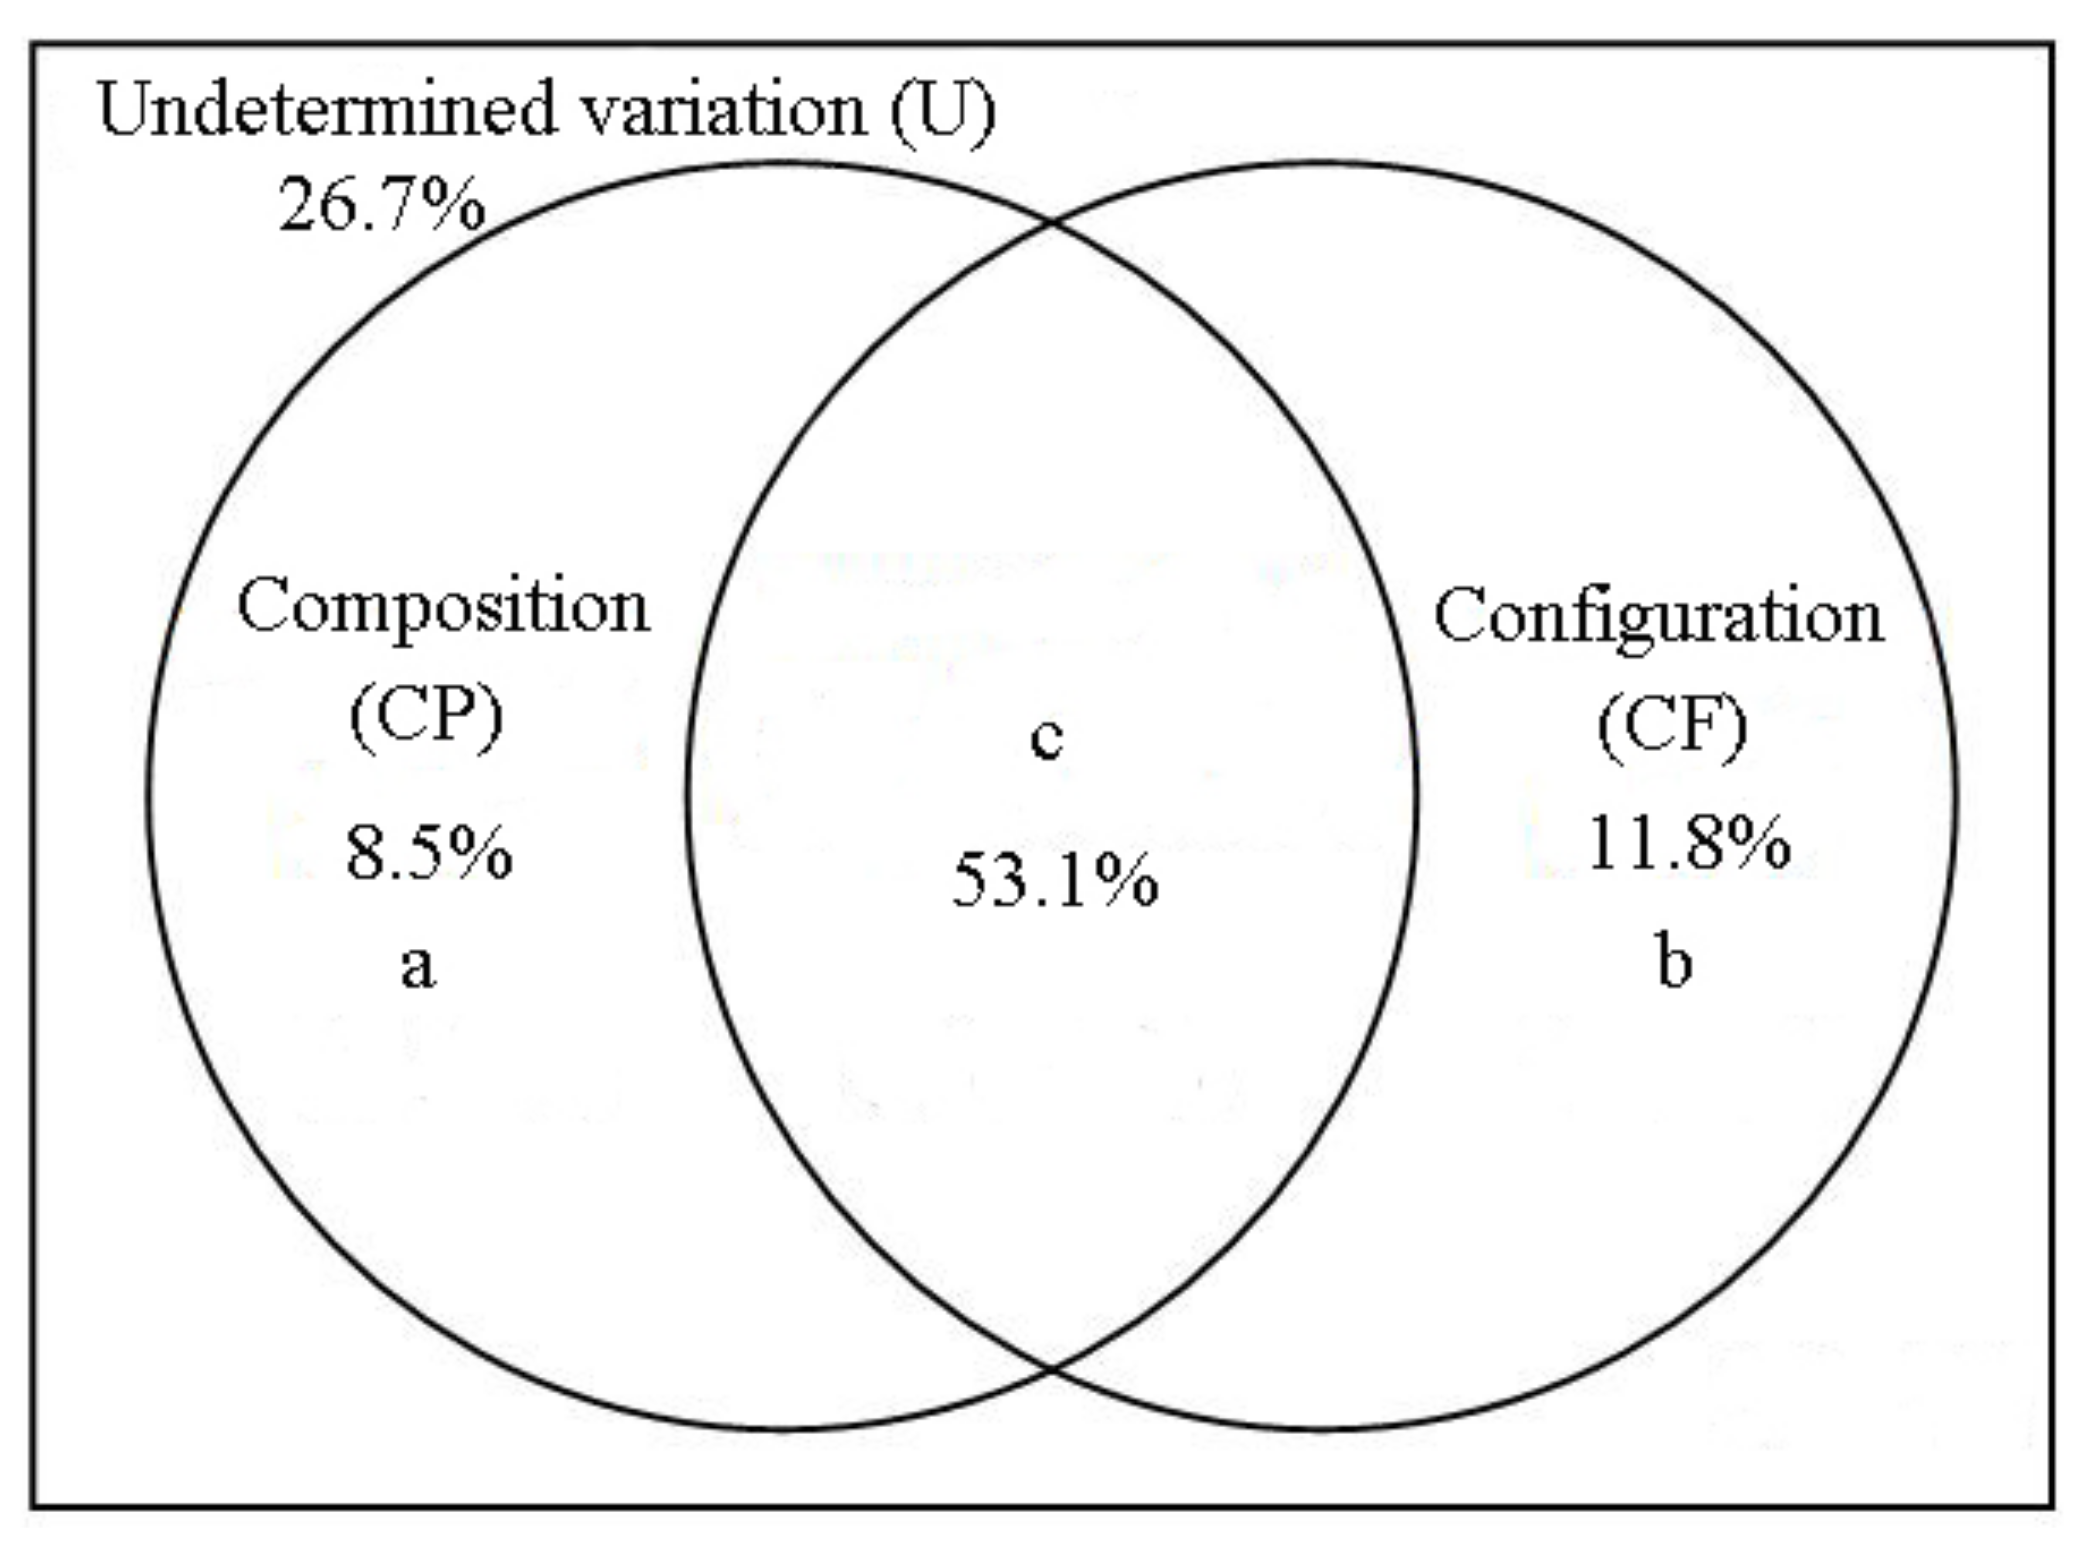
The BIOENV analysis indicated that the types of semi-natural habitat, namely, woodland, waters and ditch, combined to give a maximum R value of 0.35 (p < 0.01), indicating that this combination of semi-natural habitat composition best explained the variation in the landscape heterogeneity (Table 2). For configuration, the aggregation index (AI) and patch cohesion index (COHESION) combined to give a maximum R value of 0.52 (p < 0.01), indicating that this combination of semi-natural habitat configuration best explained the variation in the landscape heterogeneity (Table 3). Variance partitioning (Figure 4) confirmed that the optimal composition and configuration of semi-natural habitat can explain the variation in landscape heterogeneity well (73.3% of the total variability). However, there are also differences in the degree of interpretation of landscape heterogeneity by semi-natural habitat composition and configuration. The composition of semi-natural habitat explained 8.5% of the total variability, whereas the configuration of semi-natural habitat explained 11.8%. The interpretation rate of landscape heterogeneity by semi-natural habitat structures was higher. The interactive effects of composition and configuration represented 53.1% of the total variability.
The results of the variance portioning test show that the composition of semi-natural habitats, the configuration of semi-natural habitats and the interaction of the two in the interpretation of landscape heterogeneity all passed the significance test. The composition of semi-natural habitats, the configuration of semi-natural habitats and the interaction between the two significantly explained the differences in the strength and weakness of landscape heterogeneity (p < 0.01), which is of statistical significance (Table 4).

4. Discussion

We studied the minimum proportion threshold of semi-natural habitats required to achieve high landscape heterogeneity in arable land systems and explored the quantitative influence of semi-natural habitat composition and configuration on landscape heterogeneity. The results show that if the proportion of semi-natural habitats in the arable land system is too low, no matter how their composition and configuration are optimized, it is impossible to achieve high landscape heterogeneity. Achieving high landscape heterogeneity in arable land systems requires a minimum threshold for the proportion of semi-natural habitats. Landscape heterogeneity in arable land systems depends largely on the composition and configuration of semi-natural habitats, and the interaction between the two can better explain landscape heterogeneity. However, there are also differences in the degree of interpretation of landscape heterogeneity by semi-natural habitat composition and configuration, and the interpretation rate of landscape heterogeneity by semi-natural habitat structures is higher.
The retention of semi-natural habitats has been shown to provide benefits for maintaining landscape heterogeneity and ecosystem services in arable land systems [7,8,11,31,32]. This study found that maintaining a 5% proportion of semi-natural habitats is the minimum threshold for achieving high landscape heterogeneity in arable land systems (Figure 3), which is in agreement with the recommended minimum share for Ecological Focus Areas (EFAs) established in the current CAP for arable farms [33]. However, the proposals for the post-2020 CAP (budget period: 2021–2027) outline plans to abandon EFAs in their current format [34]. Instead, it is proposed that member states set a minimum share of agricultural area devoted to non-productive features or areas, with the threshold area and available landscape/habitat options being set by member states [14]. With the proportion of semi-natural habitats set at 5%, there is likely to be little additionality for the conservation of semi-natural habitats on the most Irish farms, or indeed wider European farmland [35]. Retaining a 10% share of semi-natural habitats is beneficial for both agricultural production and land ecology [15], which has also been confirmed in our study. Nevertheless, arable land mostly presents large patches and an intensive pattern, and there is no policy requirement to protect semi-natural habitats in arable land systems in China [36]. Our study found that 21.1% of grids had a proportion of semi-natural habitats of less than 5% (Figure 2), which is a potential threat to farmland biodiversity. Biodiversity is still at a low level in the arable land systems of China [37]. Nonetheless, the Chinese government has gradually realized the necessity of biodiversity conservation; especially in recent years, the worrying trends of declining biodiversity have continued [38]. Ensuring the high heterogeneity of arable land systems is still a prerequisite for biodiversity conservation, and high heterogeneity can provide habitat and sufficient food sources for farmland organisms, which is a key factor in maintaining farmland biodiversity [7,39]. In addition, the presence of semi-natural habitats facilitates conservation biological control (CBC), which is an important way to control pests and reduce the use of pesticides through nature-based solutions [40]. The focus of the CBC strategy is to reverse the negative effects of intensification on natural enemies, reduce human disturbance to land and establish beneficial habitats for enemies. Among them, habitat management is the main factor considered in the CBC strategy. Enhancing landscape composition or complexity, increasing semi-natural habitat plant diversification and reducing planting intensity have all been identified as effective conservation strategies for natural enemies [41]. Reducing the intensity of agricultural land utilization, improving landscape heterogeneity, and improving habitat quality are important conditions for agricultural sustainability.
This study showed that the types of semi-natural habitat, namely, woodland, waters and ditch, best explained the variation in the landscape heterogeneity (R = 0.35, p < 0.01) (Table 2). The proportion of woodland area is one of the most important factors that affect the degree of habitat availability [42]. Although increasing the proportion of woodland is economically costly and represents a slow development, it can significantly improve the heterogeneity of the landscape in the long run, which is of great ecological value. In addition, the primary role of woodland and hedges adjacent to arable land is to provide crop protection (such as reducing the wind speed and soil erosion), leading to improved crop yields. There can be competition between woodland/hedges and crop plants. Shade affects the growth of nearby crops by reducing air and soil temperatures. However, it has a positive effect on crop yields within the field [43]. Woodlands and hedges increase biodiversity in arable land systems, The importance of woodland and hedgerows to farmland birds is well established. Moreover, they can also affect the density and diversity of insect activity in arable land systems (such as spiders and beetles, which are major predators in arable land systems) [7]. Woodland and hedgerows also facilitate the storage of organic carbon [44]. Waters and ditches, in their inherent form, guarantee their relative areas in arable land systems. Ditches can be expected to differ from other semi-natural habitats in several aspects [45]. Being line-shaped landscape elements with a high edge ratio, ditches can effectively convert and retain pollutants from arable land [46,47]. Therefore, the creation of semi-natural habitats of woodland, waters and ditches in arable land systems can not only improve landscape heterogeneity but also enhance ecosystem service capacity.
However, semi-natural habitat composition and configuration affect landscape heterogeneity independently and interactively [22,48]. Our research showed that the interaction between the two can better explain landscape heterogeneity (explained 53.1%). In terms of the independent effect, semi-natural habitat configuration explains landscape heterogeneity better than semi-natural habitat composition (Figure 4). Moreover, improving landscape heterogeneity by optimizing the landscape configuration in arable land systems, thereby increasing biodiversity and maintaining landscape services and functions, has long become an important part of agricultural environmental protection [49,50,51]. In this study, the aggregation index (AI) and patch cohesion index (COHESION) combination of semi-natural habitat configurations best explained the variation in the landscape heterogeneity (R = 0.52, p < 0.01) (Table 3). This result implies that ensuring habitat connectivity is important to enhance landscape heterogeneity. Loss of connectivity can reduce the size and quality of available habitat [52]. Moreover, it also weakens landscape heterogeneity by reducing the number and size of habitats and increasing unfavorable spatial arrangements of habitats [53,54]. Changes in landscape configuration may also affect populations of enemies [55]. With habitat fragmentation, habitat patch connectivity declines. Studies have shown that populations of enemies are sensitive to habitat fragmentation and connectivity [56]. The proportion of semi-natural habitats reaching 5% is only the minimum threshold for achieving high landscape heterogeneity. The configuration of semi-natural habitats in arable land systems is particularly important. Ensuring the connectivity of semi-natural habitats is a key element of landscape design and planning in arable land systems. Studies have considered the configuration of all semi-natural landscape elements to be a functionally coherent ecological network; this network enhances predation and parasitism and may reduce crop damage by insect pests [57,58]. Constructing corridors between different semi-natural habitats so that semi-natural habitats form interconnected ecological networks is an important way to enhance landscape heterogeneity and biodiversity in arable land systems [59].

5. Conclusions

Semi-natural habitats play an important role in enhancing landscape heterogeneity and maintaining biodiversity in arable land systems [7,8,11,60]. This study indicates that achieving high landscape heterogeneity in arable land systems requires a minimum threshold for the proportion of semi-natural habitats, which is 5%, since our study found that landscape heterogeneity is consistently low or medium when the proportion of semi-natural habitats is less than 5%. However, landscape heterogeneity can reach a higher level when the proportion of semi-natural habitats is higher than 5%, but it also depends on other factors such as the type and structure of semi-natural habitats in the arable land system. Therefore, 5% is only the minimum threshold for achieving high landscape heterogeneity, but it does not guarantee that high landscape heterogeneity will be achieved if the proportion of semi-natural habitats reaches 5%. In fact, reaching a 10% share could be a good compromise in terms of benefits gained (sharp increase of heterogeneity) with respect to costs (reduction of cultivable land). However, we found that 21% of arable land systems had a proportion of semi-natural habitats below 5% in the study area. We propose achieving the goal of retaining at least 5% of the semi-natural habitat firstly in the Lower Liaohe Plain arable land system. However, how to plan and design this 5% semi-natural habitat in the arable land system is an important question that needs to be considered in future research. Meanwhile the government should compensate for the preservation of semi-natural habitats and establish a level of compensation based on the proportion of protection. In addition, farmers should be instructed to consider the type and connectivity of semi-natural habitats when preserving them.

Author Contributions

All authors made significant contributions to the preparation of this manuscript. All authors have read and agreed to the published version of the manuscript.

Funding

This work was funded by the Natural Science Foundation of Liaoning Province (2019-ZD-0709).

Institutional Review Board Statement

Not applicable.

Informed Consent Statement

Not applicable.

Data Availability Statement

The data used to support the findings of this study are available from the corresponding author upon request.

Acknowledgments

We thank Lu Liu of Wageningen University for the helpful discussion and remarks on an earlier version of the manuscript. Additionally, thanks to the reviewers for their valuable feedback on the manuscript.

Conflicts of Interest

The authors declare no conflict of interest.

Appendix A

Figure A1. Spatial distribution map of landscape heterogeneity based on 1 km × 1 km raster. (a) Zhangwu County. (b) Changtu County. (c) Dawa County. (d) Dengta County.
Land 11 01018 g0a1aLand 11 01018 g0a1b

References

  1. Campbell, B.M.; Beare, D.J.; Bennett, E.M.; Hall-Spencer, J.M.; Ingram, J.S.; Jaramillo, F.; Ortiz, R.; Ramankutty, N.; Sayer, J.A.; Shindell, D. Agriculture production as a major driver of the Earth system exceeding planetary boundaries. Ecol. Soc. 2017, 22, 8. [Google Scholar] [CrossRef]
  2. Tscharntke, T.; Tylianakis, J.M.; Rand, T.A.; Didham, R.K.; Fahrig, L.; Batáry, P.; Bengtsson, J.; Clough, Y.; Crist, T.O.; Dormann, C.F.; et al. Landscape moderation of biodiversity patterns and processes—Eight hypotheses. Biol. Rev. 2012, 87, 661–685. [Google Scholar] [CrossRef] [PubMed]
  3. Cardinale, B.J.; Duffy, J.E.; Gonzalez, A.; Hooper, D.U.; Perrings, C.; Venail, P.; Narwani, A.; Mace, G.M.; Tilman, D.; Wardle, D.A.; et al. Biodiversity loss and its impact on humanity. Nature 2012, 486, 59–67. [Google Scholar] [CrossRef] [PubMed]
  4. Raven, P.H.; Wagner, D.L. Agricultural intensification and climate change are rapidly decreasing insect biodiversity. Proc. Natl. Acad. Sci. USA 2021, 118, e2002548117. [Google Scholar] [CrossRef]
  5. Alsterberg, C.; Roger, F.; Sundbäck, K.; Juhanson, J.; Hulth, S.; Hallin, S.; Gamfeldt, L.; Naturvetenskapliga, F.; Faculty, O.S.; Göteborgs, U.; et al. Habitat diversity and ecosystem multifunctionality-The importance of direct and indirect effects. Sci. Adv. 2017, 3, e1601475. [Google Scholar] [CrossRef] [Green Version]
  6. Tamburini, G.; Bommarco, R.; Wanger, T.C.; Kremen, C.; van der Heijden, M.G.A.; Liebman, M.; Hallin, S.; Sveriges, L. Agricultural diversification promotes multiple ecosystem services without compromising yield. Sci. Adv. 2020, 6, eaba1715. [Google Scholar] [CrossRef]
  7. Benton, T.G.; Vickery, J.A.; Wilson, J.D. Farmland biodiversity: Is habitat heterogeneity the key? Trends Ecol. Evol. 2003, 18, 182–188. [Google Scholar] [CrossRef]
  8. García-Feced, C.; Weissteiner, C.J.; Baraldi, A.; Paracchini, M.L.; Maes, J.; Zulian, G.; Kempen, M.; Elbersen, B.; Pérez-Soba, M. Semi-natural vegetation in agricultural land: European map and links to ecosystem service supply. Agron. Sustain. Dev. 2015, 35, 273–283. [Google Scholar] [CrossRef] [Green Version]
  9. Zulian, G.; Maes, J.; Paracchini, M. Linking Land Cover Data and Crop Yields for Mapping and Assessment of Pollination Services in Europe. Land 2013, 2, 472–492. [Google Scholar] [CrossRef] [Green Version]
  10. Rega, C.; Bartual, A.M.; Bocci, G.; Sutter, L.; Albrecht, M.; Moonen, A.; Jeanneret, P.; van der Werf, W.; Pfister, S.C.; Holland, J.M.; et al. A pan-European model of landscape potential to support natural pest control services. Ecol. Indic. 2018, 90, 653–664. [Google Scholar] [CrossRef]
  11. Wezel, A.; Casagrande, M.; Celette, F.; Vian, J.; Ferrer, A.; Peigné, J. Agroecological practices for sustainable agriculture. A review. Agron. Sustain. Dev. 2014, 34, 1–20. [Google Scholar] [CrossRef] [Green Version]
  12. Batáry, P.; Dicks, L.V.; Kleijn, D.; Sutherland, W.J. The role of agri-environment schemes in conservation and environmental management. Conserv. Biol. 2015, 29, 1006–1016. [Google Scholar] [CrossRef] [Green Version]
  13. Merckx, T.; Pereira, H.M. Reshaping agri-environmental subsidies: From marginal farming to large-scale rewilding. Basic Appl. Ecol. 2015, 16, 95–103. [Google Scholar] [CrossRef] [Green Version]
  14. Commission Implementing Regulation (EU). 2021/2289 of 21 December 2021 laying down rules for the application of Regulation (EU) 2021/2115 of the European Parliament and of the Council on the presentation of the content of the CAP Strategic Plans and on the electronic system for the secure exchange of information. Off. J. Eur. Union 2021. Available online: http://data.europa.eu/eli/reg_impl/2021/2289/oj (accessed on 22 May 2022).
  15. Czúcz, B.; Baruth, B.; Terres, J.M.; Gallego, J.; Hagyo, A.; Angileri, V.; Nocita, M.; Soba, M.P.; Koeble, R.; Paracchini, M.L. Classification and Quantification of Landscape Features in Agricultural Land across the EU; European Commission: Brussels, Belgium, 2022. [Google Scholar]
  16. Tscharntke, T.; Batáry, P.; Dormann, C.F. Set-aside management: How do succession, sowing patterns and landscape context affect biodiversity? Agric. Ecosyst. Environ. 2011, 143, 37–44. [Google Scholar] [CrossRef]
  17. Holzkämper, A.; Lausch, A.; Seppelt, R. Optimizing landscape configuration to enhance habitat suitability for species with contrasting habitat requirements. Ecol. Model. 2006, 198, 277–292. [Google Scholar] [CrossRef]
  18. Harlio, A.; Kuussaari, M.; Heikkinen, R.K.; Arponen, A. Incorporating landscape heterogeneity into multi-objective spatial planning improves biodiversity conservation of semi-natural grasslands. J. Nat. Conserv. 2019, 49, 37–44. [Google Scholar] [CrossRef]
  19. Viana, C.M.; Freire, D.; Abrantes, P.; Rocha, J.; Pereira, P. Agricultural land systems importance for supporting food security and sustainable development goals: A systematic review. Sci. Total Environ. 2022, 806, 150718. [Google Scholar] [CrossRef]
  20. Mitchell, M.S.; Powell, R.A. A mechanistic home range model for optimal use of spatially distributed resources. Ecol. Model. 2004, 177, 209–232. [Google Scholar] [CrossRef]
  21. Fahrig, L.; Nuttle, W.K. Population Ecology in Spatially Heterogeneous Environments. In Ecosystem Function in Heterogeneous Landscapes; Lovett, G.M., Turner, M.G., Jones, C.G., Weathers, K.C., Eds.; Springer: New York, NY, USA, 2005. [Google Scholar]
  22. Pasher, J.; Mitchell, S.W.; King, D.J.; Fahrig, L.; Smith, A.C.; Lindsay, K.E. Optimizing landscape selection for estimating relative effects of landscape variables on ecological responses. Landsc. Ecol. 2013, 28, 371–383. [Google Scholar] [CrossRef]
  23. Zheng, X.; Zhu, J. A new climatic classification of afforestation in Three-North regions of China with multi-source remote sensing data. Theor. Appl. Climatol. 2017, 127, 465–480. [Google Scholar] [CrossRef]
  24. O’Neill, R.V.; Hunsaker, C.T.; Timmins, S.P.; Jackson, B.L.; Jones, K.B.; Riitters, K.H.; Wickham, J.D. Scale problems in reporting landscape pattern at the regional scale. Landsc. Ecol. 1996, 11, 169–180. [Google Scholar] [CrossRef]
  25. Martin, E.A.; Dainese, M.; Clough, Y.; Báldi, A.; Bommarco, R.; Gagic, V.; Garratt, M.P.D.; Holzschuh, A.; Kleijn, D.; Kovács Hostyánszki, A.; et al. The interplay of landscape composition and configuration: New pathways to manage functional biodiversity and agroecosystem services across Europe. Ecol. Lett. 2019, 22, 1083–1094. [Google Scholar] [CrossRef] [Green Version]
  26. Uuemaa, E.; Antrop, M.; Roosaare, J.; Marja, R.; Mander, Ü. Landscape Metrics and Indices: An Overview of Their Use in Landscape Research. Living Rev. Landsc. Res. 2009, 3, 1–28. [Google Scholar] [CrossRef]
  27. Hesselbarth, M.H.K.; Sciaini, M.; With, K.A.; Wiegand, K.; Nowosad, J. landscapemetrics: An open-source R tool to calculate landscape metrics. Ecography 2021, 42, 1648–1657. [Google Scholar] [CrossRef] [Green Version]
  28. Díaz-Varela, E.; Roces-Díaz, J.V.; Álvarez-Álvarez, P. Detection of landscape heterogeneity at multiple scales: Use of the Quadratic Entropy Index. Landsc. Urban Plan 2016, 153, 149–159. [Google Scholar] [CrossRef]
  29. Doxa, A.; Prastacos, P. Using Rao’s quadratic entropy to define environmental heterogeneity priority areas in the European Mediterranean biome. Biol. Conserv. 2020, 241, 108366. [Google Scholar] [CrossRef]
  30. Oksanen, J.; Blanchet, F.G.; Friendly, M.; Kindt, R.; Legendre, P.; McGlinn, D.; Minchin, P.R.; O’Hara, R.B.; Simpson, G.L.; Solymos, P.; et al. Vegan: Community Ecology Package. R Package Version 2.5–6. 2020. Available online: https://CRAN.R-project.org/package=vegan (accessed on 22 May 2022).
  31. Amaral, T.S.D.; Santos, J.S.D.; Rosa, F.F.; Pessôa, M.B.; Chaves, L.J.; Ribeiro, M.C.; Collevatti, R.G. Agricultural Landscape Heterogeneity Matter: Responses of Neutral Genetic Diversity and Adaptive Traits in a Neotropical Savanna Tree. Front. Genet. 2021, 11, 606222. [Google Scholar] [CrossRef]
  32. Sirami, C.; Gross, N.; Baillod, A.B.; Bertrand, C.; Carrié, R.; Hass, A.; Henckel, L.; Miguet, P.; Vuillot, C.; Alignier, A.; et al. Increasing crop heterogeneity enhances multitrophic diversity across agricultural regions. Proc. Natl. Acad. Sci. USA 2019, 116, 16442–16447. [Google Scholar] [CrossRef] [Green Version]
  33. European Commission. Regulation (EU) No. 1307/2013 of the European Parliament and of the Council of 17 December 2013. Off. J. Eur. Union 2013 608–670. Available online: http://data.europa.eu/eli/reg/2013/1307/oj (accessed on 22 May 2022).
  34. European Commission. The Post-2020 Common Agricultural Policy: Environmental Benefits and Simplification; European Network for Rural Development: Eisenstadt, Austria, 2019; CID: 20.500.12592/svct60. [Google Scholar]
  35. Rotchés-Ribalta, R.; Ruas, S.; Ahmed, K.D.; Gormally, M.; Moran, J.; Stout, J.; White, B.; HUallacháin, D.Ó. Assessment of semi-natural habitats and landscape features on Irish farmland: New insights to inform EU Common Agricultural Policy implementation. Ambio 2021, 50, 346–359. [Google Scholar] [CrossRef]
  36. Li, L.; Hu, R.; Huang, J.; Bürgi, M.; Zhu, Z.; Zhong, J.; Lü, Z. A farmland biodiversity strategy is needed for China. Nat. Ecol. Evol. 2020, 4, 772–774. [Google Scholar] [CrossRef]
  37. Guo, X.; Bian, Z.; Wang, S.; Wang, Q.; Zhang, Y.; Zhou, J.; Lin, L. Prediction of the spatial distribution of soil arthropods using a random forest model: A case study in Changtu County, Northeast China. Agric. Ecosyst. Environ. 2020, 292, 106818. [Google Scholar] [CrossRef]
  38. Zheng, H.; Cao, S. Threats to China’s Biodiversity by Contradictions Policy. Ambio 2015, 44, 23–33. [Google Scholar] [CrossRef] [PubMed] [Green Version]
  39. Wang, X.; Wu, Y.; Manevski, K.; Fu, M.; Yin, X.; Chen, F. A Framework for the Heterogeneity and Ecosystem Services of Farmland Landscapes: An Integrative Review. Sustainability 2021, 13, 12463. [Google Scholar] [CrossRef]
  40. Holland, J.M.; Bianchi, F.J.; Entling, M.H.; Moonen, A.; Smith, B.M.; Jeanneret, P. Structure, function and management of semi-natural habitats for conservation biological control: A review of European studies. Pest Manag. Sci. 2016, 72, 1638–1651. [Google Scholar] [CrossRef]
  41. Begg, G.S.; Cook, S.M.; Dye, R.; Ferrante, M.; Franck, P.; Lavigne, C.; Lövei, G.L.; Mansion-Vaquie, A.; Pell, J.K.; Petit, S.; et al. A functional overview of conservation biological control. Crop Prot. 2017, 97, 145–158. [Google Scholar] [CrossRef]
  42. Cunningham, M.A.; Johnson, D.H. Proximate and landscape factors influence grassland bird distributions. Ecol. Appl. 2006, 16, 1062–1075. [Google Scholar] [CrossRef]
  43. Montgomery, I.; Caruso, T.; Reid, N. Hedgerows as Ecosystems: Service Delivery, Management, and Restoration. Annu. Rev. Ecol. Evol. Syst. 2020, 51, 81–102. [Google Scholar] [CrossRef]
  44. Holden, J.; Grayson, R.P.; Berdeni, D.; Bird, S.; Chapman, P.J.; Edmondson, J.L.; Firbank, L.G.; Helgason, T.; Hodson, M.E.; Hunt, S.F.P.; et al. The role of hedgerows in soil functioning within agricultural landscapes. Agric. Ecosyst. Environ. 2019, 273, 1–12. [Google Scholar] [CrossRef]
  45. Søndergaard, M.; Jeppesen, E.; Jensen, J.P. Pond or lake: Does it make any difference? Arch. Hydrobiol. 2005, 162, 143–165. [Google Scholar] [CrossRef]
  46. Herzon, I.; Helenius, J. Agricultural drainage ditches, their biological importance and functioning. Biol. Conserv. 2008, 141, 1171–1183. [Google Scholar] [CrossRef]
  47. Ahiablame, L.; Chaubey, I.; Smith, D. Nutrient Content at the Sediment-Water Interface of Tile-Fed Agricultural Drainage Ditches. Water 2010, 2, 411–428. [Google Scholar] [CrossRef] [Green Version]
  48. Fahrig, L.; Baudry, J.; Brotons, L.; Burel, F.G.; Crist, T.O.; Fuller, R.J.; Sirami, C.; Siriwardena, G.M.; Martin, J. Functional landscape heterogeneity and animal biodiversity in agricultural landscapes. Ecol. Lett. 2011, 14, 101–112. [Google Scholar] [CrossRef]
  49. Jackson, L.; van Noordwijk, M.; Bengtsson, J.; Foster, W.; Lipper, L.; Pulleman, M.; Said, M.; Snaddon, J.; Vodouhe, R. Biodiversity and agricultural sustainagility: From assessment to adaptive management. Curr. Opin. Environ. Sustain. 2010, 2, 80–87. [Google Scholar] [CrossRef]
  50. Ansell, D.; Freudenberger, D.; Munro, N.; Gibbons, P. The cost-effectiveness of agri-environment schemes for biodiversity conservation: A quantitative review. Agric. Ecosyst. Environ. 2016, 225, 184–191. [Google Scholar] [CrossRef]
  51. Li, X.; Zhang, J.; Huang, J.; Lin, W.; Wu, S.; Ma, M. To Preserve Green Buffer under Polarization and Diffusion Effects of a Fast-Developing Megalopolis. Land 2022, 11, 724. [Google Scholar] [CrossRef]
  52. Rudnick, D.; Ryan, S.J.; Beier, P.; Cushman, S.A.; Dieffenbach, F.; Epps, C.; Gerber, L.R.; Hartter, J.N.; Jenness, J.S.; Kintsch, J.; et al. The role of landscape connectivity in planning and implementing conservation and restoration priorities. Issues Ecol. 2012, 16, 1–20. [Google Scholar]
  53. Brückmann, S.V.; Krauss, J.; Steffan-Dewenter, I. Butterfly and plant specialists suffer from reduced connectivity in fragmented landscapes. J. Appl. Ecol. 2010, 47, 799–809. [Google Scholar] [CrossRef]
  54. Perović, D.; Gámez-Virués, S.; Börschig, C.; Klein, A.; Krauss, J.; Steckel, J.; Rothenwöhrer, C.; Erasmi, S.; Tscharntke, T.; Westphal, C. Configurational landscape heterogeneity shapes functional community composition of grassland butterflies. J. Appl. Ecol. 2015, 52, 505–513. [Google Scholar] [CrossRef] [Green Version]
  55. Fraterrigo, J.M.; Pearson, S.M.; Turner, M.G. Joint effects of habitat configuration and temporal stochasticity on population dynamics. Landsc. Ecol. 2009, 24, 863–877. [Google Scholar] [CrossRef]
  56. Bianchi, F.J.J.A.; Van der Werf, W. The Effect of the Area and Configuration of Hibernation Sites on the Control of Aphids by Coccinella septempunctata (Coleoptera: Coccinellidae) in Agricultural Landscapes: A Simulation Study. Environ. Entomol. 2003, 32, 1290–1304. [Google Scholar] [CrossRef] [Green Version]
  57. Thies, C.; Tscharntke, T. Landscape structure and biological control in agroecosystems. Science 1999, 285, 893–895. [Google Scholar] [CrossRef] [PubMed]
  58. Steingröver, E.G.; Geertsema, W.; van Wingerden, W.K.R.E. Designing agricultural landscapes for natural pest control: A transdisciplinary approach in the Hoeksche Waard (The Netherlands). Landsc. Ecol. 2010, 25, 825–838. [Google Scholar] [CrossRef]
  59. Samways, M.J.; Barton, P.S.; Birkhofer, K.; Chichorro, F.; Deacon, C.; Fartmann, T.; Fukushima, C.S.; Gaigher, R.; Habel, J.C.; Hallmann, C.A.; et al. Solutions for humanity on how to conserve insects. Biol. Conserv. 2020, 242, 108427. [Google Scholar] [CrossRef]
  60. Aguilera, G.; Roslin, T.; Miller, K.; Tamburini, G.; Birkhofer, K.; Caballero Lopez, B.; Lindström, S.A.M.; Öckinger, E.; Rundlöf, M.; Rusch, A.; et al. Crop diversity benefits carabid and pollinator communities in landscapes with semi-natural habitats. J. Appl. Ecol. 2020, 57, 2170–2179. [Google Scholar] [CrossRef]
Figure 1. Location of the study area. Panel (a) shows the location of the study area in China; panel (b) shows the four counties (Changtu County, Dawa County, Dengta County and Zhangwu County), which are located in the northern, southern, eastern and western parts of the Lower Liaohe Plain in Liaoning Province. The base map is an elevation map of Liaoning Province. Panel (c) shows the landscape composition of the four counties.
Land 11 01018 g001
Figure 2. (a) Proportion of different types of semi-natural habitat area. (b) Proportion of grid numbers in different ranges of semi-natural habitats. (c) Boxplot of the range of Rao’s quadratic entropy index value. (d) Proportion of grid numbers at different landscape heterogeneity levels.
Land 11 01018 g002
Figure 3. Plot of non-linear regression model for Rao’s quadratic entropy index to proportion of semi-natural habitats.
Land 11 01018 g003
Figure 4. Results of variation partitioning for landscape heterogeneity in terms of the fractions of variation explained. The variation in the landscape heterogeneity is explained by two groups of explanatory variables: CP (composition of semi-natural habitats) and CF (configuration of semi-natural habitats); U is the undetermined variation; a and b are unique effects of composition and configuration, respectively, while c is a fraction indicating their joint effects.
Land 11 01018 g004
Table 1. Landscape metrics used to characterize the landscape configuration.
AbbreviationNameFormulaRange
AIAggregation index A I = g i M a x g i × 1000 ≤ AI ≤ 100
COHESIONPatch cohesion index COHESION = 1 j = 1 n p i j j = 1 n p i j a i j × 1 1 Z 1 × 1000 < COHESION < 100
DIVISIONLandscape division index D I V I S I O N = 1 j = 1 n a i j A 2 0 < DIVISION < 1
ENN_MNMean Euclidean nearest neighbor index E N N M N = m e a n E N N p a t c h i j ENN_MN > 0
LSILandscape shape index L S I = E min E LSI ≥ 1
SHAPE_MNMean shape index S H A P E M N = m e a n S H A P E p a t c h i j SHAPE_MN ≥ 1
SPLITSplitting index S P L I T = A 2 j = 1 n a i j 2 1 ≤ SPLIT ≤ number of cells squared
Note: where g i is the number of like adjacencies based on the single-count method, and M a x g i is the classwise maximum number of like adjacencies of class i . p i j is the perimeter in meters, a i j is the area in square meters and Z is the number of cells. A is the total landscape area in square meters. E N N p a t c h i j is the Euclidean nearest-neighbor distance of each patch. E is the total edge length in cell surfaces and min E is the minimum total edge length of cell surfaces. S H A P E p a t c h i j is the shape index of each patch.
Table 2. The relationship between landscape heterogeneity and semi-natural habitat type combinations based on BIOENV analysis.
RankSemi-Natural Habitat TypesRp
1Woodland, Waters, Ditch0.3478<0.01
2Woodland, Waters, Grassland, Ditch0.3368<0.01
3Woodland, Ditch0.3327<0.01
4Woodland, Ditch, Grassland0.3283<0.01
5Woodland, Waters, Ditch, Rural roads0.3103<0.01
6Woodland, Grassland, Waters, Rural roads, Ditch0.309<0.01
7Woodland, Waters0.2963<0.01
8Woodland, Grassland, Ditch, Rural roads0.2878<0.01
9Woodland, Waters, Grassland0.2872<0.01
10Woodland, Ditch, Rural roads0.2846<0.01
Note: Summary of biota-environment (BIOENV) top 10 matches of semi-natural habitat types with landscape heterogeneity in arable land systems. R, Spearman’s correlation coefficient. P, Spearman’s correlation coefficient (BIOENV routine).
Table 3. The relationship between landscape heterogeneity and semi-natural habitat configuration combinations based on BIOENV analysis.
RankSemi-Natural Habitat ConfigurationRp
1AI + COHESION0.5205<0.01
2AI + COHESION + SPLIT0.5144<0.01
3AI0.5018<0.01
4AI + LSI + COHESION0.4905<0.01
5AI + SPLIT0.4889<0.01
6AI + LSI + COHESION + SPLIT0.4845<0.01
7AI + SHAPEMN + COHESION0.4694<0.01
8AI + LSI0.4671<0.01
9AI + SHAPEMN + COHESION + SPLIT0.4646<0.01
10AI + ENNMN + COHESION0.4627<0.01
Note: Summary of biota-environment (BIOENV) top 10 matches of semi-natural habitat configuration with landscape heterogeneity in arable land systems. AI, aggregation index. COHESION, patch cohesion index. SPLIT, splitting index. LSI, landscape shape index. SHAPE_MN, mean shape index. ENN_MN, mean Euclidean nearest neighbor index. R, Spearman’s correlation coefficient. P, Spearman’s correlation coefficient (BIOENV routine).
Table 4. Test of variance portioning of semi-natural habitat composition and configuration.
NameFp
Semi-natural habitat composition + semi-natural habitat configuration81.40.002
Semi-natural habitat composition1100.002
Semi-natural habitat configuration95.50.002
Publisher’s Note: MDPI stays neutral with regard to jurisdictional claims in published maps and institutional affiliations.