Article

Regional Differences and Convergence of Carbon Emissions Intensity in Cities along the Yellow River Basin in China

1
Shandong Technology Innovation Center of Social Governance Intelligence, Shandong University of Finance and Economics, Jinan 250014, China
2
School of Statistics and Mathematics, Shandong University of Finance and Economics, Jinan 250014, China
3
School of Business Administration, University of Science and Technology, Anshan 114051, China
4
Shandong Key Laboratory of Blockchain Finance, Shandong University of Finance and Economics, Jinan 250014, China
*
Author to whom correspondence should be addressed.
Land 2022, 11(7), 1042; https://doi.org/10.3390/land11071042
Submission received: 15 June 2022 / Revised: 5 July 2022 / Accepted: 5 July 2022 / Published: 8 July 2022

Abstract

:
Since the ecological protection and high-quality development of the Yellow River Basin (YRB) in China have become a primary national strategy, the low-carbon economy is crucial. To formulate effective emission mitigation policies for the YRB, we need to comprehensively understand the characteristics of the spatial agglomeration of the carbon emissions intensity in the YRB and its regional heterogeneity. Therefore, based on the relevant data from 2005 to 2017, we first scientifically measure the carbon emissions intensity of 57 cities along the YRB. Then, we analyze the spatial agglomeration characteristics and long-term transfer trends of carbon emission intensity using exploratory spatial data analysis methods and Markov chains. Finally, the Dagum Gini coefficient and the variation coefficient method are used to study the regional differences and differential evolution convergence of the carbon emissions intensity in the YRB. The results show that the carbon emissions intensity of the YRB has dropped significantly with the spatial distribution characteristics “high in the west and low in the east”, and there is a significant spatial autocorrelation phenomenon. In addition, the probability of a shift in urban carbon intensity is low, leading to a “club convergence” and a “Matthew effect” in general and across regions. Inter-regional differences have always been the primary source of spatial differences in carbon emissions intensity in the YRB, and the intra-regional differences in carbon emissions intensity in the lower YRB show a significant convergence phenomenon. The research results may provide a reference for the regional coordinated development of a low-carbon economy in the YRB, and serve to guide the win-win development model of ecological environment protection and economic growth in the YRB.

1. Introduction

Since the ecological protection and high-quality development of the Yellow River Basin (YRB) in China have become a national strategy, the Chinese Central Party Committee has built “four beams and eight pillars” for the protection and governance of the YRB, improved the ecological environment governance system, and made new progress in high-quality development. However, there are still many ecological problems in the YRB, such as ecological fragility, increasing environmental pollution, lack of freshwater resources, and greenhouse gas emissions. In recent years, the rapid development of industrialization and urbanization in the YRB has accelerated the evolution of the natural geographical pattern of the basin [1]. Due to the high density, large population, and fragile ecological environment of cities along the YRB, urbanization has a particularly significant impact on its ecological environment [2]. Due to the unreasonable development and utilization activities, some areas of ecological degradation still exist in the YRB [3], and both annual soil erosion [4] and water pollution [5] are severe. Additionally, studies have shown that meteorological drought in the YRB has been increasing, and its distribution range is expanding [6,7]. These, coupled with a series of economic and social problems such as a relatively low level of economic development, low-end leading industries, and large regional disparities, have seriously undermined the development of the YRB. Therefore, strengthening the ecological protection and green development of the YRB has become a priority.
The ecological protection and high-quality development of the YRB have become a primary national strategy, which is an essential manifestation of green growth and coordinated action in the new development concept. Prior studies have found that with the gradual warming of the global climate, precipitation events increase [8,9]. Under the background of climate change, sudden floods caused by extreme precipitation seriously threaten the safety of life and property of people along the YRB [10]. At the same time, hot topics such as greenhouse gas pollution, carbon peaking, carbon neutrality, and the increasingly severe ecological problems of the river basin highlight the necessity of low-carbon development. In 2018, the total coal consumption in the YRB reached 20.57 billion tons, accounting for 45.69% of the total national coal consumption. This indicated the YRB was under enormous pressure to reduce emissions. To address climate change, China committed to peak carbon dioxide emissions before 2030 and achieve carbon neutrality before 2060 at the 75th session of the United Nations General Assembly in September 2020. The YRB is an essential ecological barrier, an industrial belt for energy development, and a base for grain production in China [11]. Thus it is of great practical significance for improving the overall layout of China’s ecological civilization construction and promoting high-quality economic development. Meanwhile, the collaborative green and low-carbon development of the YRB is a crucial factor in achieving ecological protection and high-quality development. Hence, it is particularly urgent to explore the spatial and temporal evolution law of carbon emissions intensity in the YRB, analyze the spatial distribution pattern of its carbon emissions intensity from multiple scales, and clarify the sources of regional differences and the convergence of their evolution. As the carrier of economic development and ecological management and protection, cities are the core driving force for the green and coordinated development of the YRB [12]. Therefore, we scientifically measure the level of carbon emissions intensity in the YRB based on the perspective of cities, and comprehensively analyze the spatial distribution pattern, transfer trends, regional differences, and convergence characteristics of carbon emission intensity in the YRB. This is of great theoretical and practical significance for the concerted regional promotion of high-standard ecological protection and high-quality transformation development in the YRB in China.
As found in the literature survey, a great many studies are exploring the path to achieving low-carbon development, and the measurement scale includes enterprises [13], industries [14], cities [15], and even regions [16]. Additionally, some existing studies have focused on the influencing factors of carbon emissions [17,18,19,20], and the assessment of carbon emission policy effects. The main research components among these policy effects include the policy effectiveness of carbon trading [21], the impacts of the carbon tax on carbon emissions [22,23], and the response to the low-carbon city pilot policy on urban land use efficiency [24]. Since the ecological protection and high-quality development of the YRB have become a national strategy, many other scholars have narrowed the research scope to the YRB. Research on carbon emissions in the YRB mainly focuses on the following three areas. First of these is the measurement of carbon emission efficiency. This type of research incorporates carbon dioxide emissions as undesirable output into the evaluation index system. The research areas include carbon emission efficiency for the cities [25], provinces [26], and the whole basin [27] in the YRB, green total factor productivity in the YRB [28], urban energy use efficiency in the YRB [29], water use efficiency in the YRB [30], agricultural ecological efficiency in the YRB [31], and carbon emission performance in logistics in the YRB [32], etc. The data envelopment analysis (DEA) method is mainly utilized in the above research for efficiency calculation. Second, the studies focus on analyzing the evolution of spatial and temporal patterns of carbon emissions. For example, Mo et al. [33] found that carbon emissions in the YRB have formed a pattern of high carbon emissions in the east and low carbon emissions in the west since 2000, and there was a “club convergence” phenomenon. Lv et al. [34] found that the carbon emissions in the YRB showed a significant contiguous expansion trend, with a significant positive spatial correlation. Gong et al. [35] found apparent spatial spillover effects and spatial agglomeration characteristics of provincial carbon emissions in the YRB. Thirdly, the researches focus on the influencing factors of carbon emissions. It is generally analyzed from the aspects of economic level, urbanization, industrial structure, population size, technological innovation, and spatial correlation. For example, Sun et al. [36] used the extended STIRPAT model to assess the impact of various factors on Carbon Dioxide (CO2) emissions in the YRB and diverse city levels. Gao et al. [37] found that regional economic growth, energy structure, industrial structure, and technological level were important factors influencing carbon emissions in the YRB. Du et al. [38] considered that economic scale growth and urbanization construction were still the main reasons for the growth of carbon emissions in the YRB. Li [39] believed that urban carbon dioxide emissions in the YRB were affected not only by factors such as population size, urbanization level, and industrialization level, but also by significant spatial correlation.
Academic studies on carbon emissions in the YRB have formed a relatively complete system, but there is still room for expansion. First, most of the existing studies on urban carbon emissions in the YRB are based on Defense Meteorological Satellite Program Visible Infrared Imaging Operational Linear Scanning Operational System (DMSP-OLS) and National Polar-orbiting Partnership Satellite Visible Infrared Imaging Radiometer Suite (NPP-VIIRS) nighttime light data, and most of the data are split at the cut-off point of 2013. Due to the apparent differences between the two sets of satellite data, although some scholars have fused and corrected the above two sets of nighttime light data, the fitting accuracy is still not ideal. Second, most existing studies only select a single spatial matrix when analyzing the spatial correlation of carbon emissions in the YRB, which has limitations in understanding the spatial agglomeration characteristics of carbon emissions in the YRB. Third, most existing studies have examined the temporal characteristics of carbon emission intensity in the YRB only in the form of line charts, and failed to dig into its long-term transfer trends. Finally, although many scholars have found significant spatial differences in carbon emissions in the YRB, few scholars have further investigated the sources of discrepancies, the internal formation mechanism, and convergence evolution characteristics of the differences. Our study will fill the gap in the carbon emissions in the YRB.
In this paper, we will study the spatial correlation, long-term transfer trends, regional differences, and convergence of carbon emissions intensity in the YRB based on the city perspective. Firstly, based on the carbon emission data of China Emission Accounts and Datasets (CEADs) [40], we calculate the carbon emission intensity of cities along the YRB, and comprehensively evaluate the carbon emission intensity of the YRB at two levels: the whole basin and the three regions of the upper, middle, and lower reaches. Secondly, by making the adjacent weight matrix and spatial geographic weight matrix, the spatial agglomeration characteristics of carbon emission intensity in the YRB are explored using the exploratory spatial data analysis method. Thirdly, we use Markov chains to analyze the long-term transfer trend. Fourthly, the Dagum Gini coefficient and its decomposition method are applied to investigate the sources of spatial differences in carbon emission intensity in the YRB and their contributions. Finally, using the variation coefficient method, a comparative analysis of the convergence of carbon emission intensity in the YRB and the upper, middle, and lower reaches is conducted, and relevant policy suggestions are given.

2. Materials and Methods
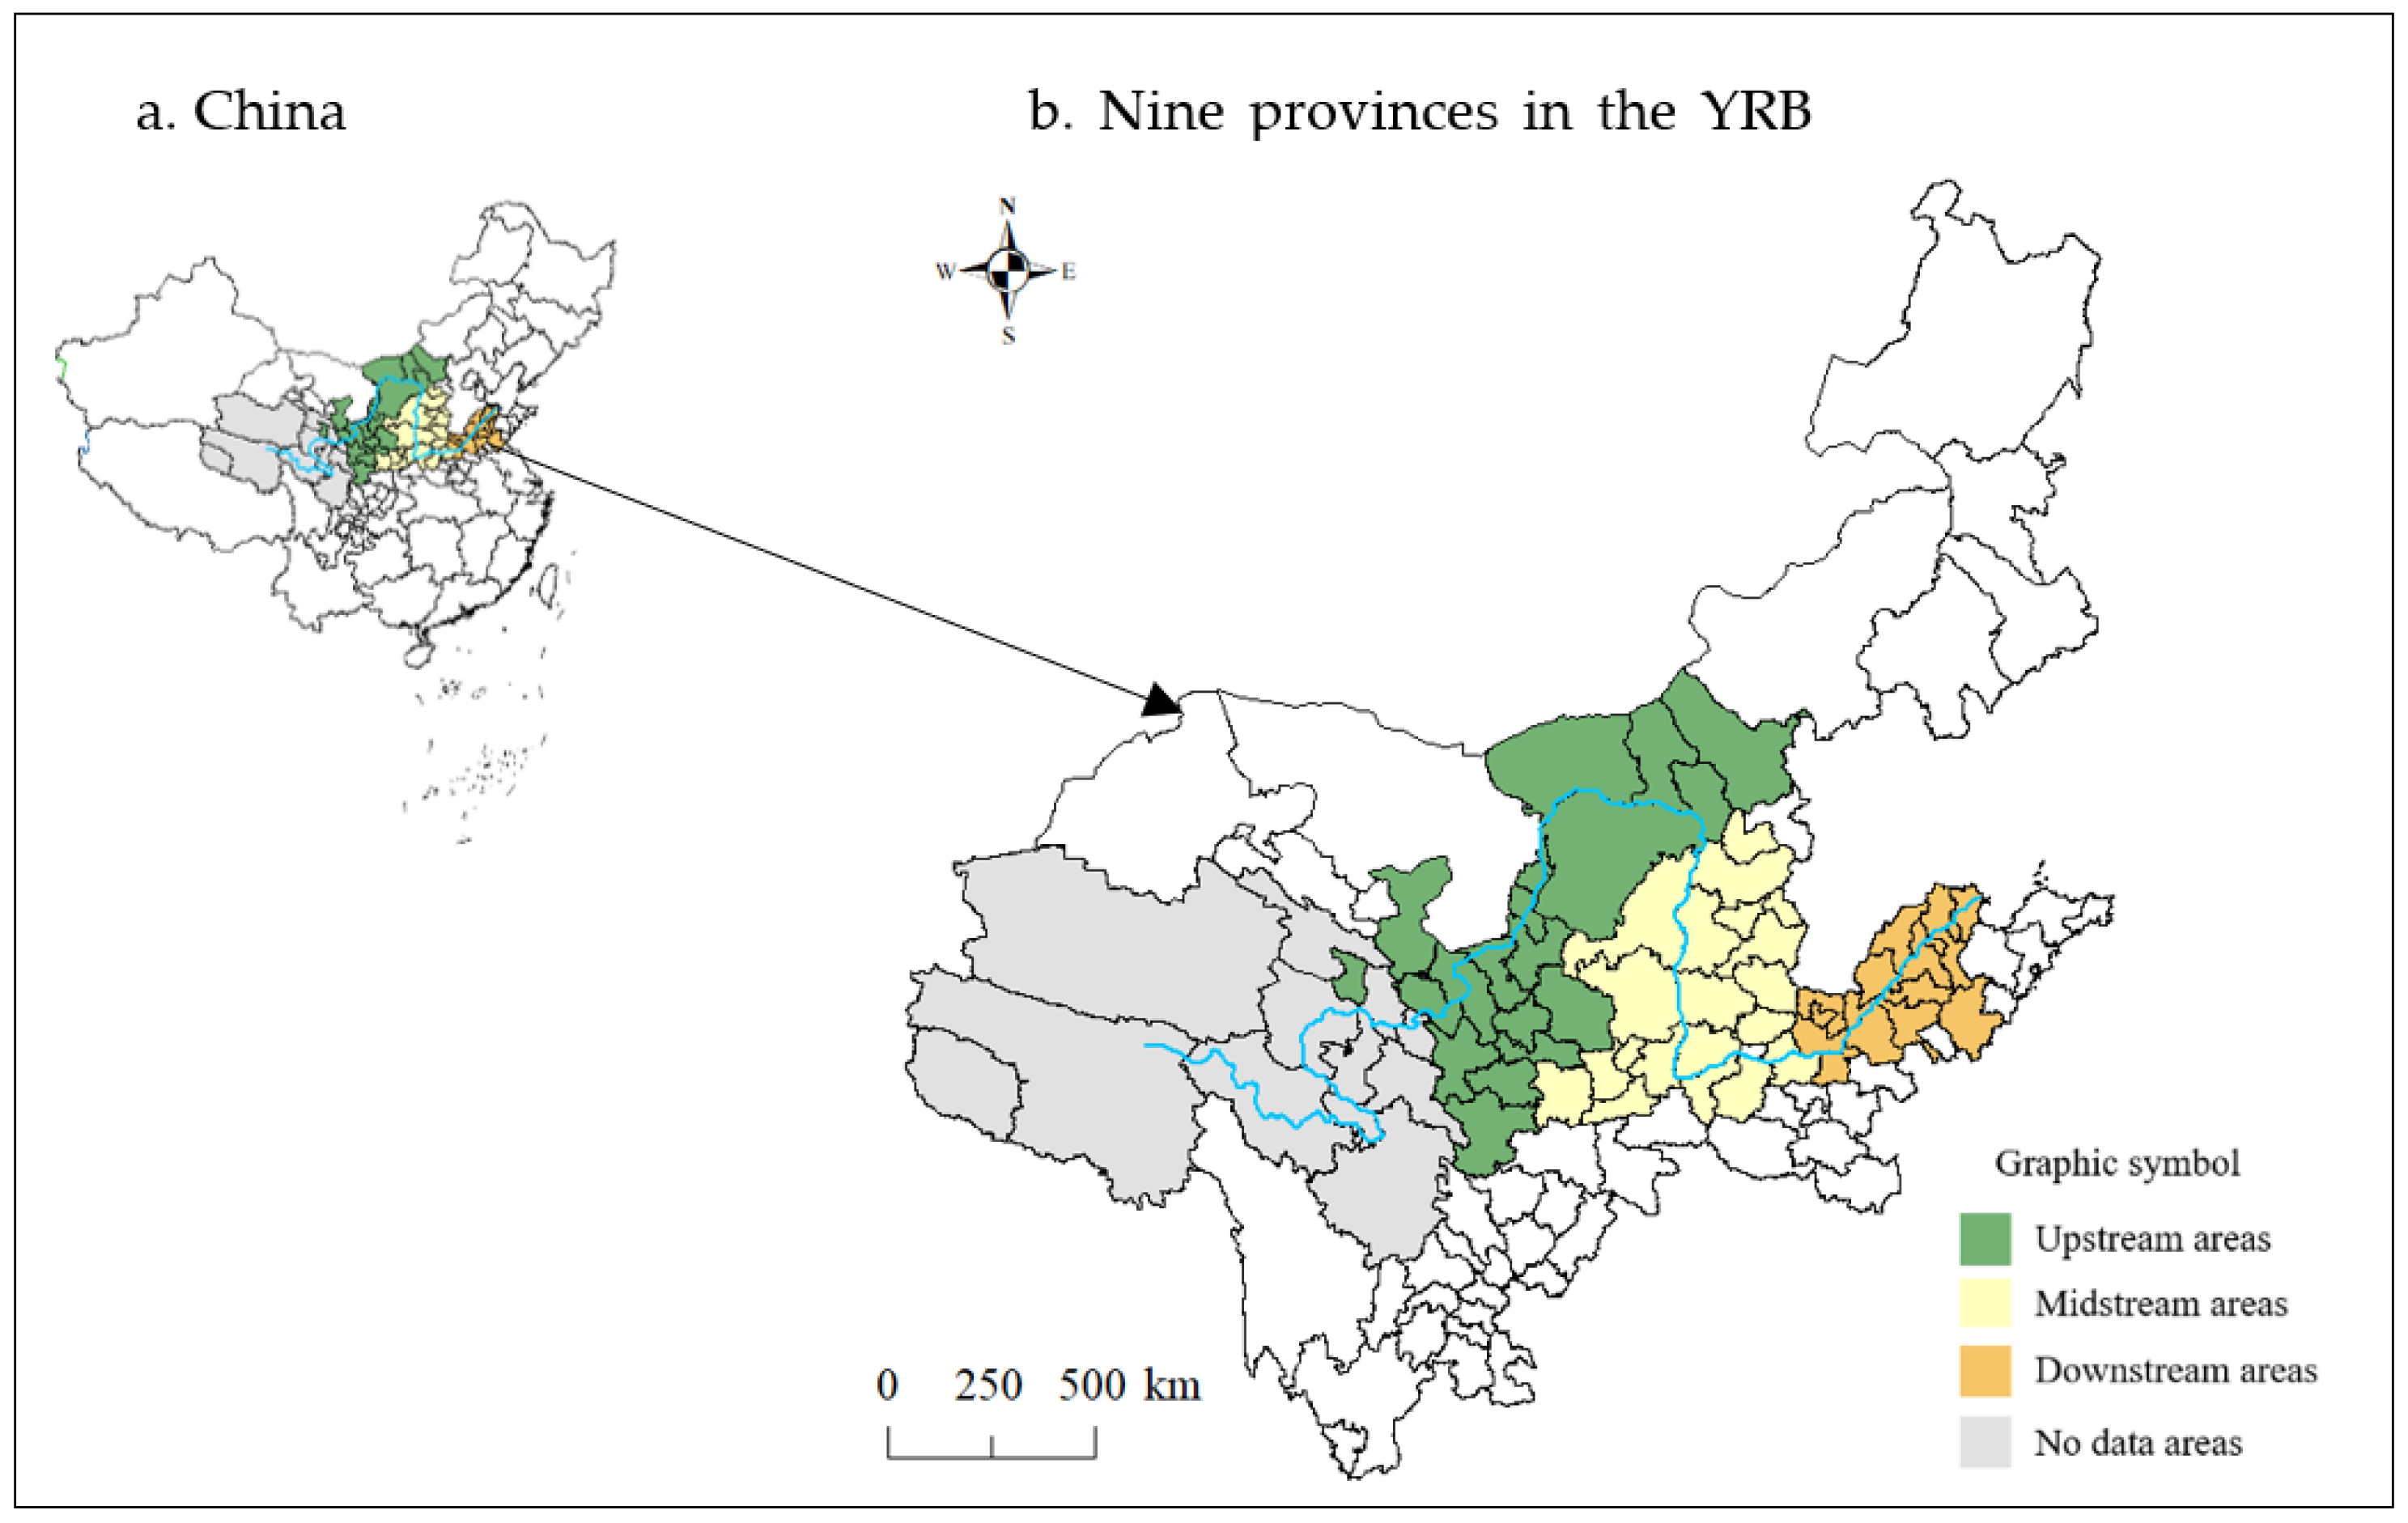
First, the distribution of 57 prefecture-level cities in the study area is described. Next, according to the definition of carbon emission intensity: carbon dioxide emissions per unit Gross Domestic Product (GDP), we build carbon emission intensity calculation formula. Furthermore, in order to explore the spatial correlation and long-term transfer trend of carbon emission intensity in cities along the YRB, the exploratory spatial data analysis method and Markov chain are used for analysis. Finally, the Dagum Gini coefficient and variation coefficient method are used to explore the regional differences and convergence of carbon emission intensity in the YRB.

2.1. Research Area

The YRB flows through 66 prefecture-level cities from nine provinces in China: Qinghai, Sichuan, Gansu, Ningxia, Inner Mongolia, Shanxi, Shaanxi, Henan, and Shandong [41] (Figure 1). Due to the incomplete data for 10 cities (prefectures) such as Sichuan Aba Tibetan and Qiang Autonomous Prefecture, and Gansu Linxia Hui Autonomous Prefecture, our study does not include these 10 cities. Besides, in order to maintain the consistency of statistical caliber, we still regard Laiwu City, which is now a district of Jinan, as a separate city. Therefore, 57 prefecture-level cities in the YRB are selected as the research objects. Referring to existing research [42], we divide the sample of 57 cities into three regions: upper, middle, and lower reaches (Table 1).

2.2. Carbon Emission Intensity Measurement and Data Sources

CEADs use the Particle Swarm Optimization-Back Propagation (PSO-BP) algorithm to unify the satellite image scale of the above two sets of DMSP-OLS and NPP-VIIRS nighttime light data, which significantly improves the fitting accuracy of the two sets of nighttime light data. Therefore, based on the CEADs carbon emissions data, here we measure the carbon emission intensity of prefecture-level cities in the YRB, as follows:
C E I i t = C O 2 i t / G D P i t
where C E I i t represents the carbon emissions intensity, C O 2 i t is carbon emissions, G D P i t is the real GDP with 2005 as the base period, i = 1 , 2 , , 57 and t = 2005 , 2006 , , 2017 are the cross-section and time indicators, respectively. The original data on GDP is from the China City Statistical Yearbook [43] and statistical bulletins of some cities.

2.3. Exploratory Spatial Data Analysis

In this paper, we use the global spatial autocorrelation coefficient ( M o r a n s   I ) [44] and the local Moran’s scatter plots to analyze the spatial agglomeration characteristics of carbon emission intensity in the YRB. We use the global spatial autocorrelation coefficient to reflect the degree of spatial correlation of carbon emission intensity in the YRB as a whole, and the calculation formula is as follows:
M o r a n s   I = n i = 1 n j i n w i j ( y i y ¯ ) ( y j y ¯ ) i = 1 n ( y i y ¯ ) 2 i = 1 n j i n w i j
where n is the number of cities, w i j ( i , j = 1 , 2 , , 57 ) is the spatial weight matrix between city i and city j . The adjacent weight matrix and the spatial geographic weight matrix are used in this paper. The adjacent weight matrix refers to when city i and city j are adjacent ( i j ), w i j takes the value of 1; otherwise, it is 0. The spatial geographic weight matrix formula w i j = 1 / d i j , where d i j is the geographical distance between city i and city j . The carbon emission intensity of city i is y i . The average value of carbon emission intensity of each city is y ¯ .The values of M o r a n s   I range between −1 and 1. If the value of M o r a n s   I is positive, it indicates that the observed carbon emission intensity has a positive correlation in spatial distribution. If the value of M o r a n s   I is negative, it suggests that the observed carbon emission intensity has a negative correlation in spatial distribution. If the value of M o r a n s   I is 0, it indicates that the observed carbon emission intensity has a random spatial distribution.
After calculating the global spatial autocorrelation coefficient, we use Moran’s scatter plots to further analyze the degree of local spatial correlation between each city and its adjacent cities. The cities in the first (third) quadrant of Moran’s scatter plots are defined as the high-high (low-low) agglomeration type of carbon emission intensity. While the cities in the second (fourth) quadrant of Moran’s scatter plots are defined as the low-high (high-low) agglomeration type of carbon emission intensity.

2.4. Markov Chain Analysis Method

Markov chain is a Markov process with discrete time and state. The Markov transfer probability matrix is constructed to reflect the long-term transfer trend of carbon emission intensity of cities in the YRB. Markov transition probability matrix is a stochastic process. The transition behavior after the current period is independent of the historical state before the current period; that is, the state probability of a random variable in t + 1 only depends on the state of the t period. The specific calculation formula refers to Shen et al. [45].

2.5. Analysis of Regional Differences

In this paper, we use the Dagum Gini coefficient and its decomposition method [46] to measure the spatial difference in carbon emission intensity in the YRB. The overall Gini coefficient can be decomposed into intra-regional variation contribution, inter-regional variation contribution, and super-variable density contribution. The specific calculation formula refers to Chen et al. [47].

2.6. Spatio-Temporal Convergence Analysis

In this paper, the variation coefficient method is used to test the σ convergence of carbon emission intensity observations in the YRB. The σ convergence can be understood as the discrete degree of carbon emission intensity observations in the upper, middle, and lower reaches of the YRB decreases continuously over time [48]. The calculation formula is:
σ t j = i N j ( Q t i j - Q i j ¯ ) 2 / N j Q i j ¯
where σ t j is the convergence of region j in year t , ( t = 2005 , 2006 , , 2017 , j = 1 , 2 , 3 ) represents the upper, middle and lower reaches of the YRB, respectively; Q t i j represents the carbon emission intensity of city i in region j in year t , Q t i j is the average value of carbon emission intensity of city i in region j , i = 1 , 2 , , 57 represents the cities included in the YRB; N j represents the number of cities in the j region.

3. Results

First, we analyze and evaluate the carbon emission intensity of the YRB from the two aspects of the whole basin and the three major regions. Then, the spatial agglomeration characteristics of carbon emission intensity in the YRB are analyzed from global and local perspectives. Next, the Markov chain is used to examine the long-term transfer trend of carbon emission intensity. Further, in order to further explore the regional differences in carbon emission intensity in the YRB, the overall differences, intra-regional differences, inter-regional differences, and contribution rates are analyzed. Finally, the convergence characteristics of carbon emission intensity are described from the overall and three regional levels of the YRB, respectively.

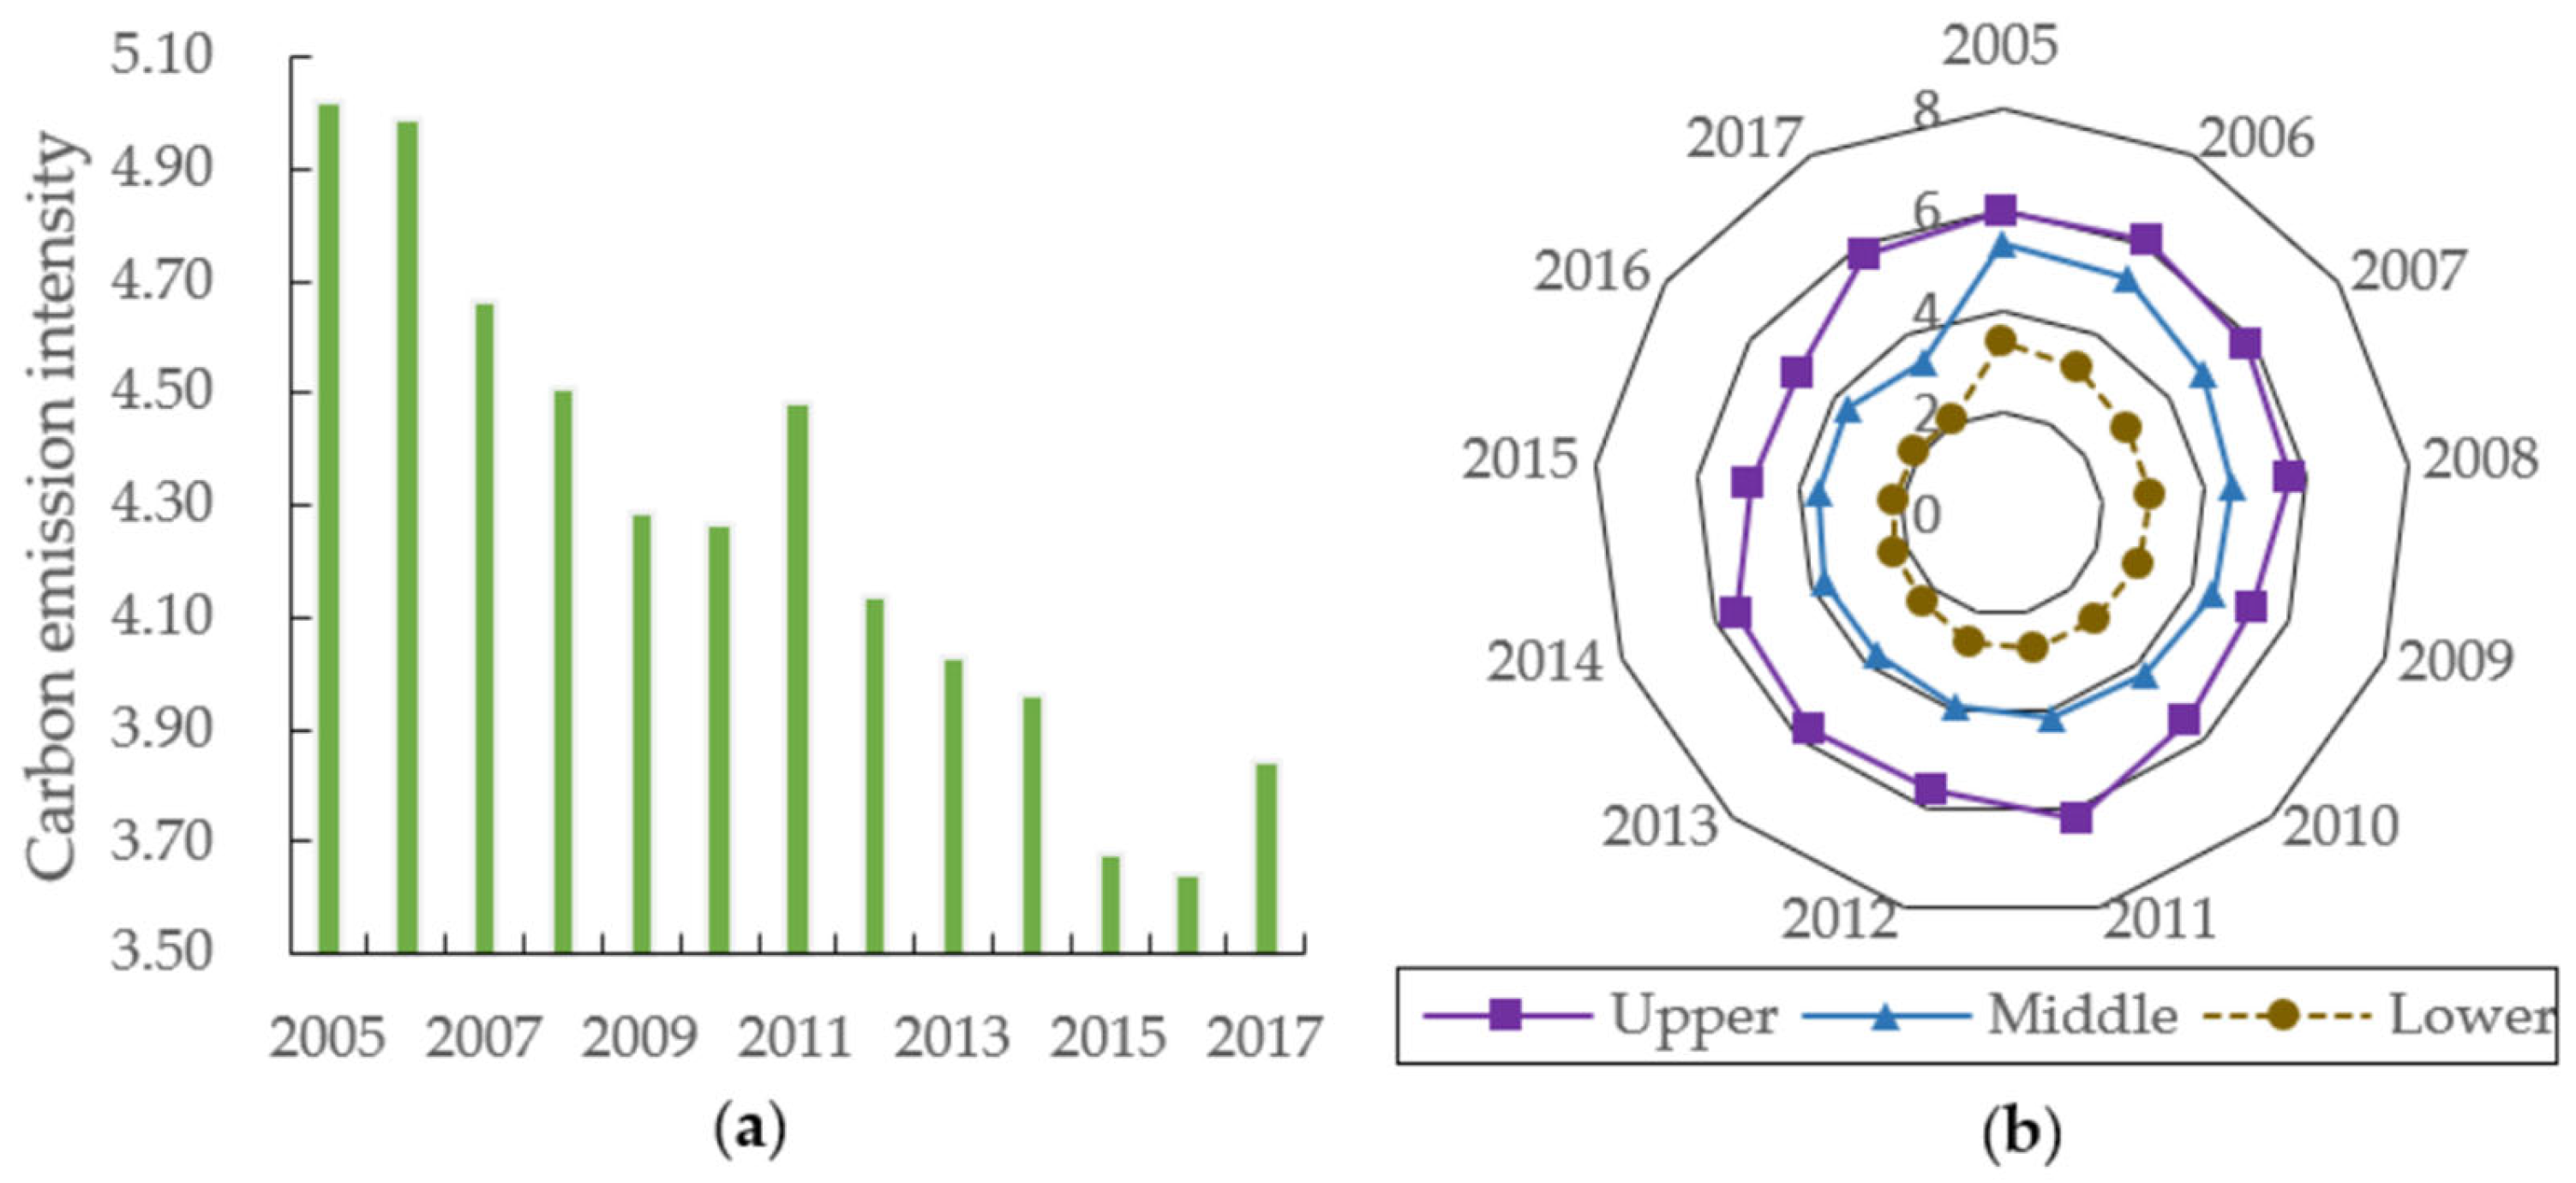
3.1. Measurement and Evaluation of Carbon Emission Intensity in the YRB

In this subsection, we use the Formula (1) to measure the carbon emission intensity of cities in the YRB from 2005 to 2017. We then comprehensively analyze the development of carbon emission intensity in the YRB at two levels: the whole basin and the three major regions in the upper, middle, and lower reaches. The results are shown in Figure 2.
At the global level of the YRB, as shown in Figure 2a, the carbon emission intensity of the YRB has been slowly decreasing in a fluctuating trend, with an average annual decrease rate of 2.54%. This indicates that with the ongoing promotion of the construction of ecological civilization and high-quality economic development, the carbon emission intensity has been effectively controlled. From the perspective of evolution, the carbon emissions intensity dropped significantly from 2005 to 2010. During this period, the “Eleventh Five-Year Plan in China” put forward the need to accelerate the transformation of the economic growth model and make resource conservation a basic national policy, with economic growth focusing more on quality and efficiency. From 2010 to 2011, the carbon emission intensity rose to 4.48 tons per 10,000 yuan. The possible reason for this is in response to the 2008 financial crisis. Cities in the YRB invested a lot of money into infrastructure construction to stimulate the economy and pursue short-term benefits, resulting in massive consumption of energy and resources. After 2011, the carbon emission intensity showed a downward trend. The “Twelfth Five-Year Plan in China” made carbon emission intensity a binding indicator, and emphasized the concept of green and low-carbon development. In 2016, the carbon emission intensity decreased to the minimum value of 3.64 tons per 10,000 yuan during the sample period. In this period, energy conservation and emission reduction achieved remarkable results.
At the level of the three regions, the carbon emission intensity of the YRB shows a spatial distribution pattern of “high in the west and low in the east”. As shown in Figure 2b, the carbon emission intensity in the upper reaches fluctuated between 4.86 and 6.21 during the observation period, and its carbon emission intensity was significantly higher than that in the middle and lower reaches. The carbon emission intensity in the middle reaches showed a slowly decreasing trend, with an average annual decline rate of 3.12%. However, the value of the middle reaches is generally higher than that in the lower reaches. In the lower reaches, the carbon emission intensity decreased slowly, with an average annual decreasing rate of 3.15%, which is basically consistent with that in the middle reaches. The imbalance of carbon emission intensity among the upper, middle, and lower reaches has gradually come to the fore. The average annual carbon dioxide emissions in the upper reaches of the YRB are significantly lower than those in the middle and lower reaches. However, due to the extensive development mode and unreasonable industrial structure, the social and natural resource inputs have not been fully transformed into economic benefits. This further results in carbon emission intensity higher than that in the middle and lower reaches of the YRB. The middle reaches of the YRB are rich in coal and other resources. However, the utilization efficiency of resources and energy is low, which has led to high emissions of carbon dioxide, sulfur dioxide, and other pollutants in economic development. With the implementation of the “Rise of Central China” strategy, efforts have been made in the middle reaches of the YRB. These dedicate to developing clean energy, reducing the proportion of coal and other energy consumption, increasing the proportion of emerging industries such as the modern service industry and tourism, and upgrading the industrial structure, which effectively controls carbon emission intensity. The lower reaches of the YRB are strategically located, more open to the outside world, and technologically advanced. Because of these advantages, the carbon emission intensity in the lower reaches is lower than in the middle and upper reaches.

3.2. Spatial Distribution Characteristics of Carbon Emission Intensity in the YRB

3.2.1. Analysis of the Global Agglomeration Characteristics of Carbon Emission Intensity in the YRB

Spatial agglomeration characteristics are essential for analyzing the spatial pattern of carbon emission intensity in the YRB. Based on Stata 16 software, the global M o r a n s   I coefficient of carbon emission intensity in the YRB from 2005 to 2017 was calculated using the Formula (2), in Table 2.
As shown in Table 2, from the overall perspective of the YRB, the global M o r a n s   I coefficients were all positive based on the adjacency weight matrix and spatial geographic weight matrix. The p values all passed the 1% significance level test. This indicates that the spatial distribution of carbon emission intensity in cities along the YRB was not random, and there was spatial autocorrelation. The cities with similar carbon emission intensity are clustered in space. That is, cities with high carbon emission intensity are neighboring each other, and cities with low carbon emission intensity are adjacent. From the perspective of evolution trend, the global M o r a n s   I coefficients based on adjacent weight matrix and spatial geographic weight matrix followed a basically consistent trend. To be specific, the coefficients evolved in a “W” shape. This indicates that the level of carbon emission intensity clustering in cities along the YRB has roughly undergone a process of “decline-rise-decline-rise”. The global M o r a n s   I coefficients based on the adjacency and spatial geographic weight matrix showed an overall fluctuating upward trend with an average annual increase rate of 1.77% and 4.87%, respectively. This indicates that the agglomeration level of cities with similar carbon emission intensity has improved.

3.2.2. Analysis of the Local Agglomeration Characteristics of Carbon Emission Intensity in the YRB

In this subsection, we take 2017 as an example to further reveal the local agglomeration characteristics of carbon emission intensity in the YRB. We use the Moran scatter plots to analyze the local spatial correlation of carbon emission intensity in the YRB based on the adjacent weight matrix and spatial geographic weight matrix, respectively, as shown in Figure 3.
In Figure 3, the horizontal axis of Moran scatter plots is the carbon emission intensity after normalization, and the vertical axis is the spatial lag value of carbon emission intensity. Since the global M o r a n s   I coefficients of carbon emission intensity in the YRB are significantly positive, the first and third quadrants representing positive correlation are typical observation areas. In contrast, the second and fourth quadrants representing negative correlation are atypical observation areas [49]. As shown in Figure 3, the majority of cities are distributed in the first and third quadrants, and the carbon emission intensity generally shows a significant High-High (HH) and Low-Low (LL) type of spatial agglomeration. This further indicates the stability of the positive spatial correlation of carbon emission intensity in the YRB. Among the cities belonging to the typical observation area, the LL agglomeration type is mainly distributed in the midstream region Henan and the downstream region Shandong. For such cities, not only is their carbon emission intensity low, but so is that of the surrounding areas. The HH agglomeration type is mainly distributed in the upper reaches such as Gansu, Qinghai, Ningxia, and the resource-rich regions at the junction of Shanxi and Inner Mongolia. This indicates the carbon emission intensity of these cities and their surrounding areas are both high. A few cities are distributed in the second and fourth quadrants, with more Low-High (LH) agglomerations than High-Low (HL) agglomerations.

3.3. Long-Term Transfer Trends of Carbon Emission Intensity in the YRB

In this subsection, we use Markov chains to explore further the long-term transfer trends of carbon emission intensity in the YRB. Firstly, the carbon emission intensity levels of the prefecture-level cities in the YRB are averaged into four levels, namely, low level, medium-low level, medium-high level, and high level. Then, we calculate the transfer probability matrix of carbon emission intensity in the YRB across a period of one year, as shown in Table 3.
The elements on the diagonal of the 4 × 4 matrix for each region represent the probability of no type of transfer in carbon intensity. This portrays the stability of the urban carbon intensity in the area. The elements on the non-diagonal line represent the probability of a transfer in the type of carbon intensity (i.e., “upward transfer” or “downward transfer”) for each region [50]. It can be seen from Table 3 that the probability values on the diagonal lines of each area are significantly higher than those on the non-diagonal lines. This indicates that the probability of carbon emission intensity of each region in the YRB is relatively stable at each type, and there is a “conditional convergence phenomenon”. In addition, the maximum probability on the diagonal is 94.44%, and the minimum possibility is 65.00%. Specifically, cities in the downstream areas at low and medium-low levels are more likely to remain stable. Except for the downstream areas, cities at low and high levels in other regions have a higher probability of remaining stable, indicating the existence of the “Matthew effect” in which the strongest is getting stronger, and the weakest is getting weaker.
Whether the YRB as a whole or each region, there are overstepping transfer phenomena, but the transfer probability is small. For the entire YRB, the probability of crossing from low to medium-high levels is 0.6%. Looking specifically at the regions, the probability of crossing from low to medium-high levels in the upstream region is 1.67%. The probability of crossing from high to medium-low levels in the midstream region is 1.39%. The probability of crossing from high to low levels in the downstream region is 2.08%. This indicates that cities with higher carbon emission intensity in the middle and downstream areas have the potential to reduce their own emissions across. Still, cities with lower levels of carbon intensity in the upstream regions have the potential to increase their carbon emission intensity at the same time.

3.4. Magnitude of Spatial Differences in Carbon Emission Intensity in the YRB and Its Sources

Here, we use the Dagum Gini coefficient and its decomposition method to measure the spatial differences in carbon emission intensity and its sources in the YRB, shown in Table 4. All abbreviations appearing in this paper are shown in Table 5.

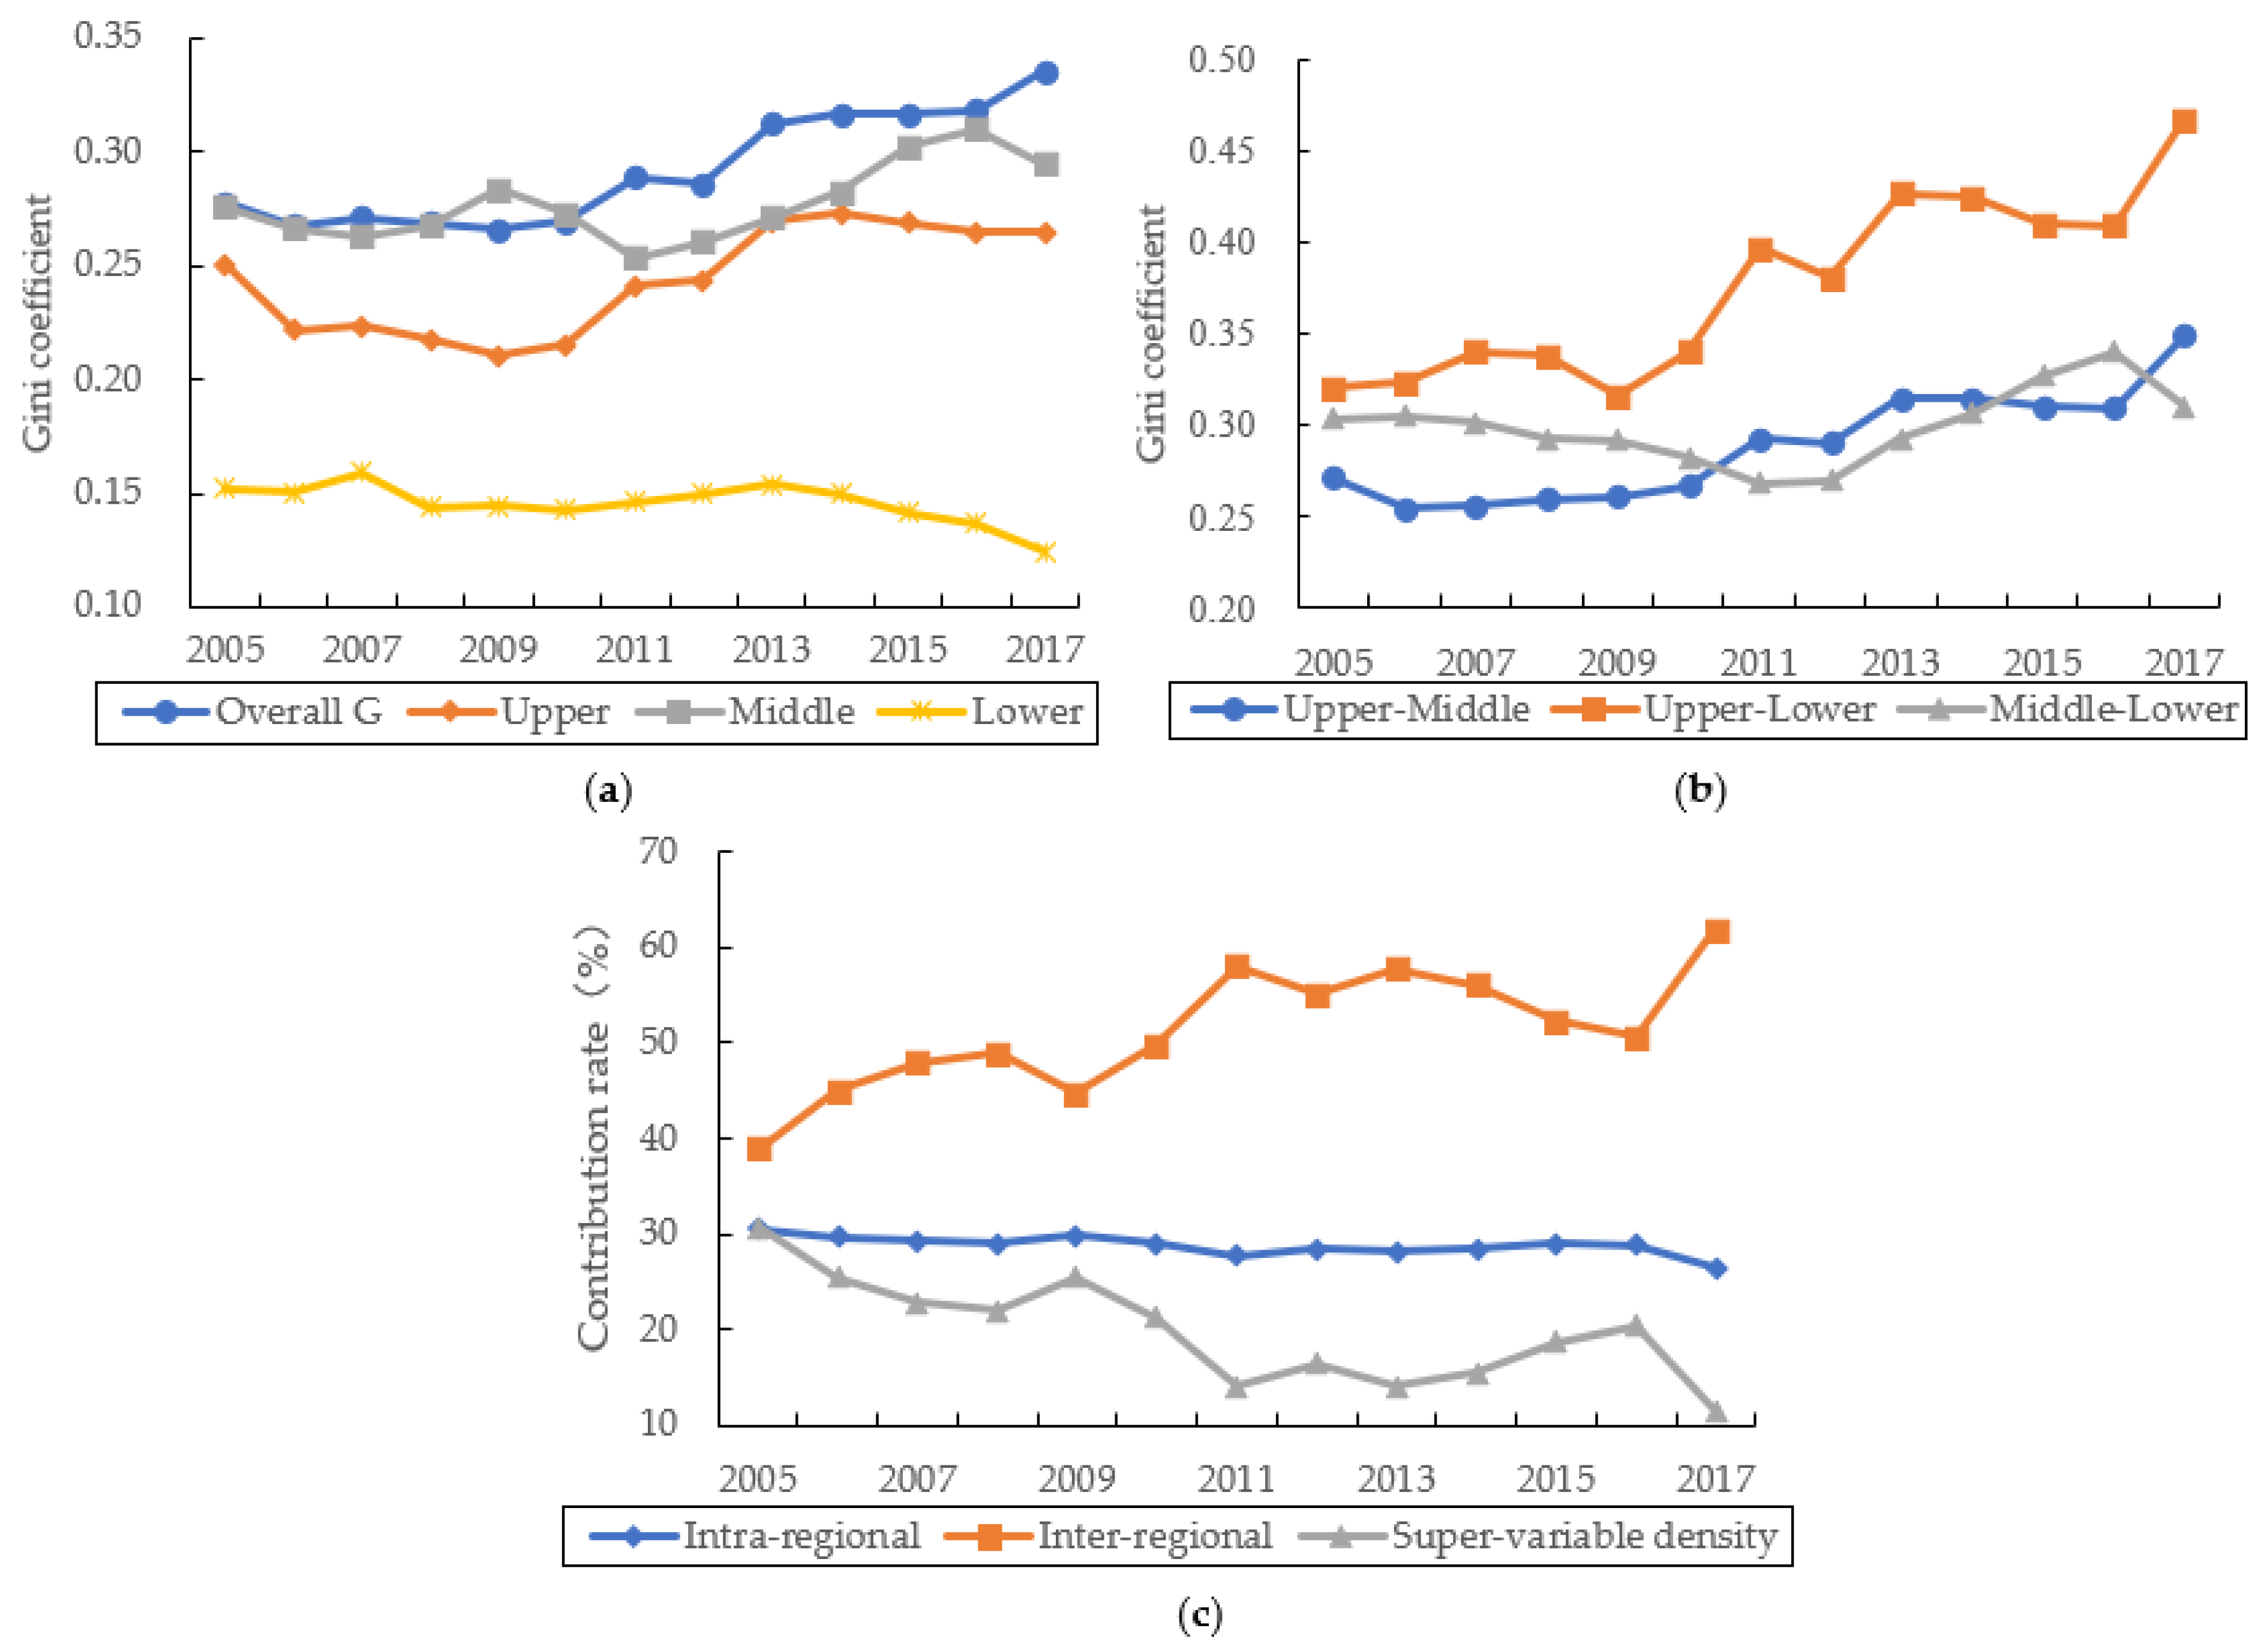
3.4.1. Overall and Intra-Regional Differences in Carbon Emission Intensity in the YRB

In Figure 4a, we present the evolution of the overall differences and intra-regional differences in carbon emission intensity in the YRB. The mean value of the overall Gini coefficient of carbon emission intensity in the YRB is 0.2919, indicating there is significant spatial inequality in carbon emission intensity. The spatial difference of carbon emission intensity in the YRB showed a fluctuating increase in the overall Gini coefficient from 0.2775 to 0.3355, with an average annual increase rate of 1.74%. This indicates that the regional difference in carbon emission intensity in the YRB is becoming larger and larger. In terms of dynamic evolution, the trend of the overall Gini coefficient of carbon emission intensity is mainly shown as follows: from 2005 to 2009, the overall Gini coefficient showed a fluctuating downward trend, reaching the bottom in the whole sample period at 0.2660 in 2009; from 2009 to 2013, it showed a fluctuating upward trend, rising to 0.3126 in 2013; the overall Gini coefficient tended to be stable from 2013 to 2016, and rose sharply to 0.3355 in 2017, which is the maximum value in the sample period.
From the comparison of the upper, middle, and lower reaches, the differences in carbon emission intensity in the YRB were clearly graded. The spatial non-equilibrium in carbon emission intensity within the middle reaches was always the largest, with the average value of its intra-regional Gini coefficient of 0.2772. The differences in carbon emission intensity within the upper and lower reaches decreased in order, with the average values of their intra-regional Gini coefficients being 0.2435 and 0.1457, respectively. From the evolution process, the Gini coefficient in the upper and middle reaches showed a gradual upward trend, with an average annual growth rate of 0.47% and 0.57%, respectively. According to the data, the years from 2005 to 2009 saw a drop in the number of intra-regional differences of upper reaches from 0.2510 to 0.2105, which was followed by a slow increase in general over the following eight years. The Gini coefficient in the middle reaches showed a certain “W”-shaped evolution trend. The Gini coefficient in the lower reaches showed a fluctuating downward trend, with an average annual decreasing rate of 1.52%. This indicates that the spatial differences in carbon emission intensity in the middle and upper reaches are increasing, while that in the lower reaches is gradually shifting from spatial differences to a synergistic regional pattern. The reason may be that although the regulation and control of the overall carbon emission intensity in the YRB have achieved remarkable results, there are still some differences in geographical location, industrial structure, and technological basis among different regions. Moreover, cities in the lower reaches have excellent transportation infrastructure, close cooperation between neighboring regions, and significant technology spillover effects, so the intra-regional difference in the lower reaches is relatively tiny.

3.4.2. Inter-Regional Differences in Carbon Emission Intensity in the YRB

Figure 4b depicts the evolution trend of inter-regional differences in carbon emission intensity in the YRB. It can be seen that the “upper-middle” inter-regional difference shows an overall fluctuating upward trend with an average annual growth rate of 2.39%. From 2005 to 2006, there was a slight decline from 0.2709 to 0.2544, and 2006 saw the bottom during the sample period. In the following five years, there was a gradual increase from 0.2562 to 0.2932. From 2012 to 2017, it showed a “W”-shape trend. The specific performance was as follows: in 2012, it decreased slightly to 0.2905, followed by a sharp increase to 0.3154 in 2013. Then it yearly reduced to 0.3099 in the following three years, at last peaking at 0.3487 in 2017. The inter-regional differences between the upper and lower reaches generally showed a two-stage trend of “weak decline-fluctuation rise”. Specifically, from 2005 to 2009, the inter-regional differences decreased slightly and reached the lowest point at 0.3161 during the sample period. Moreover, from 2009 to 2017, the inter-regional differences showed a fluctuating upward trend, similar to the movement of inter-regional differences between upper and middle reaches. During the observation period, its Gini coefficient increased from 0.3207 in 2005 to 0.4672 in 2017, with an increase of about 45.68% and an annual increase rate of 3.81%. The inter-regional differences between the middle and lower reaches were generally in an “M”-shaped evolution trend, roughly divided into four stages, that is, “slight upward movement—year by year decline—year by year rise—sharp decline”. Its Gini coefficient value generally increased during the observation period, from 0.3039 in 2005 to 0.3105 in 2017, growing about 2.17%, with an average annual increase rate of 0.18%.
In terms of numerical magnitude, the “upper-lower” inter-regional difference is much higher than those in the “upper-middle” and “middle-lower”. The “middle-lower” inter-regional difference is slightly higher than the “upper-middle”, which is relatively close. The possible reasons for this state are: the lower reaches not only have a superior geographical location, but also some other favorable conditions in their development process. These include a high level of economic development, increased investment in scientific research, superior talent introduction system, sound development of high-tech enterprises, and great efforts in the construction of ecological civilization. These provide an excellent development environment for the low-carbon economy in the lower reaches. Therefore, comprehensive support for regulating regional carbon emission intensity is also provided. Although the inland middle and upper reaches have the advantage of resource endowment, they have weaker infrastructures than the lower reaches. These result in failure to fully exploit and utilize sources of clean energy such as water resources. This leads to relatively high carbon emission intensity.

3.4.3. Contribution of Spatial Difference of Carbon Emission Intensity in the YRB

In Figure 4c, we present the contribution rate of spatial differences in carbon emission intensity in the YRB. From the evolution process, the contribution rate of intra-regional difference generally shows a steady downward trend. Although there was an inevitable upward trend in 2009, 2012, and 2014, it did not have a significant impact on the overall downward trend. Its contribution rate dropped from 30.57% in 2005 to 26.56% in 2017, with a decrease of about 13.12% and an average annual decline rate of 1.09% during the observation period. The contribution rate of inter-regional difference shows a fluctuating upward trend. Specifically, its contribution rate was 38.81% in 2005, then experienced a fluctuation process of “slow rise—slight decline—rebound—slight decline—slight rise—steady decline—rapid increase”. In 2017, its contribution rate was 61.81%, reaching the maximum value in the observation period, increasing about 59.26%, with an average annual growth rate of 4.94%. The super-variable density reflects the fact that the spatial differences are partly due to the overlap between different regions. During the observation period, the trend of its contribution rate was opposite to the contribution rate of inter-regional differences. In 2005, its contribution rate was 30.61%, and decreased by about 18.99% in 2017 compared with 2005.
Regarding the magnitude of the contribution rate, the average contribution rate of inter-regional differences was as high as 51.31%, and the average contribution rate of intra-regional differences was 28.81%, which is slightly higher than the average contribution rate of the super-variable density of 19.88%. The inter-regional difference has been the primary source of spatial differences in carbon emission intensity in the YRB during the observation period. The contribution rate of super-variable density is significantly lower than the contribution rate of inter-regional difference. Therefore, we can conclude that the key to solving the problem of uneven carbon emission intensity in the YRB lies in reducing inter-regional differences.

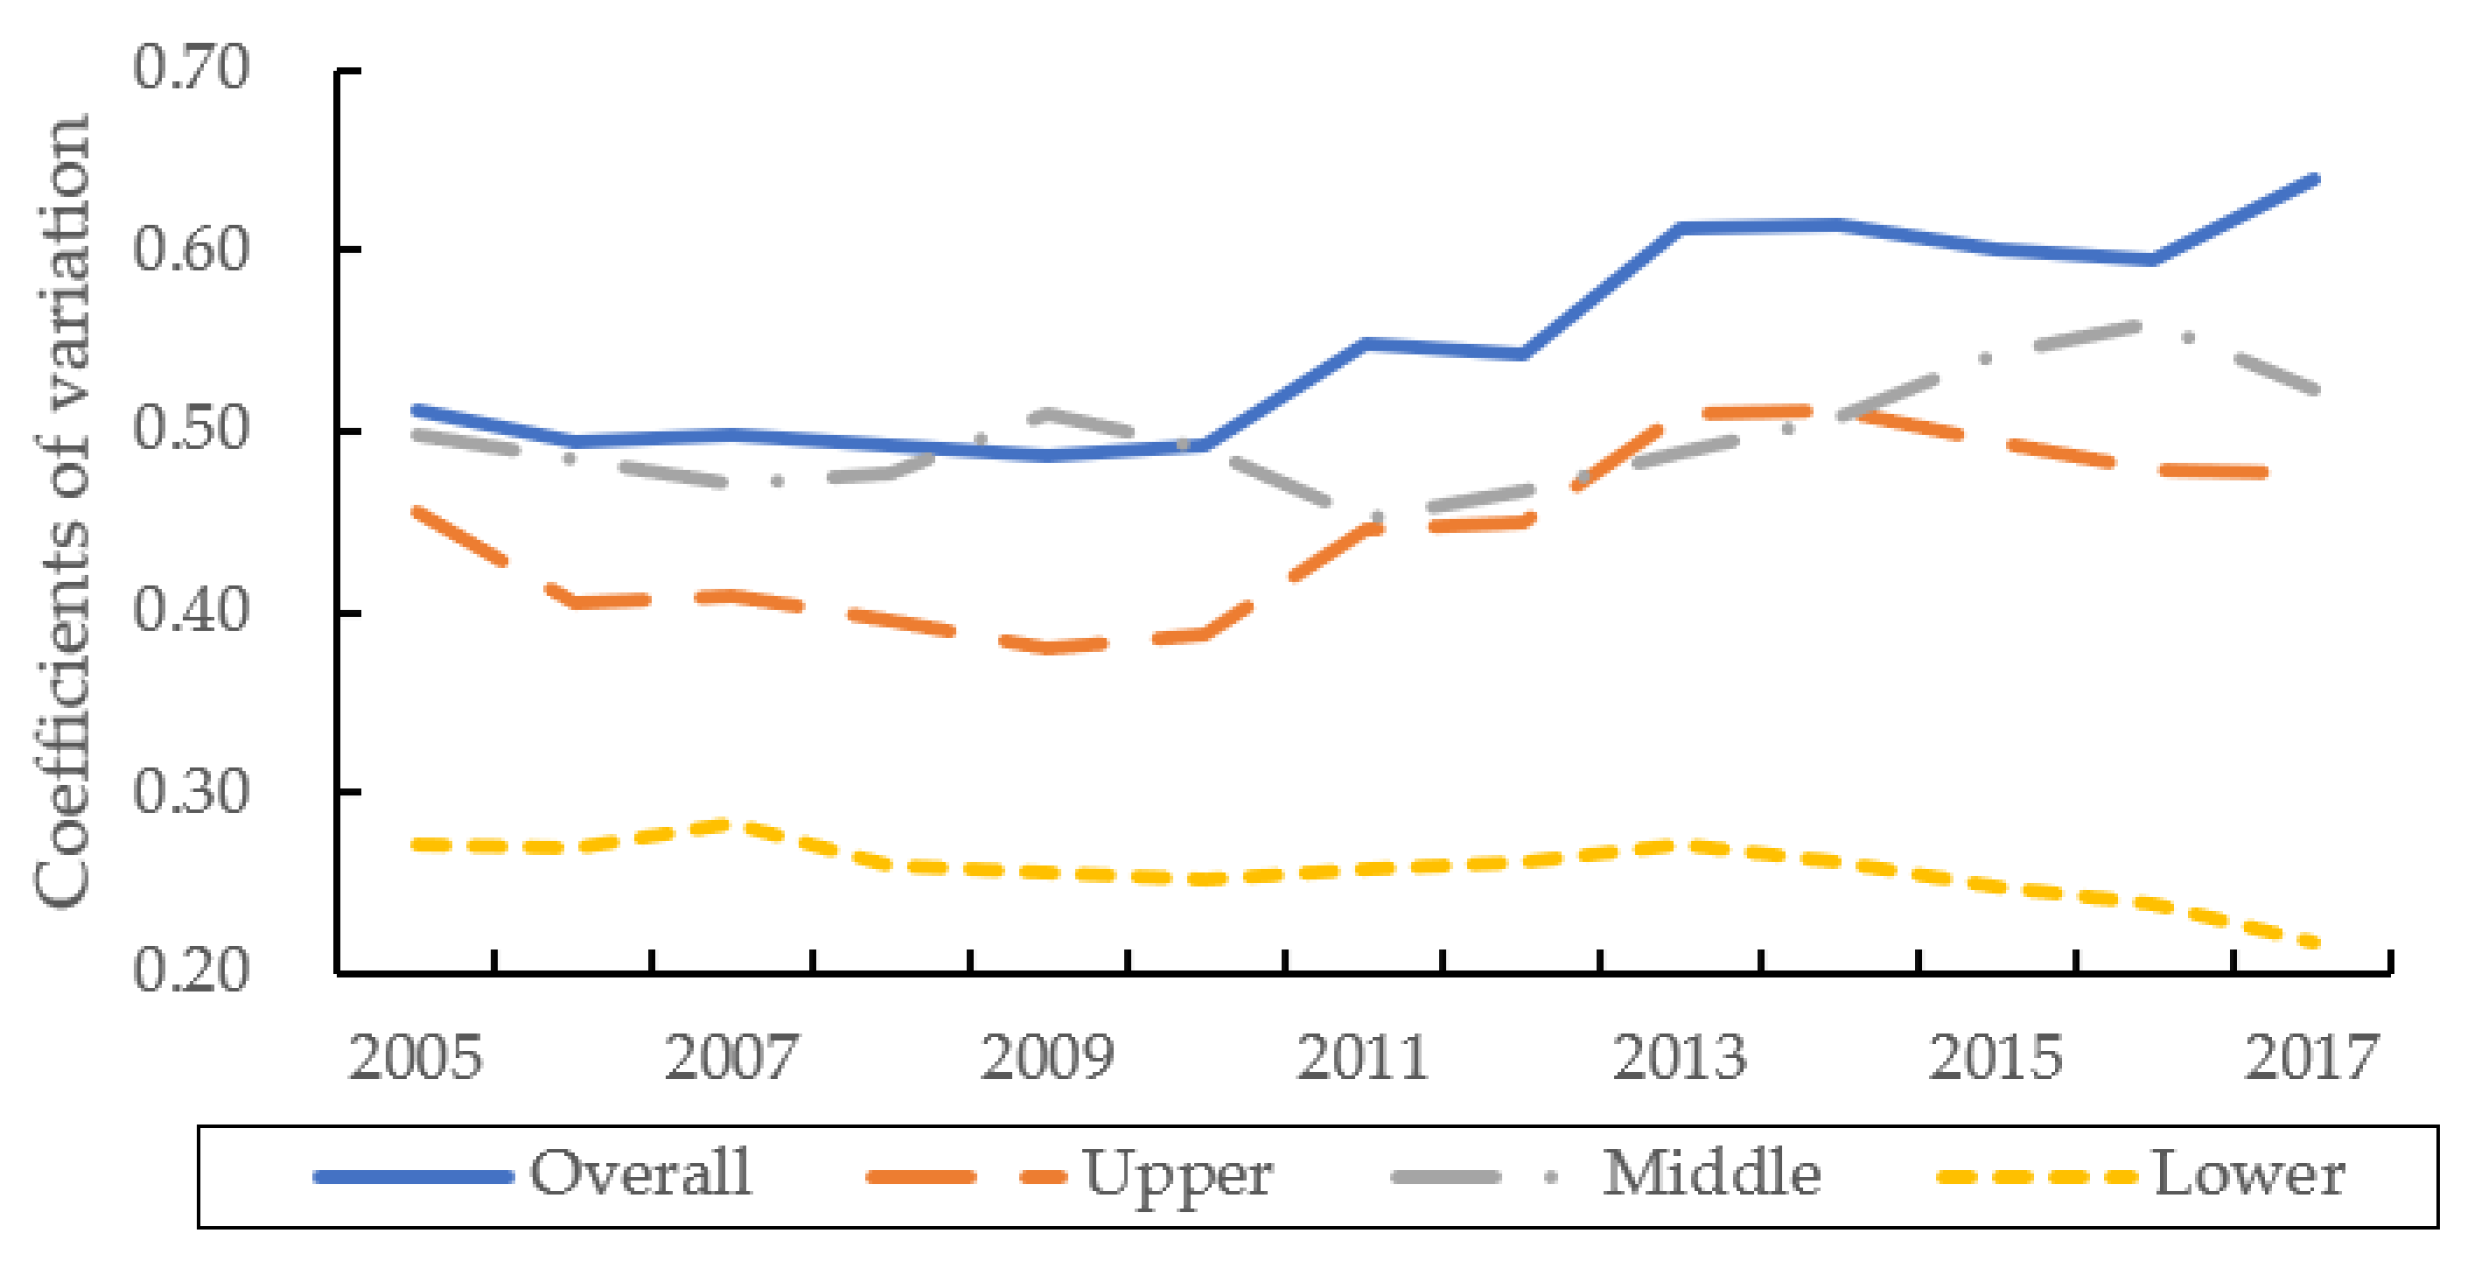
3.5. Convergence Analysis of Carbon Emission Intensity in the YRB

There are noticeable regional differences in carbon emission intensity in the YRB. Therefore, it is worth exploring further whether the regional differences are convergent and whether they can converge to equilibrium. In this paper, we use the variation coefficient method to study the σ convergence of carbon emission intensity in the YRB. Then, we analyze the evolution trend of spatial and temporal patterns of carbon emission intensity, and reveal its spatial convergence characteristics, as shown in Figure 5.
Figure 5 shows the dynamic movement of the coefficients of variation of carbon emission intensity in the YRB during the observation period. From the evolution trend, the YRB showed a “slight decline—relatively stable—rebound up—slight decline—rebound up—decline year by year—slight rise” change process. During the observation period, the coefficients of variation showed a fluctuating upward trend, rising from 0.5107 in 2005 to 0.6389 in 2017, with an increase of 25.10% and an average annual growth rate of 2.09%.
Specifically, at the level of the three regions, the evolution of the coefficients of variation in the upper, middle, and lower reaches showed different trends. Among them, the changing trend of the coefficients of variation in the upper reaches of the YRB is a consistent trend with that of the overall regions. During the observation period, it shows a fluctuating upward trend. The coefficient of variation in 2017 increased by 0.0206 compared with 2005, with an increase of about 4.53% and an average annual increase rate of 0.3775%. The data in the middle reaches of the YRB generally show the evolution process of “gentle decline—rebound—decline year by year—rise year by year—slight decline”. Although the coefficients of variation in the middle reaches decreased three times in different degrees during the observation period, they were still in a general upward trend. Compared with 2005, the coefficients of variation increased by 0.0258 in 2017, increasing about 5.19%, with an average annual growth rate of 0.43%. The figures in the lower reaches of the YRB show an overall “M”-shaped evolution trend during the observation period. Specifically, there was a slight decrease in 2006, a slight increase in the following year, a slow decline from 2007 to 2010, and an increasing trend from 2010 to 2013, followed by a decrease year by year. The coefficients of variation in the lower reaches were generally decreasing. Compared with 2005, they fell by nearly 0.0542 in 2017, with a decline of about 19.9%, and the average annual rate of decrease is 1.66%. In conclusion, the σ convergence coefficients of the YRB as a whole, the upper reaches, and the middle reaches all show an increasing trend yearly during the sample period. Meanwhile, the evolution trend of regional differences in carbon emission intensity in the lower reaches of the YRB shows a significant convergence. The reason for this is although the whole YRB vigorously promotes regional coordinated green and low-carbon development, there are severely different geographical advantages and complicated geographical location. Specifically, the downstream areas have perfect transportation facilities, developed information networks, and close regional cooperation. These promote the orderly flow of advanced management experience, high technology, innovative talents, and other advantageous resources. On the contrary, the middle and upstream areas have relatively weak infrastructure and time lags in information transmission, which lead to the evolution of regional differences not showing convergence characteristics.

4. Discussion and Conclusions

First, based on the results of the empirical study, we compare and discuss these with the existing research. Then, we draw the following research conclusions and propose policy suggestions accordingly, in order to promote the low-carbon economy and regional coordinated development in the YRB, and improve the overall layout of ecological protection and high-quality development in the YRB. Finally, the limitations and future insights of this study are given.

4.1. Discussion

The low-carbon economy aims to pursue a win-win situation of ecological environmental protection and social and economic development, which is the inherent requirement for achieving ecological protection and high-quality development in the YRB. At the same time, the YRB spans China’s eastern, central, and western regions, and the provinces and cities along the route have regional differences in the economic foundation, industrial structure, geographic location, and resource endowments. The imbalance of carbon emission intensity in the upper, middle, and lower regions has also gradually become prominent. Therefore, the core goal of this research is to reveal the spatial distribution pattern and regional difference evolution characteristics of carbon emission intensity in the YRB.
It was found that the carbon emission in the YRB has decreased significantly during the calculation period, which is consistent with the existing research [51]. Prior studies have mainly examined the spatial distribution of carbon emissions in the YRB from the perspective of total carbon emissions. Mo et al. [33] found that carbon emissions in the YRB showed a pattern of “high in the east and low in the west”. Zhang et al. [52] indicated that carbon emissions in the Yellow River Delta showed a larger distribution of carbon emissions in the “east-west” direction than in the “north-south” direction. However, it is not enough to study only the total amount of carbon emissions without considering economic development, and a more comprehensive understanding is needed. Therefore, considering the ecological environment protection and economic development, this paper constructs the calculation formula of carbon emission intensity to analyze the spatial-temporal pattern of carbon emission intensity in the YRB.
Prior studies have found the spatial correlation of carbon emissions in the YRB [34,37,38], which is consistent with the findings of this paper. In contrast, this paper constructs the adjacent weight matrix and spatial geographic weight matrix to explore the spatial correlation of carbon emission intensity in the YRB, which gives a more comprehensive understanding of the research findings. Promoting coordinated regional development is one of China’s major national strategies in the new era. Although many scholars have found spatial heterogeneity in carbon emissions in the YRB [33,52,53,54], they have failed to quantify the sources of regional differences and their convergence characteristics. In this paper, the regional differences and convergence characteristics of carbon emission intensity in the YRB are analyzed in detail by using the Markov chain, Dagum Gini coefficient, and variation coefficient method.

4.2. Conclusions

Based on the carbon emission data of 57 cities in the YRB from 2005 to 2017, we calculate the carbon emission intensity of each city. Our study comprehensively depicts the spatial pattern of carbon emission intensity from the perspective of the basin as a whole and regional comparison. Furthermore, M o r a n s   I is used to investigate the spatial agglomeration characteristics of carbon emission intensity in the YRB. The Dagum Gini coefficient and decomposition method are used to scientifically calculate and decompose the regional differences in carbon emission intensity in the YRB. Markov chain is used to analyze the long-term transfer trends of carbon emission intensity. Finally, the coefficient of variation method is used to analyze the convergence of the regional difference evolution of carbon emission intensity observations. The main conclusions are as follows:
(1)
From the specific facts, the observed values of carbon emission intensity in the whole YRB and the upper, middle, and lower reaches show apparent changing trends and spatial differences during the observation period. The overall trends of the carbon emission intensity in the whole YRB and the upper reaches are approximate “W”-shaped. In contrast, the middle and lower reaches show a decreasing trend yearly.
(2)
From the results of the exploratory spatial data analysis, the spatial distribution of carbon emission intensity in the YRB is not random, and there is spatial autocorrelation. The Moran scatter plots show that there are not only spatial agglomeration characteristics but also spatial heterogeneity characteristics, with most cities showing significant HH and LL agglomeration types.
(3)
The results of the Markov chain show that the carbon emission intensity in the YRB shows the characteristics of “conditional convergence”. The liquidity between different types of carbon emission intensity is low, and there is a “club convergence” phenomenon.
(4)
In terms of regional differences, the overall regional differences in carbon emission intensity in the YRB are in a fluctuating upward trend during the sample period. By region, the intra-regional differences in the upper and middle reaches show a slight increase, while the intra-regional differences in the lower reaches show a fluctuating decrease. From the magnitude of the values, the Gini coefficient in the middle reaches is more significant than in the upper and lower reaches during the observation period. Regarding the sources of variation and their contribution, the primary source of regional differences in carbon emission intensity in the YRB is the inter-regional difference. The intra-regional difference and the super-variable density are the second and the third source, respectively.
(5)
In terms of convergence characteristics, the convergence coefficients of the YRB as a whole, the upper reaches, and the middle reaches show an upward fluctuation trend during the observed period. Meanwhile, the evolution of intra-regional differences in carbon emission intensity in the lower reaches shows significant convergence.

4.3. Policy Suggestions

Under the guidance of the national strategy of the YRB, based on the above research conclusions, we put forward the following policy suggestions. Note that these suggestions aim to develop the low-carbon economy and spur regional coordinated development in the YRB.
(1)
It is necessary to clearly understand the importance and urgency of ecological protection and high-quality coordinated development in the YRB. The differences in geographical location, resource endowment, and ecological conditions of the three major regions in the YRB should be fully considered. Moreover, we should follow the principle of adaptation to local needs and coordinated development, and promote regional coordinated development. Only in this way can we improve the overall layout of ecological civilization construction and high-quality economic growth in the YRB.
(2)
Due to the significant spatial correlation of carbon emission intensity in the YRB, most cities show HH and LL types of spatial agglomeration. In addition, the results of the Markov chain analysis also show that there is a significant “club convergence” of urban carbon emission intensity. For this phenomenon, we should avoid the “Matthew effect” that may be brought by spatial agglomeration. Specifically, we should establish a “wise man seeking common ground” cooperation mechanism to break down regional barriers. We should further accelerate the coordinated development of the ecological environment, infrastructure, technology research, and other essential areas and seek to fully play the scale economies effect brought by agglomeration.
(3)
Since inter-regional differences have always been the primary source of regional differences in carbon emission intensity in the YRB, the inter-regional differences between the upper and lower reaches are much more significant than the “upper-middle” and “middle-lower” inter-regional differences. Based on this phenomenon, it is still necessary to increase investment in infrastructure and basic research in the upper and middle reaches of the YRB. During the “Fourteenth Five-Year Plan” period, the major national strategies in the YRB should be further implemented. Meanwhile, necessary policy support in terms of finance and taxation should be provided. More importantly, it is essential to strengthen the introduction and training of innovative talents, improve the quality of education in general, and cultivate profitable industries based on the comparative advantages of the regions. Only in this way can we radically and progressively close the gap between regions.
(4)
While promoting the coordinated development of the low-carbon economy in the YRB, it is also necessary to pay attention to the convergence trend of carbon emission intensity. The principle of narrowing the gap in carbon emission intensity between regions should be taken into account. At the same time, the coordination of the speed of carbon emission intensity regulation between regions also should be taken into account. This is especially true for the middle and upper reaches, with relatively high carbon emission intensity; despite policy support, technology transfer from developed regions, and other favorable measures have positive promotion effects. However, only fundamental support conditions are decisive factors for reducing carbon emission intensity and promoting high-quality economic development. Therefore, the middle and upper reaches should make efforts to promote basic research, develop high-tech industries, and strengthen the education and training of innovative talents.

4.4. Limitations and Future Insights

The CEADs database is only updated to 2017 and the data are missing for some cities along the YRB. However, the policy changes in green production, energy conservation and emission reduction, and regional coordinated development have been significant in recent years, so the regional coordinated development of the low-carbon economy in the YRB should also be improved to a greater extent. Further comparative calculations can be made when the data are updated.
In addition, this paper constructs the adjacency weight matrix and spatial geographic weight matrix to explore the spatial agglomeration characteristics of carbon emission intensity in the YRB; other spatial weight matrices, such as the economical distance weight matrix can be constructed in the future to further verify the reliability of the research findings.

Author Contributions

Conceptualization, X.C., Q.M., W.S., J.S. (Jianing Shi), J.S. (Jing Sun) and Y.L.; methodology, Q.M. and J.S. (Jianing Shi); software, Q.M. and J.S. (Jianing Shi); validation, X.C. and Q.M.; formal analysis, Q.M.; investigation, Q.M., J.S. (Jianing Shi) and W.S.; resources, X.C. and W.S.; data curation, Q.M.; writing—original draft preparation, X.C., Q.M. and W.S.; writing—review and editing, Q.M., W.S., J.S. (Jianing Shi) and Y.L.; visualization, Q.M.; supervision, X.C. and W.S.; project administration, X.C. and W.S.; funding acquisition, X.C. and W.S. All authors have read and agreed to the published version of the manuscript.

Funding

This research was funded by the National Social Science Found of China (NSSFC), grant number, 21BTJ072, and was funded by the National Natural Science Foundation of China (NSFC), grant number, 11971259.

Institutional Review Board Statement

Not applicable.

Informed Consent Statement

Not applicable.

Data Availability Statement

The data presented in this study are available on request from the corresponding author.

Conflicts of Interest

The authors declare no conflict of interest.

References

  1. Xi, F.; Wang, R.; Shi, J.; Zhang, J.; Yu, Y.; Wang, N.; Wang, Z. Spatio-Temporal Pattern and Conflict Identification of Production–Living–Ecological Space in the Yellow River Basin. Land 2022, 11, 744. [Google Scholar] [CrossRef]
  2. Chen, Y.P.; Fu, B.J.; Zhao, Y.; Wang, K.B.; Zhao, M.M.; Ma, J.F.; Wu, J.; Xu, C.; Liu, W.; Wang, H. Sustainable development in the Yellow River basin, China: Issues and strategies. J. Clean. Prod. 2020, 263, 121223. [Google Scholar] [CrossRef]
  3. Zhang, B.; Wang, Y.; Li, J.; Zheng, L. Degradation or Restoration? The Temporal-Spatial Evolution of Ecosystem Services and Its Determinants in the Yellow River Basin, China. Land 2022, 11, 863. [Google Scholar] [CrossRef]
  4. Lou, Y.; Yang, D.; Zhang, P.; Zhang, Y.; Song, M.; Huang, Y.; Jing, W. Multi-Scenario Simulation of Land Use Changes with Ecosystem Service Value in the Yellow River Basin. Land 2022, 11, 992. [Google Scholar] [CrossRef]
  5. Lu, C.P.; Ji, W.; Hou, M.C.; Ma, T.Y.; Mao, J.H. Evaluation of efficiency and resilience of agricultural water resources system in the Yellow River Basin, China. Agric. Water Manag. 2022, 266, 107605. [Google Scholar] [CrossRef]
  6. Liu, X.; Feng, X.; Ciais, P.; Fu, B.; Hu, B.; Sun, Z. GRACE satellite-based drought index indicating increased impact of drought over major basins in China during 2002–2017. Agric. For. Meteorol. 2020, 291, 108057. [Google Scholar] [CrossRef]
  7. Wang, F.; Wang, Z.; Yang, H.; Di, D.; Zhao, Y.; Liang, Q.; Hussain, Z. Comprehensive evaluation of hydrological drought and its relationships with meteorological drought in the Yellow River basin, China. J. Hydrol. 2020, 584, 124751. [Google Scholar] [CrossRef]
  8. Sarhadi, A.; Soulis, E.D. Time-varying extreme rainfall intensity-duration-frequency curves in a changing climate. Geophys. Res. Lett. 2017, 44, 2454–2463. [Google Scholar] [CrossRef]
  9. Sharma, S.; Mujumdar, P.P. On the relationship of daily rainfall extremes and local mean temperature. J. Hydrol. 2019, 572, 179–191. [Google Scholar] [CrossRef]
  10. Lv, J.X.; Liu, C.M.; Liang, K.; Tian, W.; Bai, P.; Zhang, Y.H. Spatiotemporal variations of extreme precipitation in the Yellow River Basin based on water resources regionalization. Resour. Sci. 2022, 44, 261–273. [Google Scholar] [CrossRef]
  11. Liu, K.; Qiao, Y.R.; Shi, T.; Qian, Z. Study on coupling coordination and spatiotemporal heterogeneity between economic development and ecological environment of cities along the Yellow River Basin. Environ. Sci. Pollut. Res. 2021, 28, 6898–6912. [Google Scholar] [CrossRef]
  12. Chen, M.H.; Yue, H.J.; Hao, Y.F.; Liu, W.F. The Spatial Disparity, Dynamic Evolution and Driving Factors of Ecological Efficiency in the Yellow River Basin. J. Quant. Tech. Econ. 2021, 38, 25–44. [Google Scholar]
  13. Kuzior, A.; Postrzednik-Lotko, K.A.; Postrzednik, S. Limiting of Carbon Dioxide Emissions through Rational Management of Pro-Ecological Activities in the Context of CSR Assumptions. Energies 2022, 15, 1825. [Google Scholar] [CrossRef]
  14. Pourakbari-Kasmaei, M.; Lehtonen, M.; Contreras, J.; Mantovani, J.R.S. Carbon Footprint Management: A Pathway Toward Smart Emission Abatement. IEEE Trans. Ind. Inform. 2020, 16, 935–948. [Google Scholar] [CrossRef] [Green Version]
  15. Ghosh, S.; Dinda, S.; Das Chatterjee, N.; Dutta, S.; Bera, D. Spatial-explicit carbon emission-sequestration balance estimation and evaluation of emission susceptible zones in an Eastern Himalayan city using Pressure-Sensitivity-Resilience framework: An approach towards achieving low carbon cities. J. Clean. Prod. 2022, 336, 130417. [Google Scholar] [CrossRef]
  16. Li, L.; Liu, D.; Hou, J.; Xu, D.D.; Chao, W.B. The Study of the Impact of Carbon Finance Effect on Carbon Emissions in Beijing-Tianjin-Hebei Region-Based on Logarithmic Mean Divisia Index Decomposition Analysis. Sustainability 2019, 11, 1465. [Google Scholar] [CrossRef] [Green Version]
  17. Kone, A.C.; Buke, T. Factor analysis of projected carbon dioxide emissions according to the IPCC based sustainable emission scenario in Turkey. Renew. Energy 2019, 133, 914–918. [Google Scholar] [CrossRef]
  18. Eren, M. Different impacts of democracy and income on carbon dioxide emissions: Evidence from a panel quantile regression approach. Environ. Sci. Pollut. Res. 2022, 1–21. [Google Scholar] [CrossRef]
  19. Alam, M.S.; Safiullah, M.; Islam, M.S. Cash-rich firms and carbon emissions. Int. Rev. Financ. Anal. 2022, 81, 102106. [Google Scholar] [CrossRef]
  20. Liu, G.; Zhang, F. Land Zoning Management to Achieve Carbon Neutrality: A Case Study of the Beijing-Tianjin-Hebei Urban Agglomeration, China. Land 2022, 11, 551. [Google Scholar] [CrossRef]
  21. Chen, X.; Lin, B.Q. Towards carbon neutrality by implementing carbon emissions trading scheme: Policy evaluation in China. Energy Policy 2021, 157, 112510. [Google Scholar] [CrossRef]
  22. Ahmadi, Y.; Yamazaki, A.; Kabore, P. How Do Carbon Taxes Affect Emissions? Plant-Level Evidence from Manufacturing. Environ. Resour. Econ. 2022, 82, 285–325. [Google Scholar] [CrossRef]
  23. Wu, H.B.; Sun, Y.X.; Su, Y.T.; Chen, M.; Zhao, H.X.; Li, Q. Which Is the Best Supply Chain Policy: Carbon Tax, or a Low-Carbon Subsidy? Sustainability 2022, 14, 6312. [Google Scholar] [CrossRef]
  24. Liu, J.B.; Feng, H.Y.; Wang, K. The Low-Carbon City Pilot Policy and Urban Land Use Efficiency: A Policy Assessment from China. Land 2022, 11, 604. [Google Scholar] [CrossRef]
  25. Jiang, P.P.; Wang, Y.; Luo, J.; Chu, X.Z.; Wu, B.W. A Comparative Study of the Spatial-Temporal Evolution and Growth Path of Carbon Emissions Efficiency in the Yangtze River Basin and Yellow River Basin. Res. Environ. Sci. 2022, in press. [Google Scholar]
  26. Zhang, Y.; Xu, X.Y. Carbon emission efficiency measurement and influencing factor analysis of nine provinces in the Yellow River basin: Based on SBM-DDF model and Tobit-CCD model. Environ. Sci. Pollut. Res. 2022, 29, 33263–33280. [Google Scholar] [CrossRef]
  27. Zhou, X.; Yu, J.; Li, J.F.; Li, S.C.; Zhang, D.; Wu, D.; Pan, S.P.; Chen, W.X. Spatial correlation among cultivated land intensive use and carbon emission efficiency: A case study in the Yellow River Basin, China. Environ. Sci. Pollut. Res. 2022, 29, 43341–43360. [Google Scholar] [CrossRef]
  28. Li, W.Q.; Zhao, J.W. Research on the Coupling Coordination of Agricultural Ecological Efficiency and Green Total Factor Productivity in the Yellow River Basin. Ecol. Econ. 2022, 38, 121–128+168. [Google Scholar]
  29. Yue, L.; Miao, J.Y. A Research on the Promotion Mechanism of Efficient Urban Energy Utilization along the Yellow River Basin from the Perspective of Carbon Emission Reduction. J. Lanzhou Univ. (Soc. Sci.) 2022, 50, 13–26. [Google Scholar]
  30. Liu, H.J.; Qiao, L.C.; Sun, S.H. Spatial distribution and dynamic change of water use efficiency in the Yellow River Basin. Resour. Sci. 2020, 42, 57–68. [Google Scholar] [CrossRef]
  31. Yuan, P.; Zhou, Y. The Spatio-Temporal Evolution and Improvement Path of Agricultural Eco-Efficiency in the Yellow River Basin Study. Ecol. Econ. 2021, 37, 98–105. [Google Scholar]
  32. Su, Z.X.; Zhang, G.X.; Xu, L.; Geng, G.H.; Wang, Y.C.; Ali, I. Carbon emission performance in logistics in the Yellow River basin. Desalin. Water Treat. 2021, 220, 14–21. [Google Scholar] [CrossRef]
  33. Mo, H.B.; Wang, S.J. Spatio-temporal evolution and spatial effect mechanism of carbon emission at county level in the Yellow River Basin. Sci. Geogr. Sin. 2021, 41, 1324–1335. [Google Scholar]
  34. Lv, Q.; Liu, H.B. Multiscale Spatio-Temporal Characteristics of Carbon Emission of Energy Consumption in Yellow River Basin Based on the Nighttime Light Datasets. Econ. Geogr. 2020, 40, 12–21. [Google Scholar]
  35. Gong, W.-F.; Fan, Z.-Y.; Wang, C.-H.; Wang, L.-P.; Li, W.-W. Spatial Spillover Effect of Carbon Emissions and Its Influencing Factors in the Yellow River Basin. Sustainability 2022, 14, 3608. [Google Scholar] [CrossRef]
  36. Sun, X.; Zhang, H.; Ahmad, M.; Xue, C. Analysis of influencing factors of carbon emissions in resource-based cities in the Yellow River basin under carbon neutrality target. Environ. Sci. Pollut. Res. Int. 2022, 29, 23847–23860. [Google Scholar] [CrossRef]
  37. Gao, X.C.; Han, X. Study on the Spatial Differentiation and Influencing Factors of Carbon Emissions in the Yellow River Basin. Econ. Surv. 2022, 39, 13–23. [Google Scholar]
  38. Du, H.B.; Wei, W.; Zhang, X.Y.; Ji, X.P. Spatio-temporal evolution and influencing factors of energy-related carbon emissions in the Yellow River Basin: Based on the DMSP/OLS and NPP/VIIRS nighttime light data. Geogr. Res. 2021, 40, 2051–2065. [Google Scholar]
  39. Li, Q. A Study on the Spatial Relationship of the Urban Carbon Dioxide Emission in the Yellow River Basin. J. Grad. Sch. Chin. Acad. Soc. Sci. 2021, 3, 71–79. [Google Scholar]
  40. China Emission Accounts and Datasets. Available online: https://www.ceads.net.cn/ (accessed on 20 March 2022).
  41. Yellow River Cultural Encyclopedia Compilation Committee. Yellow River Culture Encyclopedia; Sichuan Dictionary Press: Chengdu, China, 2000. [Google Scholar]
  42. Guo, H. Sustainable development and ecological environment protection in the high quality development of the Yellow River Basin. J. Humanit. 2020, 1, 17–21. [Google Scholar]
  43. National Bureau of Statistics. China City Statistical Yearbook 2006–2018. Available online: https://data.cnki.net/Yearbook/Single/N2022040095 (accessed on 20 March 2022).
  44. Moran, P.A.P. Notes on continuous stochastic phenomena. Biometrika 1950, 37, 17–23. [Google Scholar] [CrossRef] [PubMed]
  45. Shen, W.K.; Xia, W.Q.; Li, S.F. Dynamic Coupling Trajectory and Spatial-Temporal Characteristics of High-Quality Economic Development and the Digital Economy. Sustainability 2022, 14, 4543. [Google Scholar] [CrossRef]
  46. Dagum, C. A New Approach to the Decomposition of the Gini Income Inequality Ratio. Empir. Econ. 1997, 22, 515–531. [Google Scholar] [CrossRef]
  47. Chen, X.L.; Meng, Q.G.; Shi, J.N.; Shen, W.F. Ecological Efficiency Measurement and Analysis of Spatial-Temporal Evolution in Eight Comprehensive Economic Areas of China. Rev. Econ. Manag. 2022, 38, 109–121. [Google Scholar]
  48. Ma, Y.L.; Ma, Y.P. Study on Regional Differences and Convergence of the Allocation Efficiency of Scientific and Technological Resources in China. J. Quant. Tech. Econ. 2021, 38, 83–103. [Google Scholar]
  49. Liu, H.J.; Wang, Y.H.; Lei, M.Y. Spatial Agglomeration of Strategic Emerging Industries in China. J. Quant. Tech. Econ. 2019, 36, 99–116. [Google Scholar]
  50. Chen, M.H.; Liu, W.F.; Wang, S.; Liu, Y.X. Spatial pattern and temporal trend of urban ecological efficiency in the Yangtze River Economic Belt. Resour. Sci. 2020, 42, 1087–1098. [Google Scholar] [CrossRef]
  51. Zhang, Z.Q.; Zhang, T.; Feng, D.F. Study on Regional Differences, Dynamic Evolution and Convergence of Carbon Emission Intensity in China. J. Quant. Tech. Econ. 2022, 39, 67–87. [Google Scholar]
  52. Zhang, C.Y.; Lin, Z.; Zhang, H.T.; Chen, M.N.; Fang, R.Y.; Yao, Y.; Zhang, Q.P.; Wang, Q. Spatial-temporal characteristics of carbon emissions from land use change in Yellow River Delta region, China. Ecol. Indic. 2022, 136, 108623. [Google Scholar] [CrossRef]
  53. Ma, Y.; Liu, Z.Z. Study on the Spatial-Temporal Evolution and Influencing Factors of Land Use Carbon Emissions in the Yellow River Basin. Ecol. Econ. 2021, 37, 35–43. [Google Scholar]
  54. Zhao, J.J.; Kou, L.; Wang, H.T.; He, X.Y.; Xiong, Z.H.; Liu, C.Q.; Cui, H. Carbon Emission Prediction Model and Analysis in the Yellow River Basin Based on a Machine Learning Method. Sustainability 2022, 14, 6153. [Google Scholar] [CrossRef]
Figure 1. Overview of the distribution of cities along the YRB.
Land 11 01042 g001
Figure 2. Spatial and temporal evolution of carbon emission intensity in the YRB. (a) Average value of carbon emission intensity in the YRB; (b) Carbon emission intensity of three regions.
Land 11 01042 g002
Figure 3. Moran scatter plots of carbon emission intensity in the YRB in 2017. (a) Based on the adjacency weight matrix; (b) Based on spatial geographic weight matrix.
Land 11 01042 g003
Figure 4. Magnitude and contribution rate of spatial differences in carbon emission intensity in the YRB. (a) Overall and intra-regional Gini coefficients; (b) Inter-regional Gini coefficient; (c) Source and contribution rate of spatial differences.
Land 11 01042 g004
Figure 5. Evolution of the coefficient of variation of carbon emission intensity in the YRB as a whole and three regions.
Land 11 01042 g005
Table 1. Distribution of cities in the upper, middle and lower reaches of the YRB.
RegionsNumberCities
Upstream1–20Xining, Yinchuan, Shizuishan, Wuzhong, Zhongwei, Guyuan, Lanzhou, Baiyin, Tianshui, Wuwei, Pingliang, Qingyang, Dingxi, Longnan, Hohhot, Baotou, Wuhai, Ordos, Bayannur and Ulanqab
Midstream21–41Xi’an, Tongchuan, Baoji, Xianyang, Weinan, Yan’an, Yulin, Taiyuan, Yangquan, Changzhi, Jincheng, Shuozhou, Jinzhong, Yuncheng, Xinzhou, Linfen, Lvliang, Zhengzhou, Luoyang, Jiaozuo and Sanmenxia
Downstream42–57Kaifeng, Anyang, Hebi, Xinxiang, Puyang, Jinan, Zibo, Dongying, Jining, Taian, Laiwu, Linyi, Dezhou, Liaocheng, Binzhou, and Heze.
Table 2. Results of global correlation analysis.
YearAdjacency Weight MatrixSpatial Geographic Weight Matrix
M o r a n s   I Z-Scorep-Value M o r a n s   I Z-Scorep-Value
20050.4154.9240.0000.1135.3800.000
20060.4435.2460.0000.1306.0770.000
20070.4104.8490.0000.1265.9060.000
20080.3774.4730.0000.1265.9060.000
20090.3664.3310.0000.1195.5940.000
20100.3874.5850.0000.1336.1770.000
20110.4555.4390.0000.1687.7130.000
20120.4385.2320.0000.1496.9330.000
20130.4695.6530.0000.1627.5310.000
20140.4815.7660.0000.1587.3690.000
20150.4825.7110.0000.1516.9700.000
20160.4815.6650.0000.1476.7760.000
20170.5035.9470.0000.1798.1110.000
Table 3. Markov probability transfer matrix of carbon emission intensity in the YRB.
Regions t / t + 1 LowMedium-LowMedium-HighHigh
Overall areasLow0.92860.06550.00600.0000
Medium-low0.11310.83930.04760.0000
Medium-high0.00000.10120.83330.0655
High0.00000.00000.05560.9444
Upstream areasLow0.86670.11670.01670.0000
Medium-low0.15000.65000.20000.0000
Medium-high0.00000.10000.75000.1500
High0.00000.00000.10000.9000
Midstream areasLow0.93330.06670.00000.0000
Medium-low0.16670.75000.08330.0000
Medium-high0.00000.11670.81670.0667
High0.00000.01390.09720.8889
Downstream areasLow0.89580.10420.00000.0000
Medium-low0.06250.89580.04170.0000
Medium-high0.00000.20830.66670.1250
High0.02080.00000.18750.7917
Table 4. Regional differences in carbon emission intensity and their contribution in the YRB.
YearsOverall GIntra-Regional DifferencesInter-Regional DifferencesContribution Rates
UpperMiddleLowerU-MU-LM-LIntra-RInter-RS-V-D
20050.27750.25100.27600.15210.27090.32070.303930.57%38.81%30.61%
20060.26770.22160.26680.15020.25440.32380.305529.59%44.99%25.41%
20070.27060.22340.26270.15900.25620.33960.302229.30%47.94%22.76%
20080.26880.21750.26770.14400.25970.33800.293229.05%49.00%21.95%
20090.26600.21050.28330.14430.26070.31610.291929.79%44.71%25.51%
20100.26950.21500.27310.14240.26620.34040.282228.99%49.76%21.25%
20110.28860.24110.25290.14640.29320.39680.268727.72%58.12%14.15%
20120.28610.24350.26010.14980.29050.38070.269928.44%55.13%16.43%
20130.31260.26950.27090.15400.31540.42620.292628.14%57.75%14.11%
20140.31630.27300.28290.14970.31530.42480.307028.46%56.04%15.50%
20150.31660.26890.30230.14150.31070.41050.327428.95%52.26%18.80%
20160.31820.26480.31030.13680.30990.40870.339828.91%50.74%20.36%
20170.33550.26530.29500.12430.34870.46720.310526.56%61.81%11.62%
Average0.29190.24350.27720.14570.28860.37640.299628.81%51.31%19.88%
Note: “U-M”, “U-L”, “M-L” indicate the inter-regional differences between the upper and middle reaches, the upper and lower reaches, and the middle and lower reaches, respectively; “Intra-R”, “Inter-R”, “S-V-D” indicate the contribution rates of the intra-regional differences, the inter-regional differences, and super-variable density, respectively.
Table 5. List of abbreviations.
AbbreviationsFull Name
CEADSChina Emission Accounts and Datasets
CO2Carbon Dioxide
DMSP-OLSDefense Meteorological Satellite Program Visible Infrared Imaging Operational Linear Scanning Operational System
GDPGross Domestic Product
HHHigh-High
HLHigh-Low
LHLow-High
LLLow-Low
NPP-VIIRSNational Polar-orbiting Partnership Satellite Visible Infrared Imaging Radiometer Suite
PSO-BPParticle Swarm Optimization-Back Propagation
YRBYellow River Basin
Publisher’s Note: MDPI stays neutral with regard to jurisdictional claims in published maps and institutional affiliations.

