
Identifying Peach Trees in Cultivated Land Using U-Net Algorithm

1
Key Laboratory of Land Surface Pattern and Simulation, Institute of Geographical Science and Natural Resources Research, Chinese Academy of Sciences, Beijing 100101, China
2
Institute of the Environment and Sustainable Development in Agriculture, Chinese Academy of Agriculture Sciences, Beijing 100081, China
*
Author to whom correspondence should be addressed.
Land 2022, 11(7), 1078; https://doi.org/10.3390/land11071078
Submission received: 28 May 2022
/
Revised: 12 July 2022
/
Accepted: 13 July 2022
/
Published: 14 July 2022
Abstract
:Non-grain production has emerged as a potential threat to grain production capacity and security in China. Agricultural products with higher economic returns are beginning to replace traditional grain crops, which have relatively low economic returns on a large scale. In this study, we proposed and verified an identification method utilizing an unmanned aerial vehicle and a U-net algorithm to distinguish peach trees in cultivated land; the overall accuracy for verification and prediction were 0.90 and 0.92, respectively. Additionally, a non-grain production index was developed to assess the degree of non-grain production in target plots. The index was 76.90% and 91.38% in the projected plots, representing a high degree of non-grain production. This combination of an identification method and non-grain production index could provide efficient tools for agricultural management to inspect peach trees in cultivated land, thus replacing field measurements to achieve significant labor savings. Furthermore, this method can provide a reference for creating high-standard farmland, sustainable development of cultivated land, and policymaking.
1. Introduction
Grain production is typically related to national security and social stability [1]. Since the 1960s, the amount of cultivated land per capita worldwide has decreased to 0.21 hectares [2]. Grain demand and security have become prominent issues due to global population growth and rapid economic development [3]. Some scholars have found that there is not much room for global grain production to increase [3]; consequently, the protection of cultivated land has become a major issue both in China and worldwide. The protection of cultivated land resources is a basic state policy of China and an essential foundation for achieving food security [4]. However, due to accelerated industrialization and urbanization, approximately 2.94 × 10⁵ ha of cultivated land in China is converted into construction land annually [5]. Furthermore, following the development of economic forest, pond fish farming, and greenhouse vegetable production [6], non-grain production in arable land is emerging as a potential threat [7]. Economic forests, which mainly involve fruit products with high economic values, occupy large-scale cultivated land, and have begun to replace traditional grain crops [8,9]. Pond fish farming and greenhouse vegetable production will reduce the quality of cultivated land to a certain extent [10]. Increased non-grain production could lead to overestimating the grain outlook and jeopardizing long-term national grain security [11]. Many cultivated land protection policies have been widely used in European and American countries and some developing countries, such as the “Green Belt Policy” in the UK, the “Physical Planning Act” in Germany, and the approach to land-use control in the US [12], the “Revitalizing Rainfed Agriculture network” in India [13], and the Low Carbon Emission Plan in Agriculture in Brazil [14]. The government of China is highly concerned about converting arable land to non-grain production [11]. From 2014 to 2021, the No. 1 Central Documents of the Communist Party Committee (CPC) required the adoption of the strictest cultivated land protection systems to avoid or minimize non-grain production [15]. However, this issue remains prominent in China and other developing countries with similar agricultural planting structures.
Non-grain production in cultivated land has expanded rapidly in recent years, incentivized by both economic returns and industrial policy in China. Xiao et al. noted that cash crops underwent a net growth of 53.5% in Hangzhou from 1985 to 2009. Additionally, they found that the distances to rivers, lakes, the county center, and provincial roads were decisive determinants of whether farmers planted cash crops [15]. Su et al. revealed that nursery plantations and pond fish farming expanded rapidly in Tongxiang from 2000 to 2015 due to their low investment costs, low labor requirements, and high profit [9]. Farming conditions, such as soil type and the distance to rivers, also contributed to the expansion of non-grain production [7]. Additionally, Li et al. combined land information, administrative boundary data, and socio-economic data from the Statistical Yearbooks of Liyang City to analyze the spatial distribution of non-grain production in cultivated land in various towns, and it was found that lower grain prices have led some farmers to plant other crops with higher economic benefits. Among all land types, irrigable land has the largest non-grain production rate among cultivated areas [16]. Similarly, Sun et al. analyzed data on population, GDP, and cultivated land area across 11 provinces and 130 cities in China using land-use maps, to analyze the driving factors for non-grain production [6]. The agricultural policies introduced by local governments, specifically the “one village, one product” strategy (OVOP), have caused non-grain production areas to significantly increase (29.53%) in 35 of the 47 counties in the Guanzhong Plain; thus, the OVOP strategy is a significant cause of the non-grain production expansion [7], although it can improve the income level of residents. This phenomenon contradicts the central government’s policy of discouraging non-grain production. To prevent this situation from becoming more complicated, a fast and convenient assessment of the non-grain production data is crucial for the central government to regulate the behavior of local governments.
In recent years, machine learning methods have been preliminarily applied to the cultivated land problem. Based on the hierarchical structure of the model, machine learning techniques can be divided into surface learning (involving methods such as support vector machines or SVMs), logistic regression, and multi-structure deep learning (such as convolutional neural networks). Cai et al. used remote sensing images and an SVM to identify cultivated and non-cultivated land in arid areas in China [17]; this method of recognizing cultivated land provides a good reference for obtaining information on crops and economic forests. However, traditional SVM learning methods have limitations in extracting different spectral changes within the same land cover type, such as vegetated and non-vegetated cultivated land [18]. Additionally, Ramezan et al. found that, for SVM algorithms for land cover classification, the accuracy decreases when the sample size increases [19]. Thus, Xu et al. proposed an end-to-end high-resolution U-net method to extract cultivated land from Landsat Thematic Mapper images [20]. This method can improve the extraction accuracy for cultivated land but lacks basic information on economic forests and non-grain production. The advantage of the U-net algorithm is that, when labeling, the output should include different types of boundaries, and each pixel should be given a category label. This pixel-based technique allows the network to learn and provide predictions for each pixel. Therefore, it is necessary to select typical ground features as category labels to take advantage of the U-net algorithm.
The rapid development of non-grain production necessitates higher requirements for precise quantitative monitoring. To address the issue of non-grain production, the agricultural management department must understand the non-grain production within its jurisdiction. Currently, non-grain production is primarily investigated using a statistical analysis of farm household data from questionnaire surveys [21,22]; remote sensing data are used to examine its spatial distribution. Many time-consuming field surveys are required to quantify the conversion of traditionally cultivated crops to non-grain production. To improve the efficiency of the investigation, four types of remote sensing data are used to examine the spatial distribution of non-grain production: (1) Data from the 3rd National Land Resource Survey, derived from visual interpretation of satellite images from Gaofen-2, have been used to obtain non-grain production information [16]. (2) Operational Land Imager data from the Landsat 8 satellite with a spatial resolution of 30 m, combined with UAV images, were used to separate the grassland and trees in the cultivated land [23]. (3) Aerial photos with a spatial resolution of less than 1 m have been used to visually interpret the non-grain production in cultivated land and to analyze the type and spatial distribution of non-grain production, combined with land use planning, annual land use survey data, and soil maps [24]. (4) As a type of non-grain production, agricultural plastic greenhouses can be accurately visually interpreted using high-resolution Google Earth imagery, and the extraction accuracy was 97.20% when combined with deep learning algorithms [25]. Currently, greenhouses and ponds, which significantly differ from cultivated land, are relatively easy to identify; however, identifying economic forests remains challenging [26,27]. Economic forests and non-grain crops can easily be confused with cultivated land during visual interpretation (Figure 1). Thus, the agricultural management department urgently needs a method to identify non-grain production across large areas of cultivated land, especially for the economic forest, in near real-time, at a low cost, and with high precision [28]. Therefore, a new monitoring method is required to distinguish non-grain production from cultivated land.
This study aimed to introduce and test the feasibility of a U-net Algorithm and unmanned aerial vehicle (UAV)-based non-grain production monitoring and assessment approach for cultivated land management. The objectives of this study were to identify easily misattributed non-grain production areas in cultivated land and assess the degree of non-grain production in target plots containing both non-grain production and cultivated land. Developing an accurate and rapid non-grain production identification method will support high-standard farmland construction and sustainable farmland management.
2. Materials and Methods
2.1. Study Area
The study area was in the Pinggu District of Beijing, China (40°14′15.488 N–40°15′13.534 N, 116°58′58.105 E–116°59′34.182 E; Figure 2). The total area of cultivated land in the Pinggu District is 11,779.57 ha [29], accounting for 7.78% of the cultivated land in Beijing. The district’s southern, northern, and eastern parts are mountainous areas, whereas the southwestern and central parts are plains. Hence, the terrain slopes down toward the southwest, and the altitude ranges from 11.20 m to 1230.66 m. The Pinggu District has a warm-temperate continental monsoon climate with an annual average temperature of 11.5 °C and an annual frost-free period of 191 days. Its average annual rainfall is 639.5 mm, of which approximately 75% falls during summer [30]. The organic matter content of the soil is 1.320% [31].
The Pinggu District is among the leading agrarian production areas in Beijing. The agricultural areas in the plains, which should be producing traditional grain crops, have become the main planting area for peach trees, considered a type of economic forest. Therefore, the economic forest in the study area was mainly peach trees, which were chosen as the main object of study, and the phenological characteristics of peach trees were analyzed. One training plot (G1) and two prediction plots (G2 and G3) were randomly selected to identify the peach trees.
2.2. Image Acquisition Using UAV Data
Higher resolution images and accurate methods are needed to extract information on non-traditional grain crops on cultivated land. The low-altitude remote-sensing capabilities of UAVs provide the potential for identifying crops on cultivated land owing to their low cost, flexibility, high spatial resolution, and independence in regards to climatic conditions (cloud cover, etc.). UAVs have been widely used for crop growth monitoring [32,33], yield estimation [34], and other aspects. However, the use of UAVs to quantify orchards in cultivated land is still in its infancy. In addition, as near-ground UAV images contain land types with complex textual information, extracting information through visual interpretation alone may be time-consuming and laborious [35], resulting in a bottleneck for rapid acquisition and application of crop information.
To acquire the peach tree images, we used a DJI Mavic Pro UAV, a quadcopter with a four-wheel-drive motor. The relevant parameters of the UAV mainly include a focal length of 28 mm, an effective number of pixels of 12.35 million, a maximum speed of 18 m/s, and a flight time of 27 min. To enhance the recognition of peach trees in cultivated land, we chose the flowering period of peach trees for UAV image acquisition; thus, the UAV data were obtained on 13 April 2021, when it was clear and cloudless, and the solar light intensity was stable. The flight altitude of the UAV was 71.9 m, the flight latitude ranged from 40°14′15.488 N to 40°15′13.534 N, and the flight longitude was 116°58′58.105 E to 116°59′34.182 E, resulting in an optical ground sampling distance of 3.1 cm. The horizontal and vertical overlapping degrees are 70% and 80%, respectively.
The flight was performed on a dry, windless day to avoid any distortions caused by undulations of the UAV camera [36]. Autonomous flight planning was utilized; the north–south flight path was divided into three flights, and the speed and time of each flight were 11 m/s and 12 min, respectively. The camera angle was −90°, and the camera was automatically activated every 7 m. An internal GPS/GLONASS dual mode satellite positioning system recorded the UAV’s position. During the survey, the camera produced 20 MP images in the red, green, and blue (RGB) wavelengths, for a total of 1397 RGB images.
The problem of detecting and quantifying peach trees can be viewed as a semantic segmentation task. There are two categories to be distinguished based on the required tasks: peach and non-peach trees. The segmentation performance relies on the quality of the labeled data and segmentation algorithms, mainly by observing orthomosaic images of RGB images collected by the UAV. Then, the peach tree areas in the three experimental study areas were manually marked with digitizing polygon outlines, including branches, peach blossoms, and tree shadows. Therefore, the peach trees in the three typical phenomenon experimental areas in the Pinggu District can be used for training and verification, respectively.
2.3. Estimation of Peach Trees Using the U-Net Algorithm
2.3.1. U-Net Architecture and Parameter Settings
As shown in Figure 3, the U-net architecture follows that developed by Ronneberger et al. [37] and consists of two parts: shrink paths and extension paths. Shrink paths follow a typical convolutional network structure with many characteristic channels that allow the network to propagate contextual information to a higher resolution layer [38].
The U-net in this study consisted of convolutional layers, which had 3 × 3 convolutional cores, and rectified linear units. A batch normalization layer was added after each convolutional layer to achieve numerical stabilization in the training process. After the feature map size was reduced, the two largest 2 × 2 pool layers were down-sampled. In each down-sampling step, the feature channel was increased by two orders of magnitude, and in each up-sampling step, the feature channel was halved. A same-padding hyperparameter was used to control the spatial size of the output. In the last layer, convolutional layers with core sizes of 1 × 1 produced 32-channel feature maps with the necessary number of categories using a sigmoid function as the neuronal activation function. The network had 23 floors total.
2.3.2. Training and Projecting
Here, 434 RGB images, of 4000 × 3000 pixels each, were obtained from the UAV data from the G1 plot. The canopies, flowers, and shadows from peach trees were considered in the labeled data. Nevertheless, only two categories required distinction, “peach tree” and “non-peach tree,” to represent the presence or absence of the trees. Deep neural networks typically perform better with more training data; models trained on small datasets are not well generalized and suffer from overfitting problems. Therefore, to increase the total number of training images, data expansion was performed. This was achieved by segmenting all 4000 × 3000 images into 160 × 160 patches, thereby transforming the 434 image pairs (image and respective label raster) into 9499 pairs. For the training dataset, 347 images from G1 were used, and the remaining 87 images were used for validation during training. Subsequently, the trained model was used to predict the data of the G2 and G3 plots. The model employed the Adam optimizer, with a momentum of 0.9 and a learning rate of 0.0001. Using binary cross-entropy as a loss function, the network was trained 35 times. The similarity was subsequently measured by the Jaccard coefficient [39]. All of the experiments were run using Keras 2.2.2 with TensorFlow 1.10.0 and Python 3.6, processing images with more libraries and a medium learning curve [40], and ArcGIS 10.6 for data processing and spatialization.
2.3.3. Evaluation Metrics
To evaluate the accuracy of the training and test sets, this study used two accuracy measures based on pixel statistics, namely the intersection-over-union (IoU) and Kappa coefficients. These coefficients are precision measures based on a confusion matrix, which summarizes the pixel values in an image according to two criteria that describe the performance of the classification model on a set of data, with the rows of the matrix representing the true value and the columns of the matrix representing the predicted values [41]. The confusion matrix for binary classification tasks is shown in Table 1.
The metrics used to evaluate performance in this study statistically include the overall accuracy, precision, recall, and F1 score. These indicators were calculated considering true positives (TPs), false positives (FPs), true negatives (TNs), and false negatives (FNs). For class l, TPs are the number of pixels correctly classified as l. FPs are the number of pixels misclassified as l, and FN denotes pixels that belong to l but are classified by the model as another class.
Precision and recall are commonly used to evaluate classification performance. However, these two indicators may contradict each other. Therefore, F1 is used for synthesis.
The Kappa coefficient, calculated based on a confusion matrix, is often used for consistency testing and can provide a more objective measure of classification accuracy than overall accuracy can. The Kappa coefficient is a value between −1 and 1 but is usually greater than 0.
where is the ratio of the number of the correctly classified samples to the total number of samples (i.e., the overall accuracy) and is the ratio of the sum of the products of the numbers of true and predicted pixels for each category to the square of the total number of samples.
In addition, to further evaluate the performance of the developed method, the intersection-over-union (IoU), which represents how close predictions are to the ground truth observations, was used. In Equation (8), A and B are two different data samples.
2.4. Estimating the Projected Area of Non-Grain Production
The non-grain production types in this study area are mainly peach trees. Therefore, the is calculated using peach trees as an example. Areas with peach flowers, branches, and shadows were extracted to identify the area covered by peach trees. The extraction used a single-pixel as the smallest unit, and the areas were the sum of the identified pixels, as follows:
where represents the area containing peach trees, represents the pixels of each peach tree, represents the set of the peach tree pixels.
To determine the actual occurrence of non-grain production in cultivated land, a non-grain production index was designed that quantifies the activity level of the non-grain production, which was the ratio of the area of identified peach trees to the total area of cultivated land. Levels of 30% [42], 50% [43], and 70% [11] were used to judge the severity of the non-grain production problem.
where represents the non-grain production index, represents the area of the peach trees, and represents the total area of the cultivated land in the sample. The four levels were as follows: (1) indicates the possibility of non-grain production; (2) indicates that non-grain production already exists and will likely continue to increase; (3) indicates that the non-grain production is relatively serious; and (4) indicates the non-grain production is very serious.
3. Results
3.1. The Identification of Peach Trees in Cultivated Land Using the U-Net Algorithm
The detailed results of the U-net identification of peach trees in the cultivated areas in the UAV images of the G1 plot are shown in Figure 4. The red line indicates the change in the U-net loss value for the training set in (Figure 4d). The loss value of the training set is opposite that of the accuracy trend. The increase in the Jaccard coefficient indicates that the accuracy of the training set improved. The initial loss value was 0.63; however, when the number of iterations reached 30, the minimum loss value of the model was 0.05, and the Jaccard coefficient was 0.88.
After the network training was completed, the precision, recall, F-measure, Kappa, and IoU were calculated using the test dataset (20% of G1 data) to evaluate the network’s performance. The validation results for the U-net-based peach tree identification are presented in Table 2.
3.2. Estimated the Peach Trees of Cultivated Land in Projecting Plots
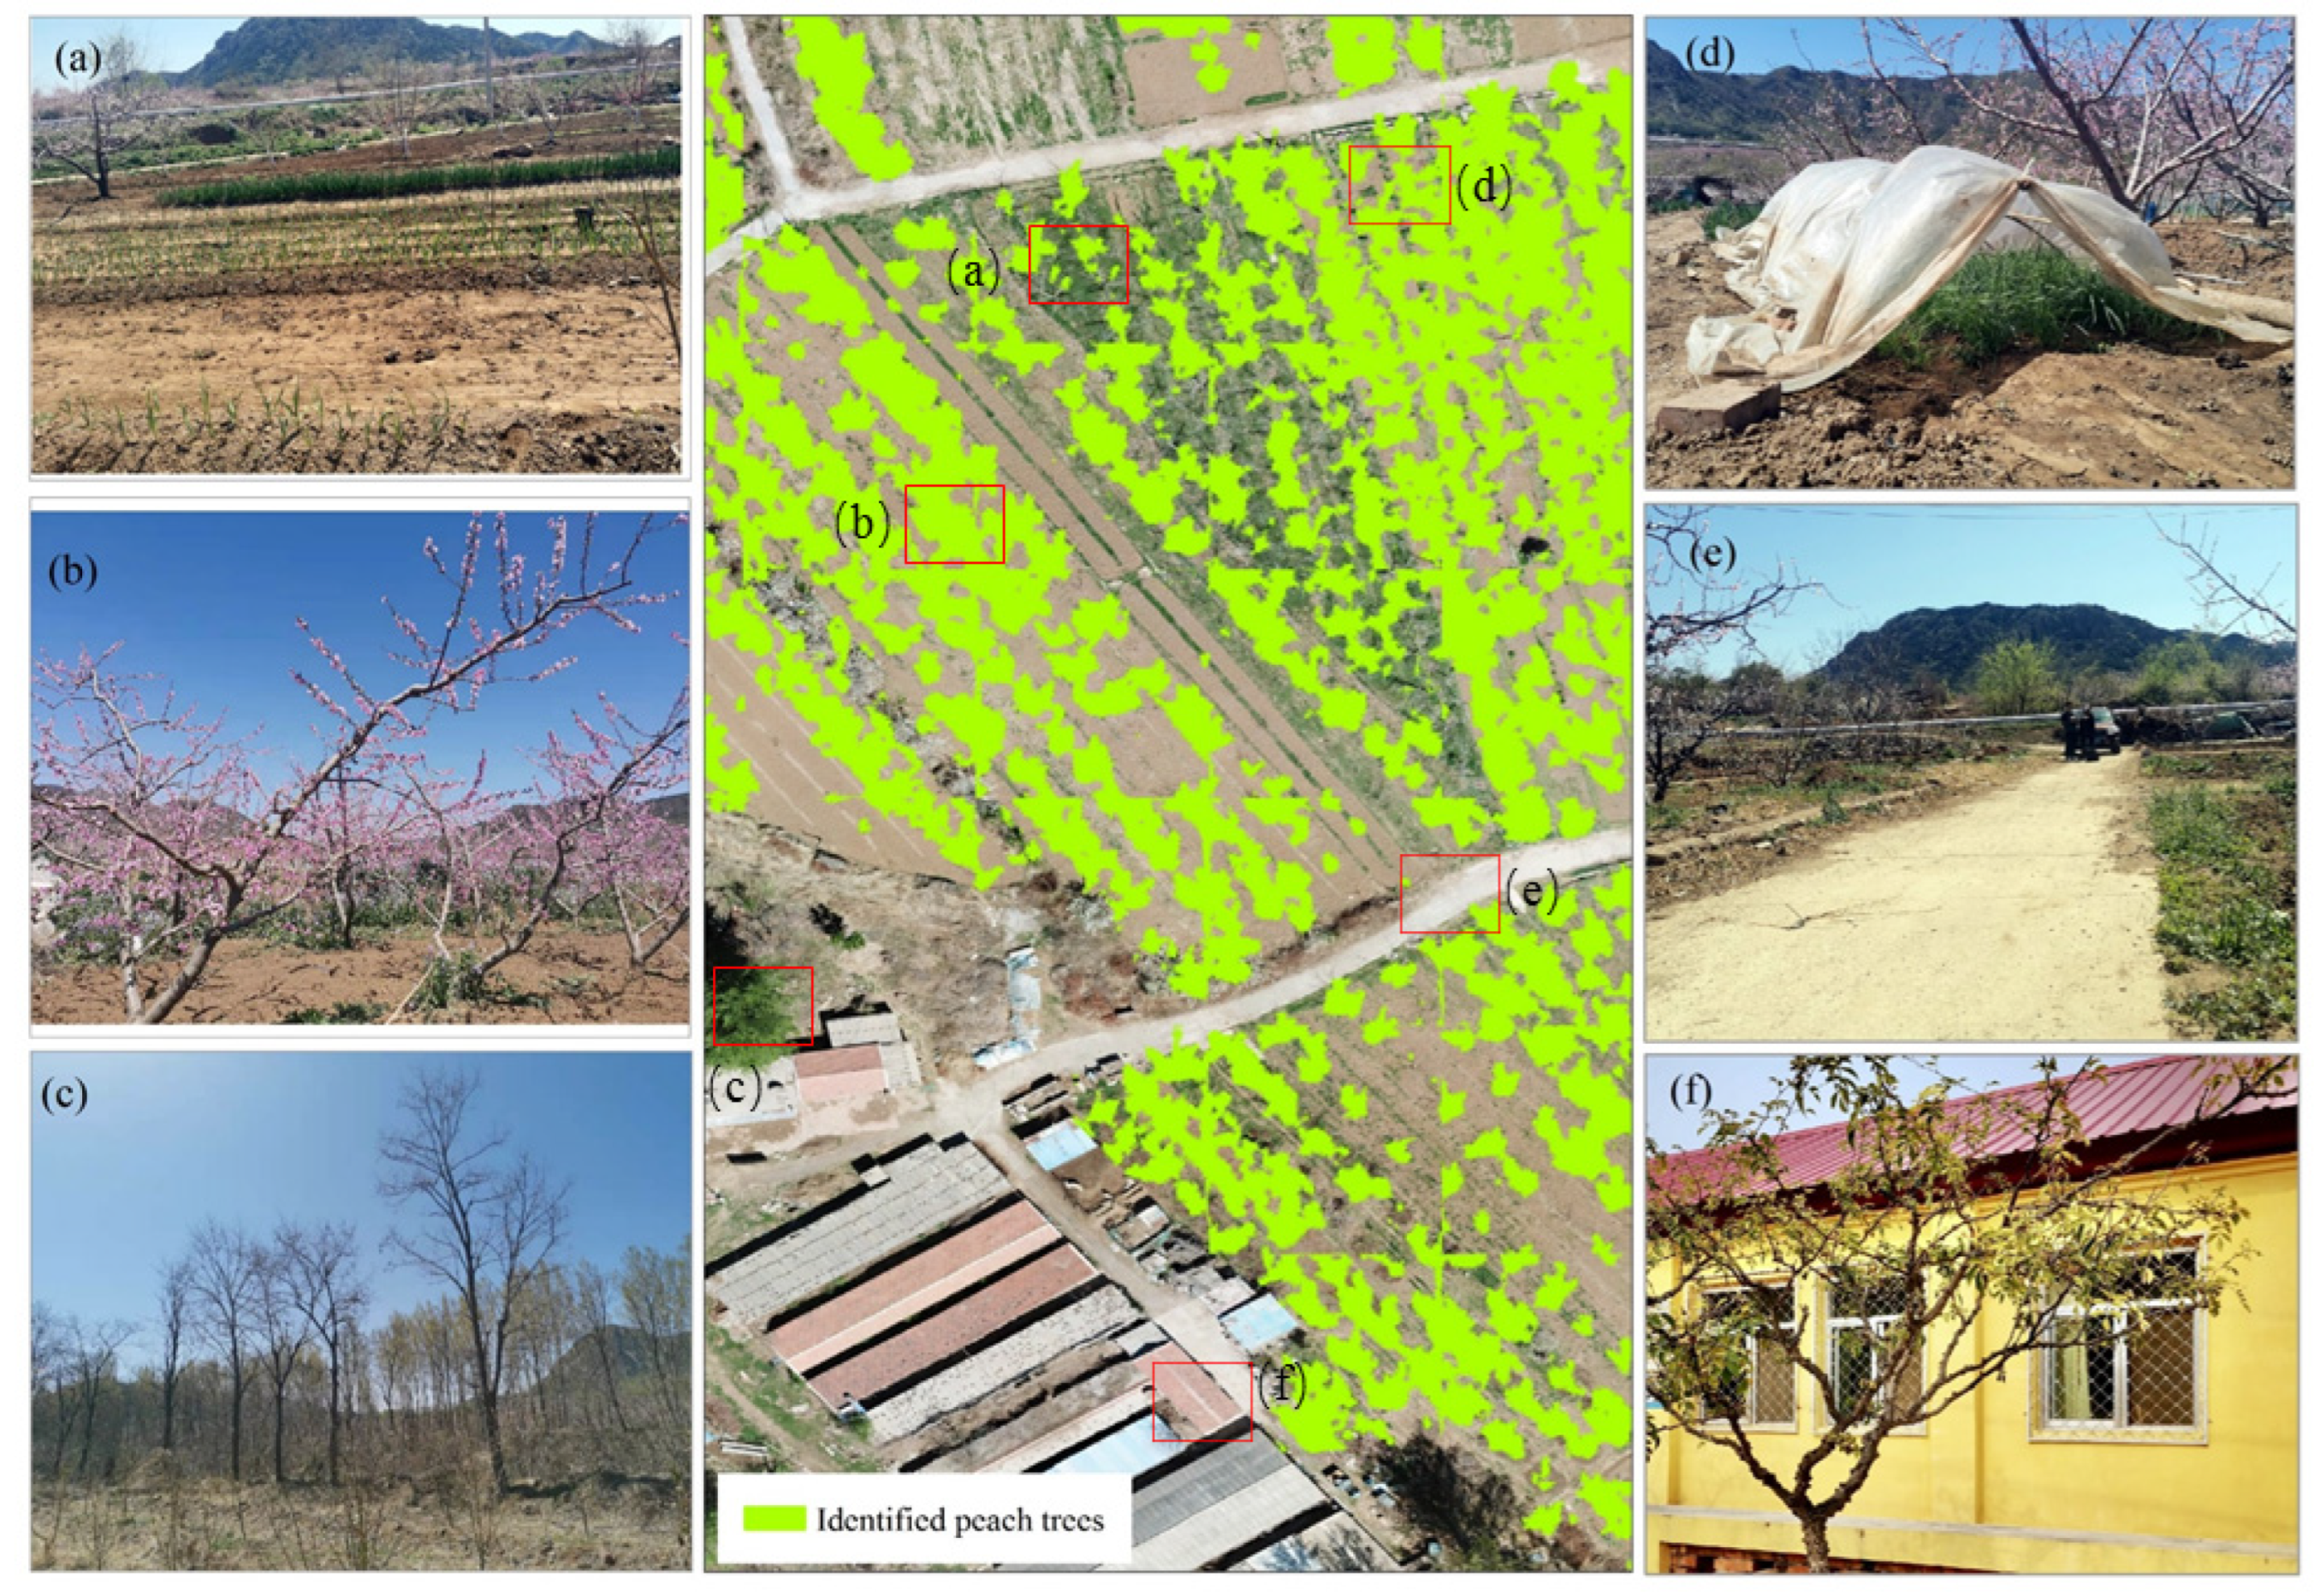
Figure 5 shows the estimated peach trees in cultivated land. We found that most cultivated land had been converted into peach trees. There was a clear separation between the peach and non-peach tree categories; notably, windbreak trees, homesteads, village roads, and vegetables were effectively classified as non-peach trees. Figure 6a shows that, due to the peach trees, the remaining space is relatively small and only supports small, scattered vegetable fields. In Figure 6c, the peach trees can be distinguished from farmland windbreaks, which demonstrates the performance of this method for identifying peach trees and economic forests in cultivated land.
Figure 5e,f shows that for the confusion matrix for the ground truth and U-net identified peach trees, the values are more significant in the diagonal line from the bottom left to the top right, which indicates that the U-net has accurate classifications and predictions. As shown in Table 3, the ground truth and U-net identification results were projected to investigate the area covered by peach trees. The final area was calculated based on the pixels containing peach trees. The ground truth area for peach trees in G2 and G3 were 32,770.40 m2 and 66,980.61 m2, respectively. The total areas of peach trees in these plots identified by the U-net algorithm were 28,491.20 m2 and 68,963.20 m2, respectively. Therefore, the accuracies for the U-net algorithm for G2 and G3 were 0.87 and 0.97, respectively. The non-grain production index was subsequently calculated using the total cultivated land area (excluding roads, windbreaks, and homesteads) and the projected area of peach trees. The non-grain production indices for G2 and G3 were 76.90% and 91.38%, respectively; therefore, the degree of non-grain production for both projected plots was severe.
4. Discussion
Non-grain production poses a potential emergent threat to grain production capacity and food security in China, owing to the dual driving forces of economy and policy. Planting economic forests, which have higher economic benefits, in place of traditional grain crops is one of the main non-grain production practices on cultivated land in Beijing [11]. Regarding non-grain production management, identifying non-grain production from other cultivated land remains challenging due to the similarities in spatial imagery between economic forests and grain crops. Thus, we used a UAV and the U-net deep learning algorithm to detect peach trees as an alternative to time-consuming and expensive field surveys. The overall accuracy for verification and prediction in this study was 0.90 and 0.92 (Table 2), this method of distinguishing peach trees based on pixels was different from extracting the same land cover type using different spectra, but the result is comparable with the overall accuracy of 92.81% achieved by Xu et al. [20]. Moreover, it is higher than the overall accuracy of 89.83% achieved by the original U-net. Reder et al. used the U-net algorithm for semantic segmentation and positioning of windthrown trees, with a maximum precision of 75.6% [44]. Such a label with the stem of the tree provides a reference for the selection of the characteristics of the forest trees. On this basis, this method combines the characteristics of the phenological period of economic forests. It was found that this new method can effectively solve the problem of difficulty in the visual interpretation of economic forests and grain crops. This provides an effective method for distinguishing economic forests and grain crops in the process of monitoring non-grain production and determining the expansion area of economic forests. Therefore, our study demonstrated the feasibility of using a combination of UAVs and the U-net algorithm to monitor non-grain production on cultivated land.
As shown in Figure 5, peach trees covered most of the cultivated land in the research area. Therefore, economic forests (in this case, peach trees) are replacing traditional crops (wheat and maize rotation) and decreasing grain production. According to statistical data, the fruit industry has become the main agricultural industry in the suburbs of Beijing. In the Pinggu District, most peach trees are planted on hillsides [45]. In recent years, owing to incentives from the peach industry, planted areas of peach trees have expanded from mountainous areas to cultivated land in the plains [46]. Moreover, peach trees have typical phenological characteristics, which meet the application requirements of this method for non-grain production monitoring. Therefore, our proposed method can support the agricultural management department in performing routine inspections for non-grain production cultivated land on the plains.
The scale of non-grain production is a key indicator for measuring the scope of the non-grain production problem. As noted in Table 3, the non-grain production indices were 76.90% and 91.38% for the test plots, indicating that non-grain production already existed and is very serious in the surveyed region [11,47]. Combined with the U-net algorithm, the non-grain production index can intuitively utilize spatial information and express the non-grain production problem quantitatively. Therefore, the non-grain production index can provide a new quantitative method for this issue.
The remote sensing identification of economic forests and windbreaks has been a challenge for a long time. Confusion often occurs even in visual interpretation. The flowering phenological period of economic forests is an important feature that helps to distinguish them from windbreaks, pond fish farms, and vegetable greenhouses. In this study, the canopy, flowers, and shadows of the flowering period were taken as the image labels. Furthermore, our model can effectively distinguish economic forests from other land types, such as greenhouses, windbreaks, and vegetables, with validation and prediction accuracies of 0.91 and 0.90, respectively (Figure 6). U-net is among the most popular algorithms in land use/land cover (LULC) research, which combines several benchmark data sets to achieve state-of-the-art performance based on spectral and spatial information with limited training data [48,49]. Furthermore, our results indicated that pixel-based U-net might be suitable for precisely identifying economic forests and windbreaks, which warrants further large-scale research and validation. Moreover, the application of the pixel-based U-net to different densities of grassland, shrubs, and sparse forests, which are more confusing land-use types, is still limited to an extent. The algorithm combined with phenology in our study may provide a new way of thinking, but the appropriate method needs further exploration.
Although the proposed model was shown to be accurate and efficient, it does have limitations. The main limitation is that the endurance of the UAV has always been the biggest obstacle to the observation efficiency of the UAV, and it is also an important limiting factor for UAVs to expand the scope of non-grain production monitoring. At present, the average flight time of electric fixed wings is approximately 1 h, and the flight time is also affected by the weight of the sensors, constrained by other factors such as temperature and pressure; it can only be used for township-level surveys. However, for regional and large-scale investigations, technological progress in UAV endurance capability is required in combination with satellite technology. To improve the robustness of the model, we will further obtain data from more different locations within the flowering period and then build a dataset to explore the improvement of the model with data from more locations within the same phenological period. Furthermore, adding data from other phenological periods makes it suitable for the model. In addition, although the non-grain production index can quantitatively analyze the degree of non-grain production in cultivated land, it should be combined with other factors, such as regional differences, food production, and farmer income, thereby properly adjusting the non-grain production index to solve appropriate practical problems in subsequent applications.
5. Conclusions
Non-grain production in cultivated land has expanded quickly owing to economic and policy incentives and should be treated as an emerging potential threat to grain security in China. Non-grain production results in a reduction in cultivated land area and total grain production, as well as the destruction of cultivated land quality. In this study, we proposed and verified an identification method using a UAV and U-net algorithm to identify easily misattributed peach trees in cultivated land. The overall accuracies of verification and prediction for this method were 0.90 and 0.92, respectively. Additionally, a non-grain production index was developed to assess the degree of non-grain production in evaluation plots, which had values of 76.90% and 91.38%, indicating a severe degree of non-grain production. When the non-grain production area is more than 30%, it means that the problem of non-grain production already exists. Under long-term monitoring, the agricultural management department needs to formulate a plan for management in time according to the actual situation. The identification method and non-grain production index could provide efficient tools for agricultural management to perform routine inspections for non-grain production in cultivated land, thereby replacing field measurements to achieve significant labor savings. Furthermore, this method can provide a reference for creating high-standard farmland, sustainable development of cultivated land, and policymaking.
Author Contributions
Conceptualization, X.Z. and Q.L.; methodology, X.Z.; software, Q.L.; validation, X.Z. and Q.L.; formal analysis, Q.L.; investigation, X.Z. and Q.L.; resources, Q.L.; data curation, X.Z.; writing—original draft preparation, Q.L.; writing—review and editing, X.Z.; visualization, Q.L.; supervision, X.Z.; project administration, X.Z. and Q.L.; funding acquisition, X.Z. and Q.L. All authors have read and agreed to the published version of the manuscript.
Funding
National Key R&D Program of China (No. 2019YFA0607403 and No.2021xjkk0903), Central Public-interest Scientific Institution Basal Research Fund (No. Y2020PT05 and No. BSRF201901), and the Strategic Priority Research Program of Chinese Academy of Sciences (XDA20010302).
Institutional Review Board Statement
Not applicable.
Informed Consent Statement
Not applicable.
Data Availability Statement
The underlying data are available from the corresponding author upon reasonable request.
Acknowledgments
We would like to thank the reviewers for their thoughtful comments that helped improve the quality of this work.
Conflicts of Interest
The authors declare no conflict of interest.
References
- Bren D Amour, C.; Reitsma, F.; Baiocchi, G.; Barthel, S.; Güneralp, B.; Erb, K.; Haberl, H.; Creutzig, F.; Seto, K.C. Future urban land expansion and implications for global croplands. Proc. Natl. Acad. Sci. USA 2017, 114, 8939–8944. [Google Scholar] [CrossRef] [Green Version]
- Linner, H.; Messing, I. Agricultural land needs protection. Acta Agric. Scand. Sect. B Soil Plant Sci. 2012, 62, 706–710. [Google Scholar] [CrossRef]
- Grassini, P.; Eskridge, K.M.; Cassman, K.G. Distinguishing between yield advances and yield plateaus in historical crop production trends. Nat. Commun. 2013, 4, 2918. [Google Scholar] [CrossRef]
- Huang, Z.; Peng, Y. The confluence of three historical trends and the prospects for small-scale agriculture in China. Soc. Sci. China 2007, 74–88. Available online: https://kns.cnki.net/kcms/detail/detail.aspx?dbcode=CJFD&dbname=CJFD2007&filename=ZSHK200704006&uniplatform=NZKPT&v=eBciBBq5wWyaAOf8kbwSgo6jrkd8M-jCLcqTDmvTjiYuD0nZbsjcWGUQ6BKEd3fN (accessed on 27 May 2022).
- Huan, H.; Sun, J. Grey Correlation analysis of cultivated land conversion and its driving factors in central China A Case Study of Fuyang City, Anhui Province. Bull. Soil Water Conserv. 2012, 32, 82–88. [Google Scholar]
- Sun, Y.; Chang, Y.; Liu, J.; Ge, X.; Liu, G.; Chen, F. Spatial Differentiation of Non-Grain Production on Cultivated Land and Its Driving Factors in Coastal China. Sustainability 2021, 13, 13064. [Google Scholar] [CrossRef]
- Yang, Q.; Zhang, D. The influence of agricultural industrial policy on non-grain production of cultivated land: A case study of the “one village, one product” strategy implemented in Guanzhong Plain of China. Land Use Policy 2021, 108, 105579. [Google Scholar] [CrossRef]
- Liu, J.; Wang, X.; Wang, T. Classification of tree species and stock volume estimation in ground forest images using Deep Learning. Comput. Electron. Agric. 2019, 166, 105012. [Google Scholar] [CrossRef]
- Su, Y.; Li, C.; Wang, K.; Deng, J.; Shahtahmassebi, A.R.; Zhang, L.; Ao, W.; Guan, T.; Pan, Y.; Gan, M. Quantifying the spatiotemporal dynamics and multi-aspect performance of non-grain production during 2000–2015 at a fine scale. Ecol. Indic. 2019, 101, 410–419. [Google Scholar] [CrossRef]
- Li, W.; Feng, T.; Hao, J. The evolving concepts of land administration in China: Cultivated land protection perspective. Land Use Policy 2009, 26, 262–272. [Google Scholar] [CrossRef]
- Wang, Y.; Chen, Y.; Yi, X.; Xiao, B. The Non-grain problem in the progress of land transfer and the countermeasures. Chin. J. Agric. Resour. Reg. Plan. 2011, 32, 13–16. [Google Scholar]
- Van Vliet, J.; De Groot, H.L.F.; Rietveld, P.; Verburg, P.H. Manifestations and underlying drivers of agricultural land use change in Europe. Landsc. Urban Plan. 2015, 133, 24–36. [Google Scholar] [CrossRef] [Green Version]
- Acharya, N.; Das, S. Revitalising Agriculture in Eastern India: Investment and Policy Priorities. IDS Bull. 2012, 43, 104–112. [Google Scholar] [CrossRef] [Green Version]
- Souza Piao, R.; Silva, V.L.; Navarro Del Aguila, I.; de Burgos Jiménez, J. Green Growth and Agriculture in Brazil. Sustainability 2021, 13, 1162. [Google Scholar] [CrossRef]
- Xiao, R.; Su, S.; Mai, G.; Zhang, Z.; Yang, C. Quantifying determinants of cash crop expansion and their relative effects using logistic regression modeling and variance partitioning. Int. J. Appl. Earth Obs. 2015, 34, 258–263. [Google Scholar] [CrossRef]
- Li, Y.; Zhao, B.; Huang, A.; Xiong, B.; Song, C. Characteristics and Driving Forces of Non-Grain Production of Cultivated Land from the Perspective of Food Security. Sustainability 2021, 13, 14047. [Google Scholar] [CrossRef]
- Cai, L.; Wang, H.; Liu, Y.; Fan, D.; Li, X. Is potential cultivated land expanding or shrinking in the dryland of China? Spatiotemporal evaluation based on remote sensing and SVM. Land Use Policy 2022, 112, 105871. [Google Scholar] [CrossRef]
- Kamilaris, A.; Prenafeta-Boldú, F.X. Deep learning in agriculture: A survey. Comput. Electron. Agric. 2018, 147, 70–90. [Google Scholar] [CrossRef] [Green Version]
- Ramezan, C.A.; Warner, T.A.; Maxwell, A.E.; Price, B.S. Effects of Training Set Size on Supervised Machine-Learning Land-Cover Classification of Large-Area High-Resolution Remotely Sensed Data. Remote Sens. 2021, 13, 368. [Google Scholar] [CrossRef]
- Xu, W.; Deng, X.; Guo, S.; Chen, J.; Sun, L.; Zheng, X.; Xiong, Y.; Shen, Y.; Wang, X. High-Resolution U-Net: Preserving Image Details for Cultivated Land Extraction. Sensors 2020, 20, 4064. [Google Scholar] [CrossRef]
- Liu, Z.; Yang, P.; Wu, W.; You, L. Spatiotemporal changes of cropping structure in China during 1980–2011. J. Geogr. Sci. 2018, 28, 1659–1671. [Google Scholar] [CrossRef] [Green Version]
- Zhang, O.; Jiang, C. Analysis on differences of “non-grain” of different types farmers in transfer in farmland. Financ. Trade Res. 2016, 27, 24–31.15. [Google Scholar]
- Reza Ghafarian Malamiri, H.; Arabi Aliabad, F.; Shojaei, S.; Morad, M.; Band, S.S. A study on the use of UAV images to improve the separation accuracy of agricultural land areas. Comput. Electron. Agric. 2021, 184, 106079. [Google Scholar] [CrossRef]
- Su, Y.; Qian, K.; Lin, L.; Wang, K.; Guan, T.; Gan, M. Identifying the driving forces of non-grain production expansion in rural China and its implications for policies on cultivated land protection. Land Use Policy 2020, 92, 104435. [Google Scholar] [CrossRef]
- Chen, W.; Xu, Y.; Zhang, Z.; Yang, L.; Pan, X.; Jia, Z. Mapping agricultural plastic greenhouses using Google Earth images and deep learning. Comput. Electron. Agric. 2021, 191, 106552. [Google Scholar] [CrossRef]
- Chen, S.; Liu, Q.; Chen, L.; Li, J.; Li, Q. Review of research advances in remote sensing monitoring of grain crop area. Trans. Chin. Soc. Agric. Eng. 2005, 06, 166–171. [Google Scholar]
- Yin, P.; Fang, X. Assessment on Vulnerable Regions of Food Security in China. Acta Geogr. Sin. 2008, 10, 1064–1072. [Google Scholar]
- Ozdogan, M.; Yang, Y.; Allez, G.; Cervantes, C. Remote Sensing of Irrigated Agriculture: Opportunities and Challenges. Remote Sens. 2010, 2, 2274–2304. [Google Scholar] [CrossRef] [Green Version]
- Wei, X.M.; Chen, B.; Qu, Y.H.; Lin, C.; Chen, G.Q. Emergy analysis for ‘Four in One’ peach production system in Beijing. Commun. Nonlinear Sci. 2009, 14, 946–958. [Google Scholar] [CrossRef]
- Chen, Y.; Hu, S.; Guo, Z.; Cui, T.; Zhang, L.; Lu, C.; Yu, Y.; Luo, Z.; Fu, H.; Jin, Y. Effect of balanced nutrient fertilizer: A case study in Pinggu District, Beijing, China. Sci. Total Environ. 2021, 754, 142069. [Google Scholar] [CrossRef]
- Wang, L.; Zhang, F.; Gao, L. Characteristics of soil nutrients in solar greenhouse in Beijing suburb. J. China Agric. Univ. 2003, 62–66. [Google Scholar] [CrossRef]
- Guo, Y.; Fu, Y.H.; Chen, S.; Robin Bryant, C.; Li, X.; Senthilnath, J.; Sun, H.; Wang, S.; Wu, Z.; de Beurs, K. Integrating spectral and textural information for identifying the tasseling date of summer maize using UAV based RGB images. Int. J. Appl. Earth Obs. 2021, 102, 102435. [Google Scholar] [CrossRef]
- Wu, J.; Liu, H.; Zhang, J. Paddy planting acreage estimation in city level based on UAV images and object-oriented classification method. Trans. Chin. Soc. Agric. Eng. 2018, 34, 70–77. [Google Scholar]
- Shafiee, S.; Lied, L.M.; Burud, I.; Dieseth, J.A.; Alsheikh, M.; Lillemo, M. Sequential forward selection and support vector regression in comparison to LASSO regression for spring wheat yield prediction based on UAV imagery. Comput. Electron. Agric. 2021, 183, 106036. [Google Scholar] [CrossRef]
- Ma, L.; Cheng, L.; Li, M.; Liu, Y.; Ma, X. Training set size, scale, and features in Geographic Object-Based Image Analysis of very high resolution unmanned aerial vehicle imagery. ISPRS J. Photogramm. 2015, 102, 14–27. [Google Scholar] [CrossRef]
- Koc-San, D.; Selim, S.; Aslan, N.; San, B.T. Automatic citrus tree extraction from UAV images and digital surface models using circular Hough transform. Comput. Electron. Agric. 2018, 150, 289–301. [Google Scholar] [CrossRef]
- Ronneberger, O.; Fischer, P.; Brox, T. U-Net: Convolutional Networks for Biomedical Image Segmentation. In Proceedings of the Medical Image Computing and Computer-Assisted Intervention-MICCAI 2015, Munich, Germany, 5–9 October 2015; Navab, N., Hornegger, J., Wells, W.M., Frangi, A.F., Eds.; Springer International Publishing: Cham, Switzerland, 2015; pp. 234–241. [Google Scholar] [CrossRef] [Green Version]
- Zunair, H.; Ben, H.A. Sharp U-Net: Depthwise convolutional network for biomedical image segmentation. Comput. Biol. Med. 2021, 136, 104699. [Google Scholar] [CrossRef]
- Rahman, M.; Hassan, M.R.; Buyya, R. Jaccard Index based availability prediction in enterprise grids. Procedia Comput. Sci. 2010, 1, 2707–2716. [Google Scholar] [CrossRef] [Green Version]
- Stancin, I.; Jovic, A. An Overview and Comparison of Free Python Libraries for Data Mining and Big Data Analysis; Croatian Society MIPRO: Rijeka, Croatia, 2019; pp. 977–982. [Google Scholar] [CrossRef]
- Xi, X.; Xia, K.; Yang, Y.; Du, X.; Feng, H. Evaluation of dimensionality reduction methods for individual tree crown delineation using instance segmentation network and UAV multispectral imagery in urban forest. Comput. Electron. Agric. 2021, 191, 106506. [Google Scholar] [CrossRef]
- Yang, R.; Chen, Y.; Yi, X.; Fang, L. The Causes and countermeasures of excessive "non-grain" tendency in cultivated land transfer. Chin. J. Agric. Resour. Reg. Plan. 2012, 33, 14–17. [Google Scholar]
- Nie, L.; Ning, T.; Chen, C.; Wang, F.; Li, Z.; Guo, L.; Zhao, H. The impact of land transfer on food security and countermeasures. J. Shandong Agric. Univ. (Soc. Sci. Ed.) 2013, 15, 65–70. [Google Scholar]
- Reder, S.; Mund, J.; Albert, N.; Waßermann, L.; Miranda, L. Detection of Windthrown Tree Stems on UAV-Orthomosaics Using U-Net Convolutional Networks. Remote Sens. 2022, 14, 75. [Google Scholar] [CrossRef]
- Song, C. Current situation of tertiary forestry industry in Beijing. J. Chin. Urban For. 2014, 12, 17–20. [Google Scholar]
- Cai, T.; Feng, X.; Wang, J. Investigation and analysis of peach production in Pinggu District, Beijing. Mod. Agric. Sci. Technol. 2020, 48–49. [Google Scholar]
- Wu, Y.; Zhang, P.; Yu, Y.; Xie, R. Progress Review on and Prospects for Non-grain Cultivated Land in China from the Perspective of Food Security. China Land Sci. 2021, 35, 116–124. [Google Scholar]
- Solórzano, J.V.; Mas, J.F.; Gao, Y.; Gallardo-Cruz, J.A. Land Use Land Cover Classification with U-Net: Advantages of Combining Sentinel-1 and Sentinel-2 Imagery. Remote Sens. 2021, 13, 3600. [Google Scholar] [CrossRef]
- Zhu, Y.; Geis, C.; So, E.; Jin, Y. Multitemporal Relearning with Convolutional LSTM Models for Land Use Classification. IEEE J. Sel. Top. Appl. Earth Obs. Remote Sens. 2021, 14, 3251–3265. [Google Scholar] [CrossRef]
Figure 1.
Non-grain production in cultivated land. (a,b) are cultivated land with crops and vegetables, (c,d) are economic forests, (e,f) are greenhouse farms, and (g,h) are pond fish farms. Pond fish farms and greenhouse farms are easy to distinguish, whereas economic forests are easily confused with cultivated cropland.

Figure 2.
(a) Overview of the Pinggu District in Beijing, China; (b) study areas in the Pinggu district; and (c) a Gaofen-2 image of the study area and field plots, including the training plot (G1) and prediction plots (G2 and G3).
Figure 2.
(a) Overview of the Pinggu District in Beijing, China; (b) study areas in the Pinggu district; and (c) a Gaofen-2 image of the study area and field plots, including the training plot (G1) and prediction plots (G2 and G3).
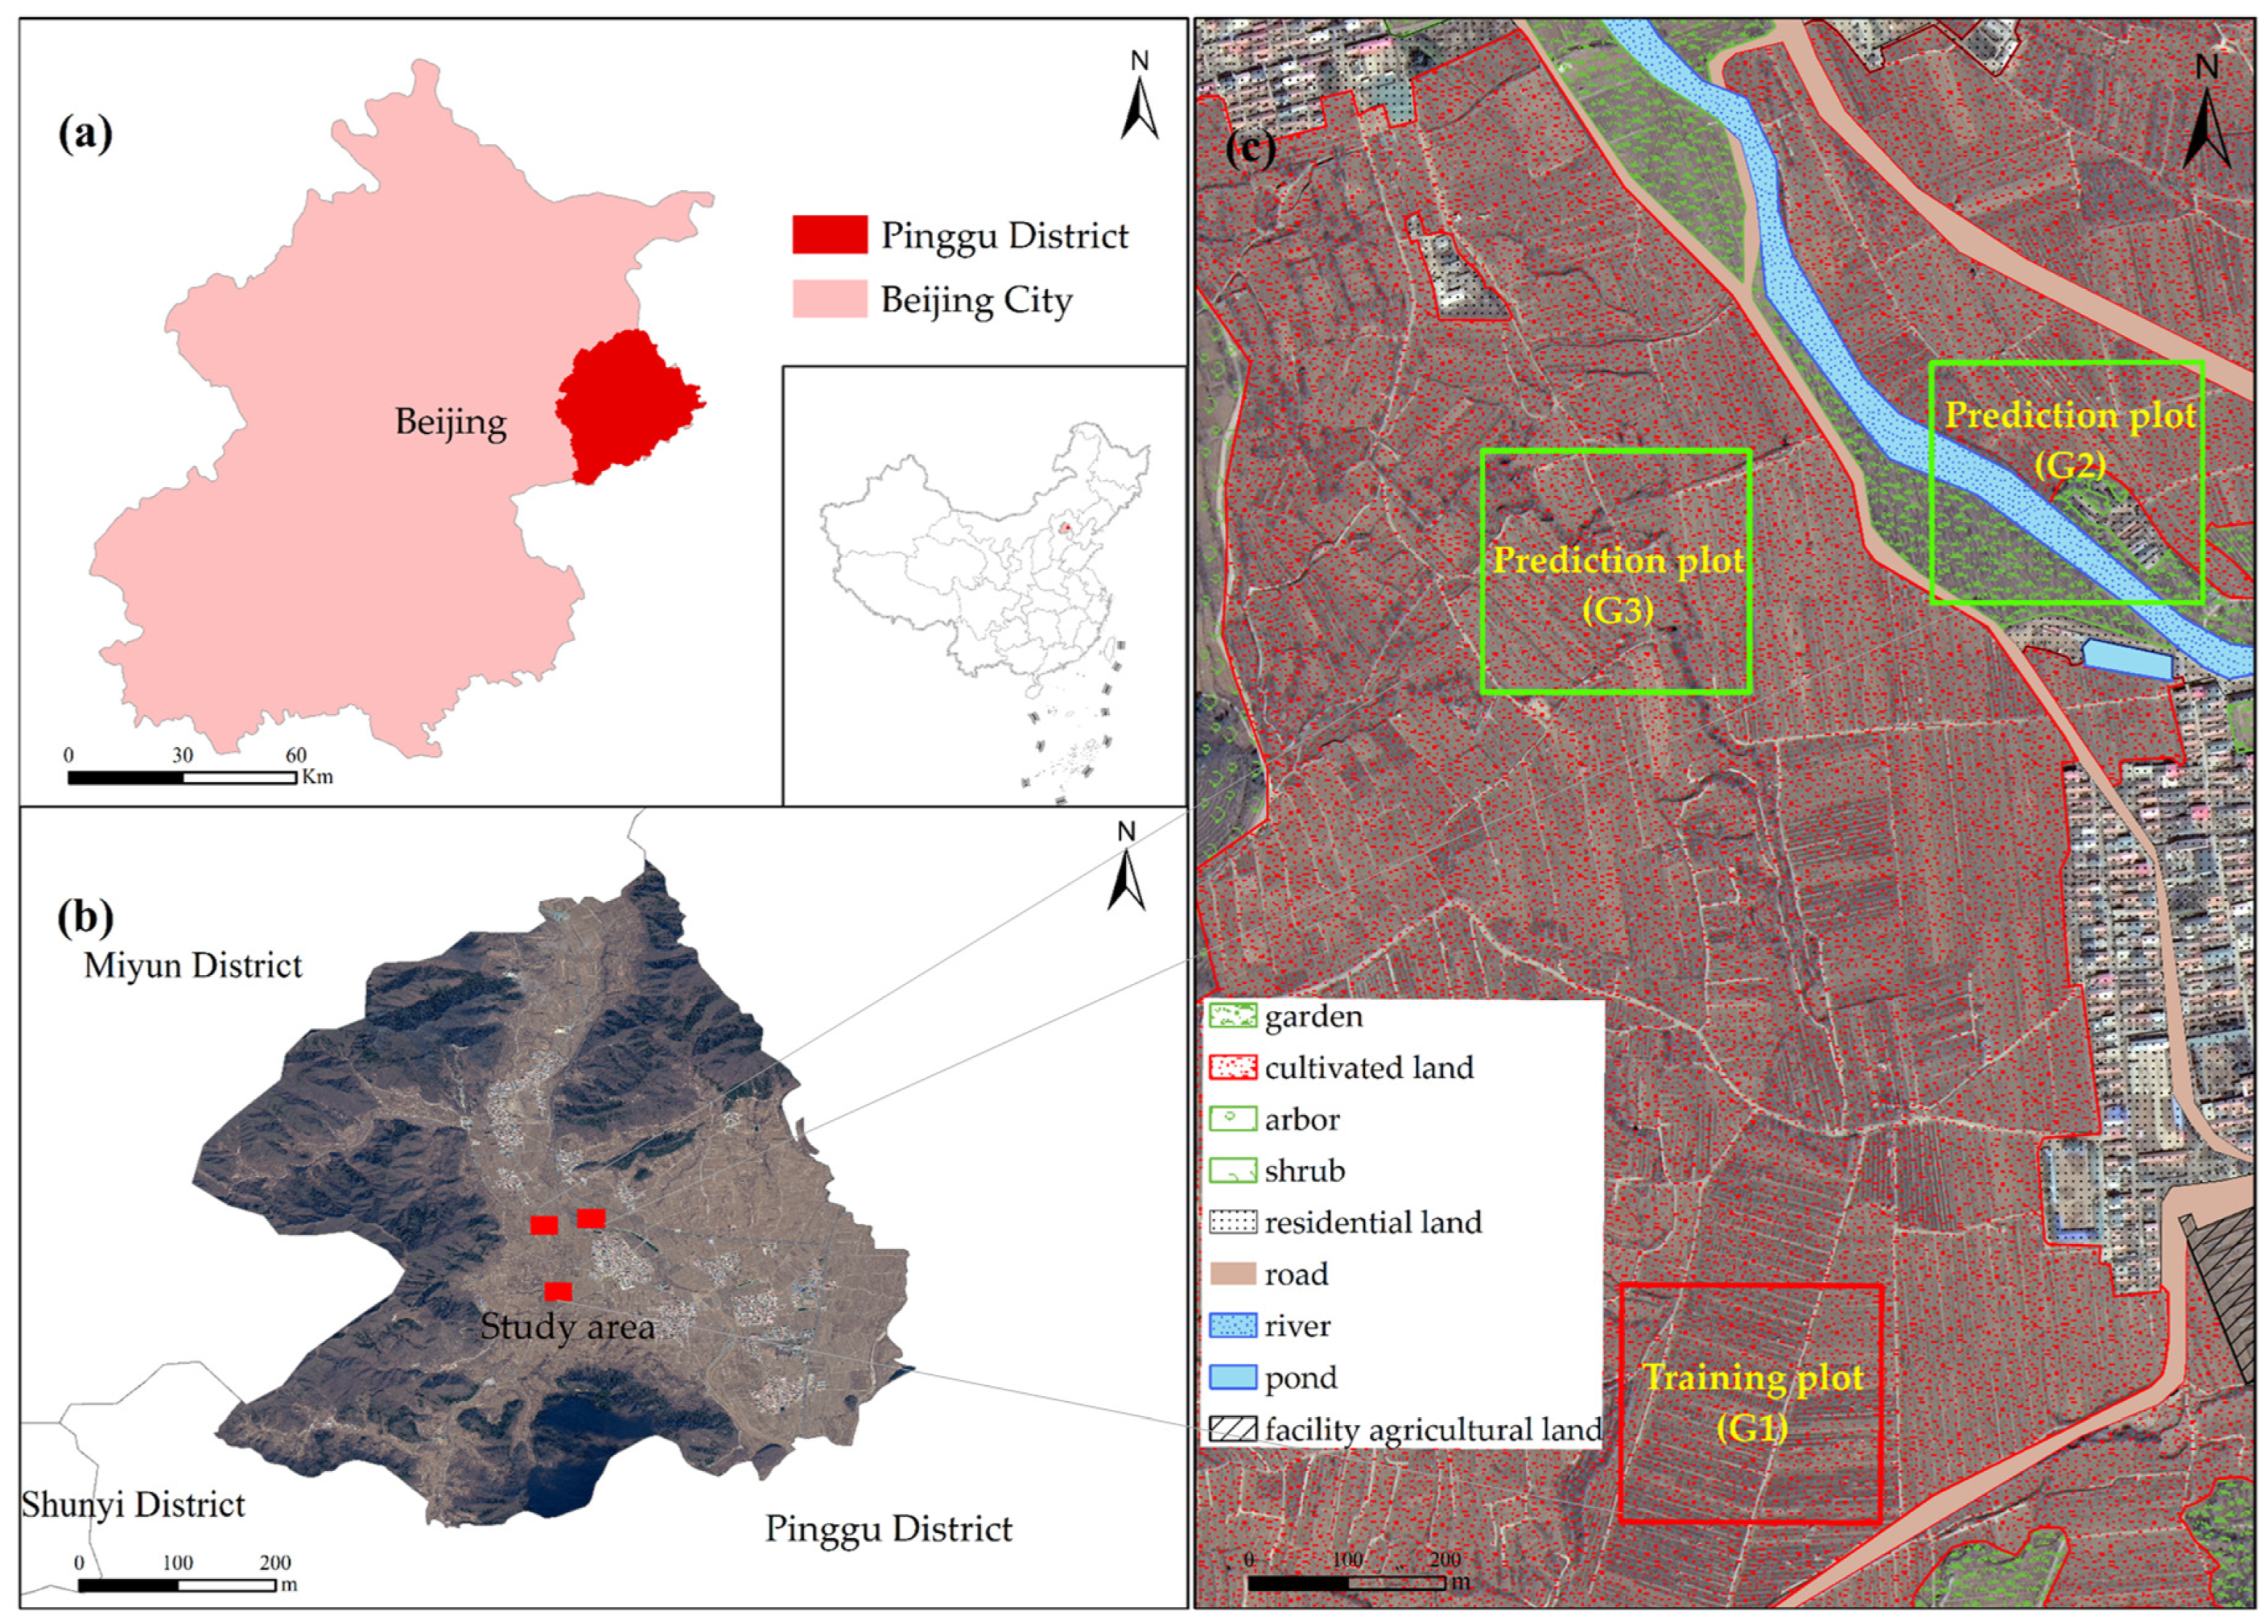
Figure 3.
U-net architecture. Each blue box corresponds to a multi-channel feature map. The number of channels is indicated at the top of the box. X-y dimensions are provided on the lower-left edge of the box. The white box represents the replicated feature mapping. Arrows indicate different operations. ReLU indicates rectified linear units, and BN indicates a batch normalization layer.
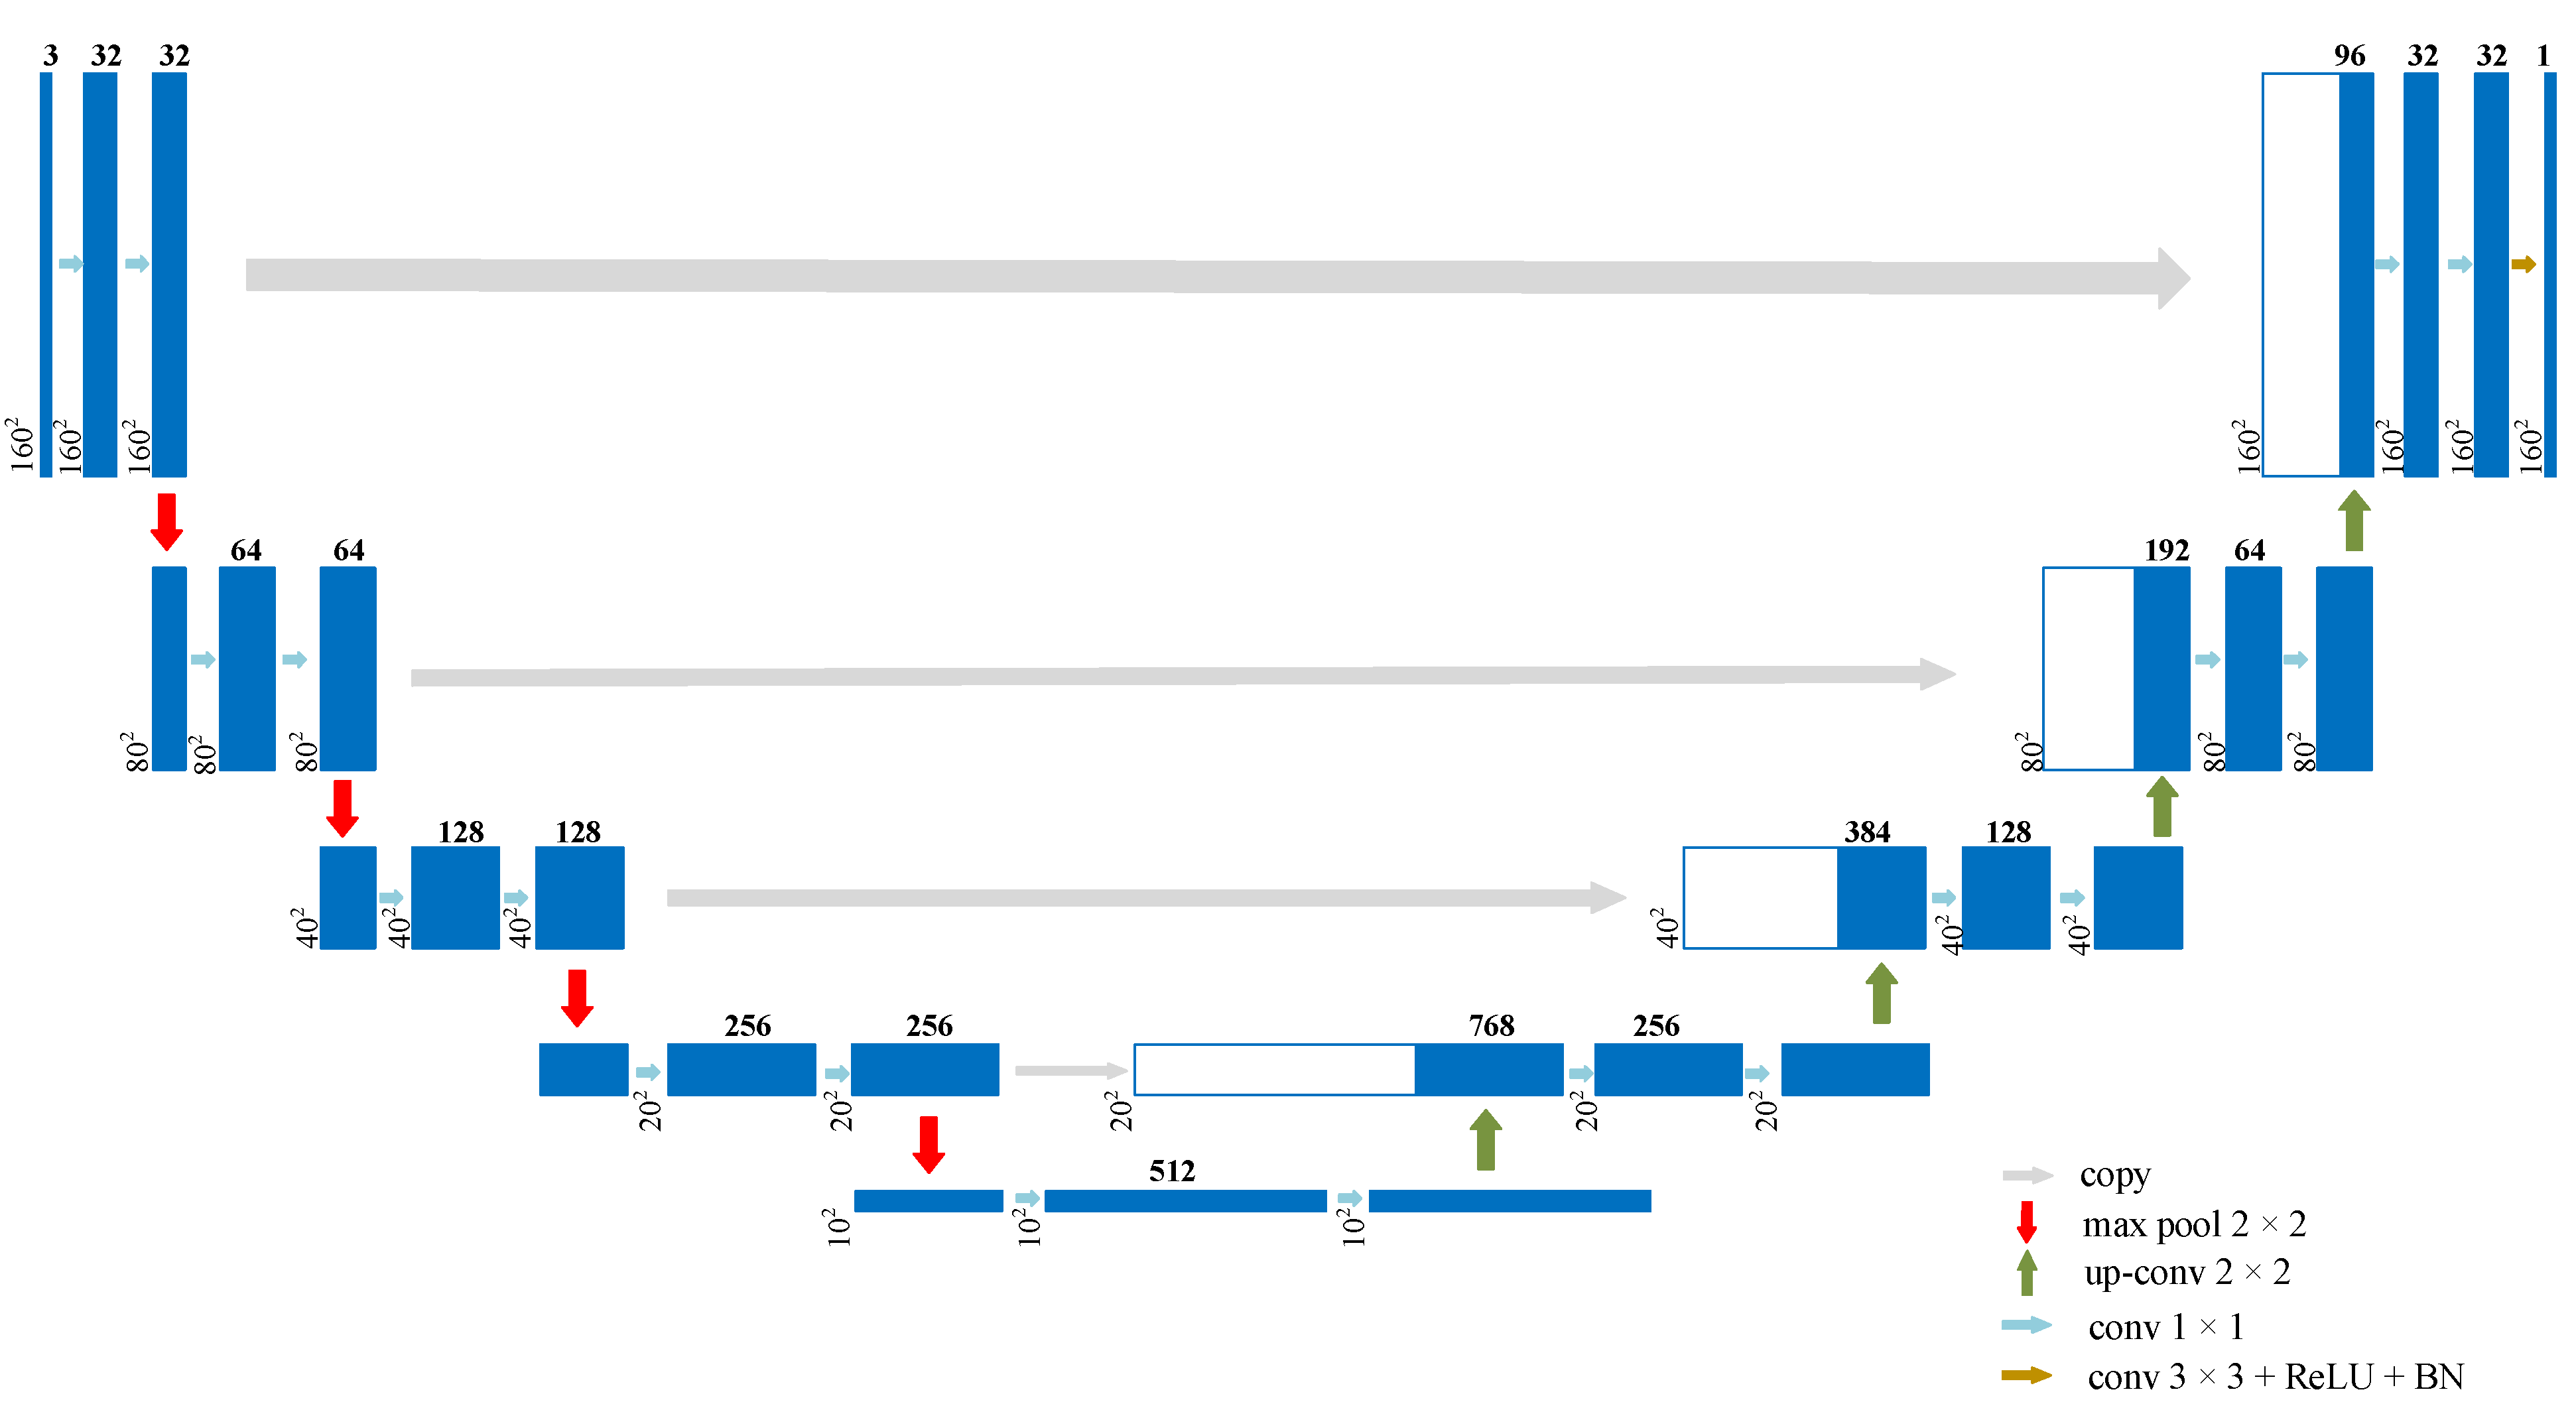
Figure 4.
Comparison of the unmanned aerial vehicle (UAV) images, ground truth, and U-net algorithm recognition results for the G1 plot. (a) UAV red, green, and blue wavelength images, (b) corresponding ground truth images (yellow for peach trees and white for other areas), and (c) results identified by the U-net algorithm (green for peach trees and white for other areas). (d) Plot showing the accuracy and loss value changes for the training set with increased iterations. The Jaccard coefficient is the blue curve, and the loss value is the red curve.
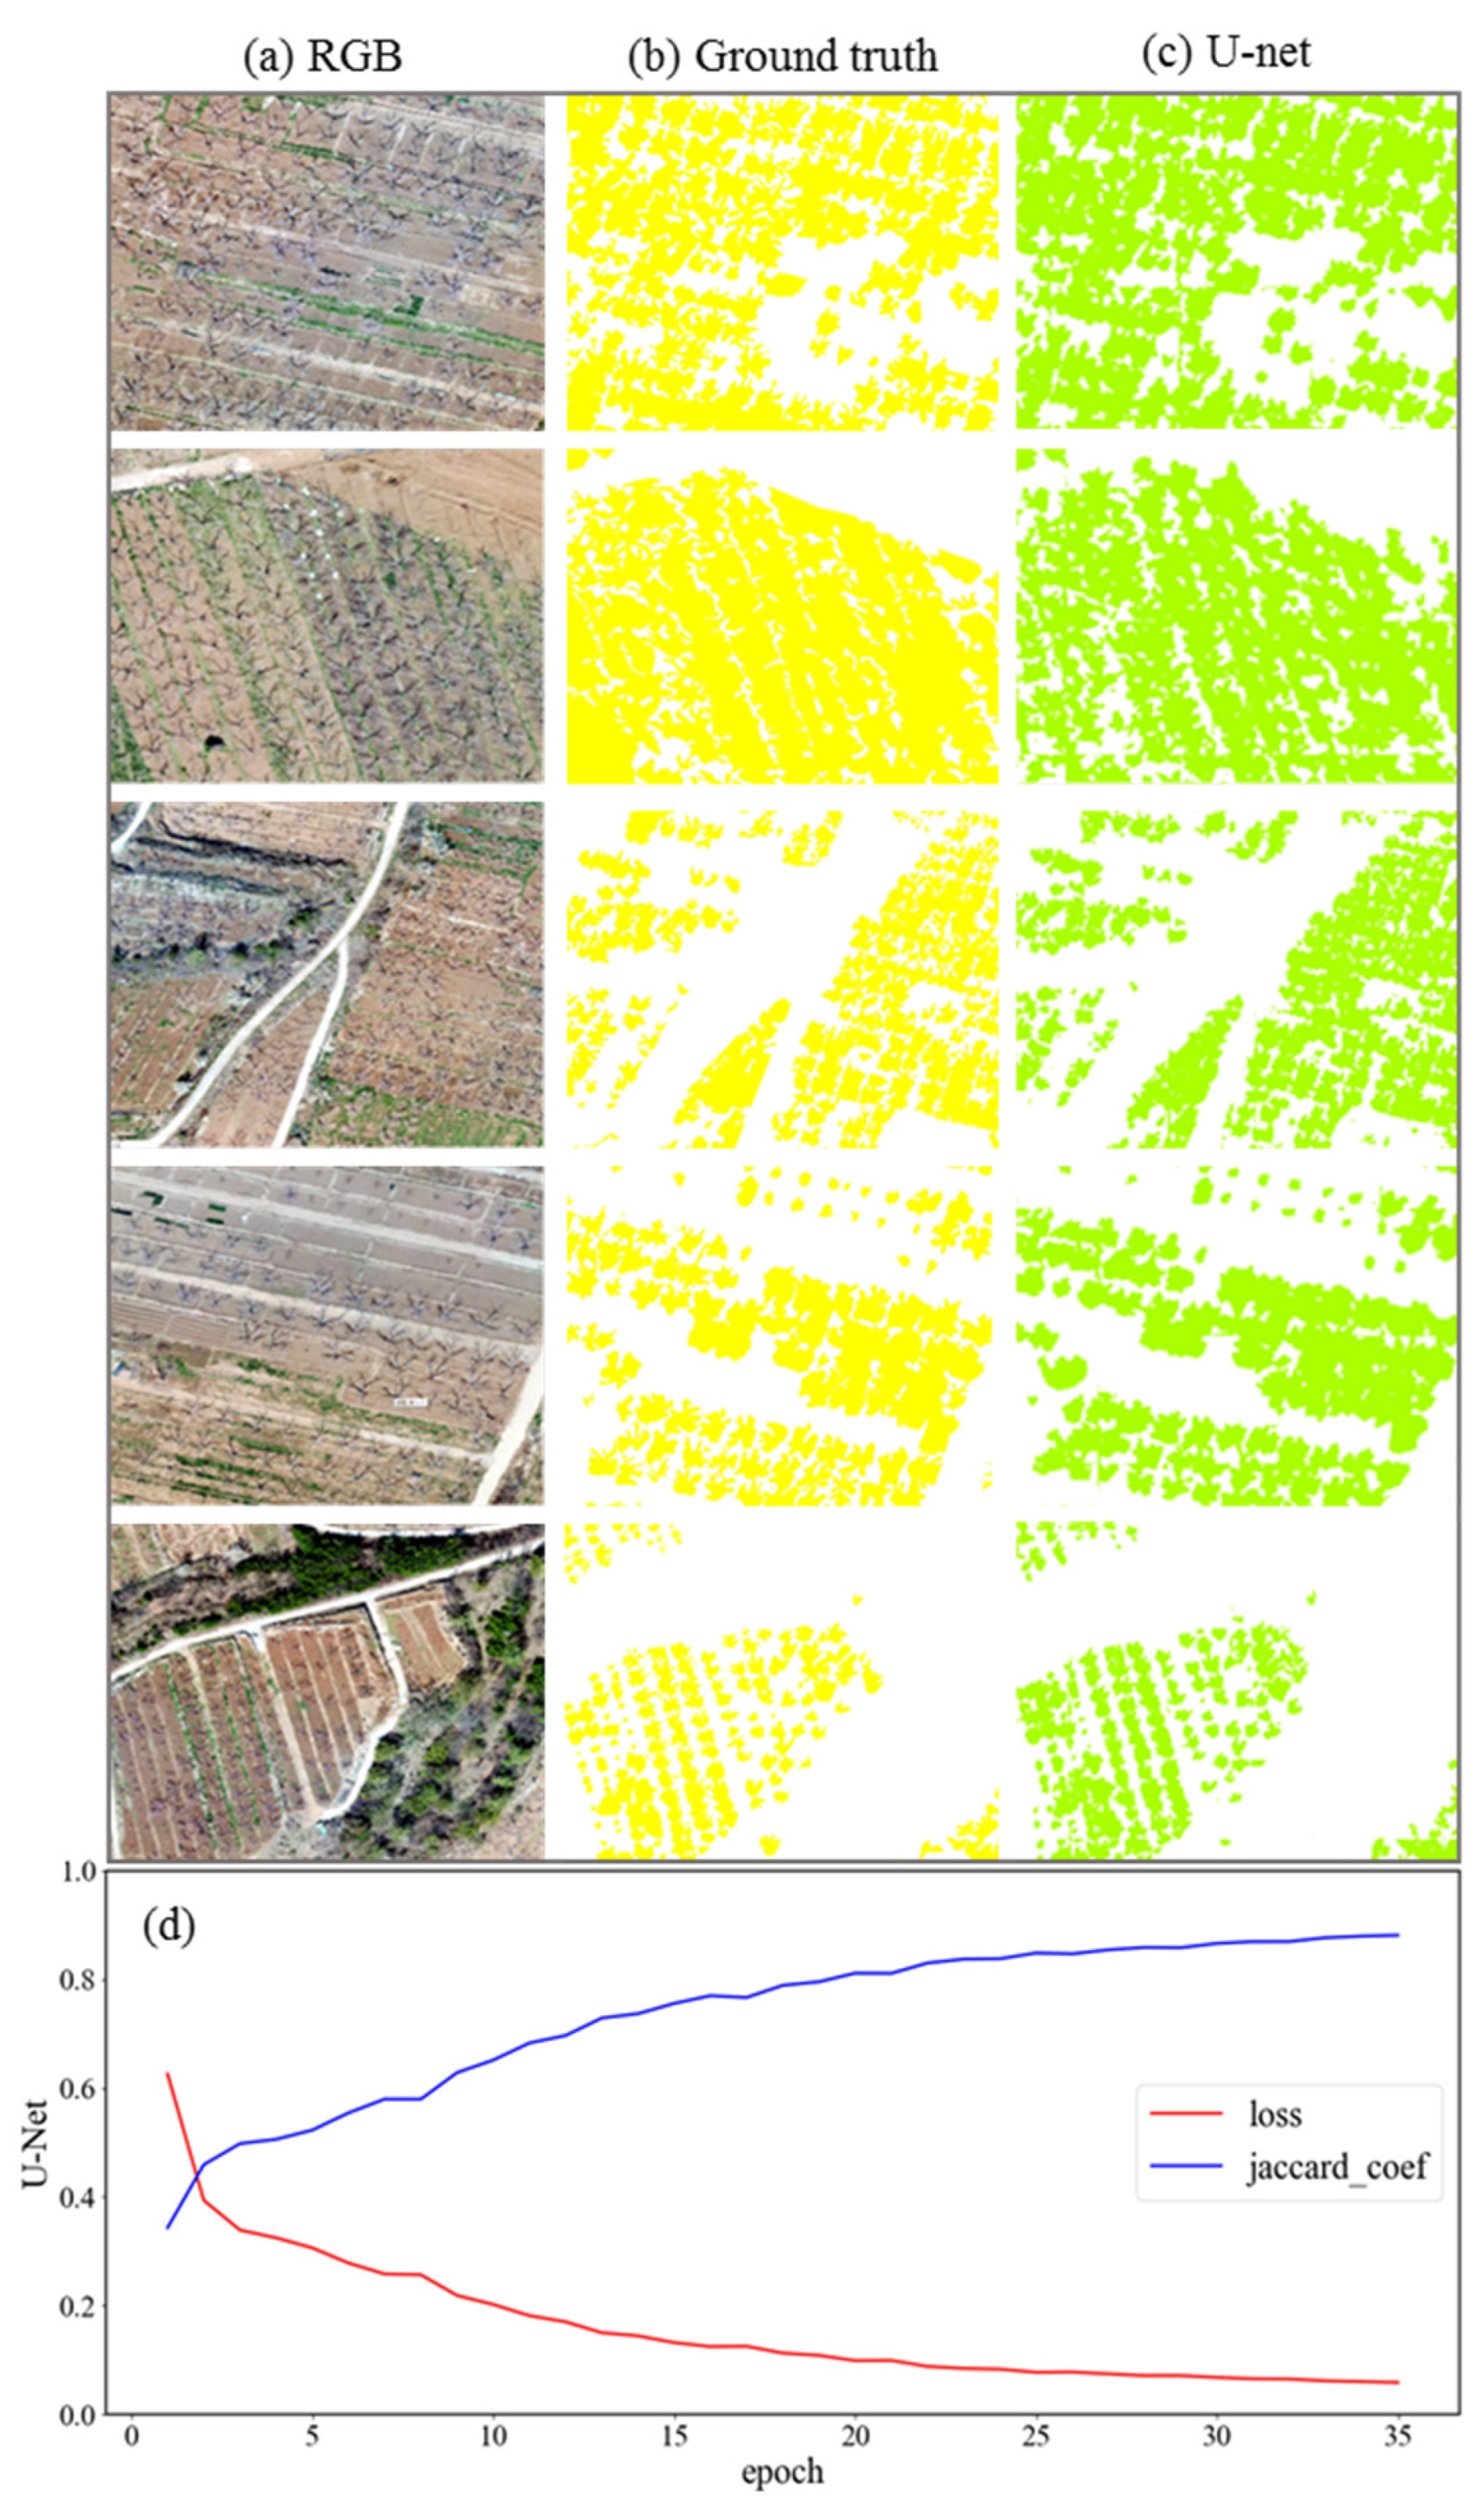
Figure 5.
The spatial distribution of projected peach trees in cultivated land. Images show the ground truth for peach trees in (a) G2 and (c) G3 and the prediction results of the U-net algorithm identification for (b) G2 and (d) G3. The graphs show the results of the U-net algorithm: (e) G2 confusion matrix and (f) G3 confusion matrix. The pixel values describe the performance of the classification model for each data set. The matrix rows represent the true value, and the columns represent the predicted value. The decimal represents the proportion of the pixel values for the four types.
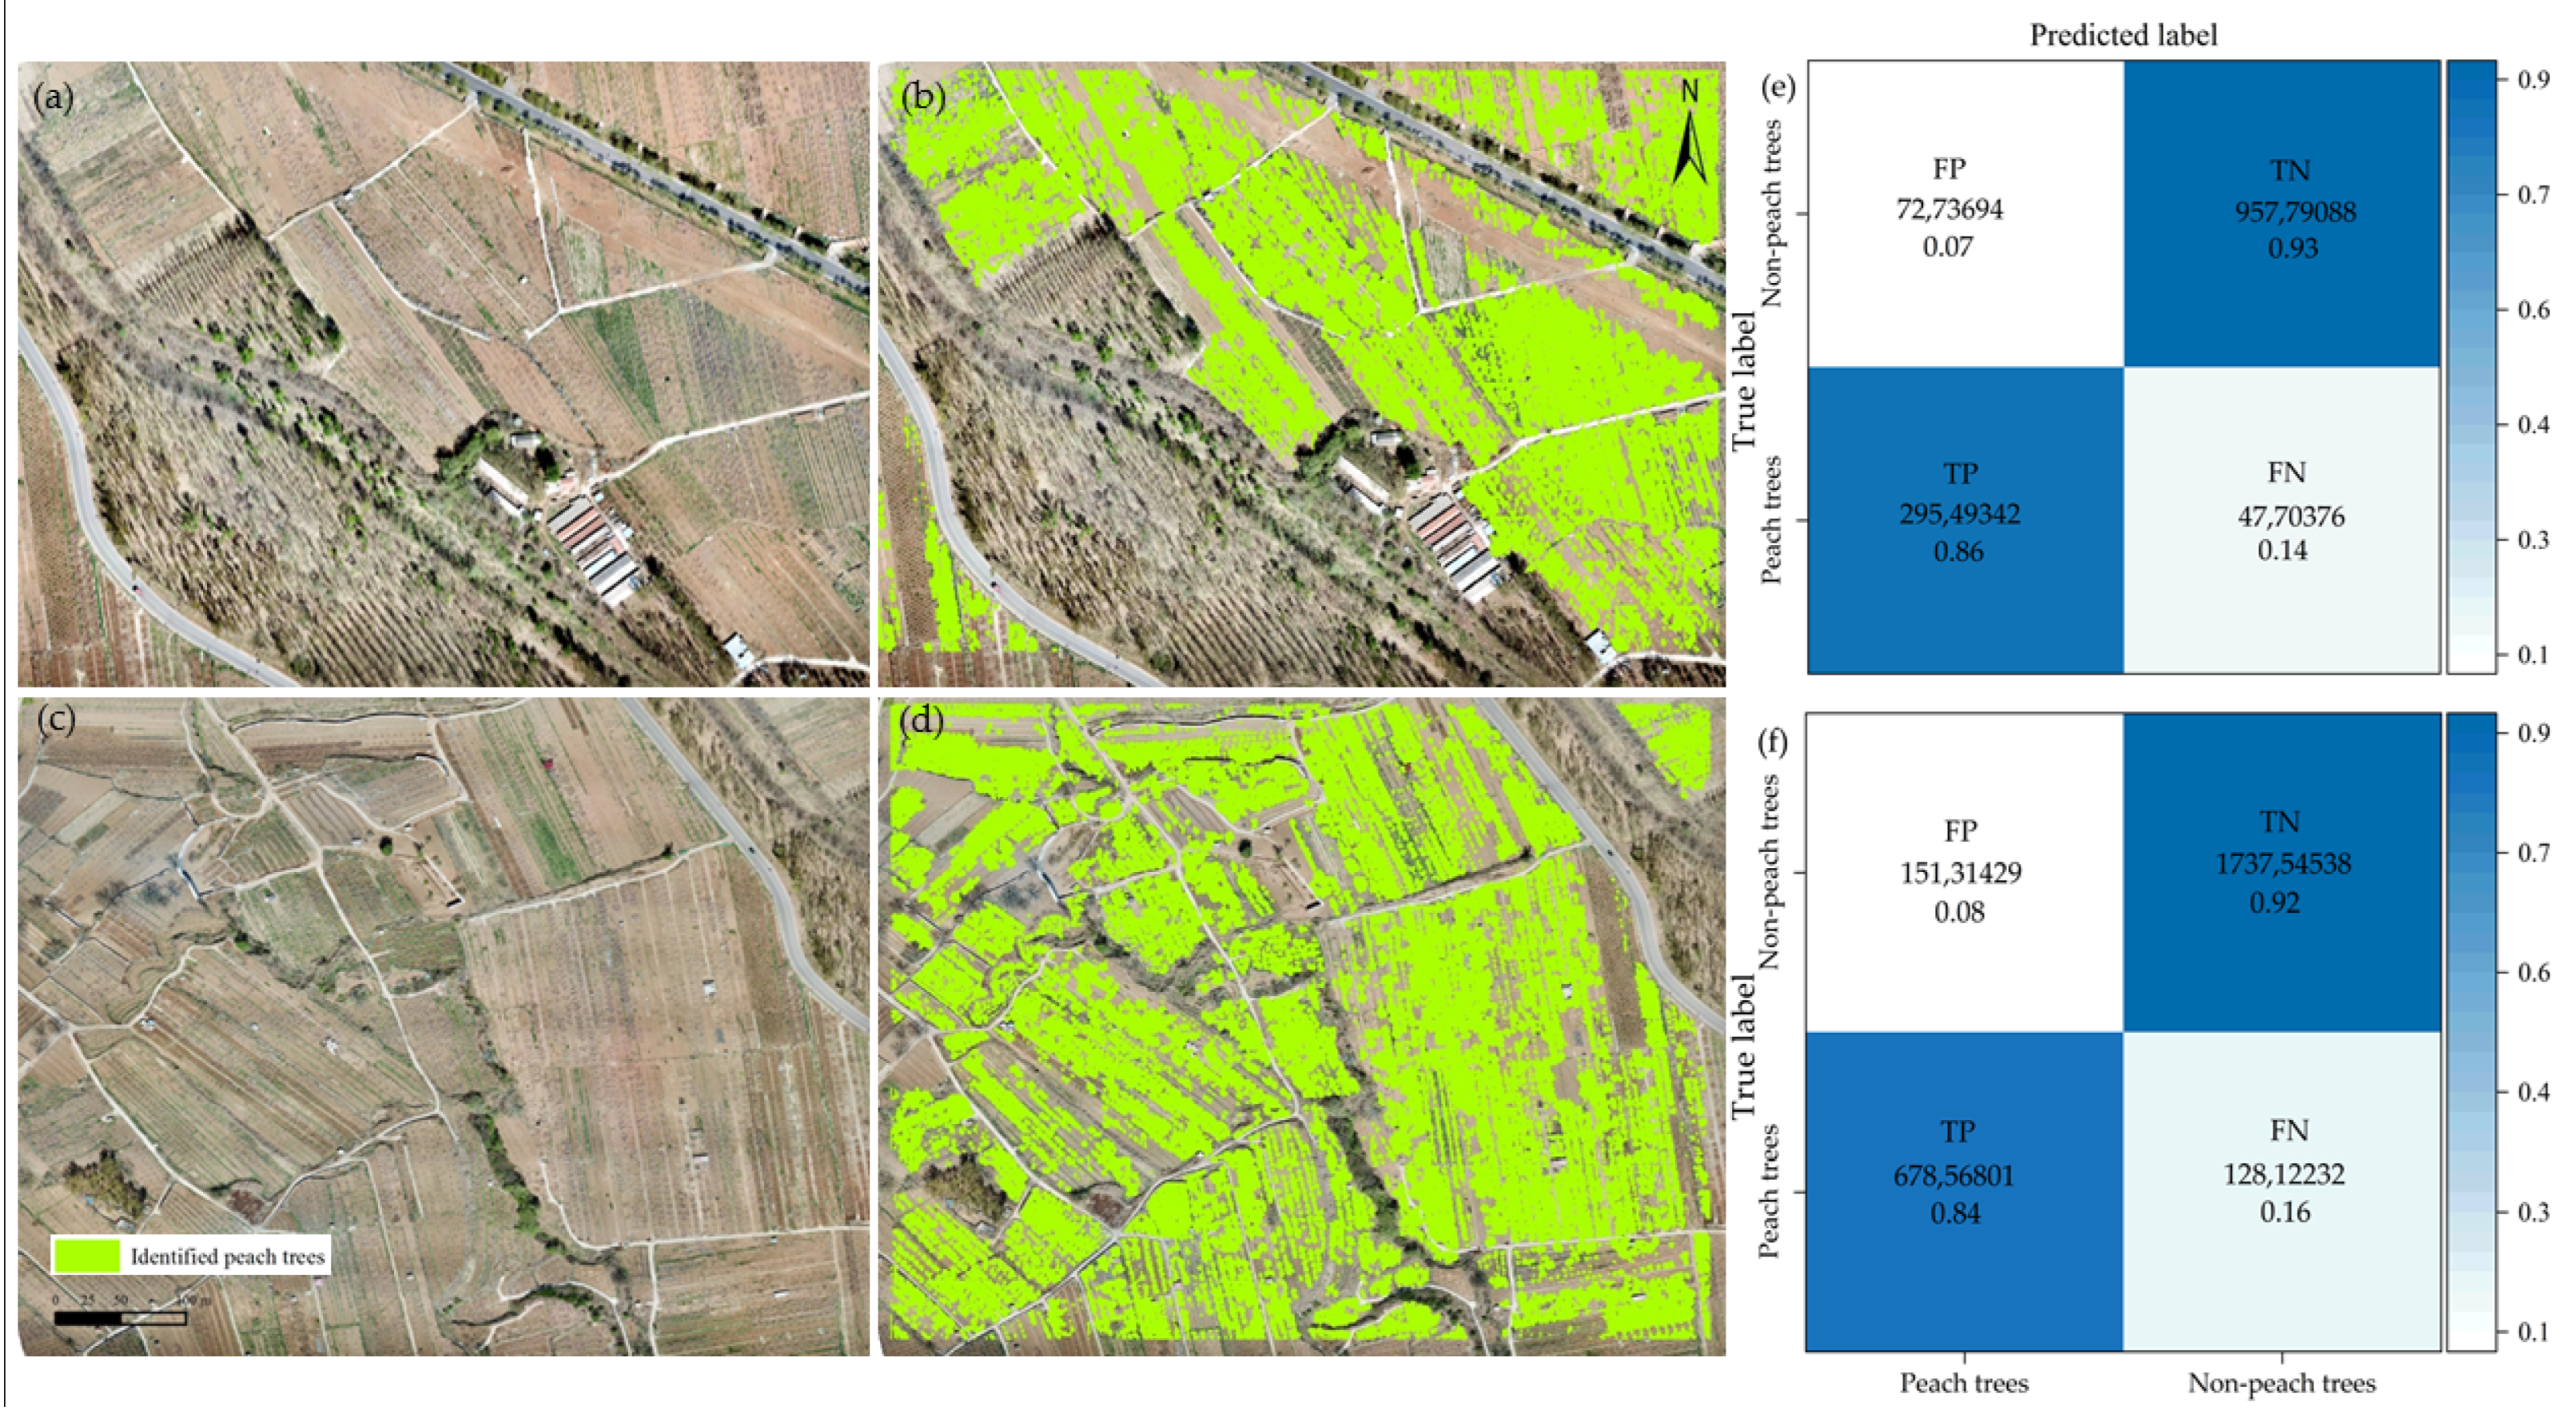
Figure 6.
The results of the U-net algorithm: (a) peach trees and vegetable fields, (b) peach trees, (c) windbreaks, (d) garlic covered in plastic mulch, (e) country road, and (f) homestead.
Figure 6.
The results of the U-net algorithm: (a) peach trees and vegetable fields, (b) peach trees, (c) windbreaks, (d) garlic covered in plastic mulch, (e) country road, and (f) homestead.

Table 1.
Confusion matrix.
| Confusion Matrix | Predicted | ||
|---|---|---|---|
| Yes | No | ||
| Actual | Yes | TP | FN |
| —— | No | FP | TN |
Table 2.
Validation of the U-net algorithm identification results.
| Plots | Precision | Recall | F1 | Overall | Kappa | IoU | TP | FP | TN | FN |
|---|---|---|---|---|---|---|---|---|---|---|
| G1 | 0.80 | 0.87 | 0.83 | 0.90 | 0.88 | 0.70 | 46,404,246 | 11,889,877 | 118,040,754 | 7,030,123 |
Table 3.
The estimated peach trees area is in the projection plots.
| Predicted Points | Ground Truth Area | Peach Trees Area | INGP/% | Accuracy | Overall Accuracy |
|---|---|---|---|---|---|
| G2 (325) | 32,770.40 m2 | 28,491.20 m2 | 76.90 | 0.84 | 0.92 |
| G3 (638) | 66,980.61 m2 | 68,963.20 m2 | 91.38 | 0.97 |
Publisher’s Note: MDPI stays neutral with regard to jurisdictional claims in published maps and institutional affiliations. |
© 2022 by the authors. Licensee MDPI, Basel, Switzerland. This article is an open access article distributed under the terms and conditions of the Creative Commons Attribution (CC BY) license (https://creativecommons.org/licenses/by/4.0/).
Share and Cite
MDPI and ACS Style
Li, Q.; Zhang, X. Identifying Peach Trees in Cultivated Land Using U-Net Algorithm. Land 2022, 11, 1078. https://doi.org/10.3390/land11071078
AMA Style
Li Q, Zhang X. Identifying Peach Trees in Cultivated Land Using U-Net Algorithm. Land. 2022; 11(7):1078. https://doi.org/10.3390/land11071078
Chicago/Turabian StyleLi, Qing, and Xueyan Zhang. 2022. "Identifying Peach Trees in Cultivated Land Using U-Net Algorithm" Land 11, no. 7: 1078. https://doi.org/10.3390/land11071078
Note that from the first issue of 2016, this journal uses article numbers instead of page numbers. See further details here.