Article

Towards Carbon Neutrality: The Innovation Efficiency of China’s Forestry Green Technology and Its Spatial Spillover Effects

School of Economics and Management, Northeast Forestry University, Harbin 150040, China
*
Author to whom correspondence should be addressed.
Land 2022, 11(7), 1081; https://doi.org/10.3390/land11071081
Submission received: 17 June 2022 / Revised: 11 July 2022 / Accepted: 12 July 2022 / Published: 14 July 2022

Abstract

:
This study evaluates China’s forestry green technology innovation efficiency (FGTIE) using slack-based Data Envelopment Analysis (DEA) based on Chinese provincial panel data from 2011 to 2020. This research endeavours to explore the spatiotemporal dynamics of FGTIE in China and identify its influencing factors. The results demonstrate obvious spatial distribution differences among Chinese FGTIEs, with the southwestern region being relatively stable and the central and southeastern regions being more variable, revealing a general state of clustered development. FGTIE demonstrates a significant spatial correlation. The correlation intensity reveals a ‘W’-shaped, ‘down–up–down’ trend, suggesting that a universal spatial pattern of FGTIE has not yet developed a steady state and that stable spatial aggregation characteristics among provinces are evident. The influencing factors of FGTIE are confirmed to have significant spillover effects. Increases in social security, foreign direct investment and environmental policy stringency will promote efficiency improvements in neighbouring provinces through positive spillover effects, and the economic development level and forestry scale will inhibit efficiency improvements in neighbouring provinces through negative spillover effects.

1. Introduction

The primary cause of global warming is greenhouse gas emissions caused by human activities, which has become a serious global challenge that threatens the sustainable development of the international community as a common global environmental, and also has become a developmental issue [1]. China’s development strategy of actively promoting high-quality development and ecological civilisation aligns with general worldwide trends in green and low-carbon transformation established by the Paris Agreement. Since the introduction of the concept of low-carbon development in China, policy authorities and academia have widely recognised the nation’s efforts. In 2020, China announced a worldwide commitment to achieve peak carbon by 2030 and carbon neutrality by 2060, releasing a series of related policy deployments and action plans and signalling comprehensive directions for promoting green and low-carbon transition development. Considering China’s massive economic volume, energy system and contemporary industrial production inertia, the goal of carbon neutrality by 2060 reflects the nation’s determination to promote global ecological security and sustainable development, as well as the goal of improving resource efficiency.
There are primarily two approaches to achieving China’s strategic deployment of carbon neutrality, including carbon emissions reduction and increasing carbon sequestration [2]. The predominant method for carbon capture and sequestration is the use of forests, which is called a forest carbon sink. Forests have a crucial role in reducing carbon concentration as the largest repositories in terrestrial ecosystems [3], and the cost of building forest carbon sinks can be partially offset by advancing the economic benefits of forestry, indicating that forestry development has the dual task of optimising ecology and promoting development for achieving China’s carbon neutrality goals.
With the growing contradictions between environmental protection and economic development, China’s traditional forestry economic growth mechanism requires coordinated transformation. Traditional factors, such as labour and resources, which have been critical to forestry development in the past, have become less dynamic, and the pressures of resource, energy and environmental constraints have increased. Promoting high-quality forestry development will be a key part of China’s attainment of carbon neutrality.
Innovation is an eternal force for development and progress [4]. Innovation produces solutions for the dilemmas confronting traditional forestry in China under the goal of carbon neutrality and can solve significant issues in the contemporary transformation of traditional forestry, such as factor structure, resource allocation and industrial integration forestry [5,6,7]. Advancing the integration of forestry and technological innovation can address the over-exploitation of forest resources that leads to energy consumption or generate the expansion of factor demand, promote the improvement of forest quality and green and intensive development, and have direct and indirect rebound effects on CO2 emissions.
The level of green technology innovation efficiency (GTIE) is a basic indicator for visually measuring the level of innovation. Deconstructing forestry green technology innovation efficiency (FGTIE) measurements, spatial evolution patterns and spatial spillover effects is imperative for clarifying forestry innovation development mechanisms and implementation paths to advance the deep integration of economic development and environmental restoration and protection under the goal of carbon neutrality, and has practical significance for informing and guiding macro policy formulation and micro industrial adjustments in forestry under the goal of carbon neutrality.
The primary purpose of this study is to explore the evolutionary trend of China’s FGTIE and its influencing factors from the perspective of national carbon neutral and macro-strategic objectives. First, we establish an SBM-DEA model including bad outputs to measure China’s FGTIE from 2011 to 2020. Second, the spatial correlation of the dynamic change characteristics of FGTIE is analysed and examined. Third, a spatial econometric model is constructed to analyse the influencing factors and spillover effects of FGTIE.

2. Literature Review

Charnes originally proposed DEA [8] based on the Cobb–Douglas productivity theory which incorporates resource and environmental factors into the production function. DEA applies mathematical programming models to evaluate whether decision-making units (DMUs) with multiple inputs and outputs are located on the production frontier of a production possibility set. DEA has a strong advantage in measuring GTIE, and numerous scholars now apply this method for assessing this measure. Guo used the DEA-BCC model to measure the GTIE of mining companies and applied the Malmquist index to evaluate the dynamic change in efficiency [9]. Wang used a bootstrap-DEA model to emulate the original data generation process through repeated sampling on top of the original sample data and to correct the biases in the efficiency evaluation value of the small sample case by expanding the sample size to obtain the confidence interval of the true measure of GTIE [10]. Shen studied China’s GTIE and the key factors in the mechanism of action based on a hybrid-DEA model [11]. Zhang used an improved three-stage SBM-DEA model to analyse the spatial and temporal differences presented by industrial GTIE in China [12].
To measure objectives, Luo constructed an industrial GTIE assessment system for the Chinese region [13], applying principal component analysis to downscale and separately determine the technological innovation efficiency of the two stages. Huang measured the manufacturing GTIE in the Yangtze River Economic Zone using provincial panel data from 2008 to 2019 [14], exploring efficiency from overall, regional and provincial perspectives. Wang comprehensively evaluated the GTIE of 21 biomass power generation enterprises in 2018 [10].
In terms of influencing factors, He selected foreign direct investment (FDI), green economic development levels, urbanisation levels, industrial agglomeration, enterprise earnings, environmental policy and government support to explore the spatial effects of the influencing factors of GTIE for industrial enterprises in the Yangtze River Delta [15]. Based on the panel data of China’s industrial sector, Cheng investigated the influencing factors of GTIE using the Tobit model to examine the average firm size, degree of marketisation, degree of openness to the outside world and intensity of environmental regulation [16]. Huang used the spatial Durbin model (SDM) to analyse the internal dynamics of GTIE in the Yangtze River Economic Belt region [17], exploring the spatial spillover effects of economic development, government support, environmental policies, FDI, industrial structure and enterprise efficiency.
Relevant studies still have some limitations. (1) The research objects primarily focus on heavy pollution and high-tech industries, but no research examines the forestry field, and a lack of consideration of the sources of carbon decline in China’s macro strategy remains. (2) The existing models for measuring GTIE assume innovation benefits as the only expected output, and this single output criterion severely underestimates the ecological and environmental values generated from technological innovation production activities that are consistent with green development expectations. (3) Regarding the influencing factors, previous studies have emphasised the factor variables related to the subject and the circumstances of green technology innovation and have not analysed the macro-cognitive drivers of the current development status of FGTIE and its basic characteristics.
This paper offers three major research contributions. The first is the construction of an SBM-DEA model with good outputs, including innovation as well as ecological and environmental benefits, and bad outputs, to measure the FGTIEs in China from 2011 to 2020. The second is the introduction of a spatial econometric analysis to empirically test the spatial correlations, differentiation characteristics and spillover effects of FGTIEs and to identify the sources of FGTIEs’ differences and changing trends in China. Finally, the results of the study lead to relevant policy proposals to promote the transformation and upgrading of forestry development considering China’s goal of carbon neutrality and the high-quality improvement of resource allocation capabilities.

3. Methods and Data

3.1. Methods

3.1.1. Super-Efficiency SBM-DEA Model

This paper uses the super-SBM model to calculate China’s FGTIE. The DEA model can solve the problem of multiple inputs and outputs as efficiency indicators, does require specific production functions and pre-estimated weights and parameters, and evaluates data from the perspective of the most favourable evaluation unit, with the obvious advantage of fewer errors [18]. The super-efficient SBM model can address the slackness of input–output variables and elicit the deeper division of effective decision units [19]. The basic logic of the SBM-DEA model aims to obtain higher multidimensional efficiency outputs with fewer factor inputs. This paper introduces a super-efficient SBM-DEA model to measure China’s FGTIEs, as shown in Formula (1):
m i n ρ * = 1 + 1 m m = 1 M S m x x j m t 1 1 l + k ( l = 1 L S l y y j l t + k = 1 K S k z z j k t ) s . t . { x j m t j = 1 , j 0 n φ j t x j m t + S m x y j l t j = 1 , j b n φ j t y j l t S l y z j k t j = 1 , j b n φ j t z j k t + S k z φ j t 0 , S m x 0 , S l y 0 , j = 1 , , n
where ρ * represents FGTIE; x j t , y j t and z j t represent the input, good outputs and bad outputs of DMU j in period t, respectively. m, l and k represent the number of inputs, good outputs and bad outputs, respectively; S denotes the input–output slack vector, and φ is the weight vector of the DMU.

3.1.2. Spatial Econometric Model

  • Global indicators of spatial association
Spatial autocorrelation assesses the possible interdependence between the observations of some variables in the same distribution [20]. Global Moran’s I is the first method applied to the global clustering test to analyse whether the relationships between neighbouring provinces in a whole region are different, similar or independent of one another. Global Moran’s I generally takes values of [−1,1]: the closer to 1 it is, the stronger the positive spatial correlation is; the closer to −1 it is, the stronger the negative spatial correlation is. The calculation for Global Moran’s I is presented in presented in Formula (2):
I = n i = 1 n j = 1 n w i j ( x i x ¯ ) ( x j x ¯ ) i = 1 n j = 1 n w i j i = 1 n ( x i x ¯ ) 2 = i = 1 n j 1 n w i j ( x i x ¯ ) ( x j x ¯ ) S 2 i = 1 n j = 1 n w i j
where w i and w j represent the attributes of province i and province j, respectively; S represents the variance of the attributes, S 2 = 1 n i ( x i x ¯ ) 2 ; n represents the number of provinces and w i j represents the spatial weight matrix. There are three forms of w i j , including the adjacency matrix ( w i j 1 ), the distance matrix ( w i j 2 ) and the economic matrix ( w i j 3 ), and the spatial weight matrix can be expressed as an adjacency matrix:
w i j 1 = { 1         ,                                 p r o v i n c e s   i   a n d   j   a r e   a d j a c e n t     0       ,                       p r o v i n c e s   i   a n d   j   a r e   n o t   a d j a c e n t
The spatial weight matrix can be expressed as a distance matrix:
w i j 2 = { 1 d i j 2           ,                         i f   i j         0             ,                         i f   i = j
where d i j is the Euclidean distance from the different provinces of i and j.
The spatial weight matrix can also be expressed as an economic matrix:
w i j 3 = { 1 p e r G D P j d i j p e r G D P i           ,                         i f   i j                         0               ,                         i f   i = j
where p e r G D P i is the average annual GDP per capita of province i in the sample period.
  • Local indicators of spatial association
To further analyse the spatial heterogeneity of FGTIEs in China, Anselin Local Moran’s I is used to analyse whether different or similar provincial aggregation occurs in provinces, as shown in Formula (6):
I i = ( x i x ¯ ) S 2 j 1 w i j ( x i x ¯ )
where I i is the Local Moran’s I of province i, which is a measure of the degree of association between a province and neighbouring provinces. I i > 0 indicates a low (high) value surrounded by a low (high) value, called low–low (high–high), and I i < 0 indicates that a high (low) value is surrounded by a low (high) value, which is referred to as high–low (low–high). w i and w j represent the attributes of province i and province j, respectively; S represents the variance of the attributes, and w i j is the spatial weight.
  • SDM
If China’s provincial FGTIEs do have significant spatial correlation, then the traditional ordinary least squares (OLS) method is unsuitable for quantifying the factors affecting the FGTIE. OLS is only valid if the explanatory variables are not spatially correlated. If FGTIE has strong spatial correlation characteristics, spatial econometric models can incorporate spatial weights in the model based on geographic spatial variability [21], according to spatial econometric theory [22]. The SDM, spatial autoregressive (SAR) model and spatial error model (SEM) are common approaches to measuring spatial correlation. The SDM is not endogenous and can describe the externalities of the influencing factors more accurately, which is more suitable for analysing spillover effects; therefore, this paper applies the SDM to study the spillover effects of the influencing factors of FGTIE in China, as shown in Formula (7):
F G T I E i t = β x i t + δ j = 1 n w i j F G T I E j t + φ j = 1 n w i j x i t + ω i + γ t + ε i t
where F G T I E i t is the value of FGTIE in province i in year t; x i t is the value of influence factor i in year t; β is the coefficient of influence of x i on F G T I E i t ; δ is the spatial regression coefficient of FGTIE; φ is the spatial regression coefficient of x i ; ω i and γ t represent entity and time fixed effects, respectively; ε i t represents a random disturbance term of normal distribution and w i j represents the spatial weight.

3.2. Data

3.2.1. Data Description

The samples in our study are panel data from 30 provincial areas (excluding Hong Kong, Macau, Tibet and Taipei because of inconsistent data due to statistical source bias and the difficulty of obtaining some data) for the period 2011–2020. The data were obtained from the China Statistical Yearbook, the China Statistical Yearbook on Forestry, the China Statistical Yearbook on Environment and data published on authoritative Chinese forestry websites.

3.2.2. Evaluation Indicators

At this stage, we scientifically and rationally combine the measurement of China’s FGTIEs with the development status and impact characteristics of China’s forestry. The measurement of FGTIEs references previous studies and considers the stringency of the inputs and outputs and the availability of data.
In terms of inputs, we include capital, labour and resources for a comprehensive overview of China’s forestry development trajectory. Capital and labour are the most basic innovation input factors [23], expressed in terms of the number of forestry innovation funds invested in by the Chinese government and the number of forestry science and technology-related employees in each province. We use forest cover and forestry industry energy consumption as resource inputs, highlighting the critical role of forest cover in achieving China’s carbon neutral target for forest carbon sinks and the energy consumption required for forestry innovative behaviour. Given the lack of data on forestry energy consumption, we indirectly calculated this by referencing previous research methods [24], in which Forestry industrial energy consumption = (Forestry industrial output value/GDP) × total energy consumption.
For good outputs, to reflect the feedback characteristics of forestry green technology innovation more comprehensively, this study considers both general innovation outputs and ecological and environmental outputs related to the improvement of integrated environmental pollution accompanying the innovation activities. We measure innovation output using the number of forestry-related patents in the year. Ecological output is related to the forest area and is measured by new afforestation areas in the year. Environmental output is represented by the rate of forest pest and rodent control, as studies have demonstrated that the incidence of forest pests and rodents reflects the forestry production environment [6].
We selected bad outputs by presuming that forestry innovation behaviour is accompanied by environmental pollution, represented by sulphur dioxide, nitrogen oxide and nitrogen dioxide (NOx) and soot emissions. We obtained our data using indirect calculations [24], in which the bad forestry outputs = (forestry industrial output value/GDP) × the total bad outputs. Table 1 presents the details of this study’s inputs and outputs for China FGTIEs from 2011 to 2020.

3.2.3. Influencing Factors on FGTIEs

Another research focus of this paper is to explore the influencing factors and spillover effects of FGTIEs under the carbon neutrality target, driving the improvement of FGTIEs and contributing to the efficient development of the economic and ecological values of China’s forestry industry and a more prominent role for forestry in advancing the carbon neutrality target. Based on relevant research results [25], this study more comprehensively considers the division of social security (SS), human capital (HC), government subsidies (GS), industrial structure (IS), forestry scale (FS), economic development level (EDL), FDI, urbanisation level (UL) and Environmental Policy Stringency Index (EPS), the core variables that can provide empirical evidence for FGTIEs from an empirical perspective. Table 2 describes these factors in detail, following the narrative explanations below.
  • SS: Previous studies have demonstrated that the level of employees’ social security affects technological innovation behaviour [26]. Innovative behaviour is often accompanied by some risk. With the improvement of social security, the willingness of forestry practitioners to bear risks rises, and social security can meaningfully reduce forestry practitioners’ fear of innovation risks. Therefore, social security can advance and motivate forestry practitioners’ potential and motivation for technological innovation, thus enhancing FGTIEs. In this paper, SS is measured by the average annual wage of workers in the forestry system in each province.
  • HC: Human capital as an innovative subject is a carrier of knowledge and technology that can induce innovative behaviour by matching the path of technological structures and upgrading and developing innovative ecological solutions. HC is capable of allocating resources and guiding the concentration of other input factors in forestry to improve and innovate production technology and promote the diffusion of new knowledge and technological approaches to advance the overall optimisation of forestry development. Previous studies have found that the level of HC is determined by labourers’ education, and the higher the education level is, the greater the contributions to innovation are. This study measures HC as the number of forestry station workers in each province with an education level of short-cycle courses or above.
  • GS: The special nature of the forestry industry is that it is basic, ecological and related to public welfare. Since the forestry industry is highly influenced by natural factors and carries a high degree of risk, the government often tries to adjust the forestry industry’s development through the provision of financial subsidies. Existing studies have reached two different conclusions regarding the government’s financial support. The first research view is that government financial subsidies can promote forestry innovation behaviour, as such subsidies not only encourage forestry technological innovation research and development (R&D) at a lower cost, but more importantly, these subsidies can also increase the motivation for technological innovation R&D [27]. Another research view is that government financial subsidies reduce innovation behaviour. The forestry industry will alter the demand for innovation in forestry production after receiving GS, instead reducing investment in technological innovation, as the innovation generates the same income [28]. In this study, GS is measured by the total state investment in forestry.
  • IS: The adjustment of industrial structures can improve the quality of economic growth and is also an important means of improving the ecological environment [29]. Green technology innovation is a technology-intensive activity, and industrial restructuring and upgrades promote the vitality of industrial innovation and enhance the development of green technology innovation in regional industries. Promoting the transformation and upgrading of the forestry industry and accelerating the cultivation of technological innovation as the core of the new advantages of competitive forestry development can effectively promote the improvement of FGTIE. This study measures IS as the ratio of tertiary provincial forestry sector outputs to GDP.
  • FS: Different forestry scales have different effects on the absorption of national innovation support policies. First, larger-scale forestry indicates that the province has advantages in human, financial, technological and managerial resources for forestry development [30], which can effectively supplement the innovative capital of other productive and functional activities to optimise production efficiency. Second, a larger forestry industry indicates that it has a well-established market, standardised trading criteria and a sound credit system, which can increase the industry’s ability to bear the risks of technological innovation. This study measures FS using the ratio of forestry employees to the total number of employees.
  • EDL: The current investment return cycle of China’s forestry industry is lengthy, with the characteristics of a low return rate in the early stage; thus, FGTIE requires considerable capital and scientific economic development support. Provinces with high levels of economic development can establish innovative policy support for forestry development through financial support, preferential policies, technical guidance and talent introduction. Highly developed provinces generate more opportunities to offer cooperation with social capital and use the funds provided for technological R&D to provide the impetus for FGTIE upgrades. This study uses provincial GDP to measure EDL.
  • FDI: There are two hypotheses regarding the impact of FDI; the ‘pollution haven hypothesis’ and the ‘pollution halo hypothesis’ [31,32]. FDI is highly permeable and practical and is capable of effectively addressing the comprehensive technology, capital and knowledge reserve challenges that arise in the development of China’s forestry industry. In contrast, although FDI provides motivations, tools and opportunities for technological innovation in China’s forestry industry, a high probability remains that contemporary products are pollution-intensive and resource-consuming, and thus are likely to become a ‘pollution haven’ for other countries [33]. This study measures FDI as the amount of actual foreign investment in each province.
  • UL: The process of urbanisation is one of both continuous industrial and population concentration and rapid social development, as well as the generation of massive energy consumption and high concentrations of carbon emissions. The urbanisation process is characterised by the continuous improvement of urban infrastructure and individual living standards. The level of urbanisation is an important indicator of economic development [34]. Urbanisation indirectly affects innovation through forestry production methods, technology circulation and trade development. UL is measured in this study by the ratio of year-end urban population to year-end total population.
  • EPS: The impact of environmental policy stringency on GTIE has been controversial, and there are two prevailing views. One view is ‘following costs’ [35], which argues that environmental policies lead to increased production costs and lower profits, which can reduce organisations’ innovative behaviour. Another view is that appropriate or more stringent environmental policies can better motivate organisations to improve productivity through technological innovation, referring to the ‘innovation compensation’ caused by environmental policies (also known as the ‘Porter hypothesis’). Our study produces evidence on the effect of environmental policies on the impact of different provinces’ FGTIE. The EPS measure is calculated as the ratio of the amount of national investment in controlling environmental pollution to GDP. Table 3 presents the descriptive statistics of the above factors.

4. Results

4.1. Spatiotemporal Dynamics

The values of FGTIE for 30 provinces in China from 2011 to 2020 are shown in Table A1. We used ArcGIS10.6.1 to visualise the spatiotemporal dynamics of China’s FGTIE. Figure 1 presents the spatiotemporal distributions of FGTIE in 2011 and 2020; different colours indicate different levels of efficiency. To explore the spatial distribution of FGTIE and its evolution, we categorise China’s FGTIE into four classes of low-, medium-, higher- and high-efficiency, conducting spatial visualisation and comparative analyses based on the four time periods of 2011, 2014, 2017 and 2020.
China’s FGTIE has obvious spatial distribution differences and geographical unevenness, with an overall spatial distribution characteristic of ‘high north and low south’. Specifically, (1) China’s FGTIE is bounded by Sichuan–Shaanxi–Henan–Shandong, showing a pattern of north–south polarisation, with the northern provinces primarily presenting higher- and high-efficiency agglomerations, and the southern provinces primarily being medium- and low-efficiency agglomerations. The FGTIE spatial distribution roughly matches the provinces’ climatic environment and energy consumption intensity patterns, indicating that the local ecological and natural environment and forestry technology measures taken influence FGTIE spatial distribution patterns, but the influence of the surrounding areas must also be considered. (2) The FGTIE of the provinces represented by Xinjiang, Qinghai, Inner Mongolia and Jiangsu is higher and continues to maintain a leading level. The presumed reasons for this are that these provinces have advanced forestry technology management and an efficient forestry industry system and the government attaches immense importance to the development of ecological civilisation, resulting in stronger innovation abilities and more healthy service systems in forestry development in these provinces, which can generate innovation and ecological benefits. In comparison, the province FGTIE represented by Guangxi and Jiangxi is comparatively low, which is closely related to the weak level of optimisation and innovation of its forestry technology and a low degree of market demand.
In the time dimension, FGTIE largely remains stable in the southwest region, whereas the southeast and central regions present an obvious regional clustering effect. During 2011–2014, higher-efficiency provinces gradually replaced medium-efficiency provinces, and low-efficiency provinces developed a pattern of concentrated development. High-efficiency provinces gradually increased, and Chongqing and Shandong became high-efficiency provinces. During 2014–2017, higher-efficiency provinces gradually replaced medium-efficiency provinces. The main reason may be that China vigorously promoted the Afforestation, Natural Forest Protection Project, Grain for Green Program and other related policies, broadening investment and financing channels for the ecological construction of forestry, which had a positive impact on forestry technology innovation. In 2017–2020, medium-efficiency provinces in the eastern region gradually replaced low-efficiency provinces, forming a new pattern of advancing contiguous and synergistic development.

4.2. Spatial Correlations

4.2.1. Global Spatial Correlations

This study used Stata to calculate the Global Moran’s I of Chinese provincial FGTIE, applying a spatial adjacency weight matrix. Table 4 presents the results. The Global Moran’s I of FGTIEs from 2011 to 2020 was between 0.02–0.124, with p < 0.01 in most years, and passed the 1–5% significance level test overall, indicating that FGTIE has significant spatial correlation. Therefore, the empirical analysis of FGTIE must consider global spatial correlations.
The Global Moran’s I of FGTIE reveals a ‘W’-shaped ‘down–up–down’ trend, indicating that the Global Moran’s I has certain waves, reflecting that an FGTIE global spatial pattern has not yet developed a steady state.

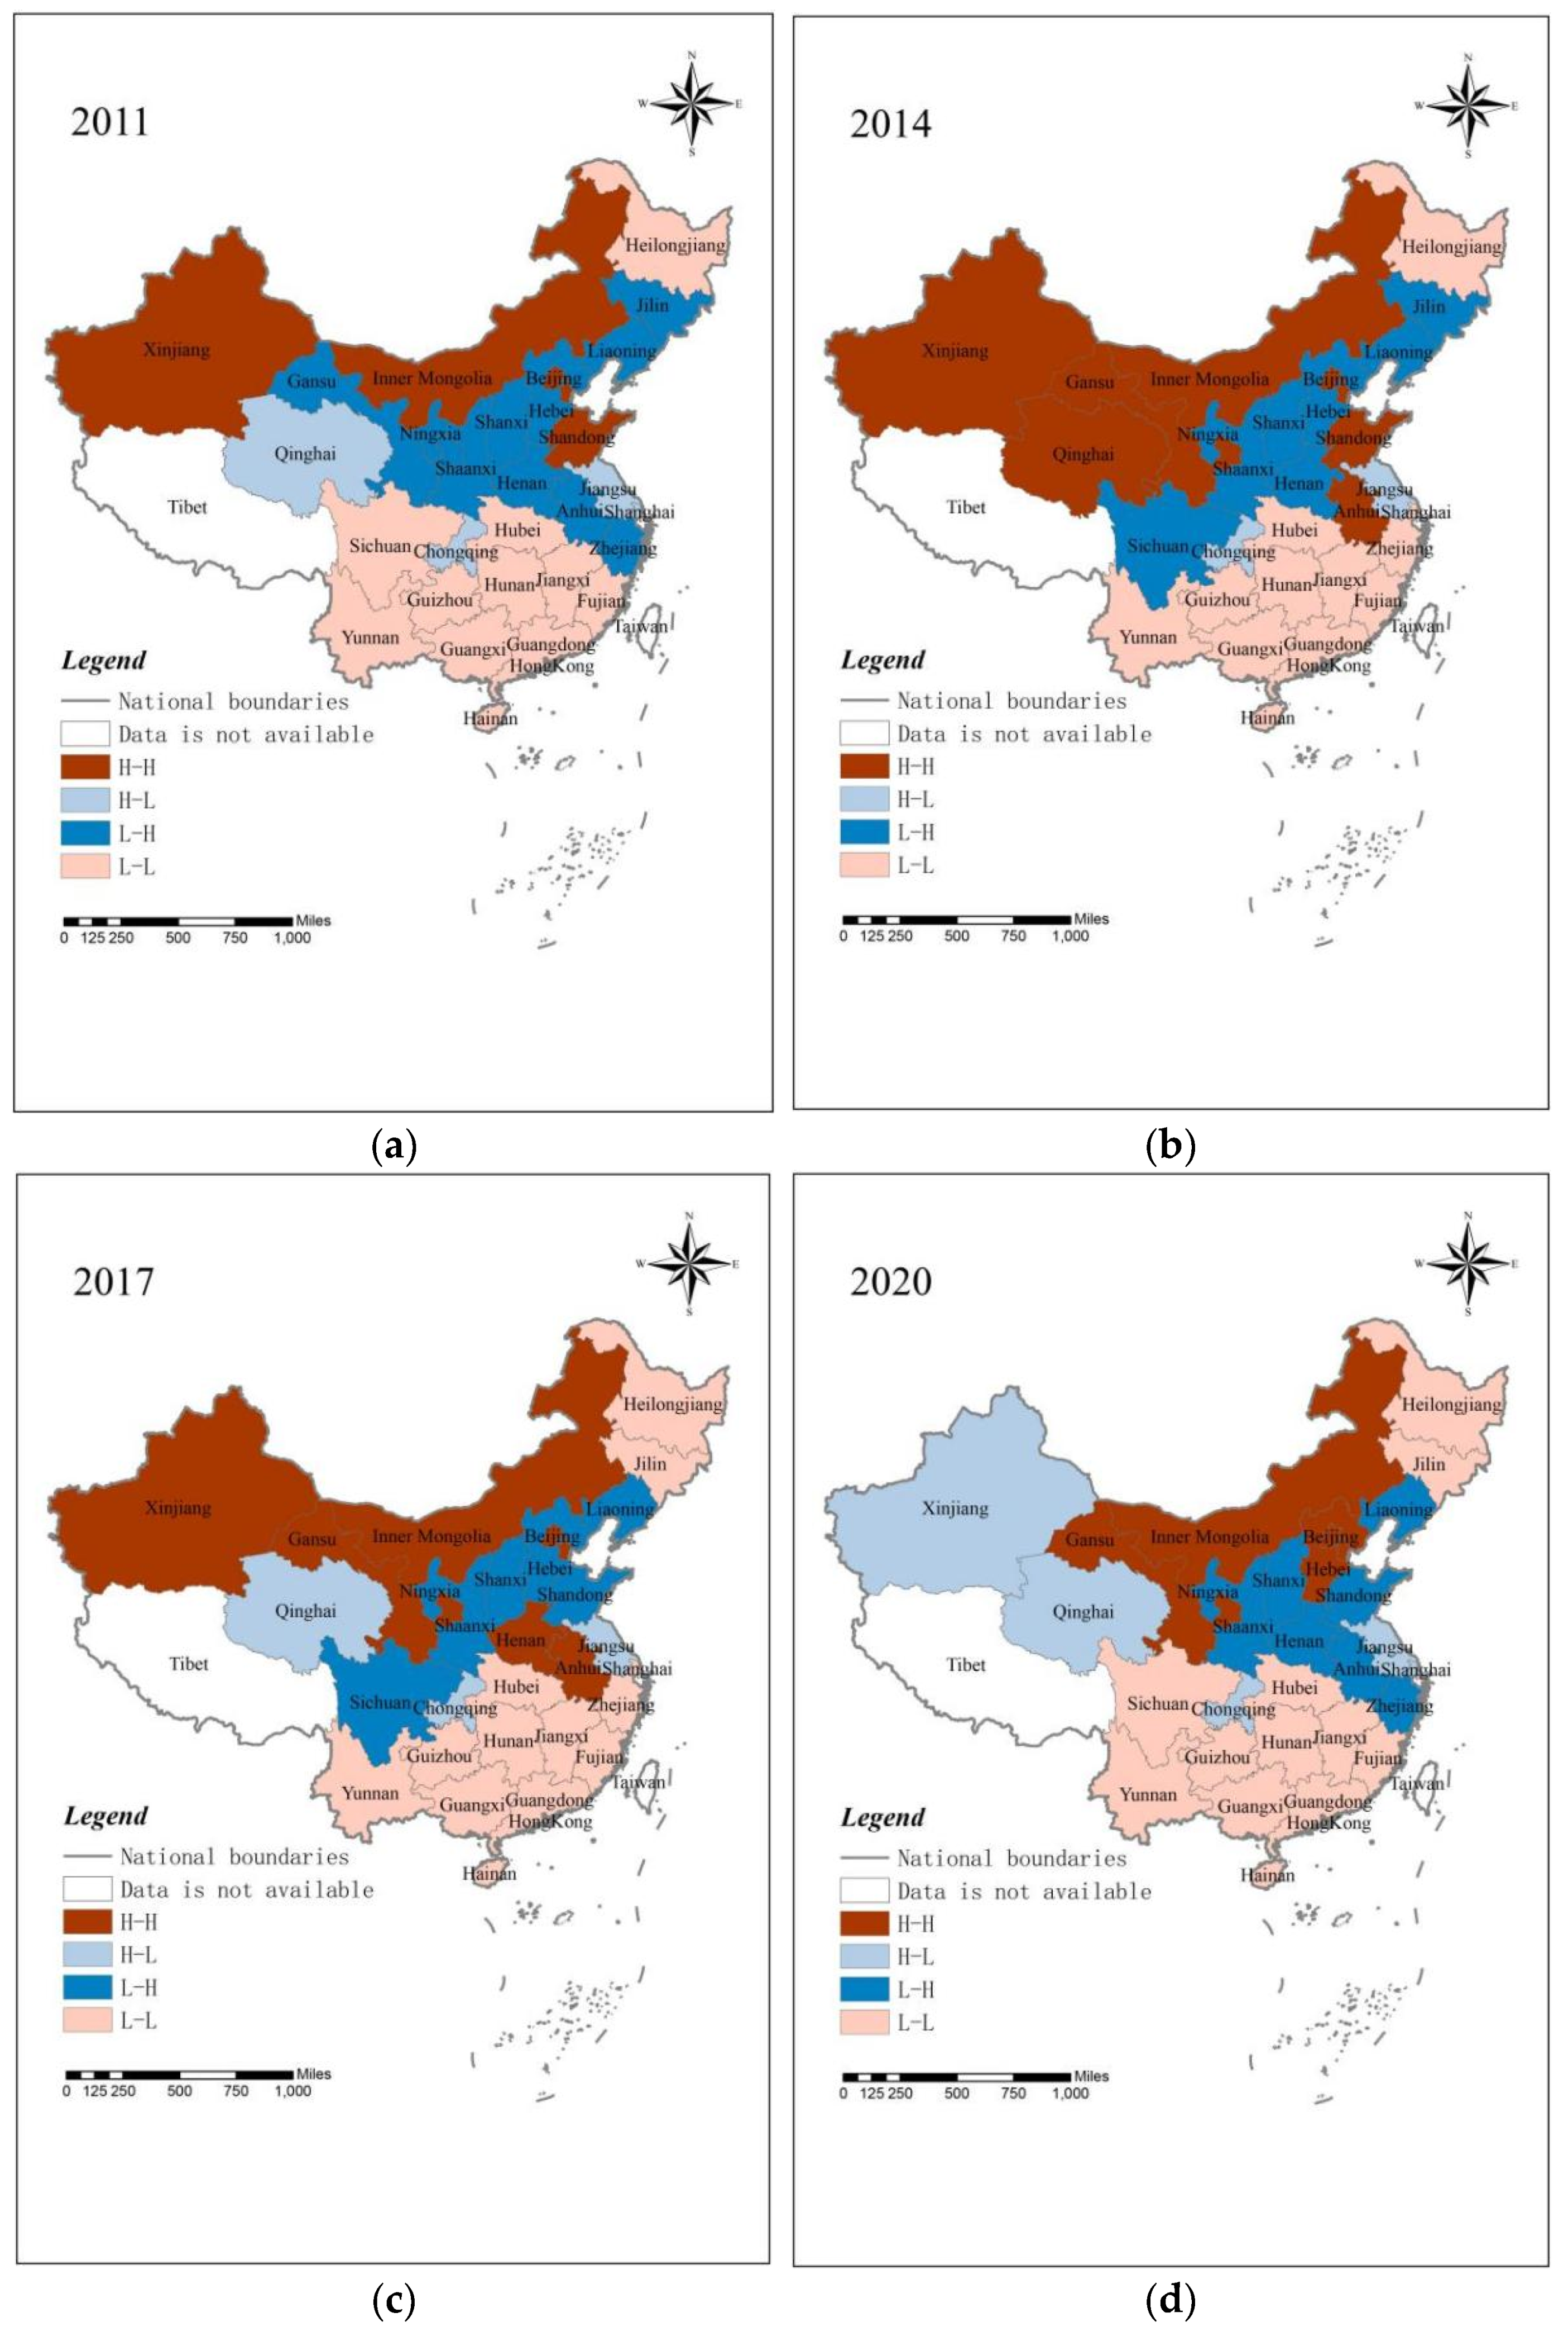
4.2.2. Local Spatial Correlations

The Local FGTIE Moran’s I was examined for 2011, 2014, 2017 and 2020 and is presented in Figure 2 using ArcGIS. As previously noted, we divided provinces into four clusters based on spatial correlations: high–high (H–H), high–low (H–L), low–high (L–H) and low–low (L–L). Provinces with L–H and L–L FGTIE accounted for 66.7% of the total sample, further confirming the existence of the spatial correlation suggested by the Global Moran’s I in the previous section.

4.3. Analysis of Influencing Factors

The above analysis confirmed the significant spatial correlation of FGTIE in China’s provinces. For a more accurate estimation, the traditional model was advanced to a spatial econometric model of the factors that affect FGTIE. Table 5 presents the test results of the spatial autocorrelation.
First, the LM test results indicate that both the LM statistic and the Robust LM statistic pass the significance test at the 1% level, indicating that the variables have spatial distribution characteristics, and the model necessitates the choice of a spatial econometric model. Thus, the estimated results using the spatial lag model and the SDM passed Wald and LR tests at a 1% significance level, indicating that the SDM is not reducible to SLM or SEM models. The SDM model is the optimal model. The Hausman test statistic was 67.19 and the p-value was significant at the 1% level, rejecting the original hypothesis that the random-effects model was superior to the fixed-effects model, and all subsequent analyses were based on the fixed-effects model. Finally, comparing the estimation results of the SDM under entity, time and two-way fixed effects, the coefficients of time fixed effects are larger, and the results of the LR test indicate that time is the optimal choice at a 1% significance level; thus, the SDM with time-fixed effects is confirmed to be the optimal model for analysing the factors influencing FGTIE and spatial spillover effects.

4.3.1. Identification of Influencing Factors

The coefficients of the SDM do not reflect the marginal utility of the influencing factors on the explanatory variables [36]; therefore, the direct, indirect and overall effects of each variable will be analysed using the adjacency matrix. Table 6 presents the results of the decomposition of the effects of each influencing factor.
For the direct effect estimation results, SS has a significant positive effect on provinces’ FGTIE, which demonstrates that the role of SS in alleviating poverty and guaranteeing the basic livelihood of the nation helps to enhance the ability of forestry employees to navigate risks and provide risk protection for forestry technological innovation behaviours. GS, IS and EDL have a significant negative effect on provinces’ FGTIE. The public nature of GS will cause provinces to use subsidies according to existing forestry development levels, thus engendering provincial prioritisation of fast-profit industries in the market and not using the subsidised funds for technological innovation. Regarding IS, the upgrade of forestry industry structures has a significant negative impact on FGTIE at this stage. The reasons for this are twofold. First, forestry industry structure upgrades often require overall technological upgrades, management model improvements, and product quality and production efficiency improvements, which require considerable capital investment, labour and resources in the forestry industry, leading to a lack of forestry technology innovation capacity. Second, FGTIE improvements not only rely on the tertiary industry alone, but also require regional industrial diversification at this stage. Therefore, improving FGTIE at this stage must include coordination of various relationships among forestry industries. This study reveals that the higher the level of economic development, the more emphasis is placed on economic development and not enough on forestry, with a negative effect on FGTIE. FDI, UL and EPS have significant positive effects on provinces’ FGTIE. FDI provides an external bonus for innovation development in forestry by absorbing advanced technologies from high-level developed countries, which saves innovation costs. When UL is relatively high, the increase in the urbanised population will reduce deforestation [2], and the resulting reduction in ecological pressure allows for more expenditures to improve FGTIE. EPS generates a Porter hypothesis effect on local forestry development. China has stricter standards for the ecological benefits generated by forestry under carbon neutrality, and strict environmental standards and enforcement have led the forestry industry to increase efforts to enhance green technology innovation.
According to the estimation results of spillover effects, no spillover effects are evident from GS, IS and UL, but there are significant spillover effects from SS, FS, EDL, FDI and EPS. This demonstrates that provinces cannot accomplish environmental goals independently, and the coordinated promotion of FGTIE at the national level is an inevitable choice in the context of carbon neutrality. Specifically, FS does not have a direct effect on provinces but has a significant negative spillover effect on neighbouring provinces. Because the forestry area attracts the flow of talent and affects the level of technological innovation, the effect on the province is not significant because the proportion of forestry employees is stable across provinces. SS, FDI and EPS all have significant positive spillover effects on neighbouring provinces, indicating that SS alleviates poverty and emboldens resistance to innovation risk, with the spillover effects for neighbouring provinces generating a safe range. FDI brings advanced production technologies, management concepts and high-end talent needed for technological innovation activities to China’s forestry industry, indicating that the development of China’s forestry industry has crossed the pollution haven stage that is common in developing countries. Strictly enforced environmental policies in a province could compel unclean forestry production activities to shift to neighbouring provinces with relaxed environmental policies [37], bringing some technological innovation energy to forestry in neighbouring provinces. There is a Porter hypothesis effect between green technology innovation in Chinese forestry and EPS, wherein EPS compels forestry production to accelerate innovation efficiency to reduce pollution for the incoming generation. EDL has a significant negative spillover effect on neighbouring provinces, indicating that this province effectively attracts HC clustering due to higher levels of economic development, which affects R&D and the transformation of forestry green economy development in neighbouring provinces.
Notably, in the analysis of the direct and spillover effects, we found no significant effect of HC on FGTIE, indicating that HC is not a necessary driver in the development of forestry technology innovation at this stage and that HC does not generate innovation benefits when the forestry industry currently requires the targeted replenishment of resource gaps.

4.3.2. Robustness Test

To establish the spatial econometric model and due to the influence of the spatial weight matrix on the regression results, our study is based on previous studies and uses different weight matrices to test for robustness [2]. In our empirical analysis, the spatial weight matrix is characterised by the adjacency weight matrix, and distance and economic weight matrices are used in the robustness test. Table 7 presents the estimation results of two different spatial weight matrices, indicating that both are consistent with the previous analysis. The significance remains essentially the same, confirming the robustness of the estimation results.

5. Conclusions and Policy Implications

5.1. Conclusions

Based on the panel data of 30 provinces in China, excluding Hong Kong, Macao, Taiwan and Tibet, from 2011 to 2020, a comprehensive evaluation system based on the super-efficiency SBM-DEA model was constructed to objectively measure the FGTIE in China, while exploring the spatiotemporal dynamics and spatial correlation of FGTIEs. We further constructed a spatial econometric model to empirically analyse the direct and spatial spillover effects of SS, HC, GS, IS, FS, EDL, FDI, EL and EPS on FGTIEs. The main conclusions are threefold.
(1)
In terms of spatiotemporal dynamics, China’s FGTIE has obvious spatial distribution differences and geographical imbalance, taking Sichuan–Shaanxi–Henan–Shandong as the boundary, and revealing a north–south polarisation pattern and overall spatial distribution characteristics of ‘high north and low south’. The provinces to the north of this boundary are primarily higher- and high-efficiency provinces, whereas the provinces to the south of the boundary are mostly medium- and low-efficiency provinces. From the perspective of time development, the FGTIE in the southwestern provinces is relatively stable, while that in the central and southeastern provinces are highly variable, and the overall development has the characteristics of concerted development.
(2)
In terms of spatial correlation, the FGTIE in China is not randomly distributed in space but exhibits significant spatial correlation, and the intensity of the spatial correlation demonstrates a ‘W’-shaped trend of ‘decline–rise–decline’, indicating that the characteristics of the global spatial pattern of FGTIE have not yet formed a steady state. However, a stable spatial aggregation relationship is evident among provinces.
(3)
FGTIE has a significant spatial spillover effect. Increased SS, FDI and EPS will advance local FGTIE, and neighbouring provinces’ FGTIE increase through positive spillover effects. EDL will restrict local FGTIE increases and suppress neighbouring provinces’ FGTIE increases through negative spillover effects. FS has no significant effect on local FGTIE increases, but will suppress neighbouring provinces’ FGTIE increases through negative spillover effects. UL will promote local FGTIE increase but has no spillover effect on neighbouring provinces’ FGTIE. GS and IS will suppress local FGTIE enhancements, with no spillover effect on neighbouring provinces.

5.2. Policy Implications

Based on the results of this study, there are three relevant recommendations for the future development of China’s forestry industry in the context of the macro environment and the nation’s carbon neutrality goals.
First, it is necessary to clarify the objective fact that the current development of green innovation in China’s forestry industry is slow and cannot be rushed. China’s forestry industry has a long way to go in moving from being resource- to technology-driven. Relying on the enhancement of FGTIE to promote China’s forestry economic growth has many weaknesses that require a solid technological base. At this stage, forestry development should focus on improving the efficiency of the exploitation of forestry resources while encouraging the development of intelligent forestry and other measures to continuously improve the quality of forestry management and the quality of forests and achieve high-quality forestry development.
Second, when formulating policies for carbon neutral targets, the government must consider the conditions, climate and natural resource environment of each province’s forestry development. Local forestry development goals should be reasonably mixed with a national carbon neutral strategy to rationalise the integration of local goals with national strategy and leverage each province’s existing strengths and the influence of neighbouring provinces to promote national development. Provinces with lower development levels should strengthen communication and cooperation with higher level provinces.
Third, the government should improve institutional mechanisms to promote the enhancement of China’s forestry industry by accelerating the establishment of an interactive promotion network among provinces for the development and advancement of major national afforestation projects to increase forest cover, build regional cooperation mechanisms for resource sharing and promote public–private partnerships in forestry. Such initiatives could strengthen scientific research and technological development regarding ecological protection, restorative approaches and modern forest management technology. The government must also strengthen and fortify its regulatory responsibilities to promote the healthy development of forestry ecosystems and the efficient and orderly use of forestry resources.

Author Contributions

Conceptualisation and funding acquisition, H.S.; methodology, data collection and analysis, C.Y.; writing—review and editing, H.S. and C.Y. All authors have read and agreed to the published version of the manuscript.

Funding

This research was funded by the National Natural Science Foundation of China, grant number 71972034.

Institutional Review Board Statement

Not applicable.

Informed Consent Statement

Not applicable.

Data Availability Statement

Data came from the China Statistical Yearbook, the China Statistical Yearbook on Forestry, the China Statistical Yearbook on the Environment and data published on authoritative Chinese forestry websites.

Conflicts of Interest

The authors declare no conflict of interest.

Appendix A

Table A1. The value of FGTIEs in 30 provinces of China from 2011–2020.
2011201220132014201520162017201820192020
Anhui0.28681 0.31999 0.53328 0.62964 1.01511 1.06569 0.63455 0.56960 0.45085 0.34729
Beijing1.11041 1.18311 1.21517 1.16818 1.15855 1.06797 1.41716 1.66109 1.64992 1.72036
Fujian0.31567 0.26330 0.33831 0.26769 0.40387 0.40003 0.38229 0.42795 0.40062 0.39796
Gansu0.47108 0.61483 0.64744 0.74693 1.01959 1.01224 0.66819 1.01182 1.10817 0.67128
Guangdong0.22269 0.26901 0.25419 0.30093 0.41748 0.43739 0.49725 0.39475 0.38823 0.41318
Guangxi0.12598 0.11886 0.14979 0.22610 0.18854 0.14376 0.11507 0.13163 0.30659 0.14462
Guizhou0.32328 0.47547 0.30822 0.39053 0.48196 1.19193 0.57260 1.11199 0.48512 0.28679
Hainan0.45083 1.14176 1.01110 0.34902 1.01399 1.02583 0.30589 0.47774 0.57097 0.27063
Hebei0.39461 0.41488 0.36993 0.46331 0.50641 0.72012 0.59143 1.02084 1.09262 1.06621
Henan0.51347 0.55419 0.55308 0.59228 0.62611 0.48084 0.63824 0.72663 0.65103 0.63143
Heilongjiang0.37990 0.41394 0.39339 0.44761 0.45439 0.39028 0.39534 0.35151 0.39606 0.21253
Hubei0.34870 0.37143 0.39812 0.41670 0.46265 0.45202 0.46266 0.42607 0.52408 0.38518
Hunan0.30357 0.35212 0.41416 0.46642 0.44008 0.36344 0.33373 0.32297 0.41309 0.43116
Jilin0.21688 0.20708 0.33937 0.31534 0.28849 0.32641 0.33753 0.35954 0.28429 0.29279
Jiangsu1.13737 1.13136 1.14138 1.14082 1.12667 1.12099 1.12491 1.14315 1.14500 1.14391
Jiangxi0.14086 0.22188 0.22155 0.19607 0.27219 0.27821 0.28518 0.34766 0.31238 0.34040
Liaoning0.41519 0.41325 0.39410 0.46524 0.39442 0.38403 0.33095 0.37125 0.45221 0.39529
Inner Mongolia1.15521 1.13760 1.15701 1.12512 1.10829 1.07201 1.09442 1.07569 1.05354 1.05008
Ningxia0.35711 0.36481 0.40995 0.37360 0.37513 0.39356 0.47904 0.53400 0.59987 0.48821
Qinghai1.19865 1.13802 1.09112 1.14088 1.08826 1.25363 1.25344 1.26791 1.25024 1.25716
Shandong0.62511 0.63127 0.68528 1.00513 1.04159 1.02402 0.59804 0.56740 1.02131 0.59015
Shanxi0.37812 0.56651 0.48840 0.46249 0.43481 0.53160 0.53172 0.61739 0.87944 0.46076
Shaanxi0.40860 0.42325 0.44870 0.54025 0.49999 0.42122 0.44068 0.42509 0.56170 0.41161
Shanghai1.04796 1.02221 1.02733 0.14460 0.28443 0.31210 0.38683 0.53303 1.31309 1.49219
Sichuan0.35643 0.36518 0.35143 0.42335 0.53969 0.60788 0.45635 0.40569 0.46592 0.45013
Tianjin1.39128 1.43114 1.28899 1.49944 1.40778 1.53590 1.63096 1.54385 1.58813 1.49361
Xinjiang1.16806 1.19954 1.16011 1.11680 1.25797 1.12750 1.15471 1.12102 1.09167 1.05826
Yunnan0.32455 0.38376 0.35339 0.43366 0.61815 0.35434 0.36945 0.36415 0.39503 0.34876
Zhejiang0.26357 0.28923 0.31452 0.30254 0.43064 0.39598 0.41747 0.47615 0.32597 0.40997
Chongqing0.57058 0.55912 0.48219 1.16080 1.14384 1.14496 1.06606 1.04143 1.03596 1.02411

References

  1. Panja, P. Deforestation, Carbon dioxide increase in the atmosphere and global warming: A modelling study. Int. J. Simul. Model. 2019, 27, 209–219. [Google Scholar] [CrossRef]
  2. Xu, G.; Dong, H.; Xu, Z. China can reach carbon neutrality before 2050 by improving economic development quality. Energy 2022, 243, 123087. [Google Scholar] [CrossRef]
  3. Piao, S.L.; Fang, J.Y.; Ciais, P.; Peylin, P.; Huang, Y.; Sitch, S.; Wang, T. The carbon balance of terrestrial ecosystems in China. Nature 2009, 458, 1009–1013. [Google Scholar] [CrossRef] [PubMed]
  4. Jiang, L. Research on the Connotation and Implementation Path of Innovation-Driven Development Strategy. Am. J. Ind. Bus. Manag. 2022, 12, 145–152. [Google Scholar] [CrossRef]
  5. Zhang, Y.; Kant, S.; Long, H. Collective Action Dilemma after China’s Forest Tenure Reform: Operationalizing Forest Devolution in a Rapidly Changing Society. Land 2020, 9, 58. [Google Scholar] [CrossRef] [Green Version]
  6. Wade, C.M.; Baker, J.S.; Latta, G.; Ohrel, S.B. Evaluating potential sources of aggregation bias with a structural optimization model of the U.S. forest sector. J. Forest Econ. 2019, 34, 337–366. [Google Scholar] [CrossRef]
  7. Magnus, K.; Anna, W. Using an optimization model to evaluate the economic benefits of industrial symbiosis in the forest industry. J. Clean. Prod. 2008, 16, 1536–1544. [Google Scholar] [CrossRef]
  8. Charnes, A.; Cooper, W.W.; Rhodes, E. Measuring the efficiency of decision making units. Eur. J. Oper. Res. 1978, 2, 429–444. [Google Scholar] [CrossRef]
  9. Guo, H.R.; Li, S.Q. Analysis on green technology efficiency and influencing factor in mining enterprises. Inno. Min. Res. Dev. 2022, 42, 187–192. [Google Scholar] [CrossRef]
  10. Wang, H.G.; Yang, T.T. Research on green technology innovation efficiency and its influencing factors of biomass power generation enterprises: Test based on Bootstrap-DEA method. Sci. Tech. Manag. Res. 2021, 41, 191–198. [Google Scholar]
  11. Shen, N.; Zhou, J.J. A study on China’s green innovation efficiency evaluation and functional mechanism based on hybrid DEA and SEM model. J. Ind. Eng. Manag. 2018, 32, 46–53. [Google Scholar] [CrossRef]
  12. Zhang, L.; Huang, L.J. Research on proactive technological innovation efficiency evaluation of industrial enterprises: Analysis based on improved three stage SBM-DEA model. J. Stat. Inf. 2020, 35, 50–61. [Google Scholar]
  13. Luo, L.W.; Liang, S.R. Green technology innovation efficiency and factor decomposition of China’s industrial enterprises. China Popul. Resour. Environ. 2016, 26, 149–157. [Google Scholar] [CrossRef]
  14. Huang, W.H.; Wang, M.D. Measurement of green technology innovation efficiency of manufacturing industry in Yangtze River Economic Belt. Stat. Decis. 2021, 37, 61–63. [Google Scholar] [CrossRef]
  15. He, Y.J.; Cai, D.Y.; Wang, S.T. Efficiency and influencing factors of industrial green technology innovation in Yangtze River Delta—In view of the government behavior. J. Jiangsu Univ. Sci. Tech. 2021, 21, 82–96. [Google Scholar] [CrossRef]
  16. Cheng, Q.W.; He, X.X.; Li, B.S. Green technology innovation efficiency and its influencing factors: Empirical study based on 35 industries in China. J. Cent.-South Univ. 2020, 26, 97–107. [Google Scholar] [CrossRef]
  17. Huang, L.; Wu, C.Q. Research on the cities’green technology innovation efficiency and its dynamic mechanism in the Yangtze River Economic Belt. J. Chongqing Univ. 2021, 27, 50–64. [Google Scholar] [CrossRef]
  18. Yao, C.; Liang, L. Super-efficiency DEA in the presence of infeasibility: One model approach. Eur. J. Oper. Res. 2011, 213, 359–360. [Google Scholar]
  19. Tone, K.A. Slacks-based measure of efficiency in data envelopment analysis. Eur. J. Oper. Res. 2001, 130, 498–509. [Google Scholar] [CrossRef] [Green Version]
  20. Wang, S.; Qu, Y.; Zhao, W.; Guan, M.; Ping, Z. Evolution and Optimization of Territorial-Space Structure Based on Regional Function Orientation. Land 2022, 11, 505. Available online: https://www.mdpi.com/2073-445X/11/4/505/pdf (accessed on 15 June 2022). [CrossRef]
  21. Wang, Z.B.; Liang, L.W.; Wang, X.J. Spatio-temporal evolution patterns and influencing factors of PM2.5 in Chinese urban agglomerations. Acta Geogr. Sin. 2019, 74, 2614–2630. [Google Scholar]
  22. Nathaniel, B.; Skrede, G.K.; Kyle, B. Space Is More than Geography: Using Spatial Econometrics in the Study of Political Economy. Int. Stud. Q. 2006, 50, 27–44. [Google Scholar] [CrossRef]
  23. Kimberly, J.R.; Evanisko, M.J. Organizational innovation: The influence of individual, organizational, and contextual factors on hospital adoption of technological and administrative innovations. Acad. Manag. J. 1981, 24, 689–713. [Google Scholar] [CrossRef]
  24. Liu, T.; Li, J.X. Temporal-spatial differentiation of forestry green total factor productivity in china and its influencing factors. World For. Res. 2020, 33, 56–61. [Google Scholar]
  25. Nikolay, N.; Stanislava, K.; Iveta, H.; Mariana, S.; Petar, A.; Blanka, G. Economic efficiency of forest enterprises—empirical study based on data envelopment analysis. Forests 2021, 12, 462. [Google Scholar] [CrossRef]
  26. Broadberry, S.; Gupta, B. The early modern great divergence: Wages, prices and economic development in Europe and Asia. Econ. Hist. Rev. 2006, 59, 2–31. [Google Scholar] [CrossRef] [Green Version]
  27. Guellec, D.; Potterie, B. The impact of public R&D expenditure on business R&D. Econ. Innov. New Technol. 2003, 12, 225–243. [Google Scholar] [CrossRef]
  28. Clausen, T.H. Do subsidies have positive impacts on R&D and innovation activities at the firm level? Struct. Chang. Econ. Dyn. 2009, 20, 239–253. [Google Scholar] [CrossRef]
  29. Oosterhaven, J.; Broersma, L. Sector structure and cluster economies: A Regional labour productivity. Reg. Stud. 2007, 41, 631–659. [Google Scholar] [CrossRef]
  30. Meulenaere, K.D.; Winne, S.D.; Marescaux, E. The Role of Firm Size and Knowledge Intensity in the Performance Effects of Collective Turnover. J. Manag. 2021, 47, 993–1023. [Google Scholar] [CrossRef]
  31. Keller, W.; Levinson, A. Pollution abatement costs and foreign direct investment inflow to U.S. states. Rev. Econ. Stat. 2002, 84, 691–703. [Google Scholar] [CrossRef]
  32. Antweiler, C.B.; Taylor, M. Is free trade good for the environment? Am. Econ. Rev. 2001, 4, 877–908. [Google Scholar] [CrossRef] [Green Version]
  33. Roger, M.F.; Fragkiskos, F.; Carmen, S.; Soo, H.L. Does foreign direct investment promote institutional development in Africa? Int. Bus. Rev. 2021, 30, 101835. [Google Scholar] [CrossRef]
  34. Bai, X.; Chen, J.; Shi, P. Landscape Urbanization and Economic Growth in China: Positive Feedbacks and Sustainability Dilemmas. Environ. Sci. Technol. 2012, 46, 132–139. [Google Scholar] [CrossRef] [PubMed]
  35. Zhang, H.; Zhu, Z.; Fan, Y. The impact of environmental regulation on the coordinated development of environment and economy in China. Nat. Hazard 2018, 91, 473–489. [Google Scholar] [CrossRef]
  36. Chen, X.Y.; Shao, S.; Tian, Z.H.; Xie, Z.; Yin, P. Impacts of air pollution and its spatial spillover effect on public health based on China’s big data sample. J. Clean. Prod. 2017, 142, 915–925. [Google Scholar] [CrossRef]
  37. Dong, Z.Q.; Wang, H. Local-neighborhood effect of green technology of environmental regulation. China Ind. Econ. 2019, 100–118. [Google Scholar] [CrossRef]
Figure 1. (a) Spatiotemporal distributions of FGTIE in 2011; (b) Spatiotemporal distributions of FGTIE in 2014; (c) Spatiotemporal distributions of FGTIE in 2017; (d) Spatiotemporal distributions of FGTIE in 2020.
Land 11 01081 g001
Figure 2. (a) Local Moran’s I of provincial FGTIE for 2011; (b) Local Moran’s I of provincial FGTIE for 2014; (c) Local Moran’s I of provincial FGTIE for 2017; (d) Local Moran’s I of provincial FGTIE for 2020.
Land 11 01081 g002
Table 1. Meaning and indicators of inputs and outputs for FGTIE evaluation.
VariableNameMeaning
InputsForestry capitalThe number of forestry innovation funds invested by the Chinese government.
Forestry labourThe number of forestry science and technology-related employees.
Forestry resourcesThe proportion of provincial forest cover.
Forestry energy consumption.
OutputsGood outputsThe number of forestry-related patents.
New forested area in the province.
Rate of forest pest and rodent control.
Bad outputsSulphur dioxide emissions from the forestry industry by province.
NOx emissions from forestry industry by province.
Soot emissions from forestry industry by province.
Table 2. Descriptions of each influencing factor.
NameMeaning
SSThe average annual wage of unit workers in the forestry system in each province.
HCThe number of forestry station workers in each province with an education level of short-cycle courses or above.
GSTotal state investment in forestry.
ISThe ratio of tertiary provincial forestry sector output to GDP.
FSThe ratio of forestry employees to the total number of employees.
EDLProvincial GDP.
FDIThe amount of actual foreign direct investment in each province.
ULThe ratio of year-end urban population to year-end total population.
EPSThe ratio of the amount of national investment in controlling environmental pollution to GDP.
Table 3. Descriptive statistics.
NameMeanStd.MaximumMinimum
FGTIE0.6460.3820.1151.720
SS57,00032,00014,000210,000
HC2404.3171377.17011.0007249
GS1,400,0001,600,00053,00011,000,000
IS0.1570.1090.0010.613
FS0.0020.0030.0000.017
EDL26,00021,0001670.440110,000
FDI5,300,0005,200,000813.87323,000,000
UL58.18412.06234.960089.600
EPS1.4100.7850.2994.466
Table 4. Global Moran’s I provincial FGTIE values.
YearMoran’ Iz-Valuep-ValueYearMoran’ Iz-Valuep-Value
20110.0452.2840.01120160.0291.7780.038
20120.0201.5560.06020170.0823.3790.000
20130.0362.0040.02320180.0963.7300.000
20140.0712.9940.00120190.1244.5110.000
20150.0321.8710.03120200.0803.2710.001
Table 5. Results of model identification.
VariablesValuep-Value
LM_Spatial lag189.5830.0000
Robust LM_Spatial lag14.7950.0000
LM_Spatial error211.8800.0000
Robust LM_Spatial error37.0930.0000
LR_Spatial lag25.9500.0021
Wald_Spatial lag36.5000.0000
LR_Spatial error23.9100.0044
Wald_Spatial error34.7100.0001
Hausman67.1900.0000
Table 6. Benchmark estimation results.
Direct EffectIndirect EffectTotal Effect
Coef.t-ValueCoef.t-ValueCoef.t-Value
SS0.000 ***3.030.000 ***2.740.000 ***3.14
HC0.000−0.240.0000.130.0000.10
GS−0.000 *−1.910.0000.680.0000.35
IS−0.294 *−1.660.5480.470.2550.21
FS11.2001.36−142.765 ***−3.20−131.569 ***−3.08
EDL−0.000 ***−4.32−0.000 ***−3.63−0.000 ***−3.94
FDI0.000 ***5.070.000 *1.760.000 **2.38
UL0.006 ***2.980.0020.150.0080.72
EPS0.102 ***4.180.540 ***3.710.641 ***4.34
Note: ***, ** and * denote the significance level at 1%, 5%, and 10%, respectively.
Table 7. Results of robustness tests.
Direct EffectIndirect EffectTotal Effect
Coef.t-ValueCoef.t-ValueCoef.t-Value
Robustness test 1
SS0.000 **2.390.000 *1.670.000 **2.44
HC0.000−0.810.000−1.010.000−1.06
GS0.000−1.600.0001.260.0000.71
IS−0.349 *−1.840.6311.140.2820.46
FS21.481 **2.58−71.660 ***−3.06−50.179 **−2.29
EDL−0.000 ***−3.56−0.000 ***−3.88−0.000 ***−4.27
FDI0.000 ***4.660.000 **2.060.000 ***2.93
UL0.005 **2.37−0.008−1.23−0.003−0.45
EPS0.114 ***4.810.321 ***3.630.434 ***4.64
Robustness test 2
SS0.000 ***2.850.000 **2.320.000 ***2.74
HC0.000−0.430.000−0.260.000−0.29
GS−0.000 *−1.670.0000.840.0000.54
IS−0.285−1.580.4520.380.1670.14
FS12.8301.54−142.234 ***−3.18−129.401 ***−3.02
EDL−0.000 ***−4.10−0.000 ***−3.59−0.000 ***−3.87
FDI0.000 ***4.910.000 *1.920.000 **2.48
UL0.006 ***2.70−0.003−0.300.0020.18
EPS0.107 ***4.370.548 ***3.610.655 ***4.26
Note: ***, ** and * denote the significance level at 1%, 5%, and 10%, respectively.
Publisher’s Note: MDPI stays neutral with regard to jurisdictional claims in published maps and institutional affiliations.

