Abstract
Citizen science has become an increasingly popular approach to scientific data collection, where classification tasks involving visual interpretation of images is one prominent area of application, e.g., to support the production of land cover and land-use maps. Achieving a minimum accuracy in these classification tasks at a minimum cost is the subject of this study. A Bayesian approach provides an intuitive and reasonably straightforward solution to achieve this objective. However, its application requires additional information, such as the relative frequency of the classes and the accuracy of each user. While the former is often available, the latter requires additional data collection. In this paper, we present a two-stage approach to gathering this additional information. We demonstrate its application using a hypothetical two-class example and then apply it to an actual crowdsourced dataset with five classes, which was taken from a previous Geo-Wiki crowdsourcing campaign on identifying the size of agricultural fields from very high-resolution satellite imagery. We also attach the R code for the implementation of the newly presented approach.
1. Introduction
Citizen science, in which the general public contributes to the generation of knowledge through, for example, data collection, interpretation, analysis and/or research design, has expanded greatly over the last two decades [1,2,3]. In Haklay’s topology of citizen participation in citizen science [4], crowdsourcing, which is defined as the outsourcing of tasks to the crowd [5], is the most basic level of citizen contribution, usually involving data collection. Both citizen science and crowdsourcing are being used more and more within a variety of fields, including land use and land cover [6], astronomy [7], ecology [8], hydrology [9], crop monitoring [10] and land consolidation [11], among others. Citizen science is a powerful tool for data collection because it provides researchers with access to data that are potentially collected at higher spatial and temporal frequencies than those of more traditional data sources, such as censuses and household surveys, and with lower potential costs [12]. These advantages have led to the proliferation of citizen science projects, particularly given the limited resources often available to undertake research [13]. At the same time, citizen science projects provide users with the opportunity to be involved in a range of projects that can increase their scientific knowledge and skills while being engaged within a broader community, along with many other motivations and positive incentives to participate [14].
There are many different ways in which citizens can contribute to citizen science and crowdsourcing projects. This diversity of activities has been captured in a recently developed conceptual model of citizen participation [15]. One type of task is in the area of classification, which uses the visual interpretation skills of humans to identify features found in images. One of the most famous examples is the classification of galaxies in the Galaxy Zoo project, which has also led to the discovery of new galaxies by citizens [16]. Once enough images have been classified by citizens, the use of computer vision algorithms from the field of machine learning is increasingly being used to do the same classification automatically, often with very good results [17]. Hence, citizen science can provide very useful training data for automating tasks that were previously only carried out manually. Geo-Wiki is another example of a crowdsourcing tool that involves citizens in the visual interpretation of very high-resolution satellite imagery to identify land cover and land use [6]. For example, Geo-Wiki has been used previously in the collection of data on agricultural field sizes in order to understand their distribution globally, which has implications for land management and food security [18]. Data from this campaign are used in this study as described in the sections that follow.
In addition to the use of such data for different scientific and/or humanitarian applications, the quality of the data from citizen science and crowdsourcing has been the subject of intensive research in this field [19,20,21,22], including comparisons in accuracy between experts and volunteers [23]. Other papers have outlined the variety of methods that can be used to improve data quality in crowdsourcing, e.g., [24]. One common method of quality control in tasks related to image interpretation has been to give the same image to multiple volunteers, thereby providing an indication of agreement between contributors for each image classified. Simple Majority and Bayesian approaches are the most popular methods used to aggregate these multiple classifications into a final answer [25,26,27]. While Simple Majority is the easiest classification rule, it has problems. First, for more than classes, there is no guarantee that responses will result in a majority. Secondly, there is no intuitive way to weigh the opinions of different categories of users if such categories exist (e.g., experts and amateurs). Finally, the relative frequency of the classes is not considered: if a particular class is known to be extremely rare, one would intuitively need a more substantial majority to identify it as such, as compared to an extremely common class. A Bayesian approach provides a solution to the above problems via two mechanisms. First, instead of simply identifying the most popular voted category, the Bayesian approach produces so called posterior probabilities for each item belonging to each possible class. This may still result in equally likely choices when the categories are assumed to be equally prevalent and the users equally accurate. However, that will generally not be the case. Moreover, these posterior probabilities directly reflect our confidence in the obtained classification. Secondly, it allows for the inclusion of external—prior—information on both the relative prevalence of classes and the user accuracy. While the former is often available, the latter may present more of a challenge to quantify. This does not technically invalidate the Bayesian approach since one can always assume equal category prevalences and constant user accuracies, but it makes it less useful.
Approaches to overcome this challenge have included using user-recorded confidence in their classification as a proxy for user accuracy. This method is problematic as some users overestimate their abilities while other users underestimate their abilities [28]. A more sophisticated and reliable approach has been to use variations of the Independent Bayesian Classier Combination (IBCC) model, originally defined by [29], to infer user accuracies and aggregate citizen scientists’ image classifications [7,30]. The IBCC does not require any ground truth control images to estimate user accuracy or any additional information from the users. However, the iterative method of estimating user accuracy and aggregating classifications adds to the computational expense and complexity of the method.
Here we present a two-stage approach in which a subset of the images are ground truth control points and are used to calculate an estimate of user accuracy, followed by a second classification stage that uses Bayes’ formula to combine the user accuracy estimates from stage one with the relative frequency of classes, and user classifications, to obtain the aggregated classification for each image. This approach is simple and efficient to implement, has a reliable measure of user accuracy and leverages classifications on images with known ground truths that is often included in citizen science projects within a training stage. In addition, we use data from a previous Geo-Wiki campaign on field size in which participants were asked to classify the size of agricultural fields using a visual interpretation of very high-resolution satellite images. Several classifications per geographical location were collected, and some of the geographical locations were ground truth control points. We start the paper by examining how sensitive Bayesian inference is to assumptions about user accuracy. We then explain how to estimate the number of responses per item needed to achieve a pre-specified classification accuracy when (i) the user accuracy is perfectly known and when (ii) it must be estimated first. For the latter case, we provide recommendations for the optimal distribution of resources between estimating the user accuracy and the classification stage. We demonstrate the approach using both a hypothetical binary class data set and one that has multiple classes from the Geo-Wiki campaign.
2. Materials and Methods
The methods are first presented for a two-class model, e.g., if the land cover were to be classified into forest and non-forest based on visual interpretation. This is followed by a demonstration of how the method can be generalized to multiple classes, e.g., if there were several land cover classes visually interpreted. Finally, we present a dataset from a previous Geo-Wiki campaign on agricultural field size, interpreted as five classes from very small to very large, to show how this proposal’s two-stage approach could work in practice.
2.1. Two Class Model
Consider first a case where each item belongs to one of the two classes or , and the relative frequencies of these two classes are known to be and . Assume that the users are equally accurate at identifying either of the two classes and all items are of equal difficulty to classify, so that , where is the class to which the user u assigns the item i, and U denote the total number of users. In the context of a two-class land-cover classification (e.g., forest, non-forest), this would just be the dataset that was collected during the campaign where we have multiple classifications of the same location but from different users.
In this case, a particular item has been classified by n users, respectively, as , so the easiest way to assign it to a class is by the Simple Majority (SM) rule:
where is an indicator function that equals 1 when the condition “•” in the subscript is true and 0 otherwise. For example, if a location was classified four times as forest and one time as non-forest by five different users, we could use the SM rule to assign forest to that location because it is the majority answer.
Another way to classify an item is to apply Bayes’ Formula (BF) to obtain a posterior probability of belonging to class :
and then to assign the item to the class if , i.e., for common accuracy , if
and to otherwise. Note that when and the classes are equally likely, this will be the same as the Simple Majority rule. However, when one class is more dominant than the other, i.e., , the rules may be quite different. The SM rule is identical to the BF rule as , i.e., when the users are assumed to be absolutely accurate. Finally, as n increases, the relative importance of the term diminishes, and the two methods will again give similar results.
Figure 1 shows the overall classification accuracy as a function of the user accuracy , for and for the dominant and the minority class as the result of applying the SM and BF rules, respectively. The graph shows that a higher overall BF accuracy is achieved by better identifying the dominant class at the cost of a poorer identification of the minority class.
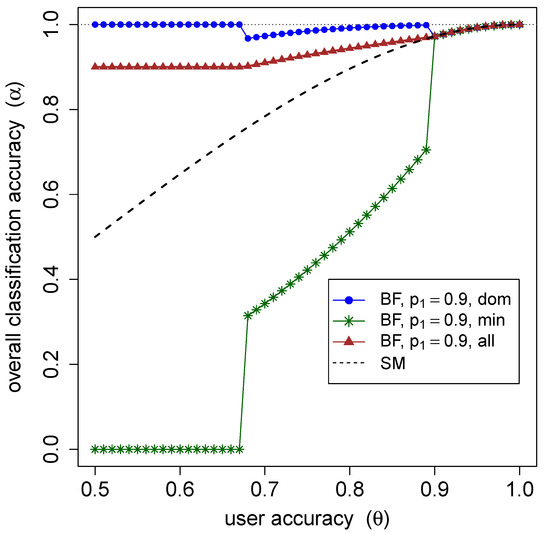
Figure 1.
The overall classification accuracy of the Simple Majority (SM) and Bayes Formula (BF) for the dominant and minority classes and overall as the function of user accuracy (assumed fully known) for . BF performs better than SM on average by better identifying the dominant class at the cost of misidentifying the minority class.
Given the prior class frequencies and , the true user accuracy and the perceived user accuracy and n responses per item, the accuracy of the BF classification can be evaluated as
where
and is the cumulative probability function of the binomial distribution with parameters n and p.
Assuming that the class frequencies and user accuracies are perfectly known, one can use these equations to perform a sort of statistical power analysis by producing a plot of the overall classification accuracy as a function of n, and thus identifying the minimum number of responses necessary to reach a pre-specified accuracy level. Figure 2 illustrates such an analysis for and . Here, in order to reach an average accuracy of at least , one needs at least 8 responses per item.
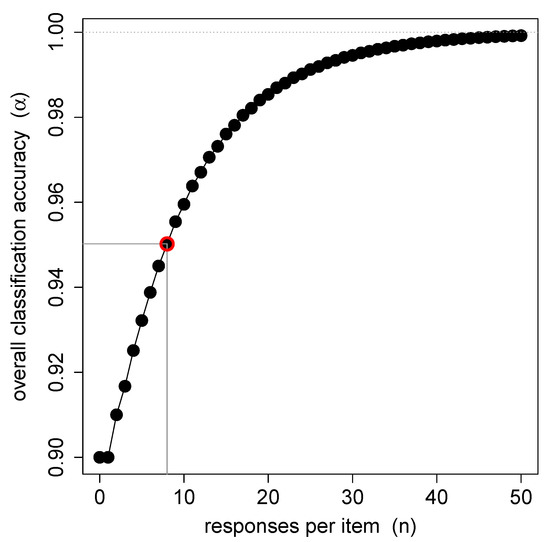
Figure 2.
The overall classification accuracy as a function of the number of responses per item n estimated for BF with and and fully known. Based on these calculations, one needs at least 8 responses per item to achieve an accuracy of .
While it is often reasonable to assume that the relative frequencies of the classes and are known a priori, little or no information may be available on the user accuracies. However, as Figure 3 illustrates in the case of and , getting the user accuracy correct is important as the final classification accuracy may be quite sensitive to these assumptions.
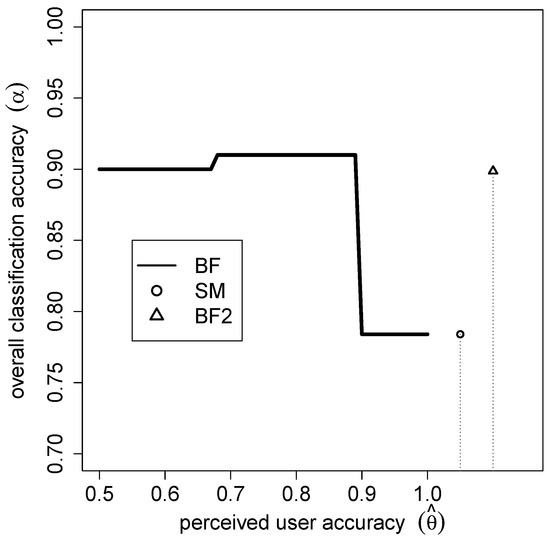
Figure 3.
The overall classification accuracy for BF as a function of the perceived user accuracy when , and . The classification user accuracy for SM and for BF2 when and are given for comparison. For the same cost , BF2 generally performs better than the other methods.
To obtain information on user accuracy, we propose that a testing stage is added to the set-up of the crowdsourcing campaign. During this stage, all users will classify a set of m ground-truthed items for which the ground truth is known. Given correct identifications out of m returned by user u, the accuracy of user u may then be estimated as
where a and b are values that represent prior information about the user’s accuracy. We have chosen this Bayesian estimator rather than the standard one for several reasons as follows: (i) it allows knowledge about user accuracy from other similar exercises to be incorporated, if available; (ii) it avoids the problematic estimated values of 0 and 1, which tend to occur in small samples; and (iii) it has a more general form, allowing for the standard estimator with and . In the absence of any other information, it is common to choose either or some smaller but still equal values for the two.
Our proposed experimental set-up thus consists of two stages: the testing stage and the classification stage. During the former, the user accuracies are estimated, and during the latter, the classification data are combined with these user accuracies via BF to assign each item to the class with the highest posterior probability. In the testing stage, each user classifies m items, and in the classification stage, each classified item is rated by n users, bringing the classification effort (i.e., cost), defined as the total number of classifications, to . We will refer to this classification set-up as BF2.
Simulations can be used to estimate the overall classification accuracy resulting from the specific distribution of resources between the two stages, given assumptions about , , , a and b. Simulations, performed for all reasonable combinations of m and n, are as follows:
- For each user, simulate the number of correct testing stage responses out of m from the Binomial distribution, and thus estimate each user’s accuracy as in Equation (6).
- For each item, simulate the responses obtained from the set of users classifying this item, using the true user accuracy .
- Apply BF to the estimated user accuracy from step 1 and classification responses from step 2 to produce the final classification as in Equation (2).
- Evaluate the overall accuracy as the proportion of correct identifications.
Figure 4 shows the overall classification accuracy estimated for items and users with and for . The prior parameters for the user accuracy were set at and , corresponding to the low expectation of individual user accuracy. The solid iso-accuracy contours show that the same accuracy may be achieved with different combinations of m and n. The dotted iso-cost lines show different m and n combinations that result in the same overall classification effort. The optimal allocation of resources, shown as black points on the graph, is then reached at the tangent points of the two types of curves. One may thus use such simulations to identify the highest accuracy reachable with a certain set of resources (i.e., the iso-accuracy curve, furthest from the origin, tangent to the given iso-cost line). Or alternatively, one may identify the total number of responses and the best distribution necessary to reach a certain goal accuracy. In the example illustrated in Figure 4, the highest accuracy reachable with responses is . Correspondingly, the minimum number of responses necessary to achieve the minimum accuracy of is , of which each of the users identifies 11 items in the first testing stage, and then each of the items is identified 12 times to provide the final classification.
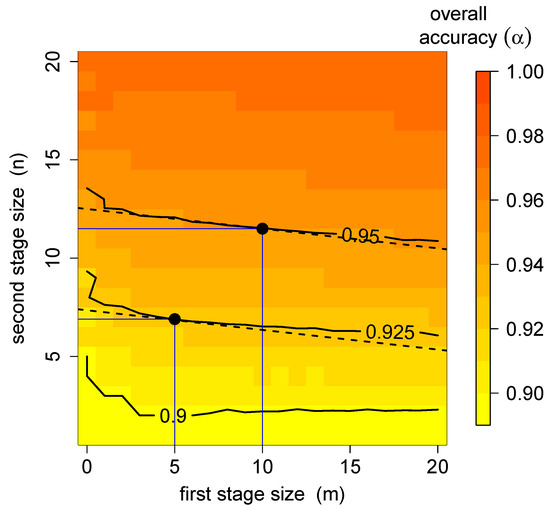
Figure 4.
The overall classification accuracy for BF2 as a function of m and n, the first stage and second stage sizes for , , a = 6 and . The solid lines are the iso-accuracy lines, corresponding to combinations of m and n, resulting in the same accuracy. The dashed lines are the iso-cost lines, corresponding to combinations of m and n, resulting in the same cost or effort. The tangent points of iso-cost and iso-accuracy lines correspond to optimal resource allocation.
Figure 5 shows that BF2 will significantly outperform SM, especially when the number of users available for the second stage (n) is small. It also shows that the effect of the number of user ratings involved in the first stage (m) becomes marginally smaller. Thus, while increasing this number from to will increase the overall classification accuracy in this particular case by several percentage points, the effect of a further increase from to on the overall accuracy is negligible.
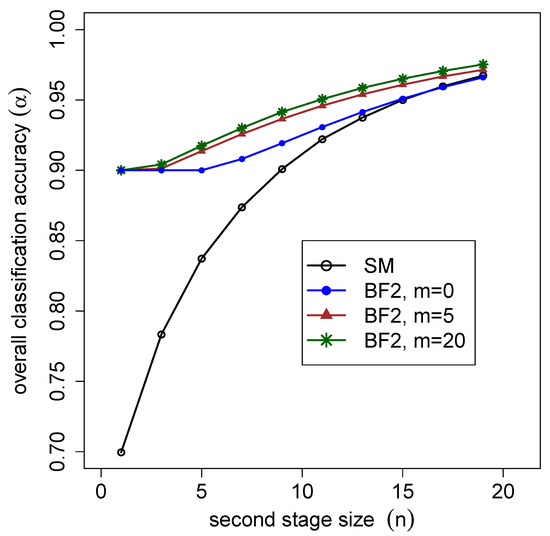
Figure 5.
Comparison of the overall classification accuracy for Simple Majority (SM) and the 2-stage Bayesian approach (BF2) as a function of m and n, the first stage and second stage sizes, for , , and . BF2 consistently outperforms SM. Implementing the 2-stage testing improves accuracy, although the marginal effect of adding further tests (m) decreases.
Figure 3 compares the accuracy of the above BF2 set-up to those of the SM and the BF with , which corresponds to the comparable total effort of classifications. While the single-stage BF performs better than BF2 for a close to the true value, BF2 performs well overall and is a less risky proposition. Furthermore, note that our prior assumption of user accuracy, which was corrected somewhat during the testing stage of BF2, would have resulted in the expected classification accuracy of , i.e., very slightly lower than that of BF2.
The slope of the iso-cost lines in Figure 4 is , i.e., if the number of users is high with respect to the number of items, the curves will be steep, and optimal solutions will tend to require a small m and large n. On the contrary, if the number of users is relatively small, the optimal solutions will occur at a large m and small n. In the former case, an optimal solution may be , i.e., a simple one-stage BF classification, which is thus a special case of the proposed two-stage BF2. All the simulations for this study have been implemented in R [31], and the relevant code is provided in Appendix A.
2.2. Generalization of the Model to K Classes
If the number of classes , let describe the class to which the user u assigned a particular item. Then, applying BF, we get the posterior probability of an item belonging to a class C as
Here, is the probability that the user u will classify an item from class c as k. If is the number of images of class c identified as k by user u in the first stage, this probability can be estimated as
where encodes our prior information about user accuracy. In the absence of more-detailed knowledge, one may choose for and for . Then, the prior probability of identifying any class correctly is , similar to the binomial set-up.
2.3. Data from the Geo-Wiki Field Size Campaign
To provide an illustration of the above methods, we use data collected from a Geo-Wiki campaign on agricultural field sizes [18]. For the purpose of the campaign, fields were defined as agricultural areas that are used for the growing of annual and perennial crops, which are separated by roads, permanent paths, trees or shrub shelter belts or the presence of different crop types. However, this can also include pastures, hay and fallow because of the difficulties in differentiating between these different types from visual interpretation of satellite imagery. We defined five field categories as follows (more details are provided in [18]):
- Very large fields: >100 ha;
- Large fields: 16 to 100 ha;
- Medium fields: 2.56 to 16 ha;
- Small fields: 0.64 to 2.56; and
- Very small fields: <0.64 ha.
To create the sample for classification, we first produced a layer of maximum agricultural extent by combining different land cover maps and cropland layers, e.g., GlobeLand30 and the European Space Agency’s CCI land cover map, through a union overlay operation. From this, we generated a randomly stratified sample of 130 K locations globally.
The Geo-Wiki application is comprised of ’branches’, where a new branch was created for this campaign. The application uses satellite imagery from Google Maps and Microsoft Bing Maps for visual interpretation, with a link to Google Earth so that users can view historical satellite imagery. The Geo-Wiki branch was customized for field size data collection and is shown in Figure 6.
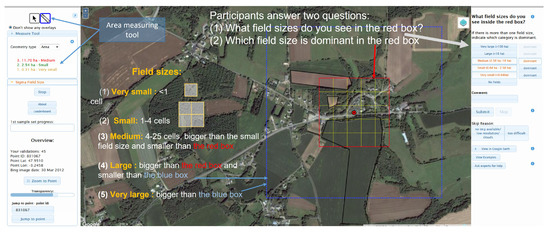
Figure 6.
The Geo-Wiki interface for the identification of agricultural field size showing the questions that volunteers need to answer, the area measuring tool and guidance on how to estimate field sizes using the grid squares. Source of imagery: Google.
During the campaign, the participants were shown a random location and were then asked to identify what field size categories were present in the red box, which is a 16 ha area divided into 25 grid cells. If more than one field size was selected, the participants were then asked to indicate which one was dominant. The grid squares were intended to help participants identify field sizes as follows:
- Very small: fields smaller than the 1 grid square;
- Small: fields between 1 and 4 grid squares cells (2.56 ha);
- Medium: fields smaller than the red box (16 ha) and larger than 4 grid squares;
- Large: fields smaller than the blue box (100 ha) and larger than the red box; and
- Very large: fields larger than the blue box.
An area measuring tool was provided (Figure 6) for delineating fields manually in order to help with calculating their sizes.
As part of the campaign design, it was decided that each location would be visited by at least three different volunteers so that this information could be used for quality control. Other techniques used in the campaign that are related to quality control and gamification are outlined in [18].
The campaign ran for 4 weeks in June 2017, where a total of 130 users classified 119,596 images. Of these, 2085 were ground truth control points, resulting in a total of 355,013 field size classifications, of which 44,495 were classifications of the control points. Hence, it is possible to use this data set in this paper to demonstrate how a model with K classes can be applied retrospectively in a two-stage approach to simulate how the crowdsourced data collection could have been optimized. Other information about the campaign includes: the number of responses per user varied from 1 to 5655, with a median of 14 and a mean of 342.3; and the number of responses per image varied from 1 to 153, with a median of 22 and a mean of 21.34.
3. Results
Using the classifications of the expert control points (or ground truth data) by the Geo-Wiki volunteers obtained during the field size campaign, we can retrospectively undertake step 1 and calculate a confusion matrix, shown in Table 1. It shows the relative frequencies of the five classes (where 1 is very large and 5 is very small) among the control points, as well as the observed identification accuracy below this. One can see, for example, that class 5 (very small fields) was the easiest to identify , while class 4 (small fields) was the hardest to identify with .

Table 1.
Observed accuracy (absolute and ) of identifying field sizes. GT is the expert control points or ground truth, and ’Classified as’ refers to the user classifications. The numbers 1 to 5 are the field size classes ranging from very large to very small.
Using these relative class frequencies and user accuracies, we can calculate the number of classifications needed at each location for different desired overall accuracies, which is shown in Figure 7. For example, to achieve an overall classification accuracy of with the minimal possible cost, each user should be assigned tasks during the first stage, and each image should be identified by users during the second stage.
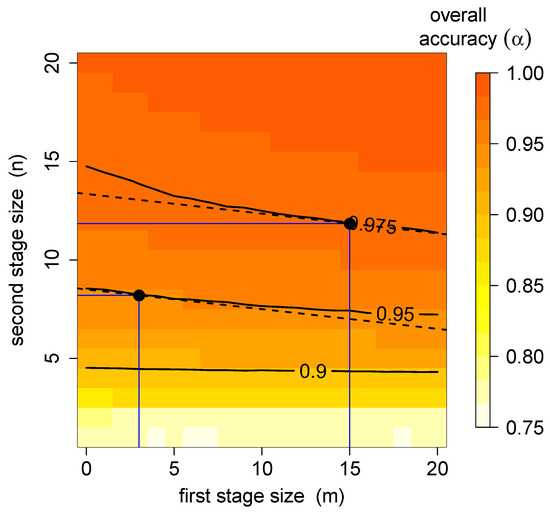
Figure 7.
The overall classification accuracy for BF2 as a function of m and n, the first stage and second stage sizes. The solid lines are the iso-accuracy lines, corresponding to combinations of m and n, resulting in the same accuracy. The dashed lines are the iso-cost lines for the class case study based on the Geo-Wiki data. The tangent points correspond to optimal resource allocation.
4. Discussion
Citizen science often employs volunteers in various classification tasks, including those of relevance to land use and land cover [6]. One of the most common approaches used to ensure data quality is to provide the same task to multiple users, e.g., classification of the same image by many, and to then combine the classifications into a single result using SM, e.g., [32]. However, SM has been shown to have a number of drawbacks in terms of accuracy but also in terms of knowing how many classifications are needed to achieve a certain accuracy [33]. The latter is also related to minimizing the number of tasks given to the crowd so as not to waste their efforts. A recent paper also applied a Bayesian approach to this problem in the context of image classification for land cover but was limited to two classes, and it did not implement a two-stage approach [34]. Hence, a large number of potential classifications were needed for each image to reach a high level of confidence. In contrast, the approach taken here reduces the overall efforts required of the crowd to achieve the same overall accuracies.
Moreover, we have mostly concentrated on the overall accuracy rather than class-specific accuracy. Given the class-specific prevalences and the class-specific accuracies , the overall accuracy will be a weighted sum:
Therefore, in order to achieve better accuracy overall, one would want to focus on accurately classifying the dominant, more prevalent classes rather than the rare ones. However, a different objective can be achieved by replacing prevalences with importance weights, which sum up to one, in the overall accuracy:
and optimizing this weighted accuracy function instead. A class-specific accuracy for class k is obtained by setting and the rest of the weights to 0.
Our approach assumes some prior knowledge of user accuracy (expressed via parameters a and b for the binary example). The importance of priors when there is little or no data is a well-known fact in Bayesian statistics [35]. Arguably, in many cases, similar previous experiments should give a good idea of the user accuracy. However, when no such knowledge is available, one could perform a sensitivity analysis to see how the prior settings affect the inference or simply have a more protracted testing stage with greater m.
The more classes there are, the more data will be needed to inform user-specific matrices. It may thus make more sense to represent user-specific accuracies with fewer parameters. However, a common user accuracy matrix may be a step too far. Dividing users into either self-declared or estimated clusters (e.g., experts vs. amateurs) might be a better choice. Further studies are needed to clarify this issue, but there are approaches that use information such as education level and motivation to undertake citizen science to cluster the participants before the application of Bayesian approaches [27].
The two-stage approach assumes that every user is asked the same number of questions m to determine their accuracy, and then every image is classified the same number of times n to classify it with sufficient accuracy. However, in practice, some users’ accuracies may be narrowed down satisfactorily faster than others, and some images may be unequivocally classified much faster than others. While these aspects would make the presentation of our idea overly complicated, they are certainly worth considering.
Finally, we should point out that this method is about using a Bayesian approach to help optimize the number of times a given location needs to be classified by multiple people during a crowdsourcing campaign. However, Bayesian approaches can also be used for improving crowdsourced data quality after a campaign has run, i.e., in post-processing of the data. For example, Foody et al. [36] used a latent class analysis to infer the relative quality of visually interpreted land cover from different volunteers, allowing for class-specific variations from each volunteer to be captured. This information can then be used to improve the quality of the crowdsourced data when used in subsequent analyses.
5. Conclusions
In this paper, we have presented a two-stage experimental set-up for the crowdsourced classification of land use and land cover data, and we have explained how to achieve the optimal distribution of resources between these two stages. In the first stage, the user accuracy is estimated. In the second stage, this knowledge is applied to classify the images according to the BF. This two-stage method is a valuable addition to the research on using Bayesian inference to aggregate user classification in citizen science as it provides an intuitive and straightforward method to reliably estimate user accuracy and efficiently aggregate user classifications. We have demonstrated the procedure for simulated data with classes as well as for a case study based on an actual Geo-Wiki crowdsourcing campaign with . We have outlined a simulation procedure that can be applied to any specific classification set-up. Based on the results of this study, we found that BF performs better than SM by better identifying a dominant class at the cost of misidentifying a minority class. For the case study provided here, we found that one would need at least nine classifications per item to achieve an accuracy of at least 0.95. We provide scripts in Appendix A so that readers can do their own calculations, depending on the desired classification accuracy, the number of classifications per task and the expected accuracies of the participants.
Although the methodology presented here can be applied to any type of classification task with discrete classes, it was specifically developed for future Geo-Wiki campaigns that are focused on visual interpretation of very high-resolution satellite imagery for land cover and land use applications. The next campaign that will be run with Geo-Wiki will employ this type of two-stage approach to see how such a method can be used to improve the running of future campaigns. Hence, any type of land use and land cover reference data collection exercise can benefit from this process. This applies to, for example, developers of land cover and land use products, who might wish to use crowdsourcing to collect training and/or validation data or for researchers interested in using crowdsourcing to independently assess the accuracy of existing land use and land cover products or evaluate their fitness-for-purpose for specific applications. Other potential avenues for future research include adding more information about the users into the model, e.g., their background, expertise and sociodemographics, which might provide even further optimization in the effective use of the crowd.
Author Contributions
Conceptualization and methodology, E.M., M.L. and J.M.; software, formal analysis and visualization, E.M. and J.M.; data curation, M.L. and S.F.; writing, E.M., M.L. and L.S.; supervision, project administration and funding acquisition S.F. All authors have read and agreed to the published version of the manuscript.
Funding
This research was funded by the European Space Agency (contract no. 4000125186/18/1 NB) in the project ‘Using Crowdsourcing and Gaming Approaches for EO4SD Services (GAME.EO)’.
Institutional Review Board Statement
No personal data from the Geo-Wiki participants were used in this study and hence an Institutional Review is not required.
Informed Consent Statement
All Geo-Wiki participants have agreed that the data collected (i.e., visual interpretations of field size) can be used for the purpose of research. No personal data were used in this study.
Data Availability Statement
The field size dataset from Geo-Wiki can be found at http://pure.iiasa.ac.at/id/eprint/15526/, accessed on 12 October 2018.
Conflicts of Interest
The authors declare no conflict of interest.
Appendix A. R Code for Evaluating Accuracy
The code below reproduces the numbers for Figure 2.
# Evaluating accuracy as a function of (n)
# for the 1-stage power analysis
acc.num <- function(t.est,n,THETA,p1){
# p1 is the probability of occurrence for the majority class
# THETA is the true user accuracy
# t.est is the estimated user accuracy
# n is the number of ratings per item
# returns the expected overall classification accuracy
p0 <- 1-p1
k.div <- n/2-1/2*log(p1/(1-p1))/log(t.est/(1-t.est))
acc <- pbinom(k.div,n,1-THETA)*p0+(1-pbinom(k.div,n,THETA))*p1
return(acc)
}
Consider an example of binary classification, where there are two classes of images, and the dominant one appears of the time (). The two classes may, for example, be ‘aerial photos with over of land in agricultural use’ or ‘aerial photos with less than of land in agricultural use’. During the preliminary, first-stage analysis, the users were, on average, accurate for both classes (). Assuming that this correctly reflects the true user accuracy (), we can estimate the number of identifications per item n needed to reach at least overall accuracy () using the following code:
# To produce a range of accuracy values
# for identifications ranging from 1 to n.max,
# one can use the following script:
n.max <- 50;
my.acc <- numeric(n.max+1)
for(i in 1:(n.max+1)){
my.acc[i] <- acc.num(t.est = 0.7, n = i-0,THETA = 0.7, p1 = 0.9)
}
# to produce a quick plot:
plot(0:n.max,my.acc, xlab = expression(n), ylab = expression(alpha), ty = ‘o’, pch = 16)
abline(h = 1, lty = 3, col = ’gray60’)
# to find the minimal number of identifications per item
# necessary to reach at least 95\% accuracy:
(n.opt <- which(my.acc >= 0.95)~\cite{bonney2014next})
References
- Bonney, R.; Shirk, J.L.; Phillips, T.B.; Wiggins, A.; Ballard, H.L.; Miller-Rushing, A.J.; Parrish, J.K. Next steps for citizen science. Science 2014, 343, 1436–1437. [Google Scholar] [CrossRef] [PubMed]
- Pocock, M.J.; Tweddle, J.C.; Savage, J.; Robinson, L.D.; Roy, H.E. The diversity and evolution of ecological and environmental citizen science. PLoS ONE 2017, 12, e0172579. [Google Scholar] [CrossRef] [PubMed]
- Turbé, A.; Barba, J.; Pelacho, M.; Mugdal, S.; Robinson, L.D.; Serrano-Sanz, F.; Sanz, F.; Tsinaraki, C.; Rubio, J.M.; Schade, S. Understanding the Citizen Science Landscape for European Environmental Policy: An Assessment and Recommendations. Citiz. Sci. Theory Pract. 2019, 4, 34. [Google Scholar] [CrossRef] [Green Version]
- Haklay, M. Citizen science and volunteered geographic information: Overview and typology of participation. In Crowdsourcing Geographic Knowledge; Sui, D., Elwood, S., Goodchild, M., Eds.; Springer: Dordrecht, The Netherlands, 2013; pp. 105–122. [Google Scholar]
- Howe, J. The rise of crowdsourcing. Wired Mag. 2006, 14, 1–4. [Google Scholar]
- Fritz, S.; McCallum, I.; Schill, C.; Perger, C.; See, L.; Schepaschenko, D.; van der Velde, M.; Kraxner, F.; Obersteiner, M. Geo-Wiki: An online platform for improving global land cover. Environ. Model. Softw. 2012, 31, 110–123. [Google Scholar] [CrossRef]
- Simpson, R.; Page, K.R.; De Roure, D. Zooniverse: Observing the world’s largest citizen science platform. In Proceedings of the 23rd International Conference on World Wide Web, Seoul, Korea, 7–11 April 2014; ACM: New York, NY, USA, 2014; pp. 1049–1054. [Google Scholar]
- Dickinson, J.L.; Zuckerberg, B.; Bonter, D.N. Citizen science as an ecological research tool: Challenges and benefits. Annu. Rev. Ecol. Evol. Syst. 2010, 41, 149–172. [Google Scholar] [CrossRef] [Green Version]
- Buytaert, W.; Zulkafli, Z.; Grainger, S.; Acosta, L.; Alemie, T.C.; Bastiaensen, J.; De Bièvre, B.; Bhusal, J.; Clark, J.; Dewulf, A.; et al. Citizen science in hydrology and water resources: Opportunities for knowledge generation, ecosystem service management, and sustainable development. Front. Earth Sci. 2014, 2, 26. [Google Scholar] [CrossRef] [Green Version]
- d’Andrimont, R.; Yordanov, M.; Lemoine, G.; Yoong, J.; Nikel, K.; van der Velde, M. Crowdsourced street-level imagery as a potential source of in-situ data for crop monitoring. Land 2018, 7, 127. [Google Scholar] [CrossRef] [Green Version]
- Krupowicz, W.; Czarnecka, A.; Grus, M. Implementing crowdsourcing initiatives in land consolidation procedures in Poland. Land Use Policy 2020, 99, 105015. [Google Scholar] [CrossRef]
- Franzoni, C.; Sauermann, H. Crowd science: The organization of scientific research in open collaborative projects. Res. Policy 2014, 43, 1–20. [Google Scholar] [CrossRef] [Green Version]
- Tulloch, A.I.; Possingham, H.P.; Joseph, L.N.; Szabo, J.; Martin, T.G. Realising the full potential of citizen science monitoring programs. Biol. Conserv. 2013, 165, 128–138. [Google Scholar] [CrossRef] [Green Version]
- Gómez-Barrón, J.P.; Manso-Callejo, M.A.; Alcarria, R. Needs, drivers, participants and engagement actions: A framework for motivating contributions to volunteered geographic information systems. J. Geogr. Syst. 2019, 21, 5–41. [Google Scholar] [CrossRef]
- Lemmens, R.; Falquet, G.; Tsinaraki, C.; Klan, F.; Schade, S.; Bastin, L.; Piera, J.; Antoniou, V.; Trojan, J.; Ostermann, F.; et al. A conceptual model for participants and activities in citizen science projects. In The Science of Citizen Science; Vohland, K., Land-Zandstra, A., Ceccaroni, L., Lemmens, R., Perelló, J., Ponti, M., Samson, R., Wagenknecht, K., Eds.; Springer International Publishing: Cham, Switzerland, 2021; pp. 159–182. [Google Scholar] [CrossRef]
- Clery, D. Galaxy Zoo volunteers share pain and glory of research. Science 2011, 333, 173–175. [Google Scholar] [CrossRef] [PubMed]
- Franzen, M.; Kloetzer, L.; Ponti, M.; Trojan, J.; Vicens, J. Machine learning in citizen science: Promises and implications. In The Science of Citizen Science; Vohland, K., Land-Zandstra, A., Ceccaroni, L., Lemmens, R., Perelló, J., Ponti, M., Samson, R., Wagenknecht, K., Eds.; Springer International Publishing: Cham, Switzerland, 2021; pp. 183–198. [Google Scholar] [CrossRef]
- Lesiv, M.; Laso Bayas, J.C.; See, L.; Duerauer, M.; Dahlia, D.; Durando, N.; Hazarika, R.; Kumar Sahariah, P.; Vakolyuk, M.; Blyshchyk, V.; et al. Estimating the global distribution of field size using crowdsourcing. Glob. Chang. Biol. 2019, 25, 174–186. [Google Scholar] [CrossRef]
- Ballatore, A.; Zipf, A. A conceptual quality framework for Volunteered Geographic Information. In Spatial Information Theory; Fabrikant, S.I., Raubal, M., Bertolotto, M., Davies, C., Freundschuh, S., Bell, S., Eds.; Springer International Publishing: Cham, Switzerland, 2015; Volume 9368, pp. 89–107. [Google Scholar]
- Senaratne, H.; Mobasheri, A.; Ali, A.L.; Capineri, C.; Haklay, M.M. A review of volunteered geographic information quality assessment methods. Int. J. Geogr. Inf. Sci. 2017, 31, 139–167. [Google Scholar] [CrossRef]
- Balázs, B.; Mooney, P.; Nováková, E.; Bastin, L.; Jokar Arsanjani, J. Data Quality in Citizen Science. In The Science of Citizen Science; Vohland, K., Land-Zandstra, A., Ceccaroni, L., Lemmens, R., Perelló, J., Ponti, M., Samson, R., Wagenknecht, K., Eds.; Springer International Publishing: Cham, Switzerland, 2021; pp. 139–157. [Google Scholar] [CrossRef]
- Lukyanenko, R.; Wiggins, A.; Rosser, H.K. Citizen Science: An Information Quality Research Frontier. Inf. Syst. Front. 2020, 22, 961–983. [Google Scholar] [CrossRef] [Green Version]
- Crall, A.W.; Newman, G.J.; Stohlgren, T.J.; Holfelder, K.A.; Graham, J.; Waller, D.M. Assessing citizen science data quality: An invasive species case study. Conserv. Lett. 2011, 4, 433–442. [Google Scholar] [CrossRef]
- Allahbakhsh, M.; Benatallah, B.; Ignjatovic, A.; Motahari-Nezhad, H.; Bertino, E.; Dustdar, S. Quality control in crowdsourcing systems: Issues and directions. IEEE Internet Comput. 2013, 17, 76–81. [Google Scholar] [CrossRef]
- Kestler, H.A.; Lausser, L.; Lindner, W.; Palm, G. On the fusion of threshold classifiers for categorization and dimensionality reduction. Comput. Stat. 2011, 26, 321–340. [Google Scholar] [CrossRef]
- Gengler, S.; Bogaert, P. Integrating Crowdsourced Data with a Land Cover Product: A Bayesian Data Fusion Approach. Remote Sens. 2016, 8, 545. [Google Scholar] [CrossRef] [Green Version]
- De Lellis, P.; Nakayama, S.; Porfiri, M. Using demographics toward efficient data classification in citizen science: A Bayesian approach. PeerJ Comput. Sci. 2019, 5, e239. [Google Scholar] [CrossRef] [PubMed] [Green Version]
- Kruger, J.; Dunning, D. Unskilled and Unaware of It: How Difficulties in Recognizing One’s Own Incompetence Lead to Inflated Self-Assessments. J. Personal. Soc. Psychol. 1999, 77, 121–1134. [Google Scholar] [CrossRef]
- Kim, H.C.; Ghahramani, Z. Bayesian Classifier Combination. In Proceedings of the Fifteenth International Conference on Artificial Intelligence and Statistics, Virtual Event, 21–23 April 2012; pp. 619–627. [Google Scholar]
- Mugford, J.; Moltchanova, E.; Plank, M.; Sullivan, J.; Byrom, A.; James, A. Citizen science decisions: A Bayesian approach optimises effort. Ecol. Inform. 2021, 63, 101313. [Google Scholar] [CrossRef]
- R Core Team. R: A Language and Environment for Statistical Computing; R Foundation for Statistical Computing: Vienna, Austria, 2019. [Google Scholar]
- Salk, C.F.; Sturn, T.; See, L.; Fritz, S. Limitations of majority agreement in crowdsourced image interpretation. Trans. GIS 2017, 21, 207–223. [Google Scholar] [CrossRef] [Green Version]
- Salk, C.F.; Sturn, T.; See, L.; Fritz, S.; Perger, C. Assessing quality of volunteer crowdsourcing contributions: Lessons from the Cropland Capture game. Int. J. Digit. Earth 2015, 9, 1–17. [Google Scholar] [CrossRef] [Green Version]
- Salk, C.; Moltchanova, E.; See, L.; Sturn, T.; McCallum, I.; Fritz, S. How many people need to classify the same image? A method for optimizing volunteer contributions in binary geographical classifications. PLoS ONE 2022, 17, e0267114. [Google Scholar] [CrossRef]
- Gelman, A.; Carlin, J.B.; Stern, H.S.; Dunson, D.B.; Vehtari, A.; Rubin, D.B. Bayesian Data Analysis; Chapman and Hall/CRC: Boca Raton, FL, USA, 2013. [Google Scholar]
- Foody, G.M.; See, L.; Fritz, S.; Velde, M.V.d.; Perger, C.; Schill, C.; Boyd, D.S. Assessing the accuracy of volunteered geographic information arising from multiple contributors to an internet based collaborative project. Trans. GIS 2013, 17, 847–860. [Google Scholar] [CrossRef] [Green Version]
Publisher’s Note: MDPI stays neutral with regard to jurisdictional claims in published maps and institutional affiliations. |
© 2022 by the authors. Licensee MDPI, Basel, Switzerland. This article is an open access article distributed under the terms and conditions of the Creative Commons Attribution (CC BY) license (https://creativecommons.org/licenses/by/4.0/).