Article

Characterization of Soil-Plant Leaf Nutrient Elements and Key Factors Affecting Mangoes in Karst Areas of Southwest China

1
Institute of Karst Geology, CAGS/Key Laboratory of Karst Dynamics, Ministry of Natural Resources & Guangxi, Guilin 541004, China
2
School of Earth Science and Resources, China University of Geosciences, No. 29, Xueyuan Rd., Beijing 100083, China
3
Kunming Integrated Survey Center of Natural Resources, China Geological Survey, No. 1566, Chunyu Rd., Kunming 650100, China
4
School of Computer Science and Artificial Intelligence, Changzhou University, No. 21, Gehu Middle Rd., Changzhou 213164, China
*
Author to whom correspondence should be addressed.
Land 2022, 11(7), 970; https://doi.org/10.3390/land11070970
Submission received: 25 May 2022 / Revised: 17 June 2022 / Accepted: 22 June 2022 / Published: 24 June 2022
(This article belongs to the Special Issue New Insights in Soil Quality and Management in Karst Ecosystem)

Abstract

:
Baise city is one of the largest producers of mangoes, with this agricultural industry located in the karst region of Southwest China. However, calcium-rich and alkaline soils, severe soil fragmentation, and poor water and fertilizer retention capacity contribute to low mango yields and are key issues that limit the development of the mango industry in karst areas. Our study objectives were to identify the soil factors that limit mango growth and yield in the karst region of Southwest China, and to determine how these growth- and production-limiting conditions vary between landscape positions. This study analyzed the differences in soil nutrient and element contents in mango leaves, and used a Random Forest algorithm to calculate the eigenvalues of the mango leaf and soil elemental indices in the different geomorphic parts (slopes, transition zone, passes, high-yielding depressions, and low-yielding depressions) of the karst peak-cluster depressions. The key factors affecting the mango leaves and soil were screened based on the diagnostic results and the eigenvalues. The results showed that for the elemental contents of Fe, Mg, Ca, and Mn in the mango leaves in the different geomorphic parts of the karst, the peak-cluster depressions were generally deficient and varied significantly. The contents of available B (AB), soil organic matter (SOM), pH, total nitrogen, available Fe, available Mn, alkaline hydrolysis nitrogen, exchangeable Ca (Caex), exchangeable Mg, and other indices in the soils differed significantly, and AB, available Zn, and available K (AK) showed low or very low content levels. In addition, the key soil factors limiting mango yield in the karst areas were AB, fulvic acid, SOM, Fe, Mn, Caex, soil water, and AK; and the key mango leaf factors were Ca, Mn, Fe, Zn, and Mg. Consequently, the characteristics of soil water content, pH, and soil organic matter may be the main drivers affecting the differences in the mango yield and the elemental characteristics. These findings suggest that the addition of organic fertilizer could improve the quality and yield of mangoes in karst areas.

1. Introduction

The mango (Mangifera indica) industry is one of the characteristic agricultural pillar industries in Baise city, Guangxi, China. The area of mango cultivation in Baise city has reached 450 km2, accounting for 35.42% of the total mango cultivation area in China [1,2], and it is the main source of income for local farmers. Mangoes and other cash crops have been planted in large quantities in Baise city for the management of karst areas with stone desertification problems, especially in the peaks and bush depressions, where the largest areas of mangoes have been planted [3,4]. The high altitude, the large diurnal temperature difference, and the calcium-rich characteristics are the main reasons for the better taste of the mangoes from karst areas. However, soil characteristics such as calcium-rich and alkaline soils, severe soil acidification and slabbing, poor water and fertility retention, and low effective soil elemental content are the key factors limiting the yield of mangoes in karst areas [5,6,7]. Additionally, mango growing areas in karst areas are mostly mountainous, with huge undulations, fragmented plots, and poor irrigation and fertilization conditions for mangoes. Thus, the problem of low mango yield in karst areas has seriously affected the income of local fruit farmers, and this has become a key factor limiting the development of the mango industry, and of social and economic development in karst areas.
The unique distribution characteristics of phytochemical elements in the mango plant in karst areas are not only characteristic of the plant itself, but are also affected by the habitat; they are the result of the unification of the plant’s biological characteristics and the ecological environment [8,9]. The plant nutrient elemental content reflects the ability of plants to absorb nutrient elements under certain habitat conditions, and can reveal the growth and development of the plants to a certain extent [10,11]. Since the nutrient elemental content of a plant mainly depends on the plant species and its growth conditions, it can be used to determine the nutritional status of that plant, which is important for the scientific fertilization of crops and economically important forestry trees. The unique soil conditions of the karst area may lead to a large difference in the nutrient elements in mango leaves between karst areas and non-karst areas, and thus, it is important to diagnose the contents of the nutrient elements in the mango leaves, to determine the reasons for low mango yield in the karst area, in order to increase the yield and improve fruit quality. However, studies on the current nutrient salt enrichment patterns and the content diagnosis of mango leaves in karst areas are relatively few, and most studies are nutrient elemental diagnosis studies of mango leaves in areas other than in karst areas. For example, Shukla [12] investigated the effect of boron (B) in mango leaves on mango yield under a subtropical climate, and proposed suggestions for increased yield in subtropical mangoes based on B. Additionally, Devi [13] proposed a mango nutrient diagnostic standard (DRIS), explored and optimized the DRIS specifications, and provided methodological support for the screening of key factors. Although some research progress has been made on the enrichment and distribution patterns of growing mango leaves, there are few studies on the variability of leaf nutrient elements during mango growth in karst and non-karst areas to characterize the main causes and the key limiting factors of low mango yields.
The special soil conditions in karst areas lead to unique growth-limiting factors for mangoes. However, these limiting factors are still unclear. Most of the previous studies have focused on mangoes in non-karst areas such as in Hainan (tropical early-ripening mangoes), Panzhihua, and Sichuan city [14,15]. For example, Li et al. [16] explored the influence of climatic conditions on mango growth in Panzhihua through the mango’s growth cycle and nutritional characteristics, and pointed out the advantages of mango growth under the unique climatic conditions of Panzhihua. Additionally, Zhu et al. [17] analyzed the problems and key technologies for the growth of mangoes in Hainan city, and put forward targeted countermeasures and suggestions. Then, Guo et al. [18] investigated the effects of different irrigation methods on the growth and yield of mangoes in the Right River Valley area of Baise. In addition, some studies that are related to mango leaf diagnosis have recently been published. For instance, Liao [19] studied the variation patterns of various elements such as N, P, K, and Ca in the leaves of Red Golden Dragon mango over different periods, and preliminarily analyzed the importance of different elements on the growth of these mangoes.
Nevertheless, the above findings on mangoes in non-karst areas may not apply to mangoes in karst areas. Additionally, they are likely to be insufficient for providing support for solving problems such as the low mango yields in karst areas. Therefore, our study objectives were to determine the soil factors that limit mango growth and yield in karst areas in Southwest China and determine the content difference of key indicators in different geomorphic types. This study investigated the reasons for the large differences in mango yields in different geomorphic parts of a typical karst peak-cluster depression, and the Random Forest (RF) algorithm was used to screen for key factors affecting the mangoes and soils, using Tainong mangoes in Tian Yang County, Baise city, Guangxi Province, as an example. Based on the obtained key soil nutrition indicators and the results of lacking trace elements in mango, it provides scientific support for improving mango management levels and optimizing the fertilization status in karst areas.

2. Materials and Methods

2.1. Study Area

The study area was in Wucun Town (23°34′18.3″ N, 106°51′39.23″ E), south of Tian Yang County, Baise city, Guangxi Zhuang Autonomous Region (Figure 1), at an altitude of 500–800 m. It is known as the “Hometown of mango in China” [20]. The landscape of the area is a typical karst peak-cluster depression, the mango cultivar is mainly Tainong, and the trees are approximately eight years old. The flowering and yields of Tainong mangoes in different parts of the peaks and depressions (slopes, transition zone, depressions, and passes) differ greatly. The geological background of the study area is mainly the Sidazhai Formation of the Permian, which is dominated by medium- to thin-bedded microcrystalline tuffs and clastic tuffs. The study area has a subtropical monsoon climate with a short summer and winter period, an annual sunshine of 1600–1900 h, a frost-free period of 350–357 d, average annual temperatures of 18–22 °C (with the coldest month being around 13 °C in January), and an annual precipitation of 1100–1200 mm. This region has a suitable climate, fertile soil, concurrent rain and heat, and no continuous rains in winter and spring, providing a very favorable climate for mango production, and very favorable natural conditions.
The soil in the study area is red–brown calcareous soil, and the soil structures and compositions of different geomorphic parts of the landscape are significantly different. Among them, the soil moisture content in depressions is high, the soil bulk density and soil porosity are small, and the degree of soil hardening is high. The slope conditions are opposite to those of the depressions. The humus layer of the soil on slopes is thick, the soil bulk density and porosity are large, and the soil ranges between clay and sandy soil. The existence of a large amount of organic matter leads to high water and fertilizer retention on slopes. Additionally, the soil properties of the transition zone are similar to those of the passes, and their basic soil properties are between those of the depressions and slopes. These special soil properties may be the main reason for the low mango yields in the karst area.

2.2. Experimental Design

The sampling site was the mango orchard area in Wucun Town, Southern Tianyang County, and the sampling period was March 2021, when the Tainong mangoes were in full bloom. Three sample squares of 10 × 10 m were randomly selected in different geomorphic parts (slopes, transition zone, depressions, and passes) of the karst peak-cluster depressions. During the survey, it was found that there were areas of good and poor mango growth in the depression landscape, so the depressions were further divided into two different types of depressions: high-production areas and low-production areas (Figure 1b).

2.3. Sampling Method

Soil samples were collected at different depths (at 10 cm intervals) in the identified sample plots by excavating soil profiles at a depth of 1 m. The collected soil samples were packed in holding boxes and transported to the laboratory for drying and sieving. Then, soil from different parts of the landscape and mango leaves (the first tufts of the leaves) were collected, and the sampling points were chosen to avoid fertilization ditches at the centers of adjacent mango tree lines. Fresh mango leaves were stored under refrigeration at 4 °C and sent to the laboratory for cleaning, followed by a killing treatment so that the basic indices could be tested. To ensure the reliability of the data, as far as possible, mango leaves with the same thicknesses and sizes were picked from different squares, and samples were collected from different mango trees in the sample squares and mixed in uniform proportions, avoiding pest-infested or incomplete leaves during the picking process.

2.4. Sample Analysis

The soil organic matter (SOM) was determined using the potassium dichromate external heating method [21], the humus was determined using the sodium pyrophosphate leaching-potassium dichromate oxidation method (GB7858-87), the pH was determined using the electrode method, and the soil water (SW) and soil bulk density (SBD) were determined using the ring knife method.
Then, the total amount of soil elements was determined by mixed acid (HF-HNO3-HClO4) ablation and inductively coupled plasma mass spectrometry, and the effective state content was determined via leaching and inductively coupled plasma emission spectrometry (HJ804-2006). Next, the N content in the leaves was determined using the H2SO4-H2O2 ablation method, and the P content was determined using H2SO4-H2O2 molybdenum gradient resistance colorimetry [22,23]. Subsequently, the K, Mn, Zn, Fe, Ca, and Mg contents were determined using inductively coupled plasma emission spectrometry (JD-02), the Cu content was determined using an iCAPQc plasma mass spectrometer (JD-03), and a one-meter planar grating spectrometer (JD-14) was used for B determination [24].

2.5. Data Analysis

To find the reasons for the differences in the growth and yields in the different geomorphic parts of the landscape, the supervised classification method in the RF algorithm was used to classify and to predict the nutrient elemental indices for the soil and mangos. Compared to general statistical methods, the RF algorithm can accurately conduct index classification, evaluate the importance of each index, generate a tree structure, and determine the importance of each feature as it is an integrated learning method [25,26].
Based on the growth status of mangos in different geomorphic parts of the peak-cluster depression, the growth indices of the soil and mango leaves, and the eigenvalues of the nutrient elements were calculated using the RF algorithm. Additionally, the key factors affecting mango growth in the karst areas were selected according to the eigenvalue, and the nutritional driving mechanisms and influencing factors of mango growth in the karst areas were explored.
(1) Based on supervised classification in the RF classification algorithm, the labels of the slopes, transition zone, depressions, and passes were set as 4, 3, 1, and 2, respectively, and K-decision trees were constructed using the RF algorithm as follows:
H x = 1 k i = 1 k h i ( x )
where H x represents the predicted value of the RF model and h i ( x )   represents the ith decision tree model.
(2) The bootstrap methods, which are based on the RF algorithm, resample to generate multiple training sets, construct the supervised classification RF algorithm model, and use the mean squared error (MSE) of the out-of-bag (OOB) estimation method to evaluate the importance of the explanatory variables in the regression model. The mathematical definition of MSE is as follows [27]:
M S E = 1 n i = 1 n ( y i y i p )
where M S E is the mean squared error and y i p is the predicted value of the ith observed value, y i .
(3) To objectively evaluate the accuracy of the classification results of the model, the results of the RF model needed to be evaluated and verified after the model was established. Thus, cross-validation was used to estimate the model error, which is mathematically defined as:
N M S E = i = 1 n ( y i y i p ) 2 i = 1 n ( y i y e ) 2
where N M S E is the normalized mean square error and y e is the predicted average value.

3. Results and Analysis

3.1. Soil and Mango Leaf Nutrient Elemental Characteristics

3.1.1. Differences in the Nutrient Elemental Characteristics of Mango Leaves

To reveal the deficiencies and excesses of the different nutrient elements in the mango leaves in the karst areas, we diagnosed the contents of the main nutrient indicators (N, P, K, S, Cu, Mn, Zn, Fe, B, Ca, and Mg) in mango leaves in karst areas, based on the Baise Tainong mango allotropic diagnostic criteria (Table 1). The results of the diagnosis are shown in Table 2. Except for the transition zone and the passes, the mango leaves in the other geomorphic parts of the landscape showed excessive levels of N. The slopes, the passes, and the low-yield depressions showed excessive levels of P, while the transition zone and the high-yield depressions showed P contents that were not excessive, but were close to the critical values. For K, except for the depressions, the slopes, transition zone, and passes showed excessive levels. This may be related to the fertilization conditions of the local mangoes. Currently, the fertilizers that are applied by farmers in the karst areas are mainly N, P, and K fertilizers, and the application of large amounts of these fertilizers may be the main reason for the serious excess of N, P, and K in the mango leaves.
The elemental content of Ca in the different geomorphic parts of the landscape was above the normal range. The differences in the S and Zn elements in the mango leaves in the different geomorphic parts of the landscape were not obvious, and their contents were within the normal range. Additionally, the contents of Fe and Mg in the mango leaves were below the normal range, and showed deficient content levels. Additionally, the content of Mn in the low yield of the depressions was significantly higher than that of the other geomorphic parts of the landscape, showing an excessive content level, while all of the other landscape sites showed a normal content level. For Cu, the slopes, transition zone, and passes all showed deficient content levels, while the high-yield depressions and the low-yield depressions showed normal and excessive content levels, respectively. The content levels of K, Ca, P, and Mg in the depressions with poor flowering and fruiting of mangos were lower than those in the slopes, transition zone, and passes, while the content levels of N, Mn, and Cu were higher in these depressions than those in the slopes, transition zone, and passes. Thus, nutrient elements such as Fe, Mg, Ca, and Mn, which were highly variable in the different geomorphic parts of the landscape and exhibited deficiencies, should be emphasized in the screening of key factors.

3.1.2. Differences in the Soil Nutrient Element Characteristics

In this study, based on the criteria that were collected from the literature for judging the soil-effective state (Table 3), the effective state, SOM, TN, TP, and soil pH were diagnosed [30,31,32]. The diagnostic results (Table 4) showed that for the available indices, the contents of Bex, Znex, AK, and exchangeable Ca (Caex) in the soils of the different topographic sites were low, with all of them having very low, low, or medium levels. In contrast, the contents of Mgex, Moex, AFe, and Cu were high, with all of them having very high, high, or medium levels. The content of Mn in the low-yield depressions and the high-yield depressions was much higher than those in the slopes, transition zone, and passes, which showed low levels. In contrast to Mn, the content of AHN in the slopes was much higher than that in the transition zone, passes, and depressions, which showed low content levels. This may be closely related to the reason for the higher SOM content, which was found in the slopes. Excluding the disturbance of fertilization, the AK in the slope is easily lost with water and lost soil, which is the reason for the higher AK content in the transition zone, and the high-yield depressions.
The variability in the SOM content in the different geomorphic parts of the landscape was obvious, with slopes showing much higher SOM contents than the transition zone, passes, and depressions, which showed moderate or low content levels of SOM. In the study area, there was a thick layer of dead leaves on the slope, while the layers of dead leaves in the transition zone, the passes, and the depressions were thinner. The dead leaves of plants can be biodegraded into organic matter, and it was the main reason for why the organic matter and humus in the slopes were higher than in the other geomorphic parts of the landscape. From the depressions to the transition zone and then to the slopes, the pH showed a gradual decreasing tendency, with the soil in the slopes, passes, and transition zone showing weak acidity, while the soil in the passes was neutral (pH ≈ 7). The pH is one of the important factors that affect the effectiveness of soil nutrients. As the variability in the pH in the different geomorphic parts of the landscape was obvious, since plants are sensitive to pH, tiny differences may lead to large differences in the available content indices in the soil.
The TN and TP contents of the soil in all of the geomorphic parts of the landscape were higher, among which the TN content of the slopes was approximately 1.5-fold higher than that of the other geomorphic parts, which showed extremely high and high content levels. The TP contents of the soils were less variable, and all parts of the landscape showed medium or high content levels. Due to the small soil bulk density, viscosity, and soil thickness of the slope, rainfall was easily absorbed into the soil water, which was the reason for the soil water content distribution pattern. The SOM and fulvic acid (FV) contents of the slopes and passes were significantly higher than those of the depressions and the transition zone, which is related to the thinner soil layers and the higher water and fertilizer retention capacities of the slopes and passes. Additionally, the high SW contents in the slopes and the transition zone easily form an anaerobic environment, and plant organic matter such as dead branches and leaves can be easily fermented anaerobically to form organic matter and humus. The variability in the soil available B (AB) content was obvious, and all parts of the landscape showed very low content levels.
In the screening of the soil key factors, it was found that B was the indicator with the highest characteristic value in the soil, which indicates a lack of AB in the soil, and which has an effect on the growth and development of mangoes. Overall, the contents of SOM, pH, TN, AFe, AMn, AHN, Caex, Mgex, and other indicators in the soils in the different geomorphic parts of the landscape were highly variable, and elements such as AB, available Zn (AZn), and AK showed low or very low content levels, which should be considered in the process of soil key factor screening.

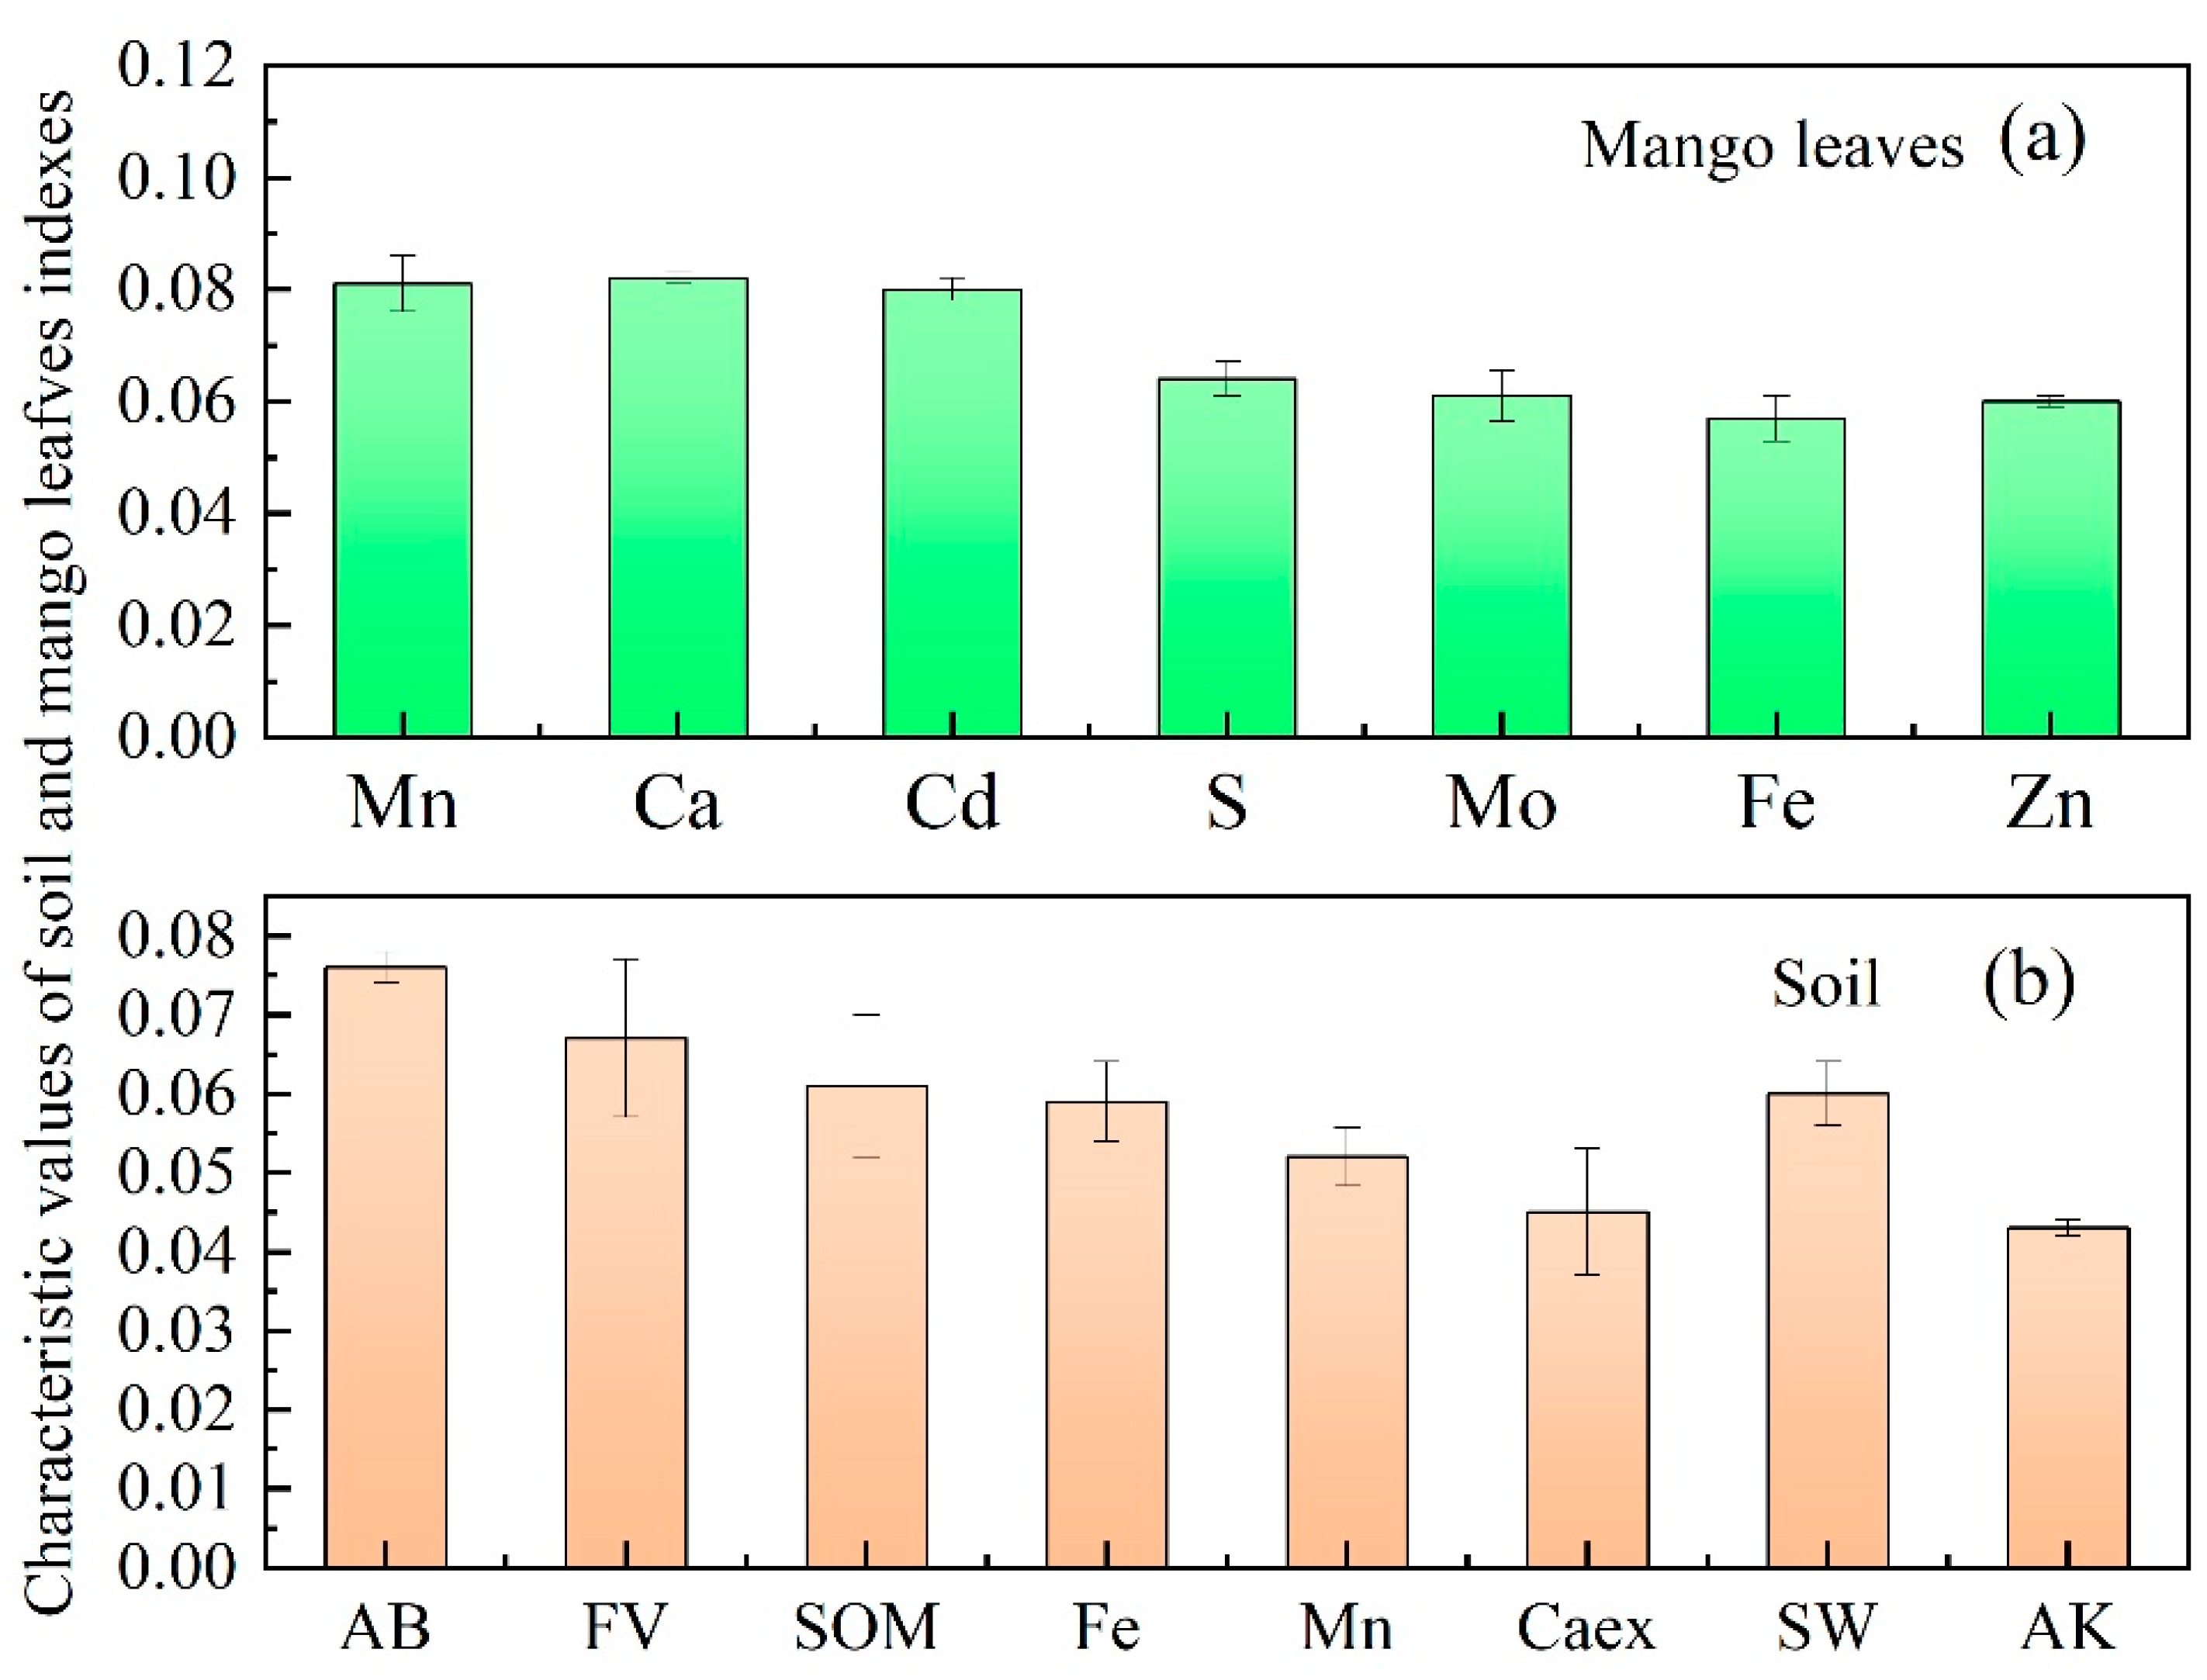
3.2. Determination of Key Factors Based on the Random Forest Algorithm

The growth of mangoes in the different geomorphic parts of the depressions was coded, and the characteristic values of the indicators of the mango leaf nutrient and soil elements were calculated using the RF algorithm. Furthermore, the key factors affecting mango growth in the karst areas were determined based on the diagnostic results of the mango leaf nutrient and soil elements. Among the soil indicators selected were SOM, soil humus (SH) (FV, humic acid, and humin), pH, SW, SBD, total elements (N, P, K, S, Cu, Mn, Zn, Fe, Ca, Mg, Se, Co, Cd, Mo, dry matter, C/N, C/P, and N/P), and effective state elements (Caex, Sex, Mgex, AB, ACu, AFe, AMn, AZn, AMo, AHN, AK, and AP), and the selected mango leave indicators were full elements (N, P, K, S, Cu, Mn, Zn, Fe, Ca, Mg, Se, Co, Cd, and Mo), moisture, and dry weight. The final RF structure model for the soil had 37 sample sizes, four categories, and eight predictors, and the RF model for the mango leaves had 18 sample sizes, four categories, and seven predictors. The final indicators with the highest eigenvalues were screened from the 36 soil indicators and 17 mango leaf indicators, and the diagnostic results of the soil and mango leaves were integrated to determine the key indicators for mango growth.
The final screening results are shown in Figure 2. The indicators with high characteristic values for the soil were AB, FV, SOM, Fe, Mn, Caex, SW, and AK, in order of size. The indicators with high eigenvalues for the mango leaves were Mn, Ca, Cd, S, Mo, Fe, and Zn, in order of size. The higher the eigenvalues, the more significant the variability in the index content in the different geomorphic parts of the landscape. For soils, the variability in the index contents of AB, FV, SOM, Fe, Mn, Caex, SW, and AK was greater, which best explained the soil index classification results. For the mango leaves, the contents of Mn, Ca, Cd, S, Mo, Fe, and Zn were more variable, and this best explained the results of the mango leaf index classification.
The high characteristic values of AB, FV, SOM, SW, and AK in the soil indicate that these elements are more variable in the different geomorphic parts of the peak-cluster depressions, such as the slopes, transition zone, depressions, and passes, and these elements are key for facilitating soil improvement in mango orchards in the karst areas. Although the elemental characteristic values of S, Mo, Zn, and Fe were lower than those of Ca, Mn, and Cd, they could still characterize the nutrient enrichment or deficiency in mango plants to some extent. In contrast, the soil water-holding capacity of the slopes, transition zones, depressions, and passes differed, and soil moisture variability was evident. Nevertheless, whether soil moisture was the cause of the differences in the soil properties and mango growth in the different parts of the landscape needs to be further investigated. The relatively small eigenvalues for N and P in the soil of the karst area indicate that these elements are no longer the key factors limiting the growth of mangoes. In summary, the magnitude of the RF eigenvalues was able to characterize the magnitude of the variability in the soil and mango leaf nutrient indicators in the different geomorphic parts of the landscape, and greater variability represents more important indicators. Therefore, AB, FV, SOM, Fe, Mn, Caex, SW, and AK were considered to be key factors of the soil, and Ca, Mn, Fe, and Zn were considered as key factors of mango leaves.

3.3. Analysis of the Key Factors Affecting the Mango Leaves and Soil

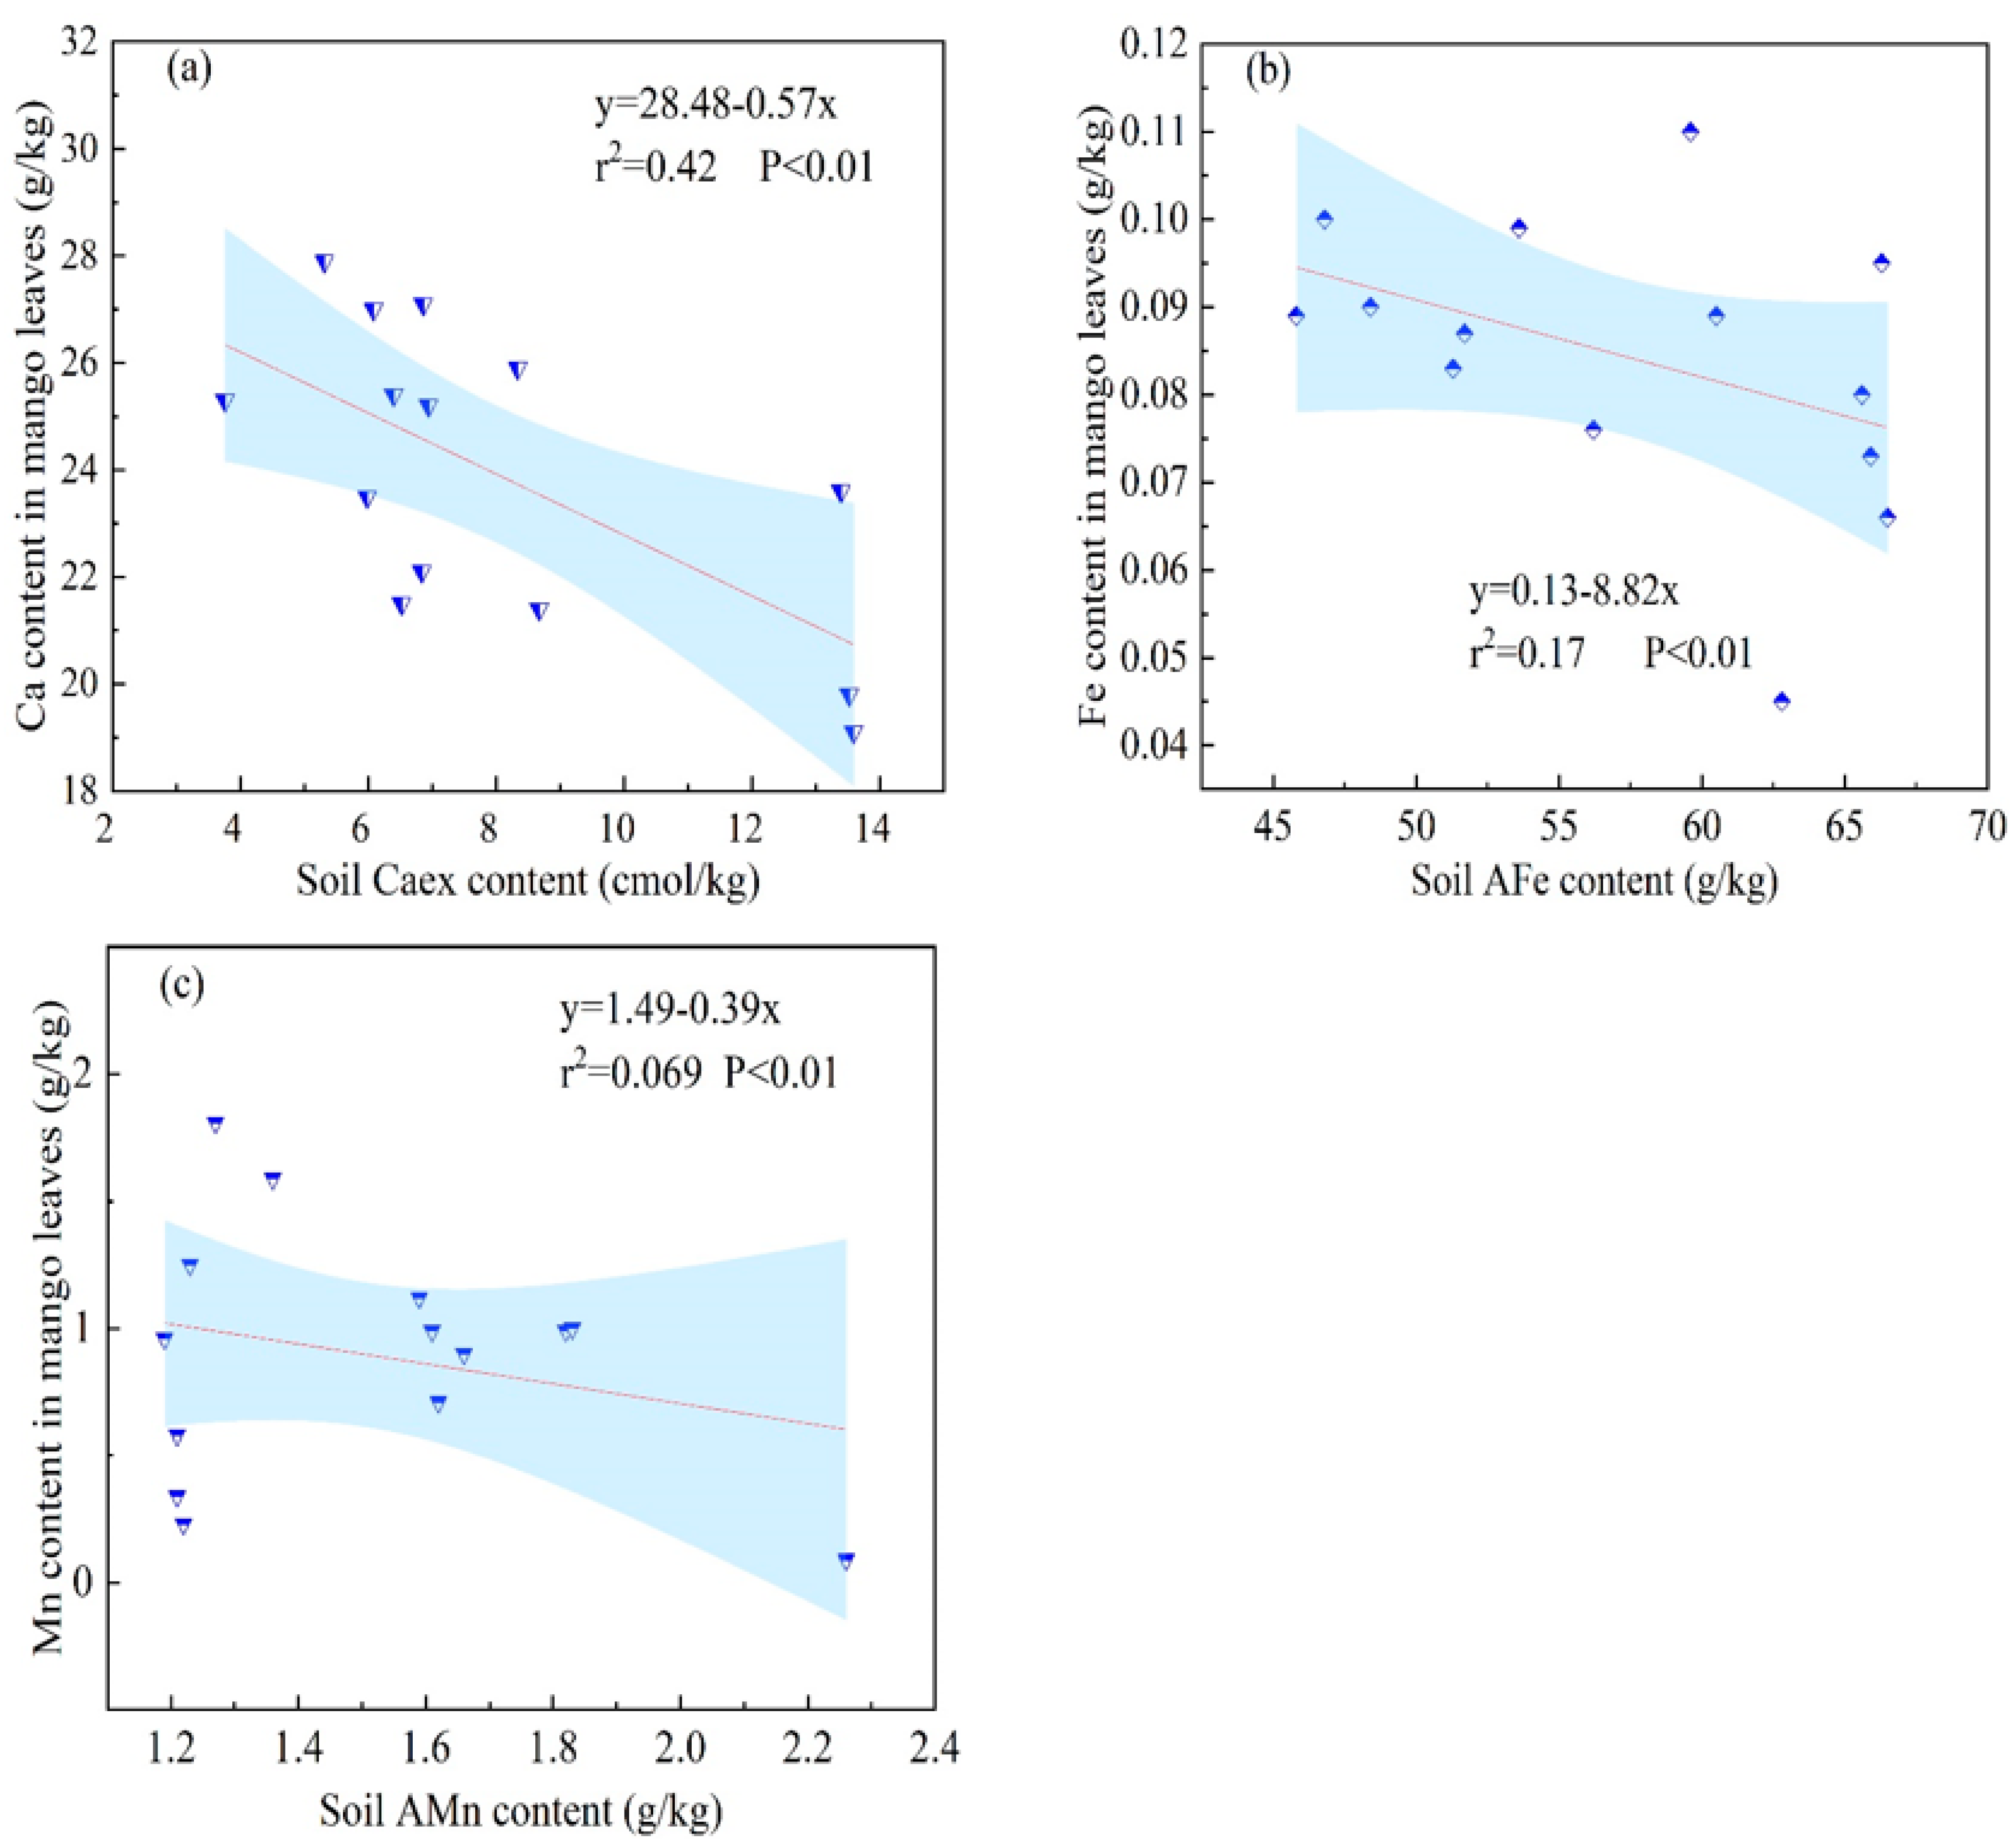
3.3.1. Correlation Analysis of the Key Factors

Using factors that were screened via the RF algorithm (the soil key factors as environmental data, the mango leaf key factors as species data, and the different geomorphic parts of the landscape as samples), a redundancy analysis was performed on the screened key factors (Figure 3). The two principal component axes explained 86% of the cumulative explanatory information; there were good positive correlations among the soil indicators, SOM, AK, and FV, and they also had good positive correlations with Mn and Ca in the mango leaves. This indicated the effect of humic substances, such as the SOM and FV, on the soil AK content, and the uptake and utilization of Ca and Mn in the leaves. Additionally, the SW was correlated with Mn and Fe in the mango leaves, and it had a good correlation. A strongly negative correlation was shown between the soil Caex and mango leaf Ca, while the correlation between Fe and Mn in the soil and Fe and Mn in the mango leaves was poor. The higher eigenvalues of the soil Fe and Mn characterize the greater variability in their contents in the soils from the different landscape sites, so AFe and AMn in the soils should be prioritized when conducting an analysis.
In contrast, the variability in the different geomorphic parts of the landscape was obvious and clustered into four categories, namely, the transition zone and low-production depressions category, low-production and high-production depressions category, slopes category, and passes category. This clustering pattern indicates that there was significant variability among the four geomorphic parts of the landscape, which is corroborated by the variability in mango flowering and fruiting. The interconnectedness of the transition zone and the depressions, with less variability in the content of the key factors, the soil conditions, and mango growth, is the main reason for the clustering of the transition zone and the depressions in the low-production area.

3.3.2. Uptake and Utilization by Mango Leaves

The results discussed above showed that the three elements, Ca, Mn, and Fe, were contained in the key factors affecting the mango leaves and soil, indicating that these indicators play an important role in the growth of mangoes in the karst areas. To further study the uptake and utilization mechanisms of these three nutrients in mangoes, we established linear regression equations for Ca, Mn, and Fe in the leaves of mango plants, and for Caex, AMn, and AFe in the soil. As shown in Figure 4, there was a very significant negative correlation between the Ca in the mango leaves and the Caex in the soil, while there was a very significant positive correlation between the Fe and Mn contents in the mango leaves and the AFe and AMn in the soil. With the increase in the Caex content in the soil, the Ca content in the leaves decreased. Thus, the law of Ca absorption and utilization is contrary to the general law. The order of the Caex content in the mango leaves within the different geomorphic parts of the landscape was: depressions > slopes > passes > transition zone, and the pH of the soil in the depressions was also higher than that in the other parts of the landscape. The high pH and Ca content of the soil may inhibit the uptake and utilization of Ca by mangoes.
The absorption and utilization mechanisms of Mn and Fe were different from those of Ca. The higher the contents of AFe and AMn in the soil, the higher the contents in the mango leaves, which indicates that AFe and AMn in the soil can be absorbed and utilized well by mangoes. For Mn, the order of the Mn content in the mango leaves was: depressions > transition zone > slopes > passes. In contrast, with a high Mn content, mango blossoms and fruits were in poor condition, which indicates that a high Mn content may hamper mangoes from flowering and fruiting. Furthermore, a high Mn content in mango leaves may even lead to Mn poisoning. Additionally, Fe is crucial for mangoes, as it is of great significance to the growth and development of mango leaves, and to flowering and fruiting. The order of the Fe content in the mango leaves was: passes > transition zone > slopes > depressions. Within a certain range, the higher the Fe content in the mango leaves and soil, the better the growth of the mangoes. Moreover, the content of the AFe in the soil was sufficient, and able to meet the demand of the mangoes for Fe.

4. Discussion

4.1. Key Factors Limiting the Growth of Mangoes in Karst Areas

We found that the key soil factors affecting mangoes in karst areas were AB, FV, SOM, Fe, Mn, Caex, SW, and AK, and the key factors affecting mango leaves were Ca, Mn, Fe, and Zn. Liao et al. [33] found that SOM, TN, Ca, B, and Ni in the soil environment of mango estates in Hainan had certain effects on mango quality. Additionally, Liu et al. [34] found that the quality of mango fruits was affected by SW, and Lin et al. [35] diagnosed the nutritional characteristics of Red Golden Dragon mangoes based on the mango nutrient DRIS, and pointed out that Fe, Mn, Ca, and S are key nutritional indicators. Furthermore, Wang et al. [36] conducted a nutritional diagnosis of Kettle mangoes in Panzhihua city, Sichuan province, and found significant variability in Ca, Mg, K, Mn, and Zn between different growth cycles. Although the results of these related studies have some differences from the key factors that were screened in this study, the key factors with large eigenvalues overlapped with many of the key indicators in these studies, which indicates that the key factors that were screened in this study have some reliability and scientific validity.
The SOM can be used to characterize the soil structure and soil fertility to a certain extent, which has important effects on the growth and yield of mangoes in karst areas. The SOM is the main source of mango nutrients, and it can promote the growth and development of mangoes. Furthermore, the SOM can also improve the soil structure, promote soil microbial activity, and enhance the water and fertility retention capacity of the soil [37]. The slopes were more densely vegetated and had a thick layer of dead leaves, and thus they had a high organic matter and humus content; while the transition zone and depressions had less vegetation cover and thus a low organic matter and humus content, due to natural and anthropogenic activities. This was the reason for the high characteristic values of FV and SOM in the study results. Additionally, the FV and SOM of the soil had a certain effect on the mango leaves Mn, Cd, Mo, and Ca; this may be because of the presence of certain levels of trace elements in the SOM and SH that are absorbed and used by the mangoes. Additionally, the correlation between organic matter and trace elements is not obvious in non-karst areas [38,39]. Thus, the unique hydrogeological conditions of the peak-cluster depressions led to different soil water-holding capacities in different parts of the landscape, and since soil moisture is the medium for the plant uptake and transport of nutrients, it can also have an impact on organic matter mineralization and soil slumping. Therefore, the soil water content and capacity may be the key factors limiting the growth of mangoes in karst areas.
B can promote plant sugar transport, maintain cell membrane function, and participate in enzyme and growth regulator reactions in plants [40,41]. Additionally, the flowering rate and fruit setting rate of mangoes are regulated by B. Thus, low B levels in plants will reduce the flowering rate, fruit setting rate, and yield of mangoes. In the peak-cluster depressions, B in the slopes and transition zone can be transferred into depressions with rainfall and accumulate in the depressions, which is the main reason for the high B content in the depressions. In contrast, the B content in mangoes in the depressions was lower than that in the slopes, transition zone, and passes, which may be due to the excess B content in the depressions, thus inhibiting the uptake of B by mangoes, and the formation of a boron-averse environment in the mangoes. The key factors, Ca, Mn, and Fe were more variable in different parts of the peak-cluster depressions, with high levels of both Ca and Mn leading to lower mango yields, while Fe promoted higher mango yields [42]. In non-karst areas, Ca deficiency inhibits crop growth, resulting in lower yield and quality. However, increasing Ca content within a certain range can enhance crop resistance and yield, and slow down crop aging [43,44]. In contrast, the soils in the karst areas have high background values of Ca and Mn contents, and excessive Ca and Mn contents that are absorbed by mangoes can inhibit crop growth, and even lead to Mn poisoning, resulting in the perforation and decay of mango leaves. Therefore, the nature of calcium-rich alkaline soil in karst areas may inhibit the uptake of Fe by mangoes, and is the reason for higher mango yield with higher Fe content.

4.2. Suggestions for Improving the Quality and Efficiency of Mangoes in Karst Areas

The soil in the karst areas is poor, thin, calcium-rich, and alkaline; thus, the soil in the depressions of the peak-cluster depressions is especially easy to plate, soil erosion is serious, and the soil organic matter content is low. The karst areas are mostly mountainous, with low soil quality, exhibit significant diversity and fragmentation, and have poor irrigation conditions [45]. These characteristics are the main reasons for the low water and fertilizer retention capacities, and the low mango yield in karst areas. Improving soil fertilizer conditions, as well as regulating soil conditions, are of great importance for improving the quality and efficiency of mango growth in karst areas. Therefore, soil improvement is an important method for increasing the yield of mangoes, by addressing the problems of soil consolidation, low organic matter content, and uneven water distribution in karst depressions.
Additionally, organic fertilizer can improve soil properties, which can effectively enhance the growth conditions and yield of mangoes. However, there is no special fertilizer for mangoes on the market, and chemical fertilizers are mostly applied in large quantities by experienced farmers, organic fertilizers are rarely used. Furthermore, the water and fertilizer retention capacities in karst areas are poor; thus, most of the chemical fertilizer is lost, causing groundwater pollution. Chemical fertilizers mainly include N, P, and K fertilizers, and the application of large quantities of chemical fertilizers has led to N, P, and K contents in the soil of karst areas that far exceeds what mangoes need, and they even have a toxic effect on the growth of mangoes [46]. The use of organic fertilizers instead of chemical fertilizers to improve the yield and quality of Tainong mangoes was also pointed out by Si et al. [47]. Additionally, Zang [48] studied the effects of different organic fertilizers on mango quality and soil fertility, and suggested that organic fertilizers could better enhance soil fertility. These studies support that organic fertilizers can not only improve the soil environment, but can also enhance the quality and yield of mangoes. They also support the key factors affecting soil and mangoes that were determined in this study. However, the specific ratios of organic and inorganic fertilizers to produce effective mango fertilizers still needs further research [49]. Therefore, organic fertilizers should be chosen as the main fertilizer in karst areas, and a mixed organic–inorganic fertilizer application is ideal.

5. Conclusions

(1) The contents of Fe, Mg, Ca, and Mn in mango leaves in the different geomorphic parts of the landscape were highly variable, with Fe and Mg being deficient, and Ca and Mn in excess. The contents of the other elements showed less variability, and their contents were normal. The contents of AB, SOM, pH, TN, AFe, AMn, AHN, Caex, Mgex, and other indices in the soils were more variable, among which AB, Znex, AK, and other elements showed low or very low content levels.
(2) Based on the RF algorithm, the highest eigenvalue indicators were selected among the soil and mango indicators, with the eigenvalues of the soil factors being ranked as EB > FV > SOM > SW > Fe > Mn > AK, and the eigenvalues of the mango factors being ranked as Ca > Mn > Cd > S > Mo > Zn > Fe. Combining the high eigenvalue indicators for the soil and mango leaves, EB, FV, SOM, AFe, AMn, Caex, SW, and AK were taken as being key factors affecting the soil, and Ca, Mn, Fe, Zn, and Mg were taken as key factors affecting mango leaves.
(3) The findings of this study determined that reducing the application of inorganic fertilizer and selecting a mixed application method of organic fertilizer and inorganic fertilizer would be of great significance for the flowering, fruit setting, and yield of mangoes. Furthermore, the characteristics of SW, pH, and soil organic matter may be the main driving factors affecting the differences in mango yield and the elemental characteristics in the different geomorphic parts of the landscape.

Author Contributions

Conceptualization, J.L. and H.Y.; methodology, T.S.; software, M.L.; validation, X.L.; formal analysis, Y.M.; investigation, C.X.; resources, L.Z. and H.Y.; data curation, C.H.; writing—original draft preparation, T.S.; writing—review and editing, L.Z.; funding acquisition, L.Z. All authors have read and agreed to the published version of the manuscript.

Funding

Guangxi Science and Technology Base and Talent Special Project (Guike AD20297090; Guike AD19245176), Guilin Science and Technology Plan Project (2020010403), Guangxi Science and Technology Base and Talent Special Project (GuikeAB22035004) and Guilin Scientific Research and Technology Development Plan Major Special Project (20180101-3).

Institutional Review Board Statement

Not applicable.

Informed Consent Statement

Not applicable.

Data Availability Statement

The data that support the findings of this study are available on request from the corresponding author.

Acknowledgments

We thank the support from the Guangxi Science and Technology Base and Talent Special Project (Guike AD20297090; Guike AD19245176), Guilin Science and Technology Plan Project (2020010403), Guangxi Science and Technology Base and Talent Special Project (GuikeAB22035004) and Guilin Scientific Research and Technology Development Plan Major Special Project (20180101-3).

Conflicts of Interest

The author states that there is no conflict of interest.

References

  1. Shu, J.; Yu, Z.H.; Sun, W.; Zhao, J.; Luo, S. Identification and characterization of Pestalotioid fungi causing leaf spots on mango in southern China. Plant Dis. 2019, 104, 1207–1213. [Google Scholar] [CrossRef] [PubMed]
  2. Zhao, D.; Wang, Y.; Yu, P.P.; Hu, J.J. Baise mango: Prosperity and hidden worries in the golden industry. Mark. Circ. 2020, 525, 56–65. (In Chinese) [Google Scholar]
  3. He, T.X.; He, X.H.; Luo, C.; Li, F.; Fang, Z.B. Analysis of causes of low yield and transformation technology of mango in Baise. Agric. Res. Appl. 2018, 31, 49–53. (In Chinese) [Google Scholar]
  4. Wei, L.S. Analysis of the effect of different fertilizers on the yield and economic efficiency of mango. Agric. Technol. 2017, 37, 10. (In Chinese) [Google Scholar]
  5. Singh, S.K. Mango fruit yield and qualitgi improvement through fertigation along with mulch. Indian J. Agric. Sci. 2007, 77, 680–684. [Google Scholar] [CrossRef]
  6. Xiong, Y.M. Discussion on high yield and quality cultivation technology of mango in Baise mountains. South. Agric. Mach. 2018, 49, 101. (In Chinese) [Google Scholar]
  7. Huang, L.J. Precipitation Trends and Their Effects on Mango Production in Baise City, Guangxi; Guangxi University: Nanning, China, 2019; pp. 7–27. (In Chinese) [Google Scholar]
  8. Zhao, F.J.; Moore, K.L.; Lombi, E.; Zhu, Y.G. Imaging element distribution and speciation in plant cells. Trends Plant Sci. 2014, 19, 183–192. [Google Scholar] [CrossRef]
  9. Nie, J.H.; Liu, X.M.; Wang, Q.R. Effect of nutrients N, P and K on the uptake capacity of Pb super-enriched plants. Trans. Chin. Soc. Agric. Eng. 2004, 20, 262–265. (In Chinese) [Google Scholar]
  10. Ingestad, T.; Gi, Å. Plant nutrition and growth: Basic principles. Plant Soil 1995, 169, 15–20. [Google Scholar] [CrossRef]
  11. Jones, J.; Guinel, F.C.; Antunes, P.M. Carbonatite rock can enhance plant growth and nutrition depending on crop traits. Plant Soil 2021, 465, 335–347. [Google Scholar] [CrossRef]
  12. Shukla, S.K.; Adak, T.; Singh, V.K. Evaluation of boron nutrition in enhancing productivity and quality of mango (Mangifera indica L.) cultivar Mallika under subtropical climatic conditions. Curr. Adv. Agric. Sci. 2020, 12, 33. [Google Scholar] [CrossRef]
  13. Devi, J.; Bhat, D.; Wali, V.K.; Sharma, V.; Dey, T. Preliminary the Diagnosis and Recommendation Integrated System (DRIS) Norms for Evaluating the Nutritional Status of Mango. Int. J. Curr. Microbiol. Appl. Sci. 2020, 9, 321–327. [Google Scholar] [CrossRef]
  14. He, C.C.; Feng, H.D.; Wei, Z.Y.; Hou, X.W.; Chen, Y.Y.; Liu, L.S.; Yin, C.B.; Xu, M.G.; Ru, C.A. Fertilization status and evaluation of orchards in the main mango producing areas of Hainan Province. China Soil Fert. 2019, 3, 122–129. (In Chinese) [Google Scholar]
  15. Xie, R.N.; Ma, C.; Zhang, Q.; Liu, C.H.; Yang, X.F. Comparison of fruit volatile components of main plant varieties in the main mango production areas of Hainan Province. China J. Trop. Crop. 2019, 40, 558–566. (In Chinese) [Google Scholar]
  16. Li, F.B.; Chen, Y.Q.; Du, C.X. Effects of climatic conditions on mango growth in Panzhihua. Plateau Mt. Meteorol. Res. 2010, 30, 68–71. (In Chinese) [Google Scholar]
  17. Zhu, J. Main pests and diseases of mango and their control measures. Beijing Agric. 2011, 18, 98–99. (In Chinese) [Google Scholar]
  18. Guo, P.; Li, X.J.; Li, S.H.; Liang, M.Y.; Cun, D.Z.; Lin, K.; Zhao, H.X.; Li, Y.H. Experimental study on irrigation system of mangoes in the Right River Valley of Baise, Guangxi. Water Sav. Irrig. 2018, 6, 58–62. (In Chinese) [Google Scholar]
  19. Liao, Z.Q.; Lin, D.; Cheng, N.N.; Huang, H.L.; Yang, X. Study on the nutritional patterns of mango leaves in Hainan Red Golden Dragon. J. Agric. Biotechnol. 2008, 4, 430–433. (In Chinese) [Google Scholar]
  20. He, J.; School, B. Study on the optimization and innovation of e-commerce marketing mode of fresh fruits: Taking Guangxi Baise mango marketing as an example. Wirel. Internet Technol. 2018, 15, 118–119. (In Chinese) [Google Scholar]
  21. Wu, C.W.; Xia, J.X.; Duan, Z.L. Review and prospect of soil organic matter determination methods. Soils 2015, 47, 453–460. (In Chinese) [Google Scholar]
  22. Zhang, D.; Tang, R.; Tang, B.H.; Hua, W.; Li, Z.L. A simple method for soil moisture determination from lst–vi feature space using nonlinear interpolation based on thermal infrared remotely sensed data. IEEE J. Stars 2017, 8, 638–648. [Google Scholar] [CrossRef]
  23. Javeed, H.M.R.; Ali, M.; Ahmed, I.; Wang, X.; Al-Ashkar, I.; Qamar, R.; Ibrahim, A.; Habib-Ur-Rahman, M.; Ditta, A.; EL Sabagh, A. Biochar Enriched with Buffalo Slurry Improved Soil Nitrogen and Carbon Dynamics, Nutrient Uptake and Growth Attributes of Wheat by Reducing Leaching Losses of Nutrients. Land 2021, 10, 1392. [Google Scholar] [CrossRef]
  24. Baldantoni, D.; Bellino, A.; Cicatelli, A.; Castiglione, S. Influence of the Choice of Cultivar and Soil Fertilization on PTE Concentrations in Lactuca sativa L. in the Framework of the Regenerative Agriculture Revolution. Land 2021, 10, 1053. [Google Scholar] [CrossRef]
  25. Wang, L.J.; Kong, Y.R.; Yang, X.D.; Xu, Y.; Liang, L.; Wang, S.G. Land use classification of farming areas based on feature-prAFerred random forest algorithm. Trans. Chin. Soc. Agric. Eng. 2020, 36, 244–250. (In Chinese) [Google Scholar]
  26. Khan, M.S.; Ullah, S.; Chen, L. Comparison on Land-Use/Land-Cover Indices in Explaining Land Surface Temperature Variations in the City of Beijing, China. Land 2021, 10, 1018. [Google Scholar] [CrossRef]
  27. Amato, F.; Coppolino, L.; Cozzolino, G.; Mazzeo, G.; Nardone, O. Enhancing random forest classification with nlp in dameh: A system for data management in ehealth domain. Neurocomputing 2021, 444, 79–91. [Google Scholar] [CrossRef]
  28. Hu, A.T. Plant Nutrition; Agricultural University Press: Beijing, China, 2003; pp. 20–124. ISBN 978-7-81066-513-1. (In Chinese) [Google Scholar]
  29. Hou, W.; Trnkner, M.; Lu, J.; Yan, J.; Li, X. Diagnosis of nitrogen nutrition in rice leaves influenced by potassium levels. Front. Recent Dev. Plant Sci. 2020, 11, 165. [Google Scholar] [CrossRef] [Green Version]
  30. Reuter, D.J.; Robinson, J.B. Plant Analysis: An Interpretation Manual. Tree Physiol. 1998, 18, 349. [Google Scholar] [CrossRef]
  31. Wang, K.Z.; Hu, M.; Fan, Y.F.; Li, M.Q.; Sun, L.; Yang, Y. Evaluation and analysis of agricultural soil nutrient abundance and deficiency in Dali County. J. Agric. Biotechnol. 2018, 34, 64–68. (In Chinese) [Google Scholar]
  32. Wang, C.Q.; Li, B.; Gong, B.; Yang, J.; Zhang, X.Z.; Cai, Y. Study on the Bioavailability and Impact Factors of Fe, Mn, Cu and Zn in the Soils of Xichang City. Chin. J. Soil Sci. 2010, 41, 447–451. (In Chinese) [Google Scholar]
  33. Jin, H.; Cui, X.M.; Zhu, Y.; Chen, Z.J.; Zhang, J.Y.; Shi, L.H. Soil nutrient analysis and soil fertility diagnosis in GAP base of Panax notoginseng. Southwest China J. Agric. Sci. 2006, 19, 100–102. (In Chinese) [Google Scholar]
  34. Liao, X.J.; Tang, S.M.; Wu, D.; Feng, Y.S.; Xia, C.J. Soil environment of mango orchards in Hainan and its effect on mango quality. Ecol. Environ. 2008, 17, 277–283. (In Chinese) [Google Scholar]
  35. Liu, G.Y.; Wei, J.Y.; Chen, Y.Y.; Liu, D.B. Effect of soil water content on postharvest quality of mango fruits. Guizhou Agric. Sci. 2015, 43, 127–130. (In Chinese) [Google Scholar]
  36. Lin, J.M. Research on Nutritional Characteristics and Diagnostic Methods of Red Golden Dragon Mango; Hainan University: Haikou, China, 2012; pp. 20–50. (In Chinese) [Google Scholar]
  37. Wang, Y.R.; Kang, Z.M.; Bai, T.Y.; Lin, D. Nutritional diagnosis study of Kettle mango. Mod. Agric. Sci. Technol. 2018, 7, 80–81. (In Chinese) [Google Scholar]
  38. Paul, E.A. The nature and dynamics of soil organic matter: Plant inputs, microbial transformations, and organic matter stabilization. Soil Biol. Biochem. 2016, 98, 109–126. [Google Scholar] [CrossRef] [Green Version]
  39. Xia, J.; Wang, J.; Zhang, L.; Wang, X.; Feng, X. Mass balance of nine trace elements in two karst catchments in southwest China. Sci. Total Environ. 2021, 786, 147504. [Google Scholar] [CrossRef] [PubMed]
  40. He, J.; Zhang, K.; Cao, Z.; Ke, Q. Tracer vertical movement and its affecting factors in karst soil profiles in simulated leaching context. J. Soils Sediments 2021, 22, 229–237. [Google Scholar] [CrossRef]
  41. Liu, P. Research progress on the effects of boron stress on plants and the relationship between boron and other elements. J. Agro-Environ. Sci. 2002, 4, 372–374. (In Chinese) [Google Scholar]
  42. Li, M.J.; Li, N.; Xu, G.; Zhao, L.X.; Ru, S.T. Magnetic boron nitride nanosheets as a novel magnetic solid-phase extraction adsorbent for the determination of plant growth regulators in tomatoes. Food Chem. 2021, 348, 129103. [Google Scholar] [CrossRef]
  43. Gonzalo, M.J.; Lucena, J.J.; Hernández-Apaolaza, L. Effect of silicon addition on soybean (Glycine max) and cucumber (Cucumis sativus) plants grown under iron deficiency. Plant Physiol. Biochem. 2013, 70, 455–461. [Google Scholar] [CrossRef]
  44. Hu, Y.Y.; Dong, Z.Y.; Ji, C.R. Effect of calcium on stress tolerance and yield of rice. Mod. Agric. 2017, 11, 27–28. (In Chinese) [Google Scholar]
  45. Edleusa, P.S.; Wanessa, A.E.; Jeferson, T.P.; Jonas, E. Effect of foliar application rates of calcium and boron on yield and yield attributes of soybean (glycine max). Afr. J. Agric. Res. 2015, 10, 170–173. [Google Scholar] [CrossRef] [Green Version]
  46. Yan, T.; Xue, J.; Zhou, Z.; Wu, Y. Biochar-based fertilizer amendments improve the soil microbial community structure in a karst mountainous area. Sci. Total Environ. 2021, 794, 14875. [Google Scholar] [CrossRef] [PubMed]
  47. Manna, M.C.; Swarup, A.; Wanjari, R.H.; Ravankar, H.N.; Mishra, B.; Saha, M.N. Long-term effect of fertilizer and manure application on soil organic carbon storage, soil quality and yield sustainability under sub-humid and semi-arid tropical India. Field Crop. Res. 2005, 93, 264–280. [Google Scholar] [CrossRef]
  48. Si, R.T.; Liu, W.; Lin, D. Effect of partial substitution of organic fertilizer for chemical fertilizer on yield and quality of Tainan mango. Soil Fert. Sci. China 2020, 4, 107–114. (In Chinese) [Google Scholar]
  49. Zang, X.P.; Zhou, Z.X.; Lin, X.E.; Dai, M.J.; Ge, Y.; Liu, H.X.; Ma, W.H. Effects of different amounts of organic fertilizers on fruit quality and soil fertility of mango. Soil Fert. Sci. China 2016, 1, 98–101. (In Chinese) [Google Scholar]
Figure 1. Location of the study area and growth of mangoes. (a) Geographical location of the study area, (b) main mango producing areas and the exact location of the study area in Baise City, (c) live picture of peak-cluster depression and the allocation of sampling.
Land 11 00970 g001
Figure 2. Soil and mango leaf key factor screening. (a) Eigenvalues of the key indexes of mango leaves. (b) Characteristic values of key indicators of soil indicators.
Land 11 00970 g002
Figure 3. Redundancy analysis (RDA) of soil and mango key factors. (a) RDA results of soil key indicators and mango key indicators, (b) Clustering of quadrats of different geomorphic parts.
Land 11 00970 g003
Figure 4. Uptake and utilization relations of Fe, Mn, and Ca elements in mango. (a) Relationship between Caex content in soil and Ca content in mango leaves, (b) Relationship between AFe content in soil and Fe content in mango leaves, (c) Relationship between AMn content in soil and Mn content in mango leaves.
Land 11 00970 g004
Table 1. Diagnostic criteria of elements in mango leaves [28,29,30].
N
(g/kg)
P
(g/kg)
K
(g/kg)
Ca
(g/kg)
Mg
(g/kg)
S
(g/kg)
Fe
(mg/kg)
Mn
(mg/kg)
Cu (mg/kg)Zn (mg/kg)B (mg/kg)
14.87–17.270.69–0.894.45–6.909.51–16.551.44–2.200.76–1.06100–130640–10205.41–8.897.91–18.958.38–16.23
Table 2. Diagnostic results of elements in mango leaves.
IndexSlopeTransition ZonePassesHigh Yielding
Depressions
Low Yielding
Depressions
N (mg/kg)18.15 ± 0.09
(Excess)
15.96 ± 0.07
(Normal)
16.10 ± 0.09
(Normal)
17.62 ± 0.00
(Excess)
19.58 ± 0.01
(Excess)
P (g/kg)1.32 ± 0.04
(Excess)
0.88 ± 0.03
(Normal)
1.14 ± 0.26
(Excess)
0.82 ± 0.00
(Normal)
1.10 ± 0.00
(Excess)
K (g/kg)7.39 ± 0.09
(Excess)
6.96 ± 0.12
(Excess)
7.71 ± 0.13
(Excess)
6.20 ± 0.11
(Normal)
6.89 ± 0.08
(Normal)
S (g/kg)0.83 ± 0.03
(Normal)
0.81 ± 0.05
(Normal)
0.76 ± 0.01
(Normal)
0.86 ± 0.03
(Normal)
0.10 ± 0.03
(Normal)
Cu (mg/kg)4.59 ± 0.27
(Deficient)
5.34 ± 0.09
(Deficient)
4.29 ± 0.14
(Deficient)
9.71 ± 0.09
(Excess)
8.62 ± 1.49
(Normal)
Mn (mg/kg)805 ± 100
(Normal)
995± 10
(Normal)
460 ± 120
(Deficient)
1055 ± 70
(Normal)
140 ± 100
(Excess)
Zn (mg/kg)12.15 ± 0.25
(Normal)
12.55 ± 0.05
(Normal)
12.05 ± 0.05
(Normal)
9.34 ± 0.08
(Normal)
12.65 ± 1.75
(Normal)
Fe (mg/kg)87.50 ± 0.00
(Deficient)
99.50 ± 10.00
(Deficient)
86.50 ± 3.00
(Deficient)
87.50 ± 10.00
(Deficient)
94.50 ± 10.00
(Deficient)
B (mg/kg)7.97 ± 0.46
(Deficient)
12.70 ± 0.90
(Normal)
11.45 ± 0.25
(Normal)
9.84 ± 1.65
(Normal)
9.48 ± 0.72
(Normal)
Ca (g/kg)22.65 ± 0.25
(Excess)
21.80 ± 0.30
(Excess)
21.70 ± 1.90
(Excess)
26.60 ± 1.30
(Excess)
25.30 ± 1.80
(Excess)
Mg (g/kg)1.35 ± 0.04
(Deficient)
1.22 ± 0.12
(Deficient)
0.93 ± 0.03
(Deficient)
1.31 ± 0.02
(Deficient)
1.24 ± 0.03
(Deficient)
Note: The ± indicates the standard deviation of data.
Table 3. Classification standard for soil nutrient content.
Effective State IndexVery LowLowMediumHighVery HighThreshold
SOM (g/kg)<5.005.10-15.0015.10-30.0030.10-50.00>50.0015.00
pH<5.505.60-6.506.60-7.507.60-8.50>8.506.50
TN (mg/kg)<500501-750751-10001001-2000>2000750
TP (g/kg)<0.200.21-0.400.41-0.600.61-1.00>1.000.40
AB (mg/kg)<0.250.25-0.500.51-1.001.10-2.00>2.000.50
ACu (mg/kg)<0.100.10-0.200.21-1.001.10-1.80>1.800.20
AFe (mg/kg)<5.005.00-7.007.00-10.0010.00-15.00>15.007.00
AMn (mg/kg)<50.0050.00-100.00100.00-200.00200.00-300.00>300.00100.00
AZn (mg/kg)<0.500.50-1.001.10-2.002.10-5.00>5.001.00
AMo (mg/kg)<0.100.10-0.150.16-0.200.21-0.30>0.300.15
AHN (mg/kg)<50.0050.10-100.00100.00-150.00150.00-200.00>200.00100.00
AK (mg/kg)<50.0050.10-100.00100.00-150.00150.00-200.00>200.00100.00
AS (mg/kg)<100100-250251-10001001-2000>2000250
Mgex (mol/kg)<25.0025.00-50.0050.00-100.00100.00-200.00>200.0050.00
Note: SOM, TN, TP, AB, ACu, AFe, AMn, AZn, AMo, AHN, AK, ES, and Mgex respectively represent soil organic matter, total nitrogen, total phosphorus, available B, available Cu, available Fe, available Mn, available Zn, available Mo, available K, available S, and exchange Mg.
Table 4. Difference of soil nutrient index concentrations in different geomorphic parts.
IndexSlopeTransition ZonePassesHigh-Yielding
Depressions
Low-Yielding
Depressions
SOM (g/kg)38.70 ± 4.60
(High)
14.93 ± 6.10
(Low)
23.30 ± 5.90
(Medium)
20.72 ± 5.30
(Medium)
23.06 ± 3.70
(Medium)
pH5.70 ± 0.22
(Low)
6.09 ± 0.27
(Low)
7.06 ± 0.15
(Medium)
5.90 ± 0.68
(Low)
6.29 ± 0.49
(Low)
TN (mg/kg)2507 ± 250
(Very high)
1722± 308
(High)
2076 ± 171
(Very high)
1949 ± 275
(High)
1782± 195
(High)
TP (g/kg)0.53 ± 0.02
(Medium)
0.44 ± 0.09
(Medium)
0.58 ± 0.13
(Medium)
0.63 ± 0.18
(High)
0.59 ± 0.13
(Medium)
AB (mg/kg)0.15 ± 0.05
(Very low)
0.07 ± 0.01
(Very low)
0.16 ± 0.08
(Very low)
0.09 ± 0.04
(Very low)
0.13 ± 0.04
(Very low)
ACu (mg/kg)1.15 ± 0.16
(High)
0.72 ± 0.33
(Medium)
1.06 ± 0.04
(High)
1.28 ± 0.36
(High)
1.67 ± 0.36
(High)
AFe (mg/kg)36.17 ± 9.42
(Very high)
26.10 ± 8.60
(Very high)
23.50 ± 5.90
(Very high)
40.30 ± 20.50
(Very high)
45.30 ± 14.50
(Very high)
AMn (mg/kg)57.90 ± 33.20
(Low)
74.90 ± 38.00
(Low)
50.00 ± 32.90
(Low)
103.40 ± 68.30
(High)
126.90 ± 38.40
(High)
AZn (mg/kg)0.62 ± 0.50
(Low)
0.42 ± 0.35
(Very low)
0.72 ± 0.62
(Low)
0.90 ± 0.74
(Low)
0.97 ± 0.60
(Low)
Amo (mg/kg)0.69 ± 0.13
(Very high)
1.28 ± 0.18
(Very high)
1.05 ± 0.36
(Very high)
1.10 ± 0.07
(Very high)
1.20 ± 0.05
(Very high)
AHN (mg/kg)151.00 ± 20.60
(High)
70.30 ± 31.90
(Low)
87.70 ± 18.70
(Low)
107.30 ± 49.60
(Medium)
77.30 ± 23.40
(Low)
AK (mg/kg)99.70 ± 49.50
(Low)
107.50 ± 48.30
(Medium)
61.30 ± 22.50
(Low)
101.80 ± 54.50
(Medium)
67.70 ± 43.20
(Low)
Caex (mg/kg)320.00 ± 5.90
(Medium)
216.00 ± 87.00
(Low)
472.00 ± 27.00
(Medium)
232.00 ± 14.00
(Low)
328.00 ± 17.00
(Medium)
Mgex (mg/kg)177.00 ± 3.50
(High)
141.00 ± 10.00
(High)
100.80 ± 1.20
(High)
91.20 ± 7.00
(Medium)
158.40 ± 9.99
(High)
Note: The ± indicates the standard deviation of data.
Publisher’s Note: MDPI stays neutral with regard to jurisdictional claims in published maps and institutional affiliations.

