Article

On the Optimal Allocation of Urban and Rural Land Resources in Rapidly Urbanizing Areas of the Yangtze River Delta, China: A Case Study of the Nanjing Jiangbei New Area

1
School of Geography and Ocean Science, Nanjing University, Nanjing 210009, China
2
Nanjing Institute of Geography and Limnology, Chinese Academy of Sciences, Nanjing 210008, China
3
University of Chinese Academy of Sciences, Beijing 100049, China
*
Author to whom correspondence should be addressed.
Land 2022, 11(8), 1193; https://doi.org/10.3390/land11081193
Submission received: 12 July 2022 / Revised: 27 July 2022 / Accepted: 27 July 2022 / Published: 29 July 2022
(This article belongs to the Special Issue Regional Sustainable Development of Yangtze River Delta, China)

Abstract

:
In the process of rapid urbanization, the coordination of the population–land relationship, the optimal allocation of land resources, and the improvement in land-use efficiency are the keys to ensuring the sustainable development of the region. This study takes the Nanjing Jiangbei New Area (NJNA), a national development zone in China, as a case study to construct an analytical framework for the regional population–land–industry (PLI) coupling coordination relationship. A spatial organization model of population–land (PL) flow is used to calculate the coupling coordination degree of PLI factors. The allocation of land resources is adjusted and optimized through the characteristics of the actual population served in the area to determine the new urban population that can be effectively accommodated by the new district. The comprehensive evaluation of the coordination degree of PLI coupling shows that the area connected with Jiangpu and Dacang Street has high development potential in terms of population concentration and construction land layout and can be used as a key area for future development. Based on the analysis of the spatial layout of the PL flow, further suggestions are made to optimize planning for the future population concentration area in NJNA. This study can also provide a reference for the optimal management of land resources in similar areas at home and abroad.

1. Introduction

Land is the material basis for the survival and development of human society and an important foundation for sustainable social and economic development. With the continuous acceleration of global industrialization and urbanization, problems such as land nonagriculturalization, land ecological deterioration, and low land-use efficiency have become important constraints on regional sustainable development, and achieving sustainable land use has become an important issue of global concern [1,2,3]. The optimal allocation of land resources refers to the rational allocation of a certain amount of land resources on the basis of the characteristics of the land and the use of scientific and technological and management tools to achieve sustainable land resource use, which is an important guarantee for the sustainable development of the national economy [4,5]. Scientific, rational, and effective land-use patterns are important aspects of alleviating resource, population, and environmental problems [6]. From the publication of Our Common Future in 1987 to the release of Agenda 21 at the World Conference on Environment and Development in 1992, the new philosophy of sustainable development has been largely accepted worldwide [7,8], and achieving sustainable land resource use and management has become a common goal of all countries in the new era. At the same time, population movement, as an important driving force triggering changes in demand for land resources, profoundly affects regional economic and social development [9]. With accelerated urbanization in China, the combination of the scarcity of land resources and the inefficient allocation of land resources has become a core issue [10]. Therefore, it is necessary to analyse the coupling of population movement and the land’s carrying capacity, coordinate the orderly movement of the population, and reasonably allocate land resources to ensure the rational use of land resources and the healthy and sustainable development of the regional economy and society. Since 2018, the integrated development of the Yangtze River Delta (YRD) has been a national strategy in China. As an economically developed and densely populated region, the YRD is a model and a forerunner of urbanization in most regions of China [11,12]. As a world-class urban agglomeration, the YRD region has realized rapid economic, population, and industrial agglomeration through rapid industrialization and urbanization [13,14], resulting in considerable development achievements. The YRD region is at the forefront among regions in China [2], especially at the level of development zones and new areas, serving as an example for other urbanizing areas. However, the industrial-development-oriented model of development zones and new areas is accompanied by high population and economic densities, as well as high resource and environmental pressure in the region, causing new areas within the YRD to suffer from a variety of problems and incongruities, such as tight land resource constraints, unbalanced urban—rural development, and population–land (PL) misallocation [15]. In new urbanization, it is necessary to coordinate the PL relationship, promote the optimal allocation of urban and rural land resources, and improve land-use efficiency [16,17,18]. In view of the social nature of humans and the spatial variability in population flow, how are population flows coordinated and optimized, the allocation of land resource factors optimized, space utilization efficiency utilized, and integrated urban—rural development coordinated in the typical regional process of rapid urbanization? This question needs to be further answered from both theoretical and practical perspectives, and it is necessary to strengthen research and start addressing the problem, especially at the level of new national areas with an exemplary and leading role in regional development. Therefore, this study analyses the coordination degree of population–land–industry (PLI) coupling in rapidly urbanizing regions, constructs a model to measure the threshold value of urban and rural construction land scales, builds a spatial organization model of PL flow based on population flow data, and conducts spatial overlay analysis. The model is based on population flow data, and a spatial organization model of PL flow is constructed for spatial overlay analysis. The model can identify the coordination between population flow and land-use allocation more clearly by combining the regional population flow situation and then propose differential allocation of construction land indicators, which is expected to provide spatial analysis support for optimizing the spatial layout of regional urban and rural land resources.

2. Literature Review

The optimal allocation of land use has received increasingly widespread attention as an important issue in regional sustainable development. In recent years, researchers have conducted in-depth studies on the coupling of land use and the ecological environment, the optimization of land-use structure, and the comprehensive evaluation of land use [19]. The main areas of research on the optimal allocation of land resources by researchers outside China involve the mechanisms of urbanization, agricultural development, and optimal land allocation [20,21,22]; the allocation of land resources under different land-use patterns; the optimal allocation of land use for industries, such as agriculture, forestry, and transportation [23,24]; and land-use policies and their role in land-use allocation [25,26]. These studies cover a wide range of areas, provide in-depth investigations, and are conducted with advanced technical means. Some countries have achieved optimal land resource allocation by formulating countermeasures to address land-use problems in urbanization. For example, the United Kingdom focuses on the development of small towns to alleviate the population pressure faced by large cities, thereby mitigating construction land expansion in large cities [27,28]; Israel and the United States prefer to guide the development of small towns by formulating relevant plans that are scientifically sound and sustainable; and South Korea has developed a 10-year comprehensive plan for supporting small towns to address, to some extent, the problems of rural hollowing out and the increasing imbalance between urban and rural development [29,30]. Regarding research by Chinese scholars on the optimal allocation of land use, the basic theoretical research on land evaluations, land-use planning, land-use system engineering, and urban land grading and valuation has been continuously deepened, and land-use research fields have gradually expanded to include, for example, agriculture, forestry, and animal husbandry land; urban land; rural residential land; and tourism land. Methods for the optimal allocation of land resources can be divided into “top-down” and “bottom-up” models [31]. “Top-down” models focus on the overall situation in a region and obtain a series of optimal solutions by considering the global objectives of the region; however, it is difficult for this approach to reflect the evolutionary pattern of microscale spaces and the decision-making process. In comparison, the “bottom-up” model tends to simulate the multiagent decision-making process at the microscale, focusing on the detailed expression of local characteristics, but it is difficult for this approach to meet global multiobjective optimization requirements. For example, Chuvieco combined the linear programming model as a geospatial modelling tool with a geographic information system (GIS) to study the Mediterranean coastal region of Spain with the lowest rural unemployment rate as the objective function to achieve land-use optimization; Ma et al. applied the particle swarm optimization (PSO) algorithm to simulate the optimization of the spatial structure of land use with real datasets, and their results showed that the PSO model has the ability to optimize the quantity and spatial structure of land use [32]. Overall, most models are limited to the optimization of the quantity or spatial structure of land use alone; there is still a lack of research on the coupling and correlation of populations, with factors such as land and industry leading to optimization results that do not match the actual development needs and cannot fundamentally solve the contradiction between population and industrial development on land resource demand. Considering that the optimal allocation of land resources is a complex system engineering problem involving a multiobjective and multilevel continuous fitting and decision-making process, it is necessary to realize the optimal allocation of land resources by constructing a model. Therefore, by coupling and correlating regional population, land, and industry elements; analysing the coordination among regional population flow, land supply, and industrial development demand; and putting forward optimization suggestions accordingly, the conflicts between population, land, and industrial development can be alleviated to a certain extent, which is of great value for improving regional land resource efficiency.

3. Study Area and Methods

3.1. Overview of the Study Area

China’s development zones can be divided into two categories. The first category is approved by China’s State Council and comprises the national-level development zones, including economic and technological development zones, high-tech industrial development zones, bonded zones, export processing zones, border economic cooperation zones, and other types of development zones. The second category consists of the provincial-level development zones approved by the provincial people’s governments, which are divided into provincial-level economic development zones, provincial-level high-tech industrial parks, and provincial-level special industrial parks. Nanjing Jiangbei New Area (NJNA) was approved by the State Council of China on 27 June 2015 and is the 13th national-level development zone in China and the first in Jiangsu Province (Figure 1). It is located in the city of Nanjing, Jiangsu Province, and to the north of the Yangtze River, including the administrative areas of Pukou and Liuhe Districts and the Baguazhou Subdistrict of Qixia District, with a planned area of 788 km2. The current construction land area is 152 square kilometres, accounting for 39.35% of the total land area; the other construction land area is 13.6 square kilometres, accounting for 3.53% of the total land area; and the non-construction land area is 220.6 square kilometres, accounting for 57.12% of the total land area. NJNA is situated at the intersection of the coastal economic belt and the Yangtze River Economic Belt, as well as at the juncture of the Yangtze River golden waterway and the Beijing–Shanghai Railway, connecting the south to the north and the river to the sea, exhibiting remarkable locational advantages. The official approval of NJNA is highly valuable to the development and layout optimization of China’s regional productivity, as well as to the implementation of regional coordinated development strategies. NJNA is the first national new area in Jiangsu Province and serves as an important hub. According to the State Council and the National Development and Reform Commission, NJNA is functionally positioned as “a pioneering area of independent innovation, a demonstration area of new-type urbanization, a modern industrial agglomeration area in the YRD region, and an important platform for opening up and cooperation in the Yangtze River Economic Belt” (“three areas and one platform”). To implement the development strategy for the Yangtze River Economic Belt and the integrated development strategy for the YRD, the development of NJNA must adhere to people-centred urbanization, coordinate the increase in urban population settlement and the growth in urban construction land in the new area, promote the construction of new Jiangsu with a “strong economy, rich people, beautiful environment, and high level of social civilization,” and increase the urban primacy index of Nanjing. NJNA is an important urban—rural connection area in Nanjing, a growth pole and main arena of economic development in Nanjing, and a new downtown area and space for urban construction. Taking NJNA as an example to explore the optimal allocation of urban and rural land resources not only helps enhance the overall development potential and capacity of Nanjing but also provides an important driver for the optimal allocation of land resources in other new areas.

3.2. Research Framework and Methods

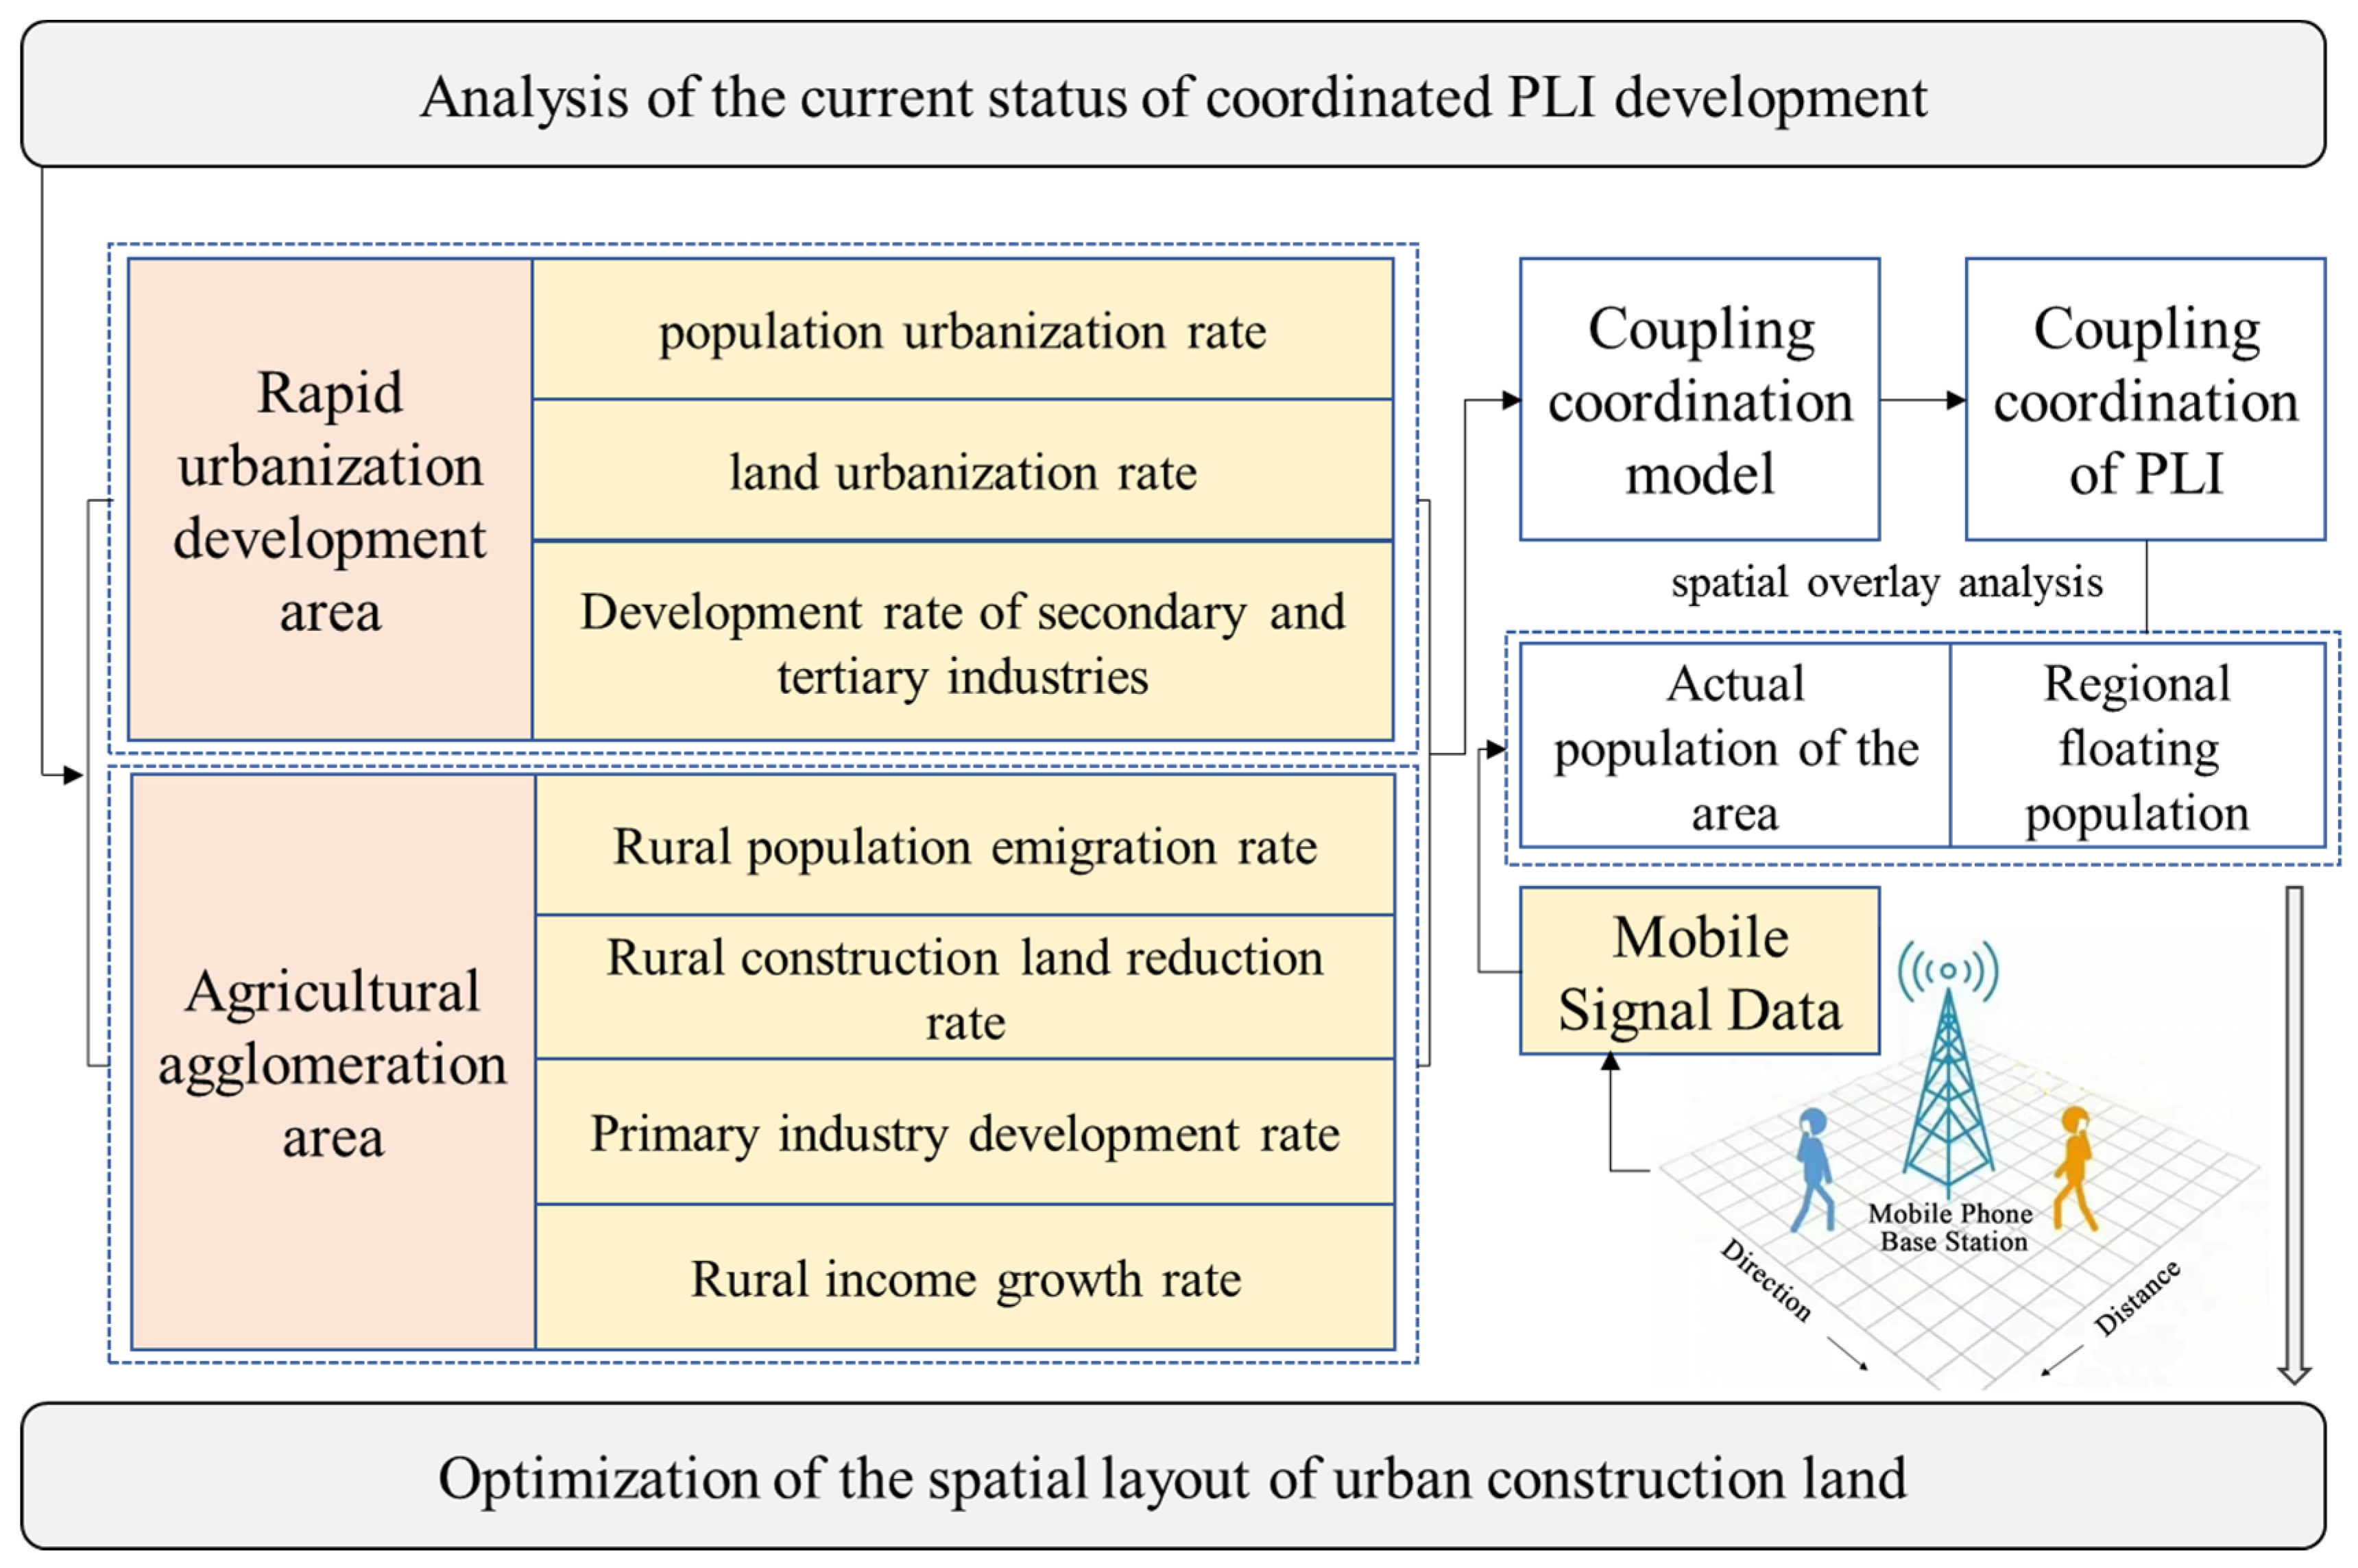
3.2.1. Research Design and Framework

In this work, one of China’s national new areas (NJNA) is used as a case study to analyse the regional PLI coupling coordination relationship, construct a spatial organization model of PL flow, calculate the coupling coordination degree of PLI factors, and analyse the efficiency of resource allocation at a spatial scale. Based on the spatial flow of populations in the region, the limits of existing administrative jurisdictions on land-use planning quotas and planning space allocation are broken. The land demand associated with population flows is generated based on the flow of geographic factors. On this basis, in this study, the spatial demand for land use generated by population flows is analysed, the spatial allocation and transfer of land resources are carried out and promoted, the agglomeration and diffusion of population and land resource factors are realized, and a spatial organization model of PL flow is constructed. This study contributes to expanding the theoretical knowledge and methodological ideas for research on the optimal allocation of urban and rural land resources under new-type urbanization (Figure 2). The specific process is as follows. (1) Analysis of the PLI coupling coordination degree of rapid urbanization areas and agricultural production concentration areas. The population urbanization rate, land urbanization rate, and nonagricultural industry development rate are used to represent the specific quantitative PLI indicators for rapid urbanization areas. The emigration rate of agricultural populations, the reduction rate of rural construction land (reclamation of rural settlements), the development rate of the primary industry, and the growth rate of rural income are used as specific quantitative PLI indicators for agricultural production concentration areas. The PLI coupling degree of rapid urbanization areas and agricultural production areas is input into the model analysis, and, using a coupling coordination degree model, the PLI relationship is expressed by the degree of interrelation and coordination of indicators. (2) Spatial optimization of planning implemented based on the PL linkage. Big data of mobile phone signalling are used to calculate the population actually served and the migrant population, based on which the spatial measurement and spatial overlay analysis of PL flow are carried out to propose a guiding strategy for optimizing the spatial layout of urban construction land.

3.2.2. PLI Coupling Coordination Analysis

Coupling coordination analysis originated from the related concepts and theories of physical electronics. In this study, population, land resources, and economic development are treated as interrelated systems to construct a coupling coordination degree model and to simulate and analyse the degree of coordination and coupling of factors within two (or more) systems. With reference to relevant research results, PLI coupling is divided into four types based on degree and status [33,34]. The C value reflects the coupling degree of population, land, and economic and industrial development and is taken in the range of [0, 1]. The larger the C value is, the higher the degree of mutual coupling and coordination among the factors. Conversely, the smaller the D value is, the more the coupled system evolves in the direction of dysfunction and disorder. Referring to relevant research, the equilibrium distribution function method is used to divide the value of the PLI coupling coordination degree into 10 consecutive intervals to determine different coupling coordination statuses [35,36]. The H value represents the comprehensive evaluation index (Table 1) and is taken in the range of [0, 1]. Referring to relevant research, an H value in the range of [0–0.4] is defined as a low degree of coupling coordination, representing low coupling coordination among population, land, and industrial nonagriculturalization, with primary industry accounting for a certain proportion, relatively lagging industrialization and urbanization, and a low scale and rate of conversion of agricultural land to construction land. An H value in the range of [0.4–0.7] is defined as a moderate degree of coupling coordination, meaning that the coupling coordination among population, land, and industrial nonagriculturalization is at a moderate level and the population gradually becomes concentrated during the process of urbanization and industrialization. An H value in the range of [0.7–1] is defined as a high degree of coupling coordination, indicating that, with the rapid development of the regional economy, industrial agglomeration, transformation, and upgrading promote a significant increase in urbanization and a large, concentrated population, which provides labour sources for different levels of services, while a large amount of agricultural land is converted to construction land, and urban land expands spatially at a high intensity [17].
The population urbanization rate, land urbanization rate, and nonagricultural industry development rate are used to represent the specific quantitative indicators of PLI in rapid urbanization areas. The PLI coupling coordination degree of rapid urbanization areas is calculated as follows:
C 1 = 3 × [ U i × L i × D i ( U i + L i + D i ) 3 ] 1 3
H 1 = C 1 × T 1 ,   T 1 = α U + ρ L + γ D
where C1 represents the degree of coupling, H1 denotes the degree of coupling coordination, and T1 is the comprehensive evaluation index of population, land urbanization, and industrial nonagriculturalization; a, q, and r are coefficients to be determined; a = r = 0.4, and q = 0.2. Ui = PUi/Pi is the population urbanization rate, with PUi and Pi representing the urban population and the total regional population, respectively; Li = LUi/L is the land urbanization rate, with LUi and L denoting the area of urban construction land and the total regional land area, respectively; and Di = (SGDPi + TGDPi)/GDPi is the nonagricultural industry development rate, with SGDPi and TGDPi representing the added values of the secondary and tertiary industries, respectively; while GDPi denotes the gross domestic product and i represents the study unit.
The specific quantitative indicators of PLI are represented by the emigration rate of agricultural population, the reduction rate of rural construction land (reclamation of rural settlements), the development rate of primary industry, and the growth rate of rural income. The coupling coordination degree of agricultural production concentration areas is calculated as follows:
C 2 = 4 × [ J i × L u i × F i × S i ( J i + L u i + F i + S i ) 4 ] 1 4
H 2 = C 2 × T 2 ,   T 2 = α J + β L + γ F + g S
where C2 is the degree of coupling; H2 is the degree of coupling coordination; T2 is the comprehensive evaluation index for the emigration rate of the agricultural population, the reduction rate of rural construction land (reclamation of rural settlements), the development rate of the primary industry, and the growth rate of rural income; and a, q, r, and g are the corresponding coefficients to be determined. Because the emigration rate of the agricultural population, the development rate of the primary industry, and the growth rate of rural income are equally important, a = r = 0.3 and q = g = 0.2. Ni = (Pi − P0)/Pi is the emigration rate of the agricultural population, with P0 and Pi representing the agricultural population of the region in 2015 and 2018, respectively; Ji = (JU0 − JUIi)/JU0 is the reduction rate of rural construction land, with JU0 and JUi denoting the rural construction land of the region in 2015 and 2018, respectively; Fi = (FGDPi − FGDP0)/FGDP0 is the development rate of the primary industry, with FGDP0 and FGDPi representing the added value of the primary industry in the region in 2015 and 2018, respectively; and Si = (Si − S0)/S0 is the growth rate of rural income, with S0 and Si representing the rural net disposable income in the region in 2015 and 2018, respectively.

3.2.3. Method for Spatial Optimization of Planning Implemented Based on the PL Linkage

Population flow refers to the migration of a population from a certain region to another. Tourism, work trips, medical treatment, and family visits are all social activities that promote population flows [37]. In terms of spatial carriers, the demands of population flows consist of basic public service facilities, labour and employment facilities, and commercial service facilities. Castells studied “flow space” from a sociological perspective, defining “flow space” as a material organization in which the components interact with each other through “flow” with a temporal component [38]. Our study introduces the concept of flow space to construct a spatial organization model of PL flow, which is based on the spatial flow of the population in the region and addresses the limitations imposed by administrative jurisdiction on the land-use planning quota and planned spatial allocation. The model fully considers the spatial flow characteristics of geographical factors. Based on the characteristics of the spatial correlation between population flows and land-use demand, the model analyses the spatial demand for land generated by population flows and then conducts spatially differentiated land resource allocation and optimization and analyses the agglomeration and diffusion of the population and land resource factors.
Our study uses the regional population served and the regional migrant population (i.e., those who are residents for less than six months and are counted among the regional population served) obtained from big data on mobile phone signalling to analyse the coupling relationship between the regional migrant population and new urban construction land. Factors such as economic development level, industrial structure, investment drivers, and household registration policies are included in the model as control variables (Table 2) to estimate the influence of population size on urban construction land expansion.
To avoid multicollinearity among multiple variables, a variance inflation factor (VIF) was introduced for testing. A larger VIF indicates a more serious multicollinearity problem, and a rule of thumb is that the problem is not serious if the maximum VIF does not exceed 10. Stata 15.0 software was used to conduct multicollinearity analysis with four control variables, i.e., GDP, proportion of the secondary industry (C), household registration system (F), and population flow (M). Using Stata 15.0 software, the mixed ordinary least-squares (OLS) model, fixed-effects, and random-effects were estimated separately. First, depending on the F test results, the mixed OLS model was used if the p value > 0.05; otherwise, the fixed-effect or random-effect model was used. The Hausman test was performed on fixed effects and random effects, and random effects were used if the test results were significant (p > 0.05); otherwise, fixed effects were used.
The “relationships” in the population flow network are quantified to analyse the characteristics and patterns of the overall structure and local nodes. The degree centrality C0(Si) in social network analysis is adopted to describe the population flow and is used as the spatial organization model of PL flow for calibration.
C 0 ( S i ) = i = 1 g S i j ( i j )
where C 0 ( S i ) is the degree centrality of node i ; S i j is the sum of the numbers of connections between node i and other g 1 nodes; and the sum of the values in rows and columns where node i is located is calculated, excluding the connections between node i and itself.
According to the Code for Classification of Urban Land Use and Planning Standards of Development Land (GB50137-2011), land types other than residential land and industrial land are merged into service management land based on the division into production land, support land, and living land, as well as the division into lands for living, production, public service, and ecological functions to achieve a vertical comparison. Considering that the goal of optimizing urban and rural land resource allocation is to continuously improve the degree of coordination of population, economy, and land resource allocation in the region, the degree of comprehensive coordination of PLI coupling, H, is used as an adjustment factor for the spatial organization of the PL flow. Its specific calculation method is described above. The model of the spatial organization of the PL flow is established as follows:
M i = F i × A 1 P i
L i = [ ( F i × A 1 P i ] H i L 1 ¯ ) + [ ( F i × A 1 P i ] H i L 2 ¯ ) · *Si
where Fi denotes the size of the population actually served; Pi represents the registered population; Mi is the size of the migrant population; A denotes the coefficient of the population served; L 1 ¯ is the demand of the migrant population for industrial land; L 2 ¯ is the demand of the migrant population for public service management land; C0(Si) is the standardized value of the degree centrality of the study unit and is a positive correlation coefficient used to adjust the demand for public service management land; and Hi is the standardized value of the PLI coupling coordination degree of the study unit, with regions with Hi lower than 0.5 being negatively correlated and those with Hi higher than 0.5 being positively correlated. After the standardization of extreme values in the measurement data Li, spatial characterization and overlay analysis were conducted using GIS software to analyse the layout pattern of the spatial organization of the PL flow.

4. Results

4.1. Analysis of PLI Coupling Coordination Degree

A model for measuring and evaluating the PLI coordination degree was constructed to evaluate the performance of the PL linkage policy at the county level and on a spatial scale, analyse the degree of matching of the immigration of urban populations with the allocation of urban construction land resources and the extent of the development of secondary and tertiary industries, analyse the degree of matching of the emigration of agricultural populations with the allocation of rural construction land resources and the development rate of the primary industry, and then analyse the PL relationship in areas with different urbanization characteristics. This study analysed the regional spatial structure characteristics of NJNA by taking the regional land space as an organic whole for planning and layout and by using the spatial measurement of PL flow. Based on the data of the population actually served and migrant population obtained from big data on mobile phone signalling, spatial overlay analysis was carried out using ArcGIS software, and guidance for the spatial layout optimization of urban construction land was proposed. A planning scenario simulation of the future urbanization of NJNA was conducted to propose future population flow strategies and optimization directions for urban space, agricultural space, and ecological space in Jiangbei under different urbanization levels and different levels of spatial planning to guide the optimal allocation of urban and rural land.
Using the aforementioned PLI coupling degree model for rapid urbanization and agglomeration areas, the current population, land, and economic data after standardization for 2018 were used to analyse the PL coupling degree for the area administered directly by NJNA (Table 3). According to the calculated index values, the PLI of the rapid urbanization area of NJNA has a coupling degree of 0.7085, a comprehensive evaluation index of 0.5807 for the coupling coordination degree, which is in the moderate range. The PLI of the spatial agglomeration area of agricultural development in NJNA (formerly Liuhe District) has a coupling degree of 0.8221, a coupling coordination degree of 0.1284, and a comprehensive evaluation index of 0.3248 for the coupling coordination degree, which is in the low range, indicating the need for further improvement. Overall, the comprehensive evaluation index of the PLI coupling coordination degree of NJNA is 0.5019, which is in the low-to-moderate range for the degree of coupling coordination, indicating that NJNA is in the running-in stage.
Currently, urban–rural development is in the urban–rural population transition and accelerated urbanization stage. In the future, a large rural population will move into cities and towns, and agricultural production will remain the basic support industry in this region. As the economic development of NJNA enters the postindustrial stage, the area under direct administration by NJNA will mainly undergo industrial restructuring, transformation, and upgrading, and the population and employment structure will also evolve. The population and employment will be concentrated in the commercial and service sectors of the tertiary industry, and the intensity of the correlation of population and land with secondary and tertiary industries will gradually increase, further enhancing the coupling coordination degree. According to the Lewis theory, when the income of urban residents and the disposable income of rural residents become closer, the effect of differences in urban–rural economic and social factors will gradually balance, and the degree of coupling coordination between population, land, and industrial nonagriculturalization will gradually balance and remain stable. Overall, before 2010, the growth rate of land urbanization in NJNA was generally higher than that of population urbanization, especially in Pukou, where large-scale urban construction and land-use expansion were more prominent. Although this problem has gradually decreased in the past few years, the gap between the quantity and quality of population urbanization still requires continuous attention and coordination.

4.2. Spatial Distribution Characteristics of PL Flow

Through the study of the distribution characteristics of the actual population served based on the cell phone signal data, the relationship among the actual population served, the resident population, and the mobile population is analysed. At the same time, the spatial layout pattern and characteristics of the spatial organization of PL flow in NJNA are analysed by combining the data of the land-use status change survey, as well as the population density, service population, and construction land distribution, to guide the optimization of urban and rural land space (Figure 3). The population density is characterized by a circular distribution with Dachang, Yanjiang, and Taishan subdistricts as the core, gradually decreasing towards the periphery. The population actually served in NJNA is characterized by a circular distribution with Xiongzhou, Dachang, Taishan, and Jiangpu subdistricts as the core, gradually decreasing towards the periphery. The spatial density of construction land is clearly characterized by a band-like core distribution along the Yangtze River, with high-value areas mainly distributed in areas such as Jiangpu, Taishan, Yanjiang, Dachang, and Changlu subdistricts. Overall, Jiangpu, Taishan, Yanjiang, and Dachang subdistricts have greater development potential in terms of population concentration and construction land layout. The core area of Pukou has a more concentrated population distribution and a higher proportion of land for residential and business services. The area around Dacang Street is more concentrated in industrial development, with a high proportion of traditional industrial land. The area around Xiongzhou Street is the regional centre of Luhe District and is a future base for the development of new industries.

4.3. Guidance for the Spatial Optimization of Planning

Based on the spatial layout of PL flow in NJNA and the current industrial development characteristics, the spatial planning is optimized to guide the future population aggregation areas in NJNA (Figure 4).
Optimizing the supply of regional land resources. First, the planned space of urban construction land should be increased in Jiangpu and Taishan subdistricts, which have high population concentrations and are undergoing a rapid increase in the urban immigrant population, and the allocation of planned new land-use quotas should be increased. Second, in the subdistricts of Changlu, Getang, and Yanjiang, the reclamation of rural construction land should be increased, the space of planned urban construction land should be moderately increased, and the allocation of quotas with an increase–decrease linkage should be increased. Third, on the basis of the thresholds for the amount of arable land and the total scale of construction land and without involving permanent basic farmland, the agricultural spatial layout of the subdistricts of Pancheng, Jiangpu, and Taishan should be moderately adjusted, and agricultural land space in the subdistricts of Dingshan and Changlu should be increased.
Reconfiguring the spatial pattern of town development. The layout of the town hierarchy of “central city-sub central city-new city-new town” is planned. Among these components, the central city is composed of two groups, Pukou and Gaoxin-Daicang, and is the regional centre of NJNA, serving the northern part of the Nanjing metropolitan area and radiating north of Jiangsu and east and north of Anhui. It is necessary to combine the industrial development function with the living function to improve the population distribution, industrial carrying capacity, and urban service level. The subcentral city consists of the Xiongzhou group and the Changlu industrial sector, which is the regional centre of NJNA radiating to the northern and eastern peripheral areas and an important new industrial base, and needs to strengthen the linkages with the main urban area of Nanjing, the central town, and the surrounding villages to promote the integrated development of urban and rural areas. The new city, including Qiaolin New City and Longbao New City, is an industrial new city along the river in Nanjing, which needs to promote the integrated development of industry and the city and provide talent, land, and industrial support for the development of the new city. The new towns, including Zhuchen, Jinniu Lake, Ma’an, Hengliang, Xingdian, Tangquan, Yongning, and Baguazhou, are key areas for ecological protection and agricultural development and need to highlight ecologically oriented economic development and strive to become idyllic towns with their own characteristics.

5. Discussion

5.1. Analysis of the Influence of the Migrant Population on Construction Land

This study used mobile-phone-signal-based population flow data obtained from the NJNA Big Data Centre and the Urbanization and Urban—Rural Planning Research Centre of Jiangsu. Data on the population actually served within NJNA were used to obtain the migrant population data on the population served. The sample data were statistical data for three months in both 2017 and 2019. Using Stata 15.0, estimation was carried out with the mixed OLS model, as well as fixed-effects and random-effects models, on the population data obtained at each base station in NJNA (Table 4). The p value was less than 0.05 according to the F test; therefore, the mixed OLS model was not adopted. Regarding the Hausman test, only the p value of the total scale effect of population on construction land was less than 0.05; therefore, the fixed-effects model was used for construction land, while random-effects analysis was conducted for both industrial land and public management and service land. Overall, the R2 and F tests were significant, and the model estimation results had a high explanatory power. There was a large difference in the demand of the migrant population for various types of urban land; therefore, the significance of the model estimation results varied widely. The migrant population had a positive impact on the total scale of construction land; however, the impact was not statistically significant, indicating that an increase in the migrant population did not necessarily increase the total scale of construction land. The nonpermanent population had a positive impact on construction land, but the significance varied greatly across different types of urban land. The increase in the migrant population had a positive impact on the expansion of industrial land and passed the 1% significance level test, probably because the short-term population for business and economic exchange influenced the expansion of industrial land. Management and service land in large cities hosts quality public services, such as culture, education, medical care, tourism, and commerce; hence, the increase in the migrant population had the largest (0.182) elasticity coefficient, which was statistically significant, for the expansion of land for public management and services.

5.2. Regional Development Orientation under Spatial Optimization

The vision for the long-term development of NJNA is to build a high-standard national new area. Thus, it is necessary to reserve sufficient space for development to ensure that the space is sufficient to support the gradual transition from a “subcentral city” and “regional centre” to a “national new area”. When determining the urban growth boundary, it is important to account for the fact that the population concentration area evolves continuously. As NJNA focuses on high-end and diversified industrial development in the future, it is still necessary to retain some traditional industries with a sound development base and a certain employment density to lower the barrier to urbanization among the local rural population and provide a motivation for population concentration and livelihood improvement. Key cities and towns have become agglomeration areas for adjusting the industrial structure of townships. Townships with concentrated industrial areas with a population of more than 50,000 will gradually develop into key cities and towns. At the stage of industrial structure development, townships need to make use of industrial development to meet local employment demand and control the speed of nonagricultural construction. The spatial layout of urban and rural land will form an “organic + clustered” development model, and life service centres will have diversified cores to meet the needs for transportation, service, and leisure industries and to improve the overall quality of life and radiating capacity of NJNA. Relying on the Pukou–Xiongzhou central city belt and organizing out and strengthening the fast-track economic development axis that radiates to the rural areas in the east and west should be areas of focus to promote the extension of quality urban resources to small towns and rural areas. A public service facility system at the “district level–subdistrict and community level–grassroots community level” is formed in urban areas, and a public service facility system at the “town level–rural community level” is formed in rural areas. The town level and rural community level in rural areas are comparable in scale to the urban residential district level and grassroots community level in urban areas, respectively.

5.3. Synthesis of Research Methods

In the context of rapid global urbanization, it is important to enhance the efficiency of land resource utilization through land-use optimization for regional sustainable development. At present, there are several studies on the optimal allocation of land resources, and most scholars have conducted comparative studies on land resource optimization from different perspectives and using different methods. In general, on the one hand, there are an increasing number of studies applying big data methods, including cell phone signal data, metro bus swipe card data, population migration flow data, and urban commuting data. For example, Liu et al. [39] constructed an intracity employment mobility network based on interregional employment mobility data decoded from cell phone signal data in Wuhan and studied the characteristics of intracity employment mobility, which found that intracity employment mobility in Wuhan was unevenly distributed in terms of quantity, and a large amount of employment mobility was concentrated among a few streets, which further gave suggestions for adjusting urban planning. On the other hand, the optimization of land resources is considered from a multifunctional perspective. For example, Sheikh et al. [40] combined multiobjective optimization and multicriteria decision models for land-use optimization to present an efficient methodology for land-use optimization based on the minimization of runoff and sediment and the maximization of economic benefits, occupational opportunities, and land-use suitability in the Tilabad watershed in northeastern Iran. Liao et al. [3] comprehensively considered three types of land functions—production, living, and ecology—and used a multiscale land-use optimization method to optimally simulate the quantitative structure and spatial distribution of land use, providing scientific support for the sustainable use of rural land resources in China. Our contribution lies in combining multifunctional scales with big data methods, introducing the concept of flow space, and combining the regional service population identified by cell phone signal data to optimize the land resource allocation analysis. This approach more carefully considers the impact of population flow on regional development and the characteristics of demand for land resources, is applicable to the study of land resource optimization in most regional development zones, and involves simple methods, accurate data, and adaptability. In addition, this method is applicable to the study of land resource optimization in most regional development zones.

5.4. Highlights and Limitations

First, this study is based on the spatial mobility characteristics of the population in the region and overcomes the limitation of administrative divisions on land-use planning indicators and spatial allocation planning. Second, the study analyses the spatial demand for land generated by population flow by combining the flow of geographical factors with the correlation characteristics of population. This approach clarifies the spatial allocation of population and land resource elements by constructing a “people–land” flow spatial organization model, which makes the allocation of land resources more in line with the actual demand. The study has certain implications for expanding the theoretical knowledge and methodological ideas on the optimal allocation of urban and rural land resources with the development of new urbanization.
Because the research topic involves a variety of socioeconomic development factors, this study has some limitations. First, on the basis of the construction and implementation of a land spatial planning system, we have explored theoretical paths and simulated planning scenarios in combination with the PL linkage policy and have proposed guidance for the spatial optimization of planning; however, we did not carry out an empirical analysis combined with specific planning cases, which should be conducted in the future. Second, the research results could be made more universal and better applied in practice by obtaining more accurate and real-time multisample data of regional population flows and migration to inform the layout of industrial development and by integrating satellite remote sensing data with socioeconomic factors.

6. Conclusions

Coordinating the regional PL relationship is an important topic in urbanization. By investigating the coordinated development relationship between population urbanization and land urbanization, this study explores the optimal allocation of urban and rural land resources in rapidly urbanizing areas and identifies the synergy between the spatial allocation of resource factors and the flow of population factors. This study provides new ideas for addressing the PL conflict and coordinating the PL relationship and provides important basic support for the implementation of land spatial planning, as well as the management and control of land use.
(1)
From the perspective of the comprehensive evaluation of the PLI coupling coordination degree, the overall NJNA has a low-to-moderate degree of coupling coordination and is in the running-in stage. Before 2010, the growth rate of land urbanization in NJNA was generally higher than that of population urbanization, especially in Pukou, where large-scale urban construction and land-use expansion were more prominent. Although this problem has gradually decreased in the past few years, the gap between the quantity and quality of population urbanization still requires continuous attention and coordination. Overall, the Jiangpu, Taishan, Yanjiang, and Dachang subdistricts have greater development potential in terms of population concentration and construction land layout.
(2)
Based on the analysis of the spatial layout of the PL flow, the spatial optimization of the future population concentration area of NJNA is proposed. First, the planned space of urban construction land should be increased in the Jiangpu and Taishan subdistricts, which have high population concentrations and rapid increases in urban immigrant populations, and the allocation of planned new land-use quotas should be increased. Second, in the subdistricts of Changlu, Getang, and Yanjiang, the reclamation of rural construction land should be increased, the space of planned urban construction land should be moderately increased, and the allocation of quotas with an increase–decrease linkage should be increased. Third, on the basis of the thresholds for the amount of arable land and the total scale of construction land and without involving permanent basic farmland, the agricultural spatial layout of the subdistricts of Pancheng, Jiangpu, and Taishan should be moderately adjusted, and agricultural land in the subdistricts of Dingshan and Changlu should be increased.
(3)
This study can also provide a reference for the optimal management of land resources in similar areas at home and abroad. First, it is necessary to strictly control the occupation of ecological and agricultural space resources by economic development and avoid inefficient development of urban space. At the same time, it is necessary to guide the allocation of various factors and resources to match the change in regional population scale and to solve the problem of “big city disease” caused by the excessive concentration of population and the problem of “hollow villages” caused by excessive population loss. Second, it is necessary to leverage urban and rural land stock resources into development advantages, shift from reliance on new construction land indexes to stock land redevelopment, and formulate new strategies for stock land utilization based on population size. Finally, it is necessary to fully consider the problem of imbalance between the increase in land scale and population in urban and rural areas and to promote the unified deployment of urban and rural construction land through information exchange and resource conversion to improve the efficiency of construction land utilization.

Author Contributions

Conceptualization and methodology, W.H.; data curation and analysis, C.L.; writing—original draft preparation, W.H. and C.L. All authors have read and agreed to the published version of the manuscript.

Funding

This study was supported by the National Nature Science Foundation of China (grant No. 41871119).

Institutional Review Board Statement

Not applicable.

Informed Consent Statement

Not applicable.

Data Availability Statement

The data presented in this study are available on request from the corresponding author.

Conflicts of Interest

The authors declare no conflict of interest.

References

  1. Dong, Z. The Evolution and Experience of China’s 70-Year Land System. China Land 2019, 10, 4–15. [Google Scholar]
  2. Yang, J.; Jin, S.; Xiao, X.; Jin, C.; Xia, J.; Li, X.; Wang, S. Local Climate Zone Ventilation and Urban Land Surface Temperatures: Towards a Performance-based and Wind-sensitive Planning Proposal in Megacities. Sustain. Cities. Soc. 2019, 47, 101487. [Google Scholar] [CrossRef]
  3. Liao, G.; He, P.; Gao, X.; Lin, Z.; Huang, C.; Zhou, W.; Deng, O.; Xu, C.; Deng, L. Land Use Optimization of Rural Production–living–ecological Space at Different Scales Based on the BP–ANN and CLUE–S models. Ecol. Indic. 2022, 137, 108710. [Google Scholar] [CrossRef]
  4. Zhou, Y. Understanding of Optimal Allocation and Sustainable Development and Utilization of Land Resources. Mod. Bus. 2019, 10, 191–192. [Google Scholar]
  5. Zhang, S.; Zhong, Q.; Chen, D.; Xu, C.; Chang, Y.; Lin, Y.; Li, B. Coupling Coordination Analysis and Prediction of Landscape Ecological Risks and Ecosystem Services in the Min River Basin. Land 2022, 11, 222. [Google Scholar] [CrossRef]
  6. Liu, Z.; Liu, L.; Fu, Y.; Zuo, D.; Yuan, C. Simulation Analysis of Agricultural Land Use Effects Relative to Policy Scenario. J. Ecol. Rural. Environ. 2015, 31, 484–491. [Google Scholar]
  7. Chen, Y. Sustainable Development: The Course and Insight of China’s 40 Years of Reform and Opening up. Renming Luntan·Xueshu Qianyan 2018, 20, 58–64. [Google Scholar]
  8. Yin, C.; Kong, X.; Liu, Y.; Wang, J.; Wang, Z. Spatiotemporal Changes in Ecologically Functional Land in China: A Quantity-quality Coupled Perspective. J. Clean. Prod. 2019, 238, 117917. [Google Scholar] [CrossRef]
  9. Yang, J.; Sun, J.; Ge, Q.; Li, X. Assessing the Impacts of Urbanization-associated Green Space on Urban Land Surface Temperature: A Case Study of Dalian, China. Urban. For. Urban. Green. 2017, 22, 1–10. [Google Scholar] [CrossRef]
  10. Shao, X.; Wang, J.; Huang, X. Thinking on the Land Use Strategy in the Developed Areas. China Land Sci. 2011, 159, 30–34. [Google Scholar]
  11. Chen, W.; Sun, W. The Spatial Division of Regional Integration in the Yangtze River Delta. Urban Plan. Forum 2020, 1, 37–40. [Google Scholar]
  12. Zhang, X.; Jin, Z.; Li, W. Paths and Suggestions for the Sharing of Scientific and Technological Innovation in the Field of Regional Natural Resources Under the Background of the Integration of the Yangtze River Delta, China. Shanghai Real Estate 2022, 5, 5–11. [Google Scholar]
  13. Li, J.; Zhang, Y. Coupling and Coordination of New Urbanization and Eco-efficiency in Yangtze River Delta Urban Agglomeration. Ecol. Econ. 2022, 38, 109–114. [Google Scholar]
  14. Yang, Q.; Duan, X.; Jin, Z.; Wang, L. Spatial Scenario Simulation and Landscape Ecological Effect Based on Construction Land Expansion of Nantong City. Sci. Geogr. Sin. 2017, 37, 528–536. [Google Scholar]
  15. Huang, X.; Song, Y. Evaluation Model of Regional Resource and Environment Comprehensive Carrying Capacity Based on the Conjugationwrestling Mechanism. J. Nat. Resour. 2019, 34, 2103–2112. [Google Scholar]
  16. Dai, Y.; Huang, X. The Innovation of the Coupling Mechanism of Land Policy in the Development of the Main City and the Construction of Characteristic Towns. Mod. Urban Res. 2017, 10, 30–37. [Google Scholar]
  17. Huang, L.; Ma, X. Spatial Coupling Cooperative Analysis of Economic Development and Rural Transformation in Jiangsu Province. Econ. Geogr. 2018, 38, 151–159. [Google Scholar]
  18. Ye, H. Thinking on the Optimization of Land Use Security Policy for Promoting the Integrated Development of the Yangtze River Delta–Based on the Practical Analysis and Innovative Thinking of the Policy Linked to Increase and Decrease. China Land 2020, 11, 4–9. [Google Scholar]
  19. Wang, X. A Summary of the Research on the Economical and Intensive Utilization of Land Resources. China Mark. Mark. 2014, 33, 126–128. [Google Scholar]
  20. Rahman, M.M.; Szabó, G. Multiobjective Urban Land Use Optimization using Spatial Data: A systematic Review. Sustain. Cities Soc. 2021, 74, 103214. [Google Scholar] [CrossRef]
  21. Jarisch, I.; Bödeker, K.; Robert Bingham, L.; Friedrich, S.; Kindu, M.; Knoke, T. The influence of discounting ecosystem services in robust multiobjective optimization–An application to a forestry-avocado land-use portfolio. For. Policy Eco. 2022, 141, 102761. [Google Scholar] [CrossRef]
  22. Inceyol, Y.; Cay, T. Comparison of Traditional Method and Genetic Algorithm Optimization in the Land Reallocation Stage of Land Consolidation. Land Use Policy 2022, 115, 105989. [Google Scholar] [CrossRef]
  23. Peltonen-Sainio, P.; Jauhiainen, L.; Laurila, H.; Sorvali, J. Land Use Optimization Tool for Sustainable Intensification of High-latitude Agricultural Systems. Land Use Policy 2019, 88, 104104. [Google Scholar] [CrossRef]
  24. Yim, K.K.W.; Wong, S.C.; Chen, A.; Wong, C.K.; Lam, W.H.K. A Reliability-based Land Use and Transportation Optimization Model. Transp. Res. Part C Emerg. Technol. 2011, 19, 351–362. [Google Scholar] [CrossRef]
  25. Feng, C.; Zhang, H.; Xiao, L.; Guo, Y.; Tian, H. Land Use Change and Its Driving Factors in the Rural–Urban Fringe of Beijing: A Production–Living–Ecological Perspective. Land 2022, 11, 14. [Google Scholar] [CrossRef]
  26. Rugema, D.M.; Birhanu, T.A.; Shibeshi, G.B. Analysing Land Policy Processes with Stages Model: Land Policy Cases of Ethiopia and Rwanda. Land Use Policy 2022, 118, 106135. [Google Scholar] [CrossRef]
  27. Sun, Q. The Basic Experience of Urbanization in Major Countries and Its Enlightenment on Urbanization in China. Shanghai Econ. Rev. 2018, 1, 116–128. [Google Scholar]
  28. Li, Y.; Kong, X.; Zhu, Z. Multiscale Analysis of the Correlation Patterns Between the Urban Population and Construction Land in China. Sustain. Cities. Soc. 2020, 61, 102326. [Google Scholar] [CrossRef]
  29. Kim, Z.F. Practice and Enlightenment of Small Town Development Policy in South Korea. Chinese Rural. Econ. 2004, 3, 74–78. [Google Scholar]
  30. Chen, W.; He, B.; Nover, D.; Lu, H.; Liu, J.; Sun, W.; Chen, W. Farm ponds in southern China: Challenges and Solutions for Conserving a Neglected Wetland Ecosystem. Sci. Total Environ. 2019, 659, 1322–1334. [Google Scholar] [CrossRef]
  31. Yuan, M.; Liu, Y. Land Use Optimization Allocation Based on Multiagent Genetic Algorithm. Trans. Chin. Soc. Agric. Eng. 2014, 30, 191–199. [Google Scholar]
  32. Tan, S. Research on Theory and Method of Land Use Structure Optimization; Nanjing Agricultural University: Nanjing, China, 1997. [Google Scholar]
  33. Zhu, F.; Zhang, F.; Li, C. Coordination and Regional Difference of Urban Land Expansion and Demographic Urbanization in China During 1993–2008. Prog. Geogr. 2014, 33, 647–656. [Google Scholar]
  34. Liu, C.; Sun, W.; Li, P. Characteristics of Spatiotemporal Variations in Coupling Coordination between Integrated Carbon Emission and Sequestration Index: A Case Study of the Yangtze River Delta, China. Ecol. Indic. 2022, 135, 108520. [Google Scholar] [CrossRef]
  35. Wang, G.; Liang, L.; Li, F.; Jiang, S.; Duan, X. An Empirical Research on the Coupling Coordinative Relationship between Regional Tourism and Informationization. J. Nat. Resour. 2016, 31, 1339–1350. [Google Scholar]
  36. Zhao, W.; Zhang, Z. Research on the Dynamic Distribution, Spatial Difference and Convergence of China’s Economic Dual Circulation Coupling Coordination Degree. J. Quant. Tech. Econ. 2022, 39, 23–42. [Google Scholar]
  37. Xie, S.; Zhang, W.; Zhao, Y.; Tong, D. Extracting Land Use Change Patterns of Rural Town Settlements with Sequence Alignment Method. Land 2022, 11, 13. [Google Scholar] [CrossRef]
  38. Zhang, Y.; Huang, C.; Zhang, J. Spatio-temporal Analysis of the Intra-urban Human Mobility Based on Multi-source Data: A Case Study of Nanjing Metropolitan Area. Mod. Urban Res. 2018, 10, 11–20. [Google Scholar]
  39. Liu, Y.; Fang, F.; Wang, Y. Characteristics and Formation Mechanism of Intra-Urban Employment Flows Based on Mobile Phone Data—Taking Wuhan City as an Example. Geomat. Inf. Sci. Wuhan Univ. 2018, 43, 2212–2224. [Google Scholar]
  40. Sheikh, V.; Salmani, H.; Mahiny, A.S.; Ownegh, M.; Fathabadi, A. Land Use Optimization through Bridging Multiobjective Optimization and Multicriteria Decision-making Models (Case Study: Tilabad Watershed, Golestan Province, Iran). Nat. Resour. Model. 2021, 34, e12301. [Google Scholar] [CrossRef]
Figure 1. The study area.
Land 11 01193 g001
Figure 2. Research design and methods.
Land 11 01193 g002
Figure 3. Spatial analysis of PL flow in NJNA.
Land 11 01193 g003aLand 11 01193 g003b
Figure 4. Guidance for the spatial optimization of planning for NJNA.
Land 11 01193 g004
Table 1. Classification of PLI coupling coordination.
TypeCoupling TypeIntervalCoupling Status
Coupling degree CLow coupling0–0.3There is a weak correlation and low interaction between factors.
Running-in conflict0.3–0.5Factors are intertwined, conflicting, and synergistic.
Moderate coupling0.5–0.8Factors constantly adapt to and influence each other.
High coupling0.8–1.0Factors closely exist and interact with each other.
Coupling coordination degree HDisorderly0–0.1The allocation of PLI factors is extremely unbalanced and disorderly.
0.1–0.2The allocation of PLI factors is severely unbalanced and disorderly.
0.2–0.3The allocation of PLI factors is relatively severely unbalanced and disorderly.
Running-in0.3–0.4The allocation of PLI factors is relatively unbalanced and disorderly.
0.4–0.5The allocation of PLI factors is in an unbalanced and disorderly state.
0.5–0.6The allocation of PLI factors is basically balanced and orderly.
0.6–0.7The allocation of PLI factors is initially systematic, balanced, and orderly.
Coordinated0.7–0.8The allocation of PLI factors is generally systematic, balanced, and orderly.
0.8–0.9The allocation of PLI factors is relatively systematic, balanced, and orderly.
0.9–1.0The allocation of PLI factors is systematic, balanced, and orderly.
Table 2. Correlation factor analysis model.
Variable TypeIndicatorExplanation
Dependent variableScale of urban construction landThe scale of construction land required by the regional migrant population.
Control variableEconomic developmentRegional GDP is selected as a measure of economic development. The data were derived from the statistical yearbooks of Nanjing, Luhe District, and Pukou District.
Industrial structureLand-use changes in cities with different industrial structures display different characteristics and, in particular, exhibit rapid expansion in cities with a high industrial share. The proportion of the secondary industry (the share of the output value of the secondary industry in GDP), C, is used as a control variable to measure the industrial structure.
Household registration systemReferencing the differentiated household settlement policy, F is defined as a dummy variable representing the inclusiveness of an urban household registration system, with 1 = strictly controlled (cities with a population of more than 5 million), 2 = reasonably regulated (3–5 million), 3 = reasonably lifted (1–3 million), 4 = appropriately lifted (0.5–1 million), and 5 = completely lifted (less than 0.5 million).
Migrant population sizeThe size of the migrant population is obtained by calculating the coefficient of the population served on the basis of the regional resident population. Using big data on mobile phone signalling, the data of the population actually served in NJNA from September to December of 2017 and from October to December of 2019 were collected.
Table 3. Coupling coordination degree of PLI in NJNA.
ClassificationIndicatorValue
Rapid urbanization areaPopulation urbanization rate (Ui)0.6088
Land urbanization rate (Li)0.1050
Nonagricultural industry development rate (Di)0.9518
Comprehensive evaluation index (T1)0.4759
Coupling coordination degree (H1)0.5807
Agricultural development spatial agglomeration areaRural population emigration rate (Ni)−0.1037
Reduction rate of rural construction land (Ji)−0.0527
Primary industry development rate (Fi)0.1113
Rural income growth rate (Si)0.2959
Coupling coordination degree (T2)0.1284
Coupling coordination degree (H2)0.3248
Degree of comprehensive coordinationPopulation urbanization rate (Ui)0.5071
Land urbanization rate (Li)0.0090
Nonagricultural industry development rate (Di)0.7321
Comprehensive evaluation index (T)0.3908
Coupling coordination degree (H)0.5019
Table 4. Full-sample estimation results for the impact of the migrant population on construction land.
VariableConstruction LandIndustrial LandPublic Management and Service Land
FEREFEREFERE
Migrant population0.3870.321 **0.143 ***0.178 ***0.182 ***0.530 ***
GDP0.979 ***1.33 ***0.221 **0.393 ***0.767 ***0.998 ***
Proportion of secondary industry−0.336 ***−0.368 ***−0.0726 *−0.0669 *−0.203 ***−0.233 ***
Household registration system−18.60 ***−21.12 ***−2.741 ***−2.429 ***−6.985 ***−7.025 ***
Constant188.8 ***145.7 ***37.73 ***19.96 ***73.71 ***51.93 ***
R20.30110.73510.32060.60480.55490.7752
F test/chi-square test5.3392.174.5062.554.35143.35
Hausman testProb > chi2 = 0.0000Prob > chi2 = 0.0195Prob > chi2 = 0.1642
***, **, and * indicate significance at the 1%, 5%, and 10% levels, respectively; FE and RE denote fixed effects and random effects, respectively.
Publisher’s Note: MDPI stays neutral with regard to jurisdictional claims in published maps and institutional affiliations.

