1. Introduction
Soil salinization, and physical and biological degradation are among the most prominent global environmental challenges because they have a negative impact on agricultural output and fair development. The agriculture of Nile Delta has many problems related to productivity [
1], yet it remains the main economic activity and source of field crops for the population [
2,
3]. The assessment of soil fertility and degradation is therefore fundamental in order to help find the optimal conditions for plant growth [
4]. Both organic and mineral components of soil create an interactive natural environment that fosters plant growth [
5]. Its physical, chemical, and biological characteristics enable it to supply nutrients in adequate proportion and balance for plant growth [
6,
7,
8]. This serves as the foundation for all input-based high-production systems. [
9]. The demand for land for agricultural production has also increased due to Egypt’s rising population. However, detailed information on the level of soil fertility/degradation in Egypt is still quite limited [
10,
11,
12,
13]. For the purpose of guiding agricultural management decisions, Egyptian farmers need the most recent information on soil quality [
14]. The main economic activity is agriculture as a source of field crops for the population. Soil fertility and degradation are among the most important productivity problems facing agriculture in the Nile Delta. Therefore, it is still necessary to evaluate the state of the land and the dynamics of its changing properties to suggest optimum conditions for plant growth as one of the most important inputs to increase productivity [
11,
12,
13].
Currently, technological advancements in the geospatial field have introduced greater ease for choice makers by presenting a list of alternatives for problem structuring [
15,
16] of actual global issues of a multidimensional nature, and evaluating alternatives by outlining the link between input and output maps [
17]. The ever-growing availability of earth observation data and the well-established use of GIS leads to the development of automated workflows and toolboxes for environmental management [
18,
19,
20]. They enable time savings, objective and non-biased judgments, and a systematic and spatially clear evaluation framework. [
18,
19]. With the fast development of GIS and computer technology, this approach has been widely employed in research programs. Currently, the most significant uses of GIS are in assessment, providing ecological capability maps, land management, and land planning [
20]. This integrated strategy allows for the incorporation of expert judgments into geographical data. This integrated strategy has been employed in a number of research projects to deal with situations in which multi-criteria judgments were evaluated using geographical data [
21]. Mapping soil deterioration is a time-consuming and labor-intensive process. Modeling degradation processes allows for the prediction of deterioration [
22,
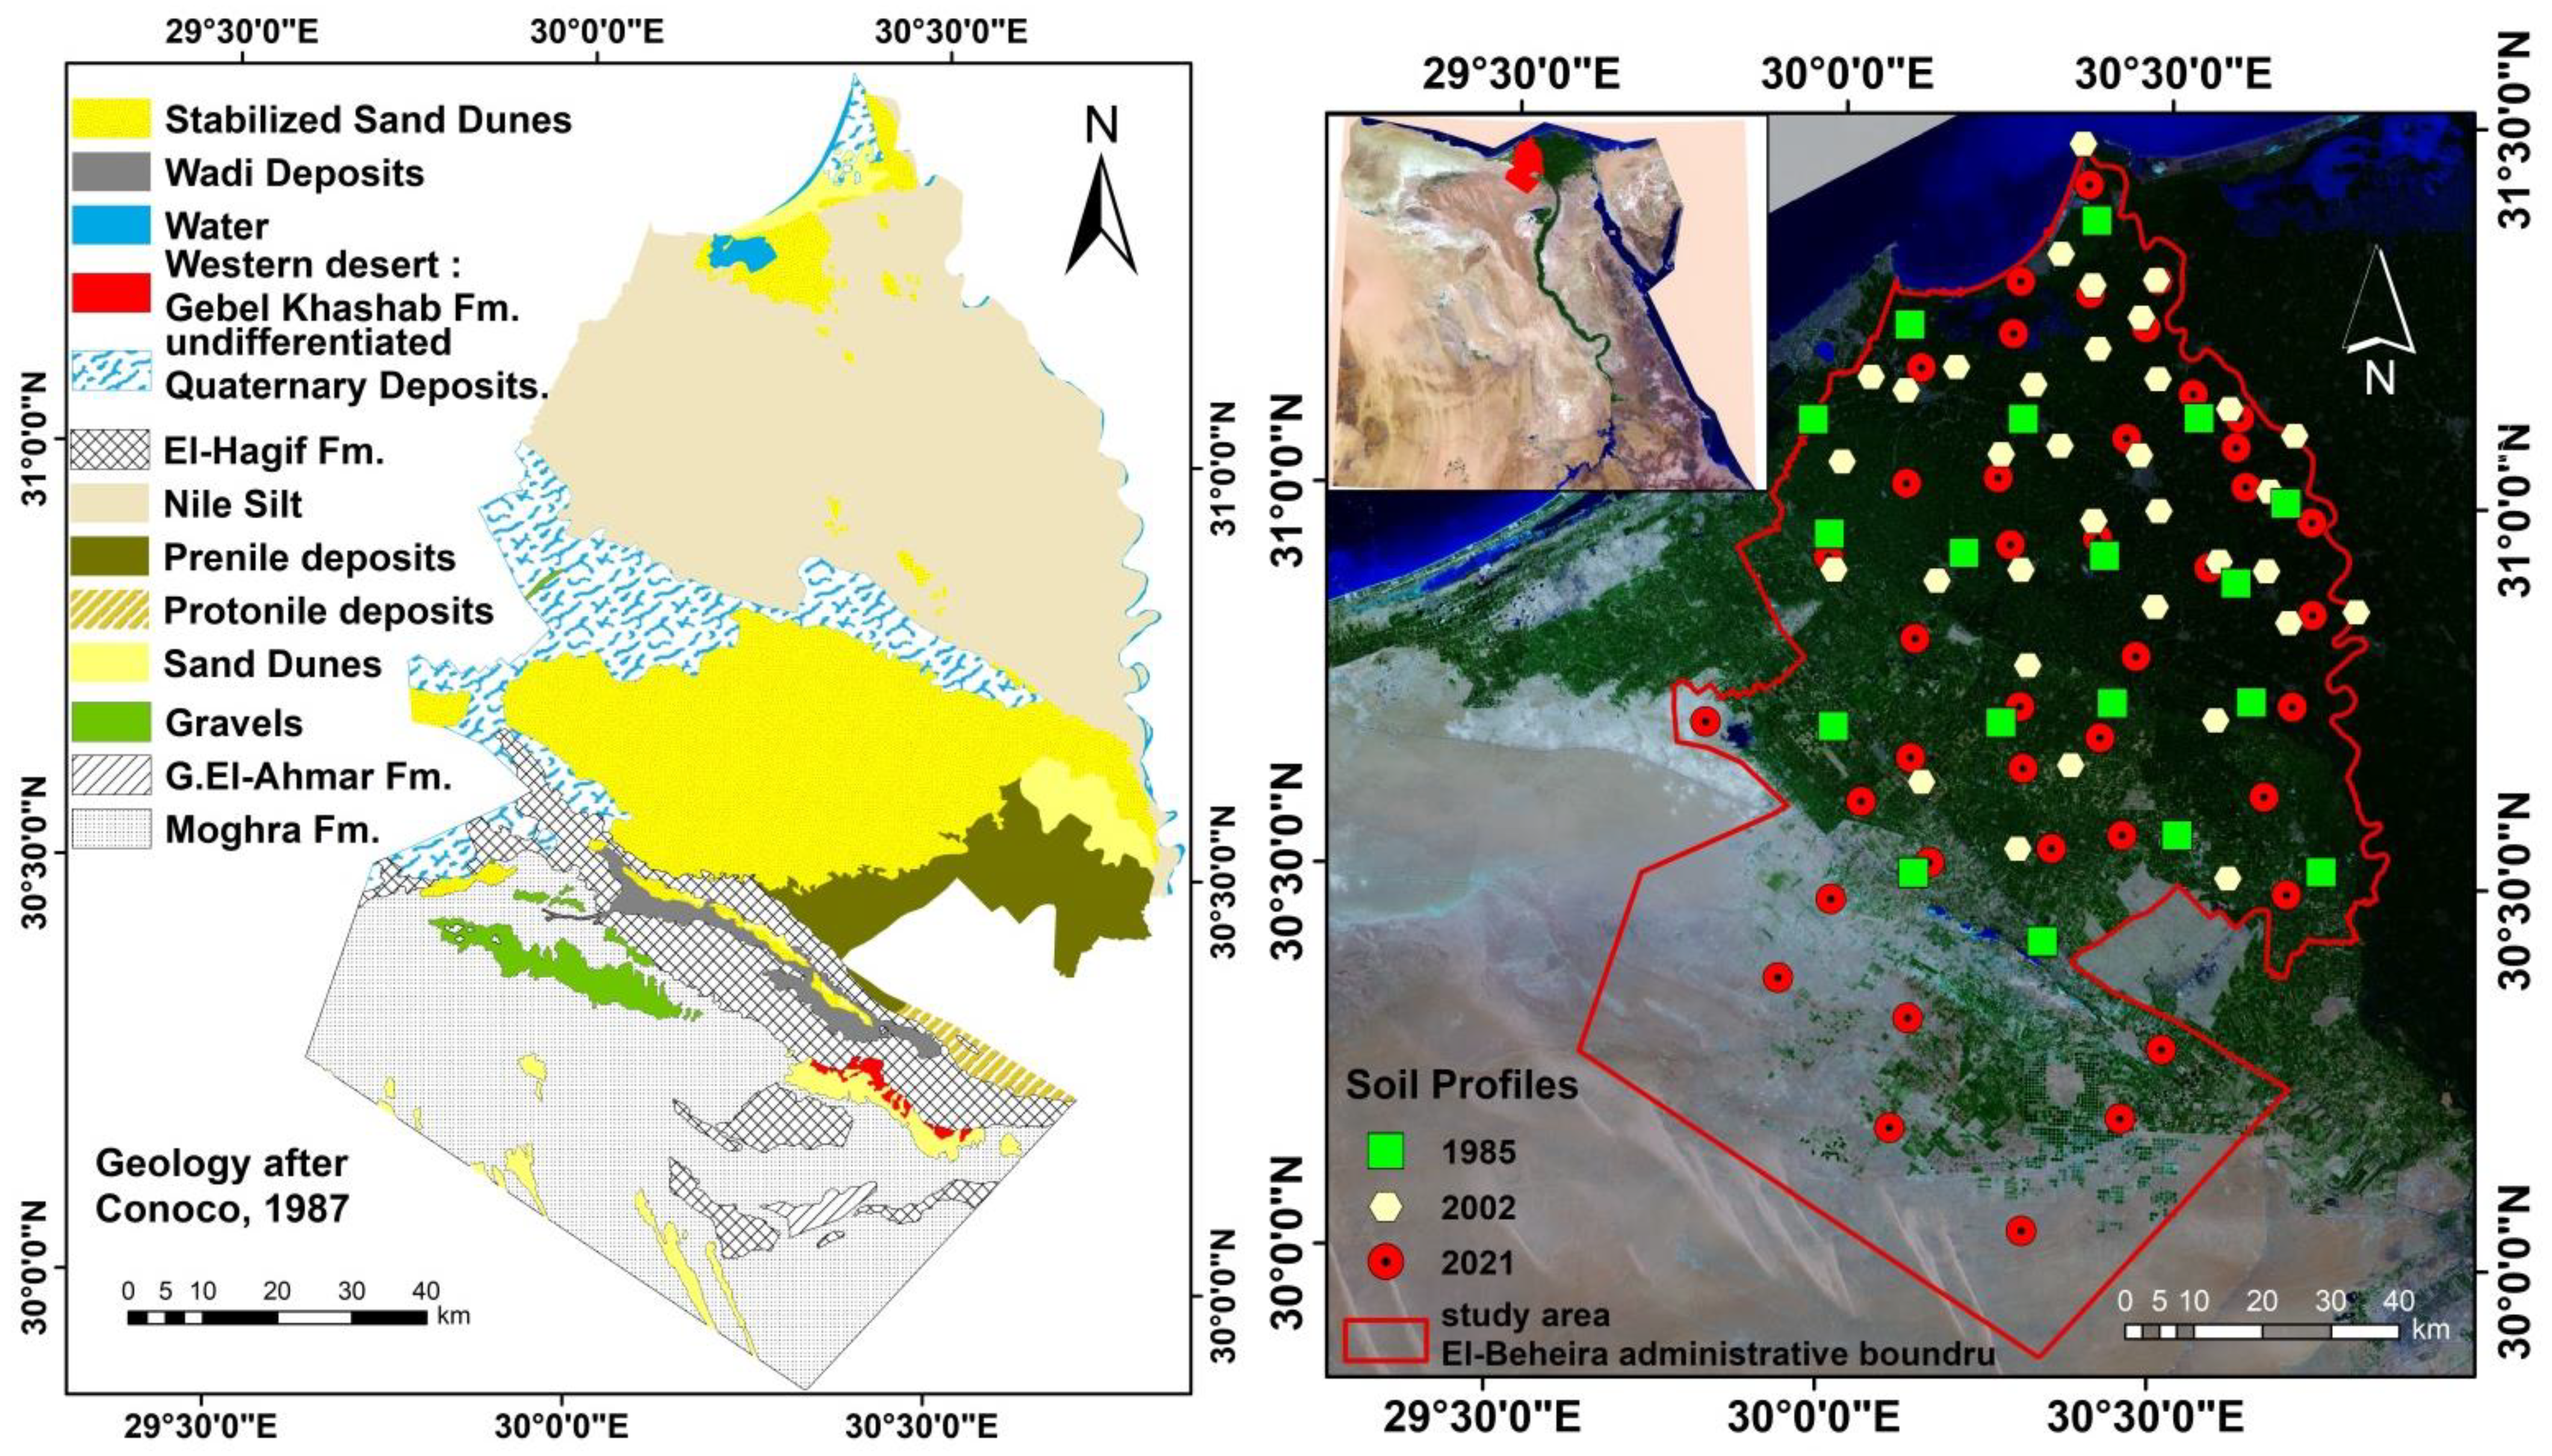
23]. El-Beheira Governorate is one of the area’s most vulnerable to land degradation [
24].
Soil is the deposit factor for fertility, which is the fruit of the interaction between climate and vegetation, and since the soil cannot be restored to become rich in nutrients through time, knowing the causes of the actual degradation can accelerate the appropriate agricultural management related to improving soil fertility through good management of soil quality determinants. Thus, the identification of areas with low values of soil fertility indicates the long-term progression of degradation. Based on the foregoing, this study intends to assess fertility and degradation for sustainable land management.
3. Results
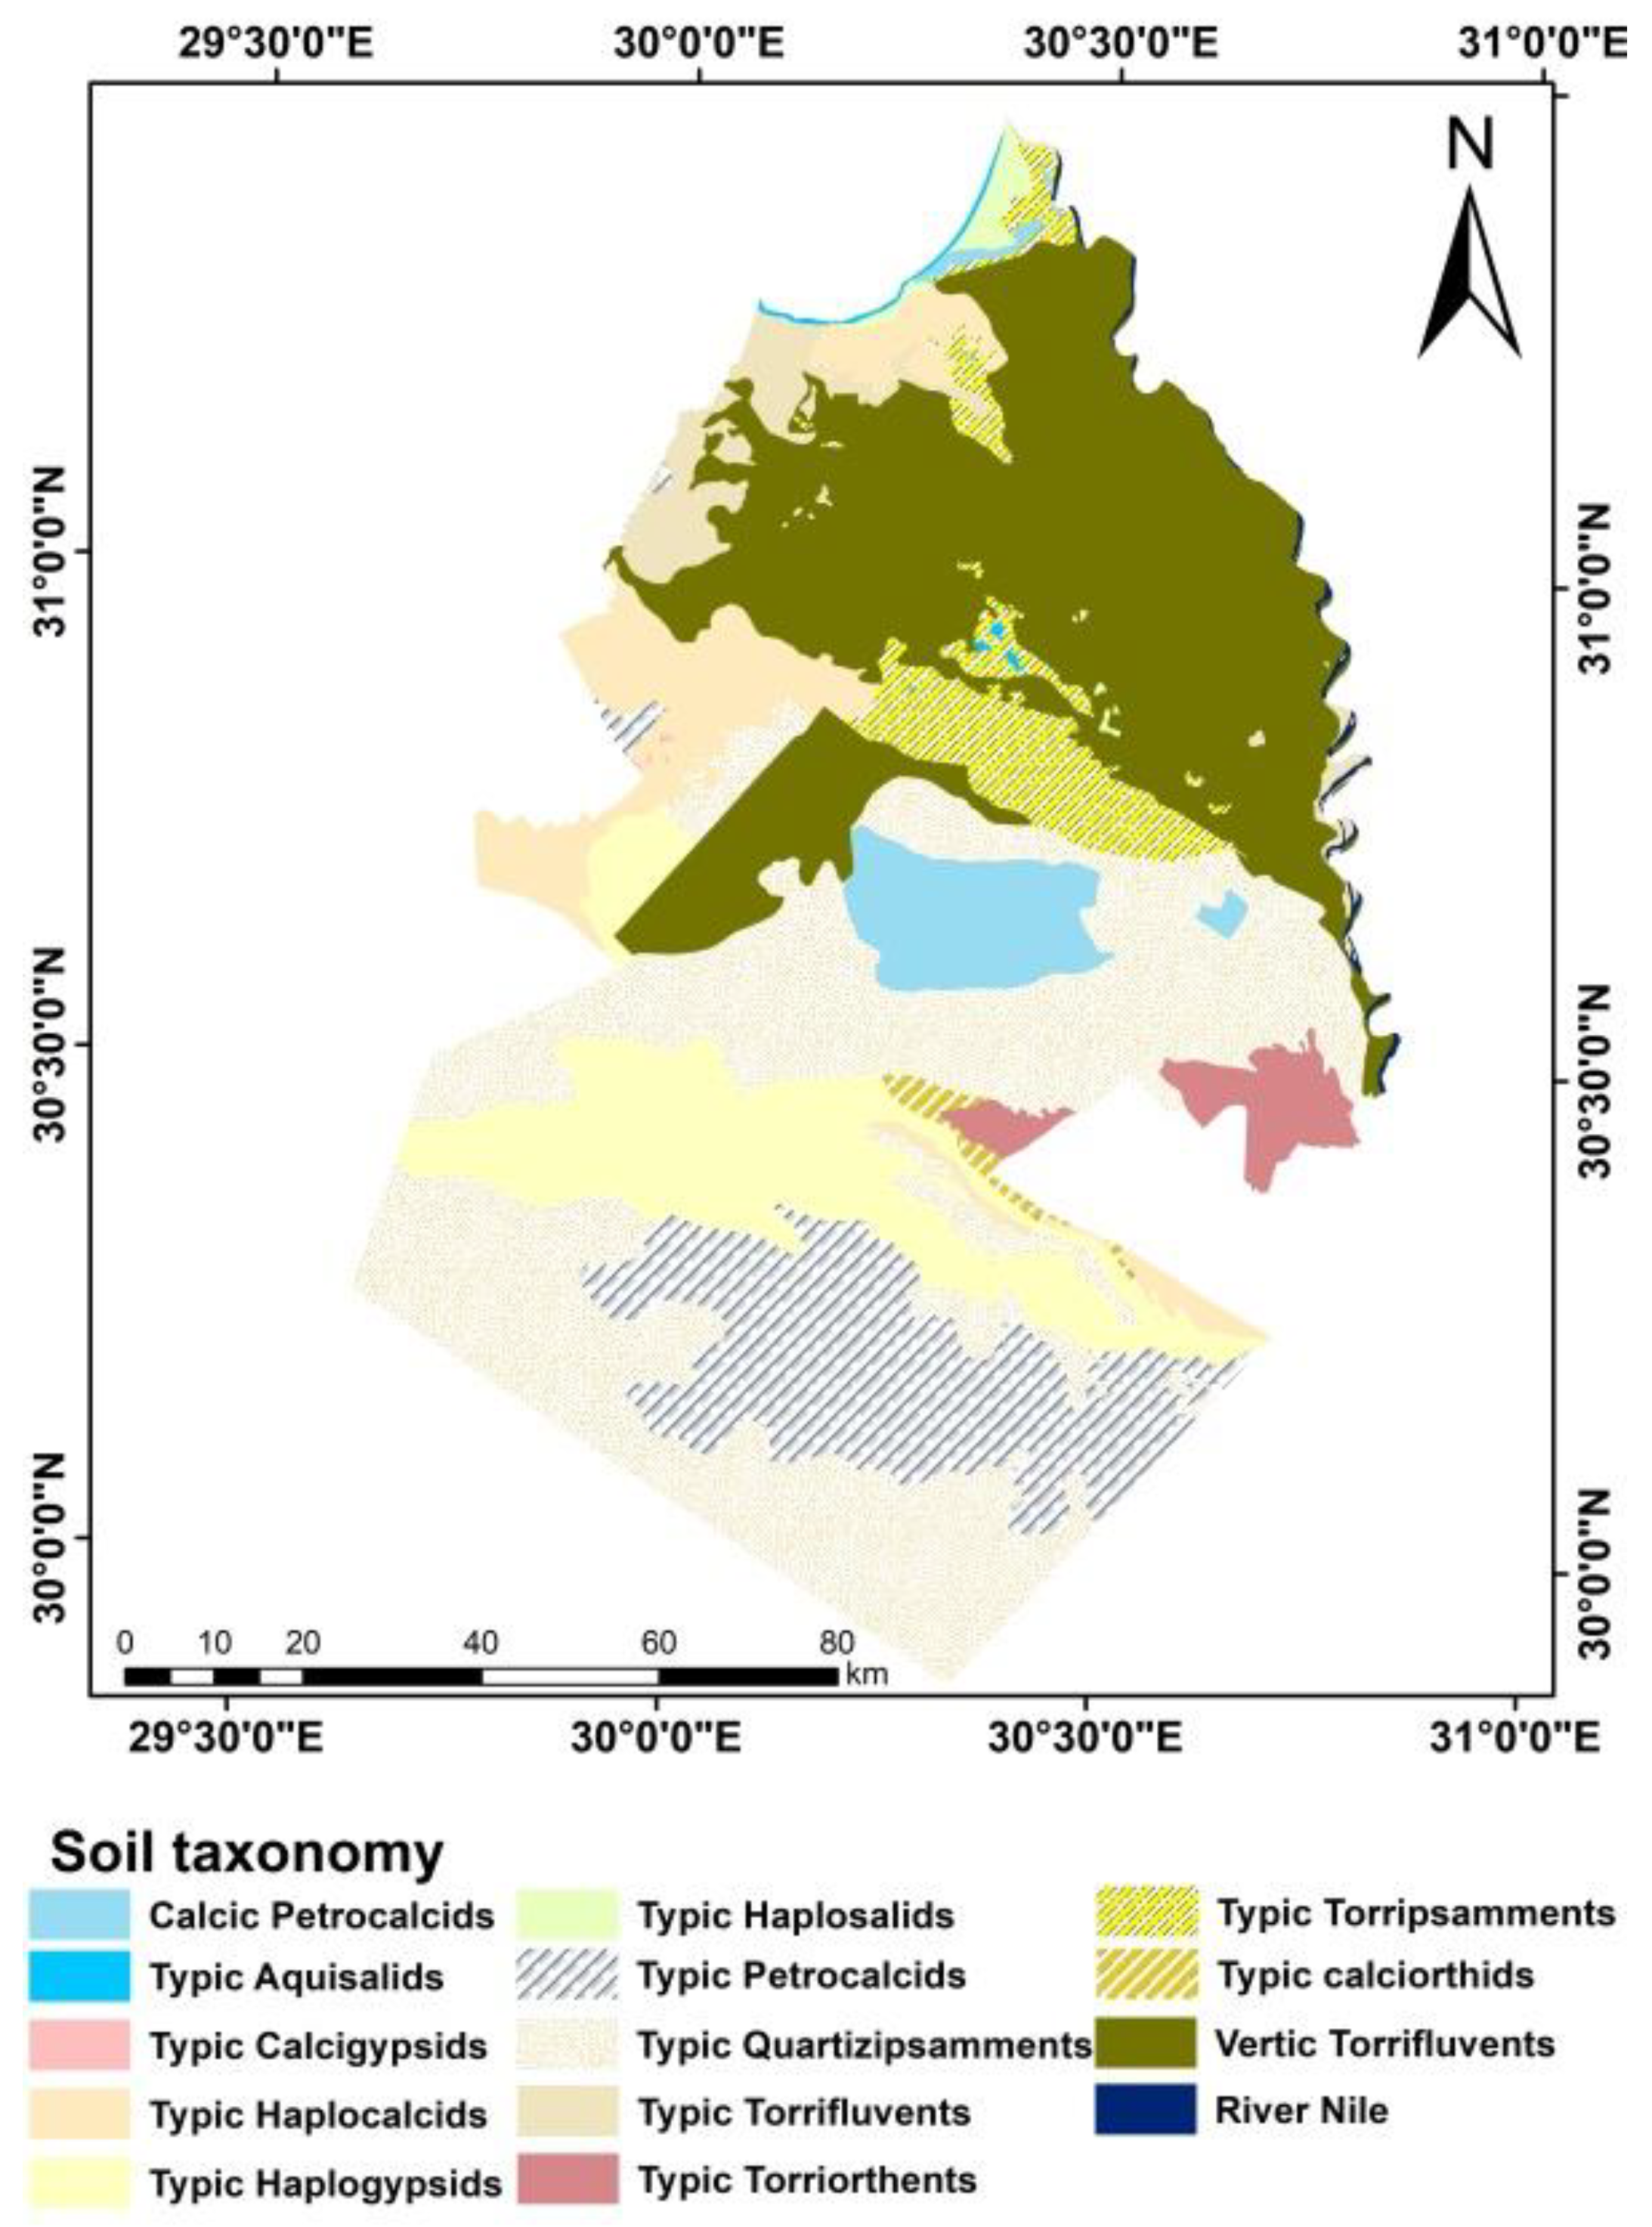
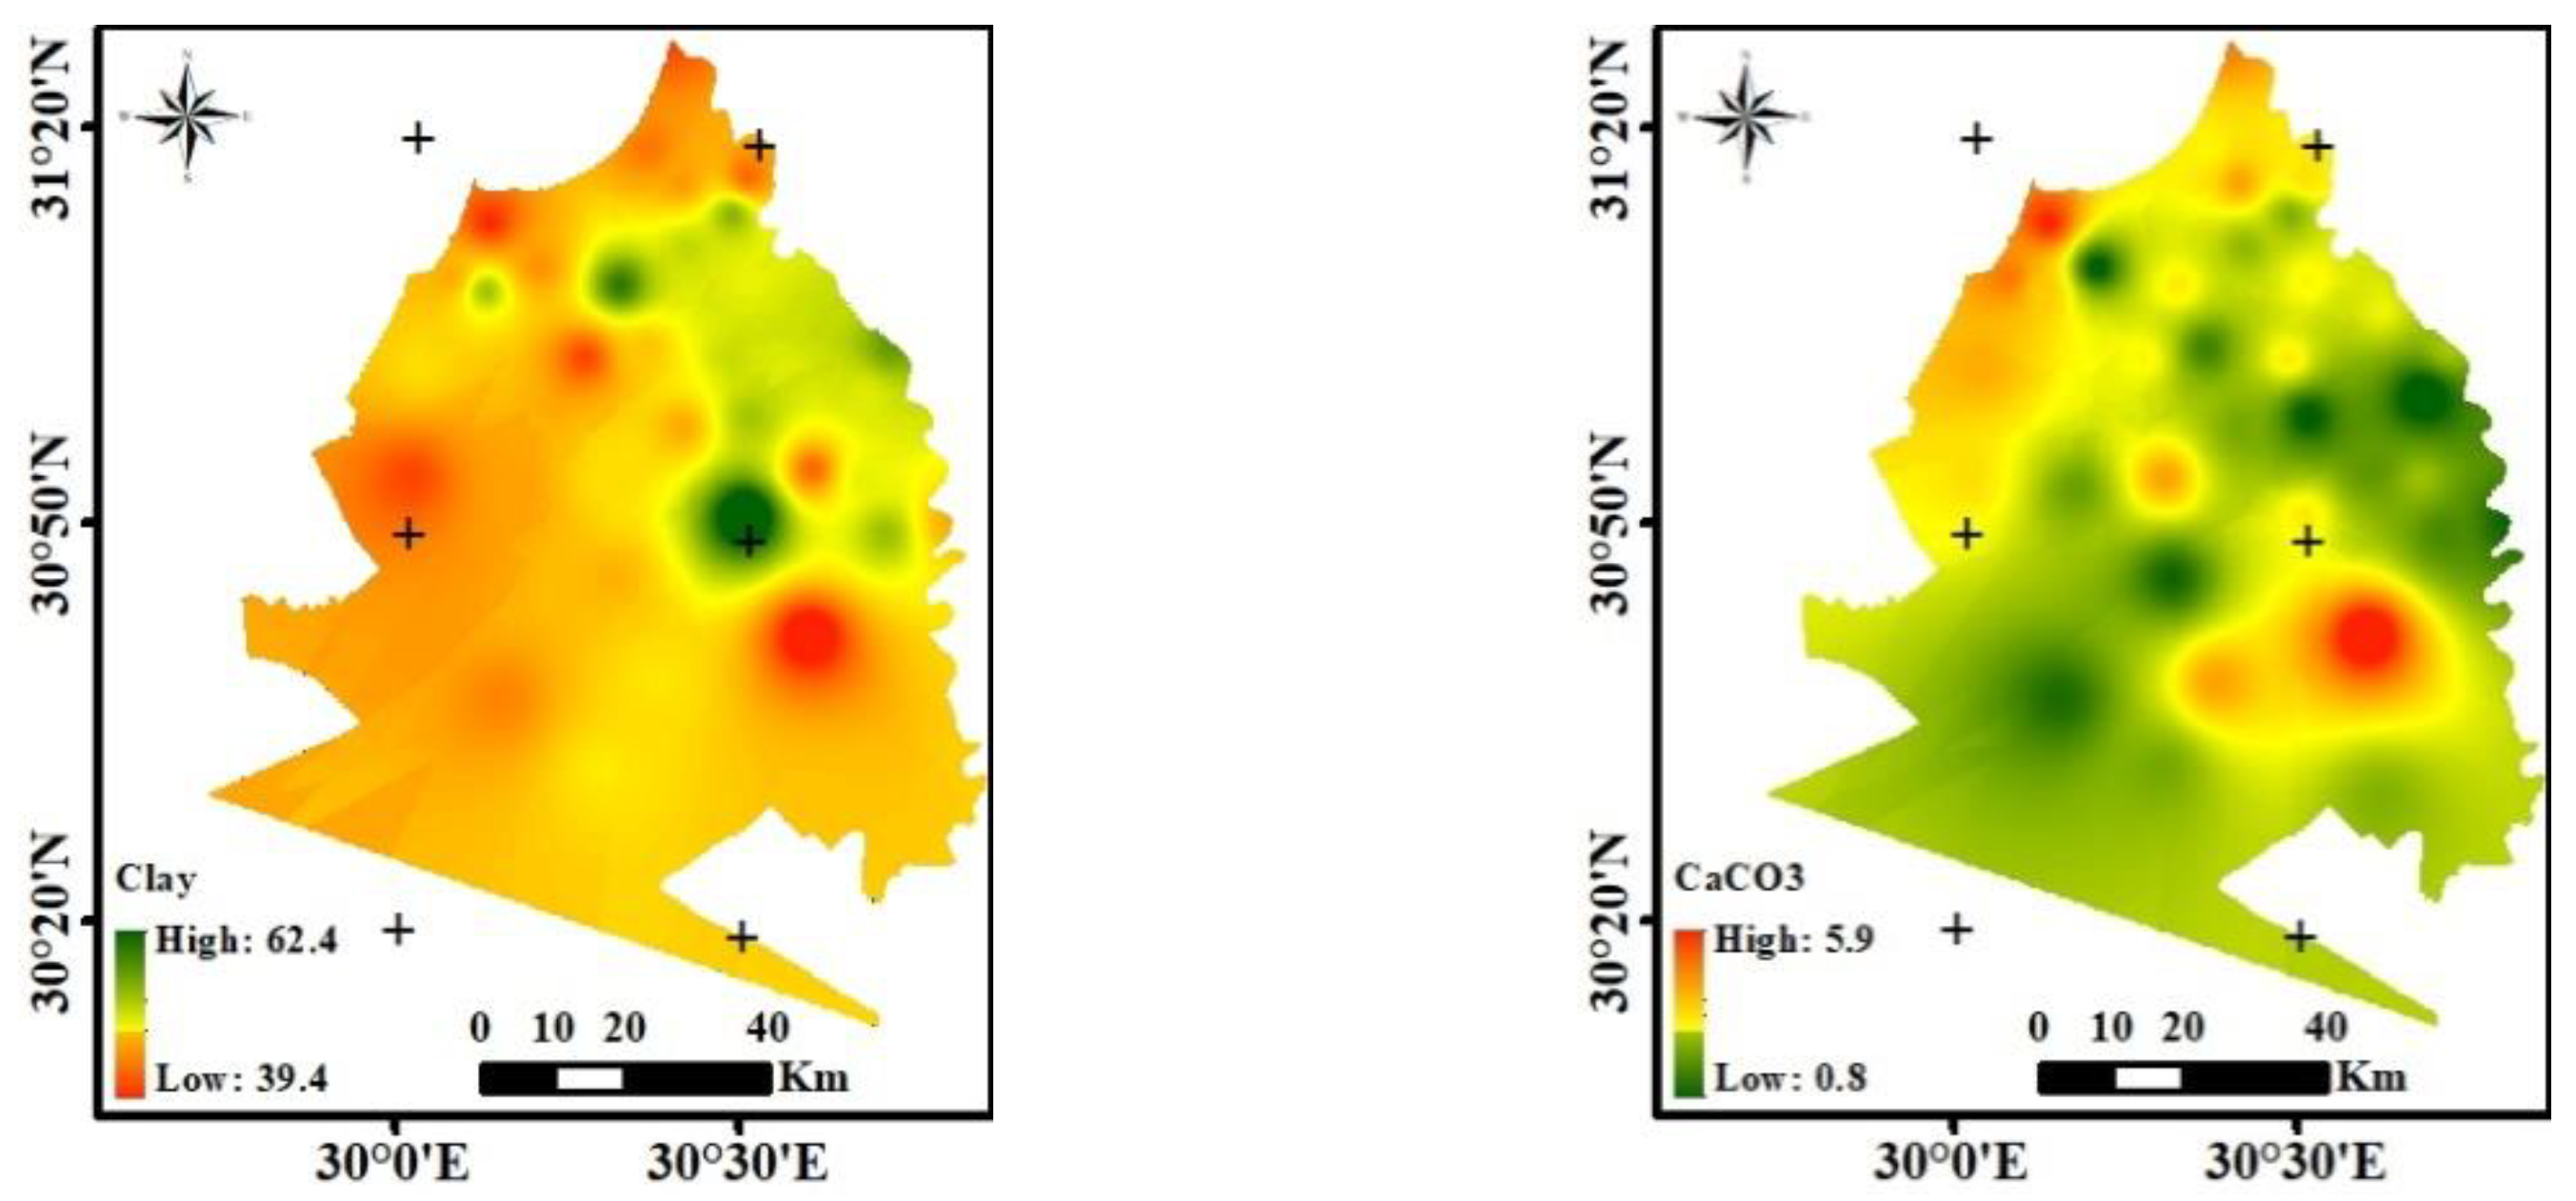
Soil taxonomy contains 11 units, as shown in
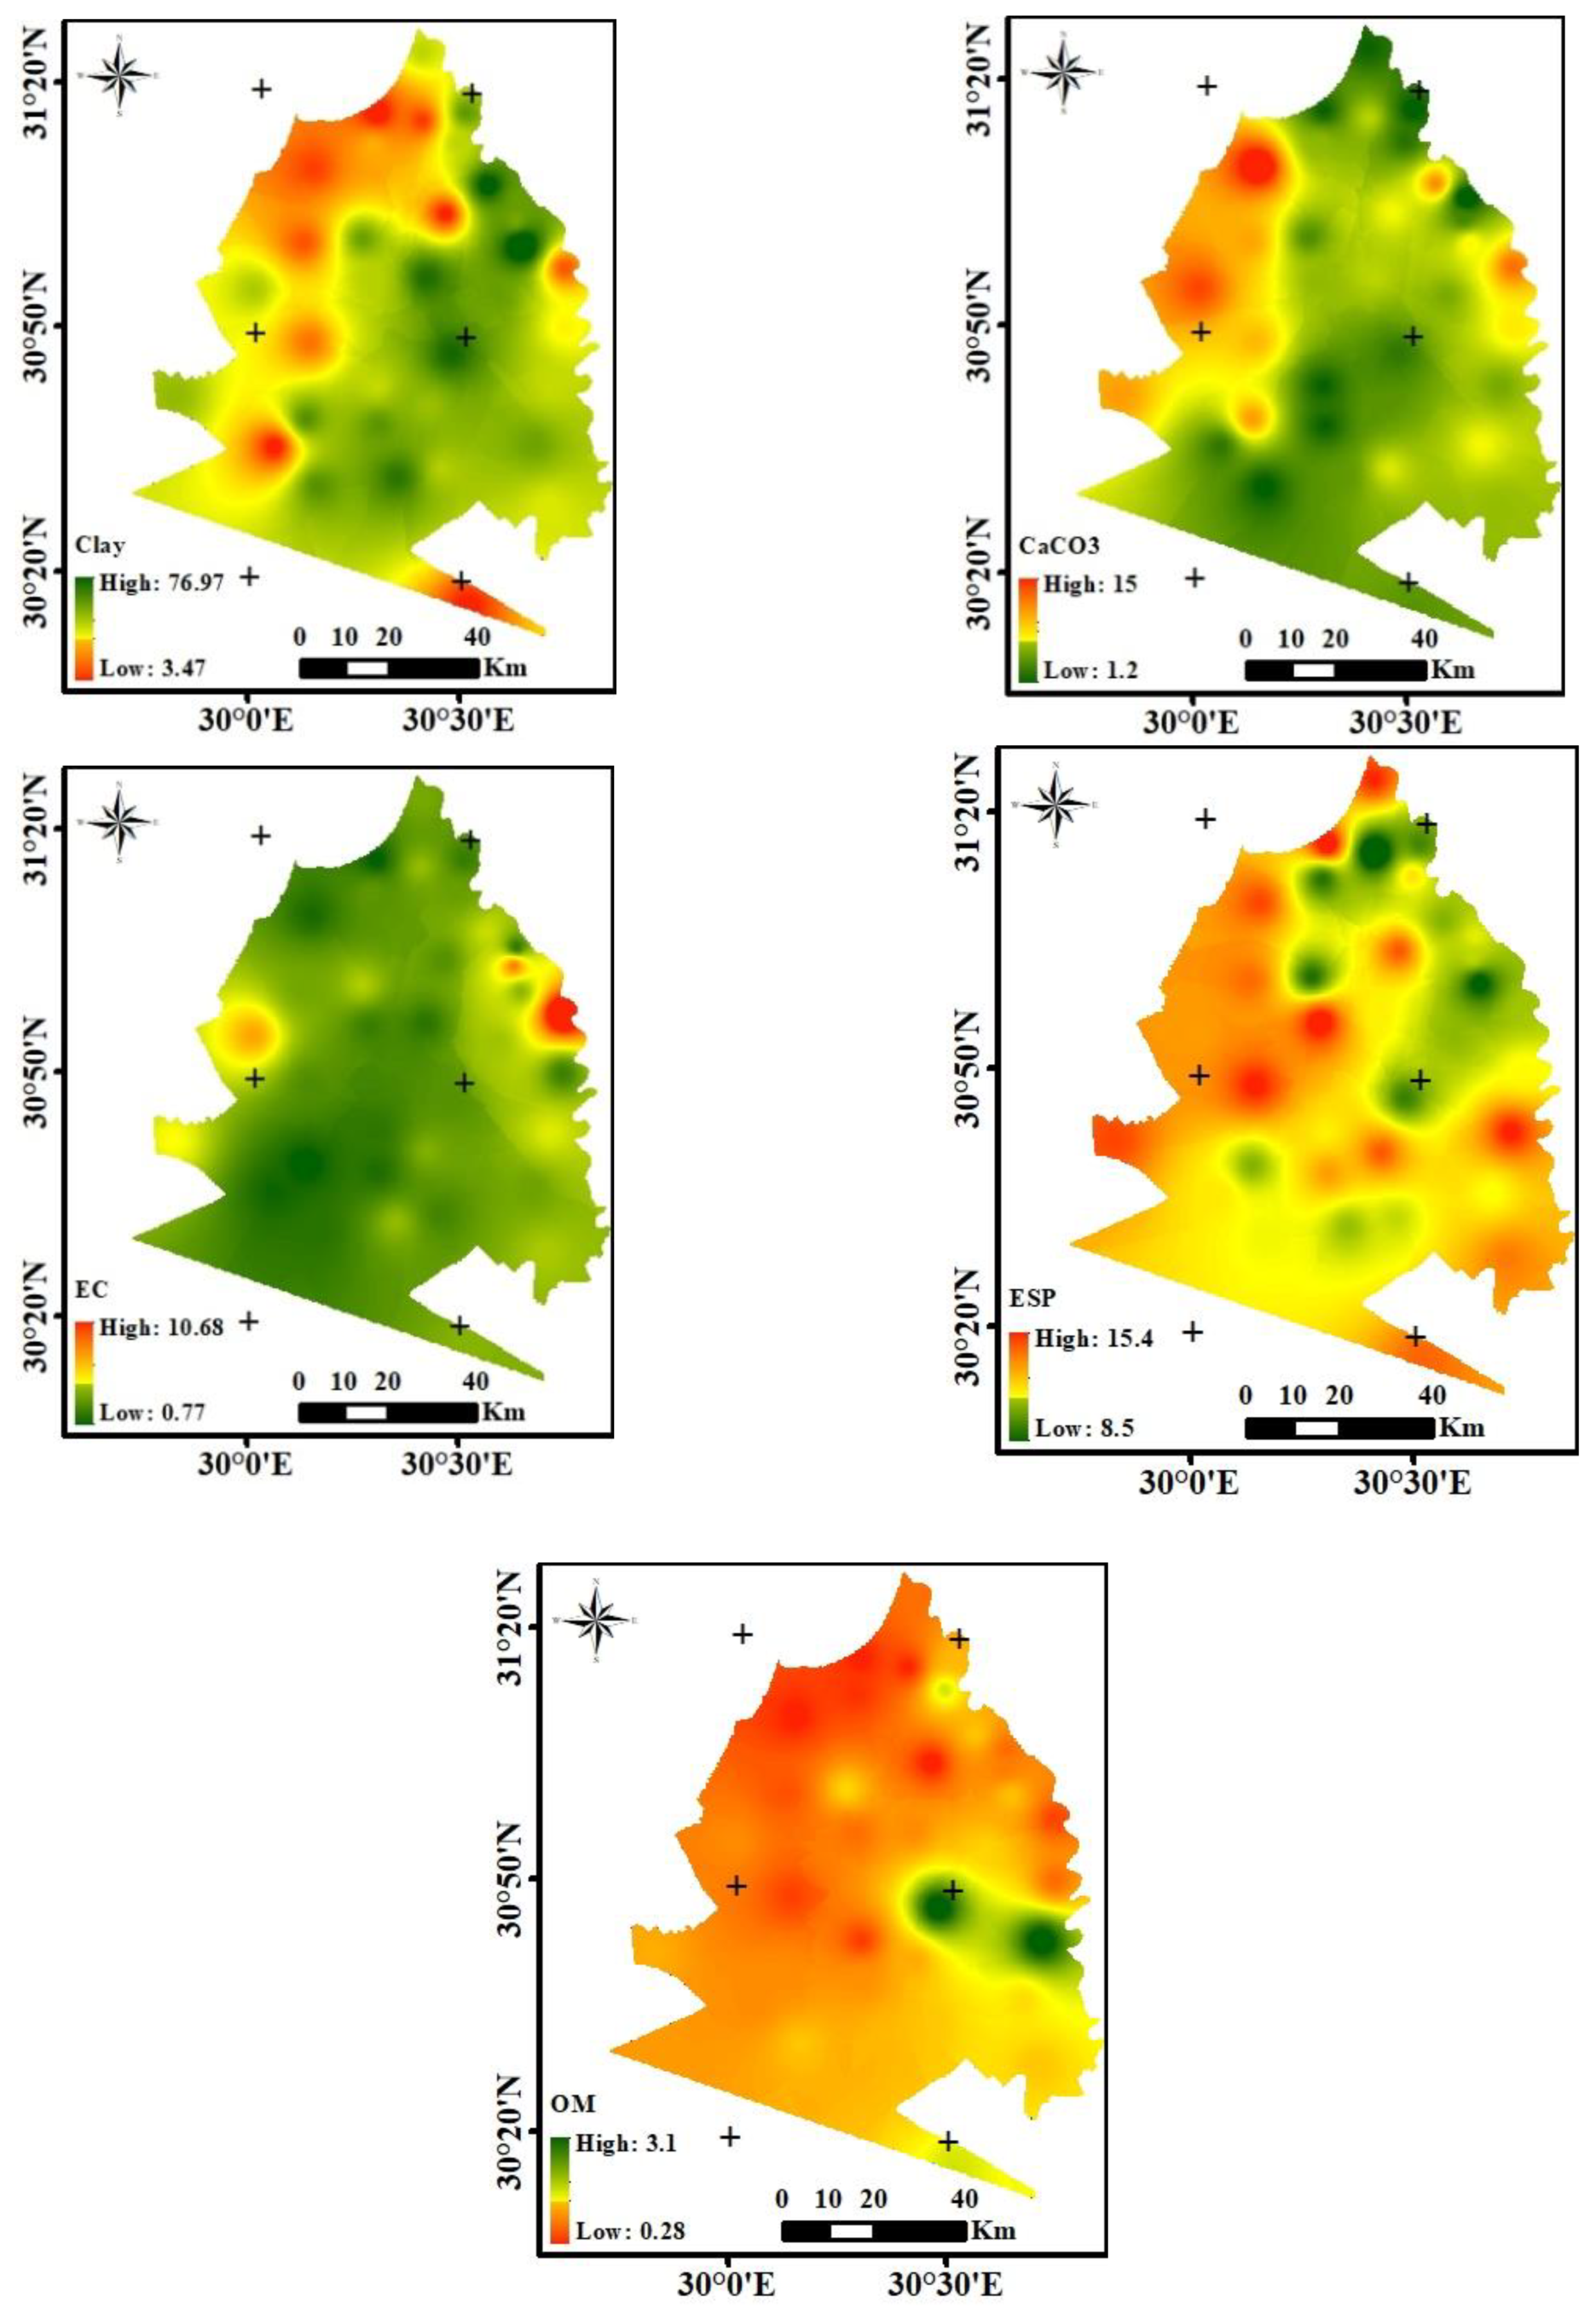
Figure 4. The alluvial soil texture is fine textured (clay loam to clay) and the water table is between 90 and 160 cm. The depth varies from the south of the alluvial soil, which is characterized by the depth of the soil profile being the deepest, and the depth decreases in the north of the alluvial soil, especially in the areas adjacent to Lake Edko, less than (70 cm) with low to moderate depth level. Overall, the majority of the alluvial areas have a high clay texture (44 to 65%). Concerning the coastal lands, with clay content (13 to 42%) with texture sandy to clay-loam. Soils are affected by salinity (EC > 4.0 dS m
−1) while the pH varies from being near neutral (pH = 7) to an alkaline value of 8.83.
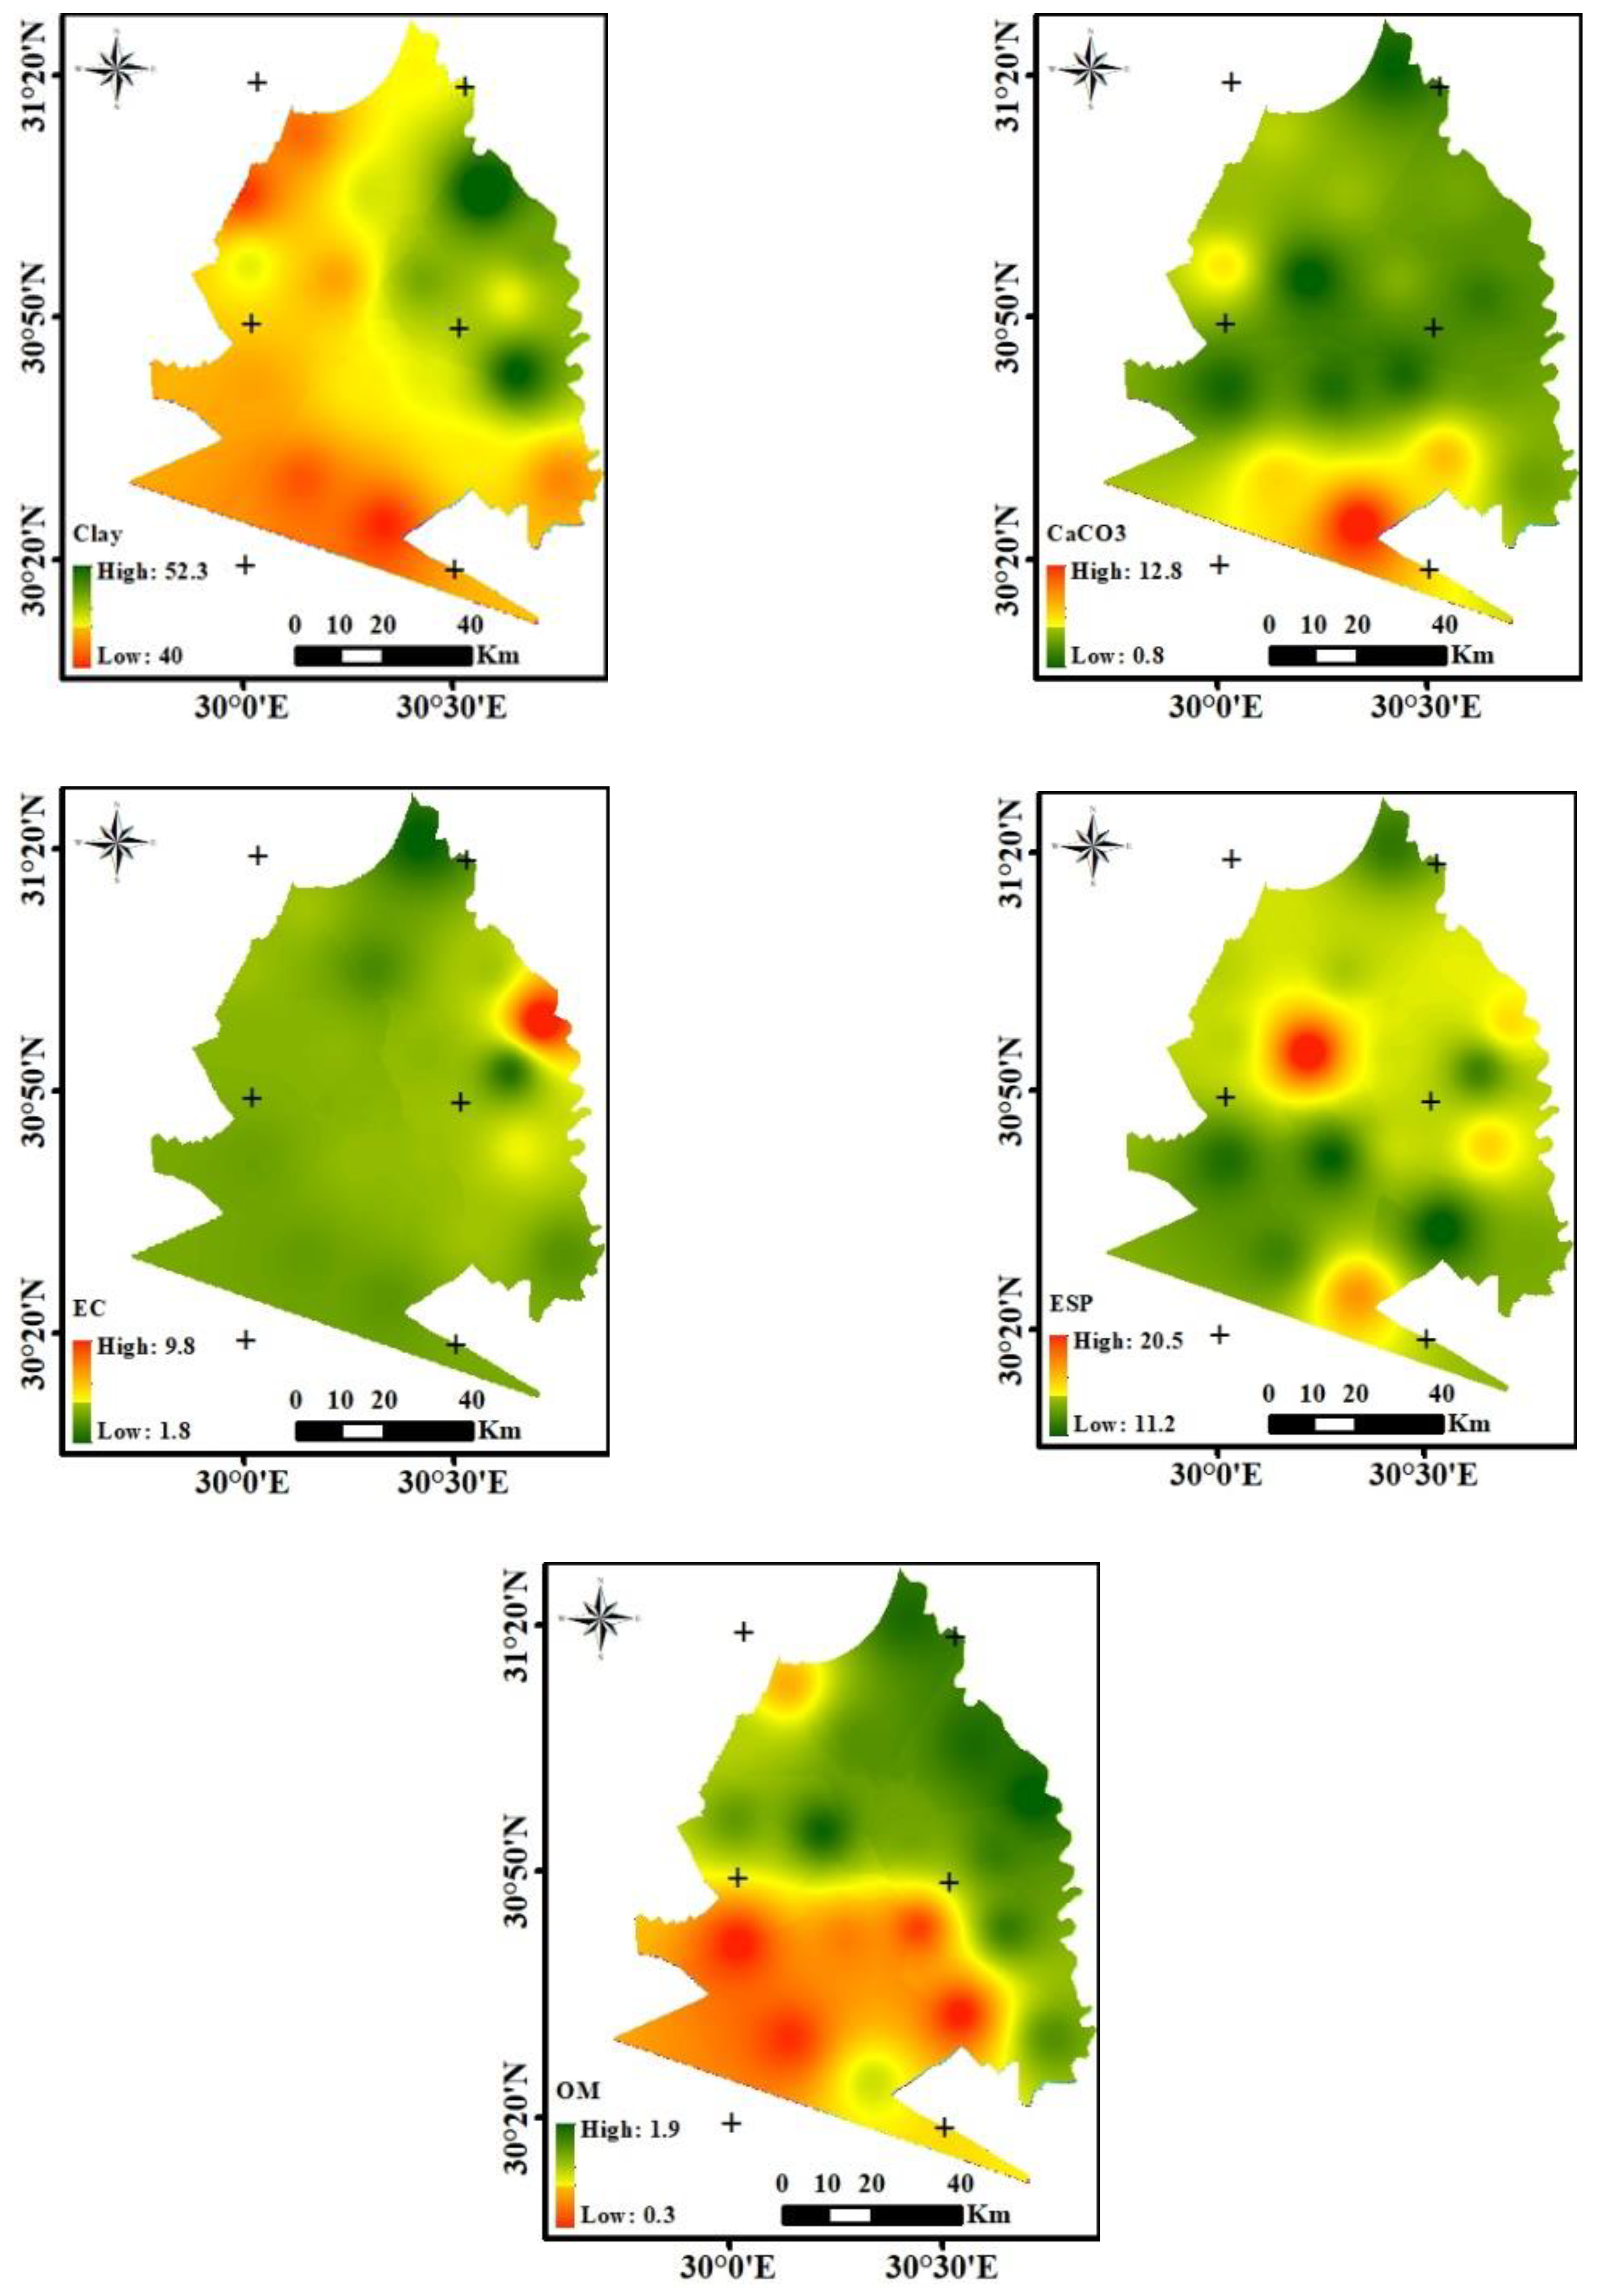
3.1. Variation of Soils Physical Properties
The results show significant variability across different soils (
Table 2,
Table 3 and
Table 4). The beating index (BI) shows that, with the exception of which has very flappy soils (BI > 1.8%), all old alluvial plain soils are non-beating (i.e., BI < 1.4), therefore, have a beating crust on their surface, thus increasing the cohesion of the soil and therefore its resistance to detachment. In theory, the beating crust should reduce the rate of erosion. However, even if it increases the soil’s resistance to detachment, it greatly decreases the rate of water infiltration and increases the rate of runoff.
The beating crust of its soils may exhibit mechanical resistance to root growth and stem expansion. It thus creates anaerobic conditions for the roots [
41]. This beating crust is due to the significant presence of the clay fraction in the soil. Soils with the shoreline showed a high risk of structural degradation (5% < SSI < 7%) due to the lower organic matter content in these soils and a high clay content [
42]. The rest of the soil groups show soils with a stable structure. Soils with a high risk of structural degradability have a high fertility probability of erodibility [
43]. They reduce the rate of water infiltration, which determines the availability of water for plants, unlike soils with a stable structure that facilitates water infiltration. Soils rich in organic matter have physical phases favorable to plant development [
42,
43] because organic matter plays a physical role in the soil cohesion, structure, porosity, water retention or storage. All the soils in the study area have a neutral pH range than 6.8 to 8.4. The pH is a key element of the chemical composition of the soil and determines the availability of nutrients for plants and soil microorganisms [
44].
3.2. Variation of Chemical Properties in Soil Groups
Chemically, except for south part soils which show the fertility index (FI) below 1.5 due to the low exchangeable base rates in their soils, the rest of the soil groups have an average IF above 1.5; this suggests that these soils have a good reserve of exchangeable bases and therefore good chemical fertility [
45]. The CEC is a relative indicator of the fertility power of soil [
46]. According to Chapman [
47], CEC depends on the organic matter and clay content of the soil. Soils with a high CEC can retain more cations and has a high capacity to exchange them. This soil has a high CEC (39.47 ± 3.68 meq/100 g), this would be due to its very high clay content (77 ± 3.48%) and high organic matter rate (3.1 ± 0.49%). The presence of organic matter in soil significantly increases CEC in soil (e.g., 1% of OM contributes 2 meq/100 g of CEC matter to soils) [
48]. Given the low presence of organic matter in the rest of the soil groups, the CEC remains average, and therefore they do not have a good ability to retain and exchange cations. This reflects a very high rate of exchangeable cations in these soils. For the rest of the soil groups, exchangeable cations are medium to high. The high level of exchangeable cations is linked to the heavy clay complex, which is rich in organic matter and therefore humus [
49].
Biochemically, soils in the study area have medium to high levels of organic matter (OM) in soils. This justifies the richness of these soils’ nutrients [
50,
51]. As clay and organic matter are the basis of the areas with heavy clay, their deficiency would largely contribute to the degradation of the fertility of these soils [
51,
52]. Nitrogen levels range from low to medium in all soils. The C/N mineralization rate is greater than 20 for all soils. This reflects a very low rate of mineralization caused by the low total nitrogen content. Mineralization is slow in this soil group and allows only a small amount of mineral nitrogen to the soil [
53,
54]. The P content is medium in young and old alluvial plains and low in all other soils. This reflects a rate not high enough to ensure proper nutrition of the plant [
46]. Phosphorus deficiency in these soils is influenced by the high fixing power of soils due to the presence of iron oxides and hydroxides [
55,
56].
There is a correlation between the fertility indicators and the physicochemical parameters of the studied soil samples. The partial components (OM, C/N, pH, N, Mg, CEC, Ca, K) show the affinity between chemical characteristics of the soil ranges between 26 and 42%. These variables are positively correlated with the soil fertility components. The variables (exchangeable cations, Ca2+, Mg2+, K+, P, total N, pH, CEC) are closely correlated, with a positive coordinate, while the variables C/N ratio and OM are very closely correlated.
Agronomically, the physical-chemical properties that control the fertility of alluvial soils are C/N, pH, Ca, CEC, MO, Mg, and P. Almost similar results for soil fertility indicators have been obtained by [
54,
55,
56,
57]. Organic restitutions through long-term fallows restore fertility soils depleted by several years of successive cropping [
56,
57,
58].
According to the FAO textural diagram, the area soils are grouped into two categories:
Soils with a clay texture; poorly permeable and poorly aerated, preventing the smooth penetration of roots and soil micro-organisms. However, high clay contents in soils condition the fixation of the mineral elements of the adsorption complex [
59,
60,
61,
62,
63].
Balanced textured soils; very suitable for development because they are very permeable and easy to work [
64,
64] and are therefore ideal for growing maize and rice [
65]. Soils with balanced textures are excellent and suitable for most crops [
57,
66,
67,
68].
The calculation of the equilibrium of the cationic balance (Ca/Mg/K) shows that these soils are close to the optimal equilibrium. This testifies to a balance in absorption and good assimilation by the roots of plants [
69,
70] while the remaining soils show deficits in potassium and magnesium. This means that the texture complex is essentially dominated by calcium. This richness of the texture in calcium may explain the low pH of these soil groups [
59].
This binary fertility diagram or N-pH diagram from [
45] divides the soils of El-Beheira and its surroundings into two fertility classes: soils with poor fertility and soils with medium fertility. The limitation of the soils with poor fertility, and medium fertility is due to pH levels between 6.8 and 7.3. They are characterized by low to medium reserves in exchangeable bases and medium to high exchangeable base reserves.
The Dabin [
36] K/Mg diagram shows that all soils in the study area are above the potassium and magnesium deficiency thresholds. For the most part, they have a good K-Mg balance (1 < Mg/K < 4). This reflects a nutritional balance between Mg and K. This reflects an excess of assimilation of Mg in the soil by the roots of plants, compared to K. There is an excess of assimilation of K by plants, compared to Mg. Too high a K/Mg ratio in light soils causes magnesium deficiency and therefore decreases yields, while in clay soils, too low a K
+/Mg
2+ ratio slows down the rate of potassium uptake, thus limiting yields [
57].
According to this Ca/Mg binary diagram, all alluvial soils and their surroundings are above the magnesium (Mg = 0.3 meq/100 g) and calcium (Ca = 1 meq/100 g) deficiency and deficiency thresholds. According to the work of [
54,
71], the decrease in calcium and magnesium in a nutrient solution would be due to the increase in potassium contents. The south-western part has a deficiency of Mg compared to Ca (Ca/Mg > 5) therefore a nutritional imbalance which indicates an excess of Ca in the soil compared to Mg. The rest of the soils in the study area have a perfect Ca-Mg (1 < Ca/Mg < 5) balance. This means that these soils are satisfactory and reflect a nutritional balance between Ca and Mg [
72,
73].
The balance between the saturation rate and pH makes it possible to highlight the influence of pH on the evolution of exchangeable bases in the soil. It was obvious in the soils with a good saturation rate (CEC > 50%). This reflects a low level of pH in these soils. Soils with an average saturation rate are located within the sure line and east and southern parts. This means that these soils are moderately (6.8 < pH < 8) with medium exchangeable cation contents. The pH values showing moderately pH soils are a limiting factor for plant nutrition [
73,
74,
75,
76].
3.3. Criteria for Assessing the Fertility of Soils
The statistical analysis of the fertility parameters as well as the balances between these parameters made it possible to assess the current fertility status (
Table 5,
Figure 5) of the soils. Then, they were grouped into fertility classes according to [
61] modified by [
36,
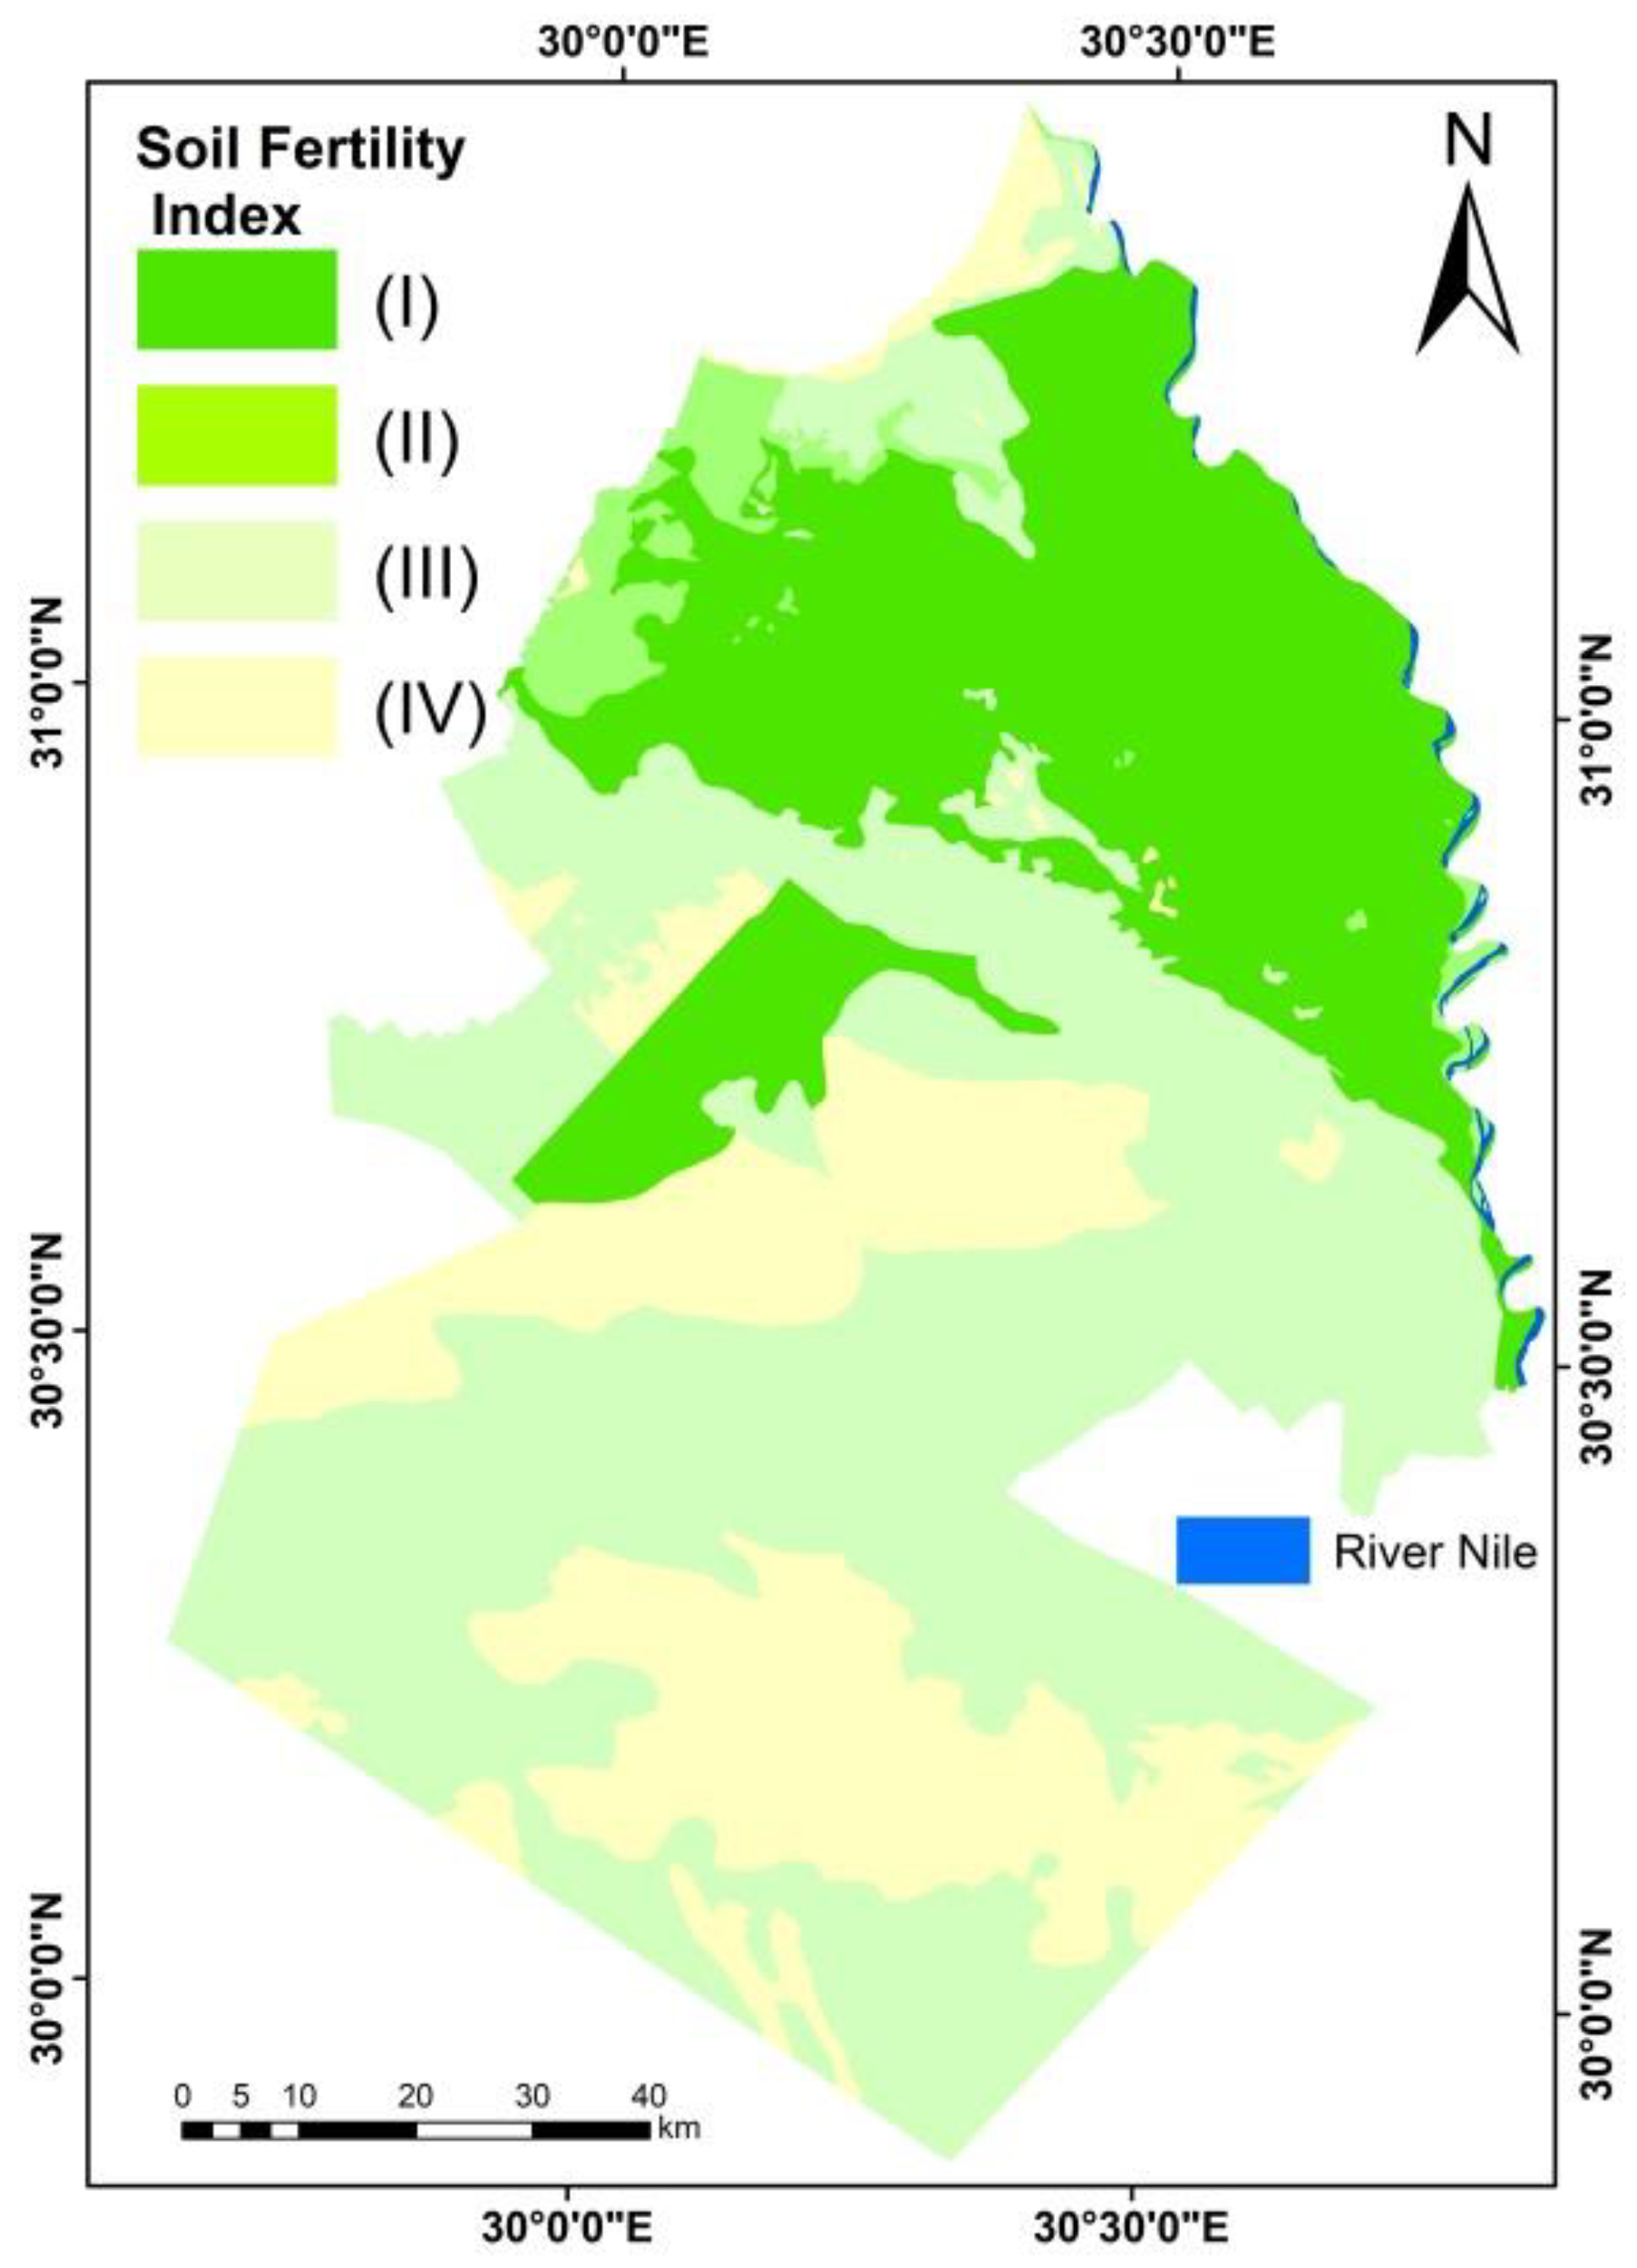
45]. This made it possible to define four levels of fertility of soils.
According to the soil fertility assessment (
Table 5), four soil fertility classes can be differentiated. Class (I) include groups together soils with a good level of fertility such as
Vertic Torrifluvents. They present medium limitations in pH and phosphorus. This means that these soils necessarily need the addition of CaO in order to be improved. Class (II includes soils with a medium level of fertility, such as
Typic Torrifluvents. These soils have medium limitations in FI, pH, CEC, and moderate limitations in phosphorus. It is necessary to provide these soils with agricultural inputs rich in phosphate fertilizer, without forgetting the practice of fallowing for a long period of time in order to allow a reconstitution of the soil properties. Class (III), which includes soils with a poor level of fertility, such as
Typic Haplocalcids, Typic Calcigypsids, Typic Haplogypsids, Typic Quartizipsamments. They present severe to very severe limitations in FI, SSI, BI, pH, CEC, and medium to severe limitations in P. This means that these soils need organic fertilizer inputs to repair the seemingly very poor physical properties in order to facilitate good soil aeration and sufficient retention of infiltration water. The practice of fallowing for a long period of time is essential for the good fertility of these soils. Lime is important to improve the acidity of these soils, which present high toxicity risks. A calcium amendment would favor the availability of P and Mg to the plant, which would facilitate the installation of the roots. Class (IV) groups together soils with a good level of fertility, such as
Typic Torripsamments, rock escarpment (
Calcic petrocalcids), and rock land
(Typic petrocalcids). They present severe limitations in nutrient depletions. This means that these soils necessarily need the addition of all fertilizers depending on the crop requirements in order to be improved.
3.4. Spatial Distribution of Fertility of El-Beheira Soils
The soil fertility spatial distribution map (
Figure 5) shows that poorly fertile soils are located north (surrounding the Idku lake, costal area and west and south of the study area). They cover 57% of the study area. Average fertility soils are located to the west of the study area. They cover 7% of the study area. Soils with good fertility spread over the entire study area. They cover 66.65% of the study area or an area of about 39% of the total area.
3.5. Quantitative Assessment of Land Degradation
From
Table 6 and
Figure 6,
Figure 7 and
Figure 8 soil quality degradation is one of the main causes of land degradation. Soil can be severely degraded due to compaction, salinization and sodification, and the use of chemical fertilizers that prevent the land from regenerating, and soil quality also declines as a result of chemical fertilizers for agriculture, increasing the pollution of water and land and thus reducing the value of the land.
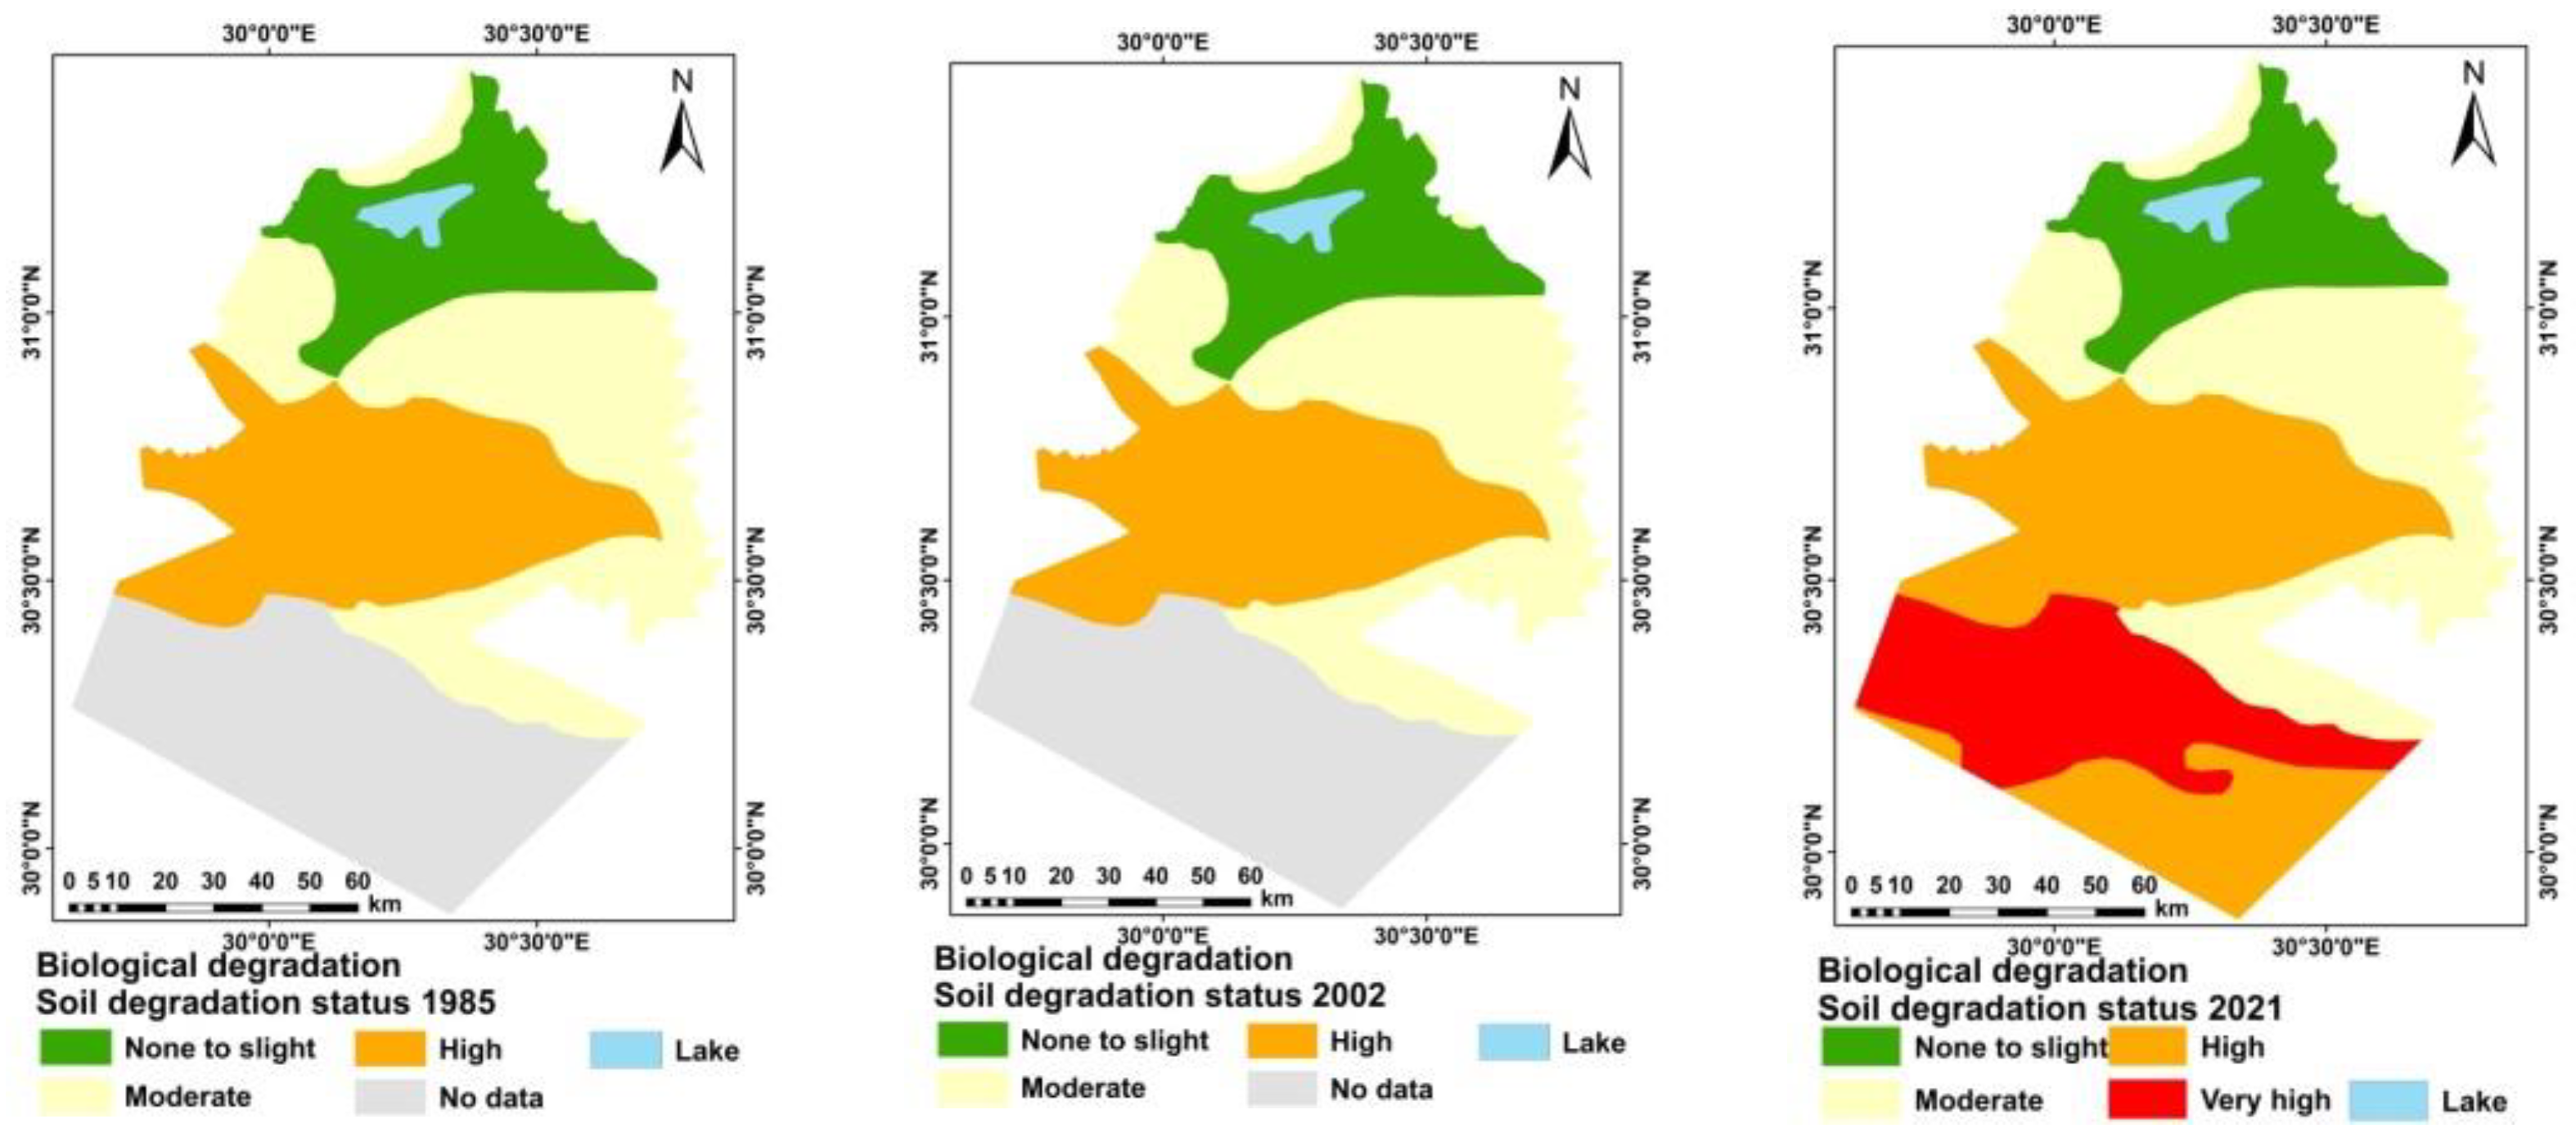
From
Figure 9, the nature of the land covers changed as the result of changes in the environmental conditions between 1985 and 2021. These changes in the physiochemical properties lead to the deterioration of land areas and vegetation cover. The changes in all features are included, i.e., water bodies, cultivated lands, wetlands, dry lands, and bare soils. The study showed that the area of water bodies was not significantly affected; inverse with the area of cultivated lands and wetlands, and its effect is directly on the area of dry and bare soils. This was directly affected by anthropogenic activities.
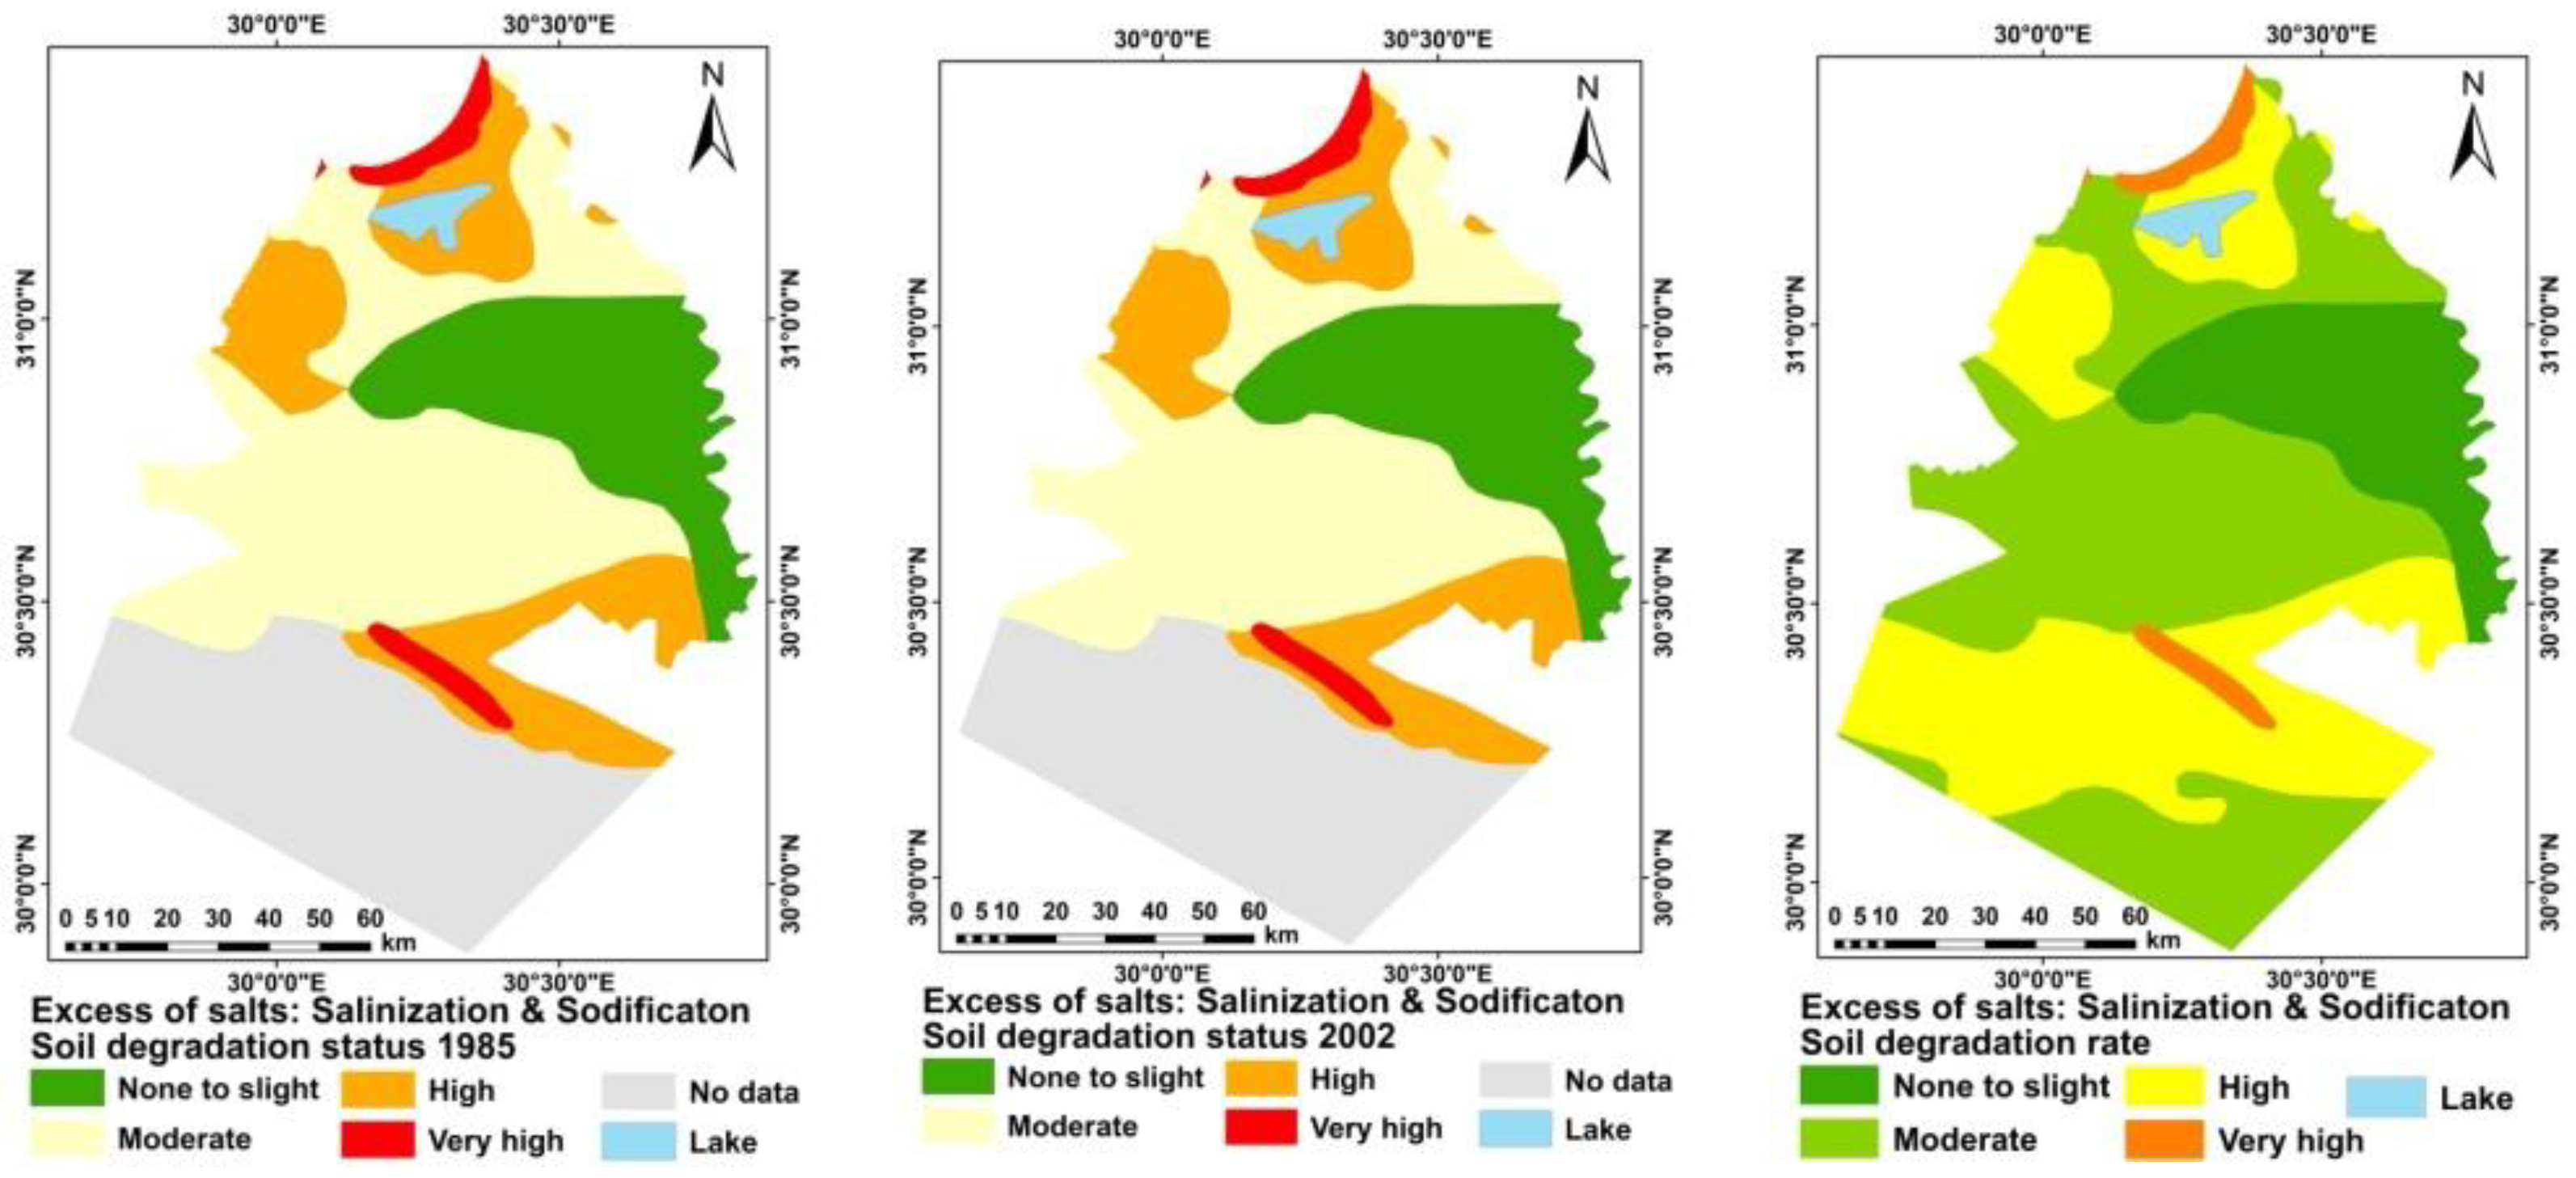
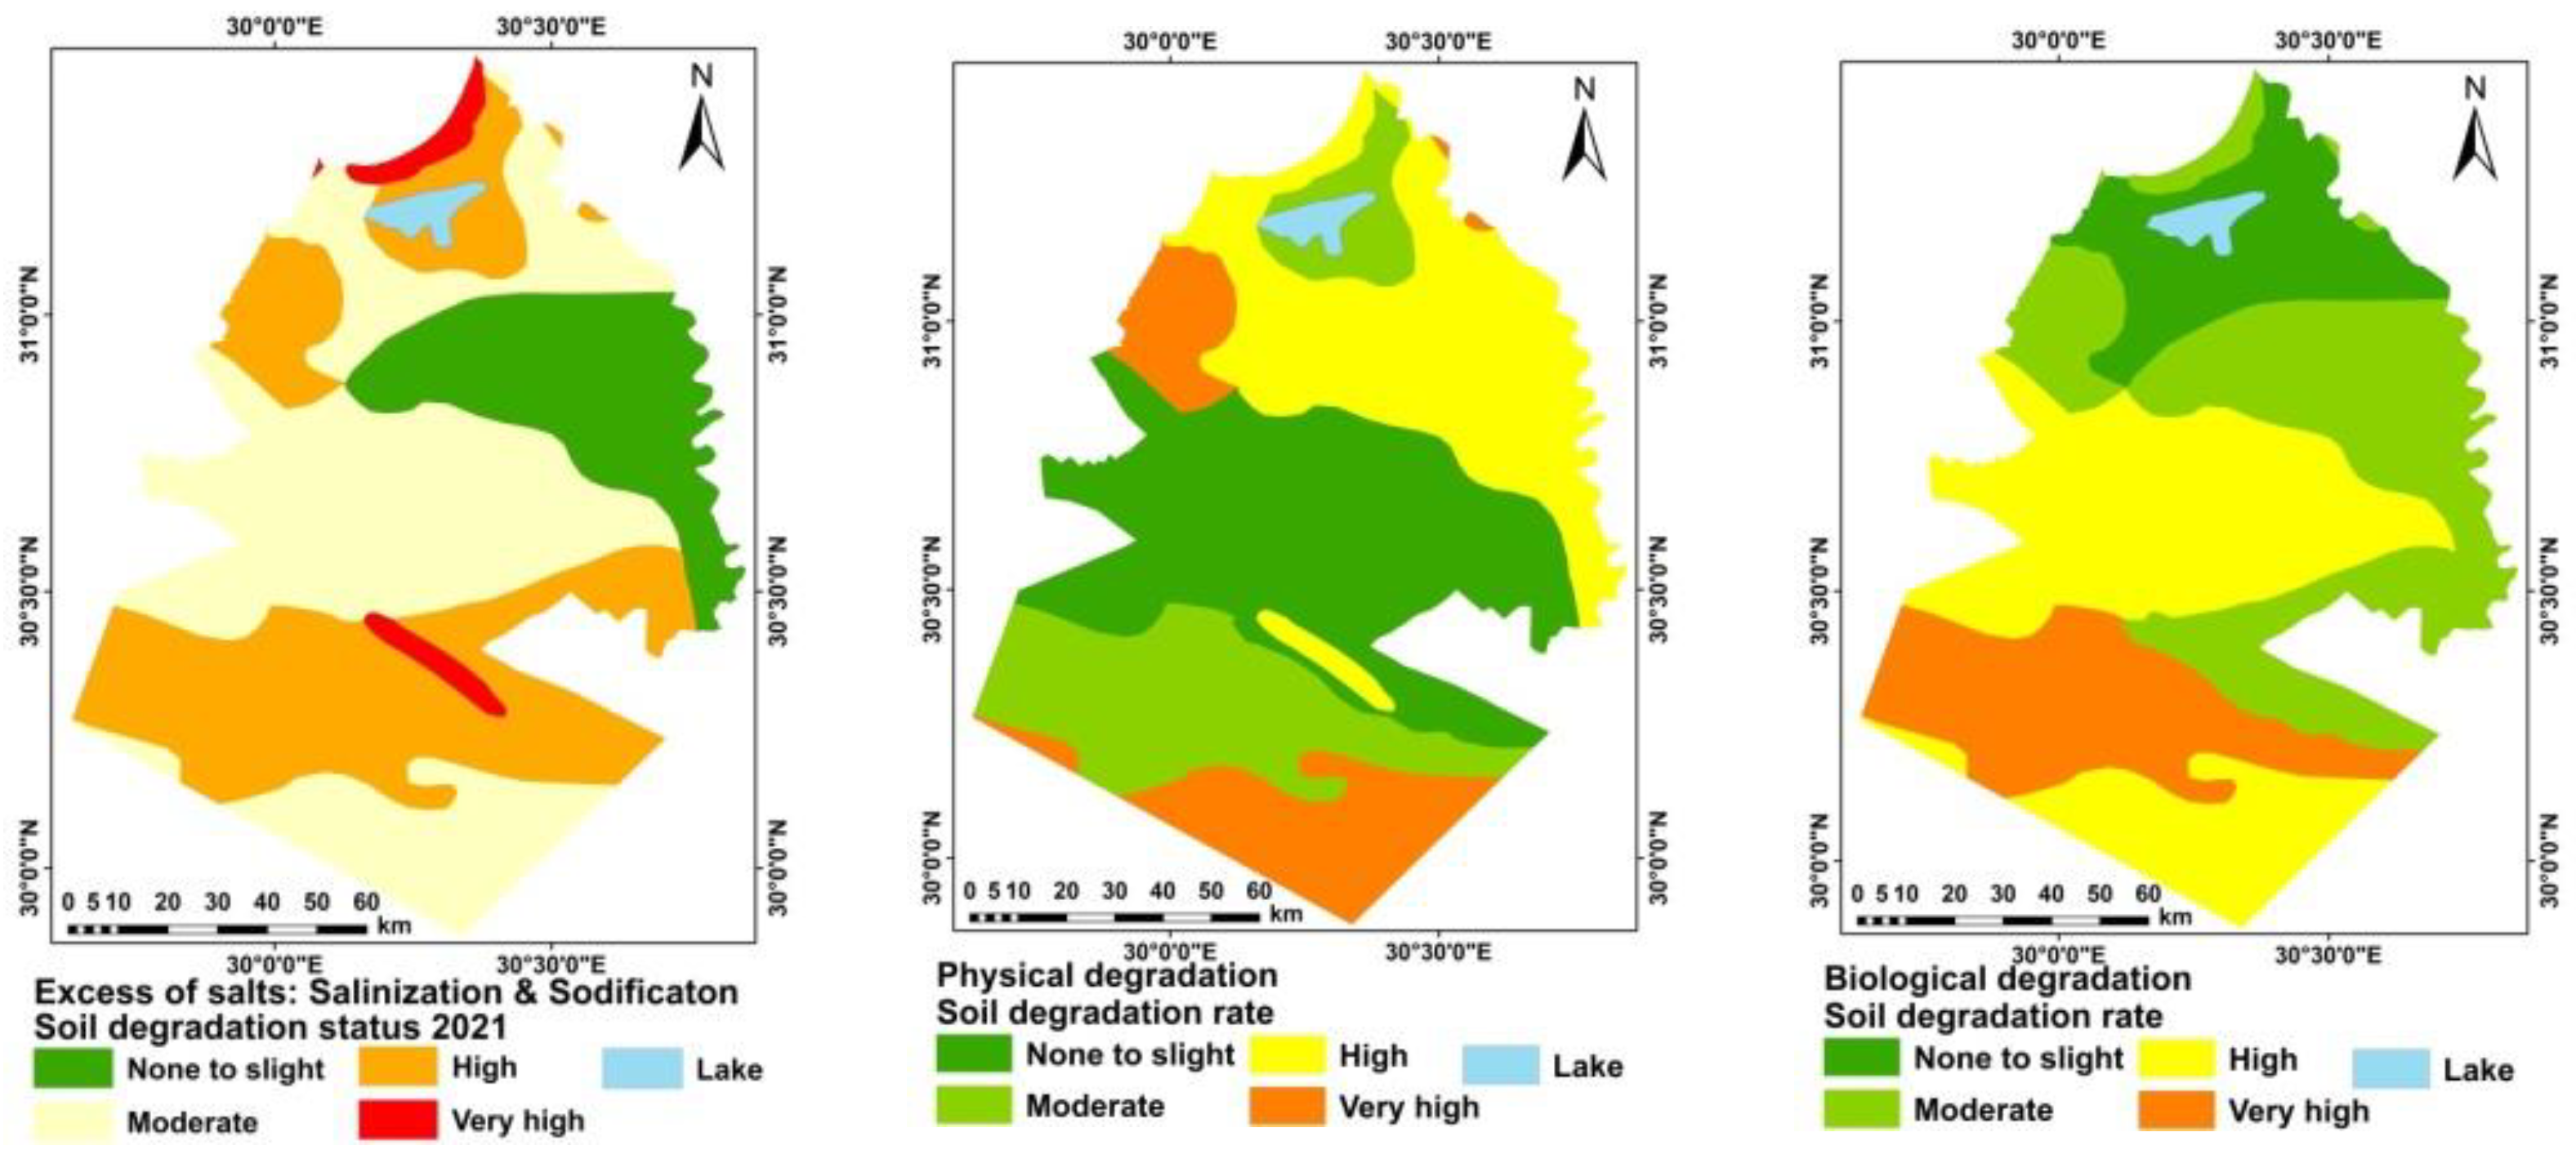
The estimations of degradation are made without taking the salinity and alkalinity of the groundwater into account and are based solely on the calculated climatic index. The study area is at a low to very high risk of salinization (
Figure 9). Higher results for the current state and risk of degradation by salinization are a result of the soil, topography, and human activities. This emphasizes the value of good management and solid agricultural practices through effective drainage and irrigation methods. In the research area, sodification levels range from negligible to severe. Higher values are attributed to the soil, topography, and human activities for the current condition and risk of sodification degradation (
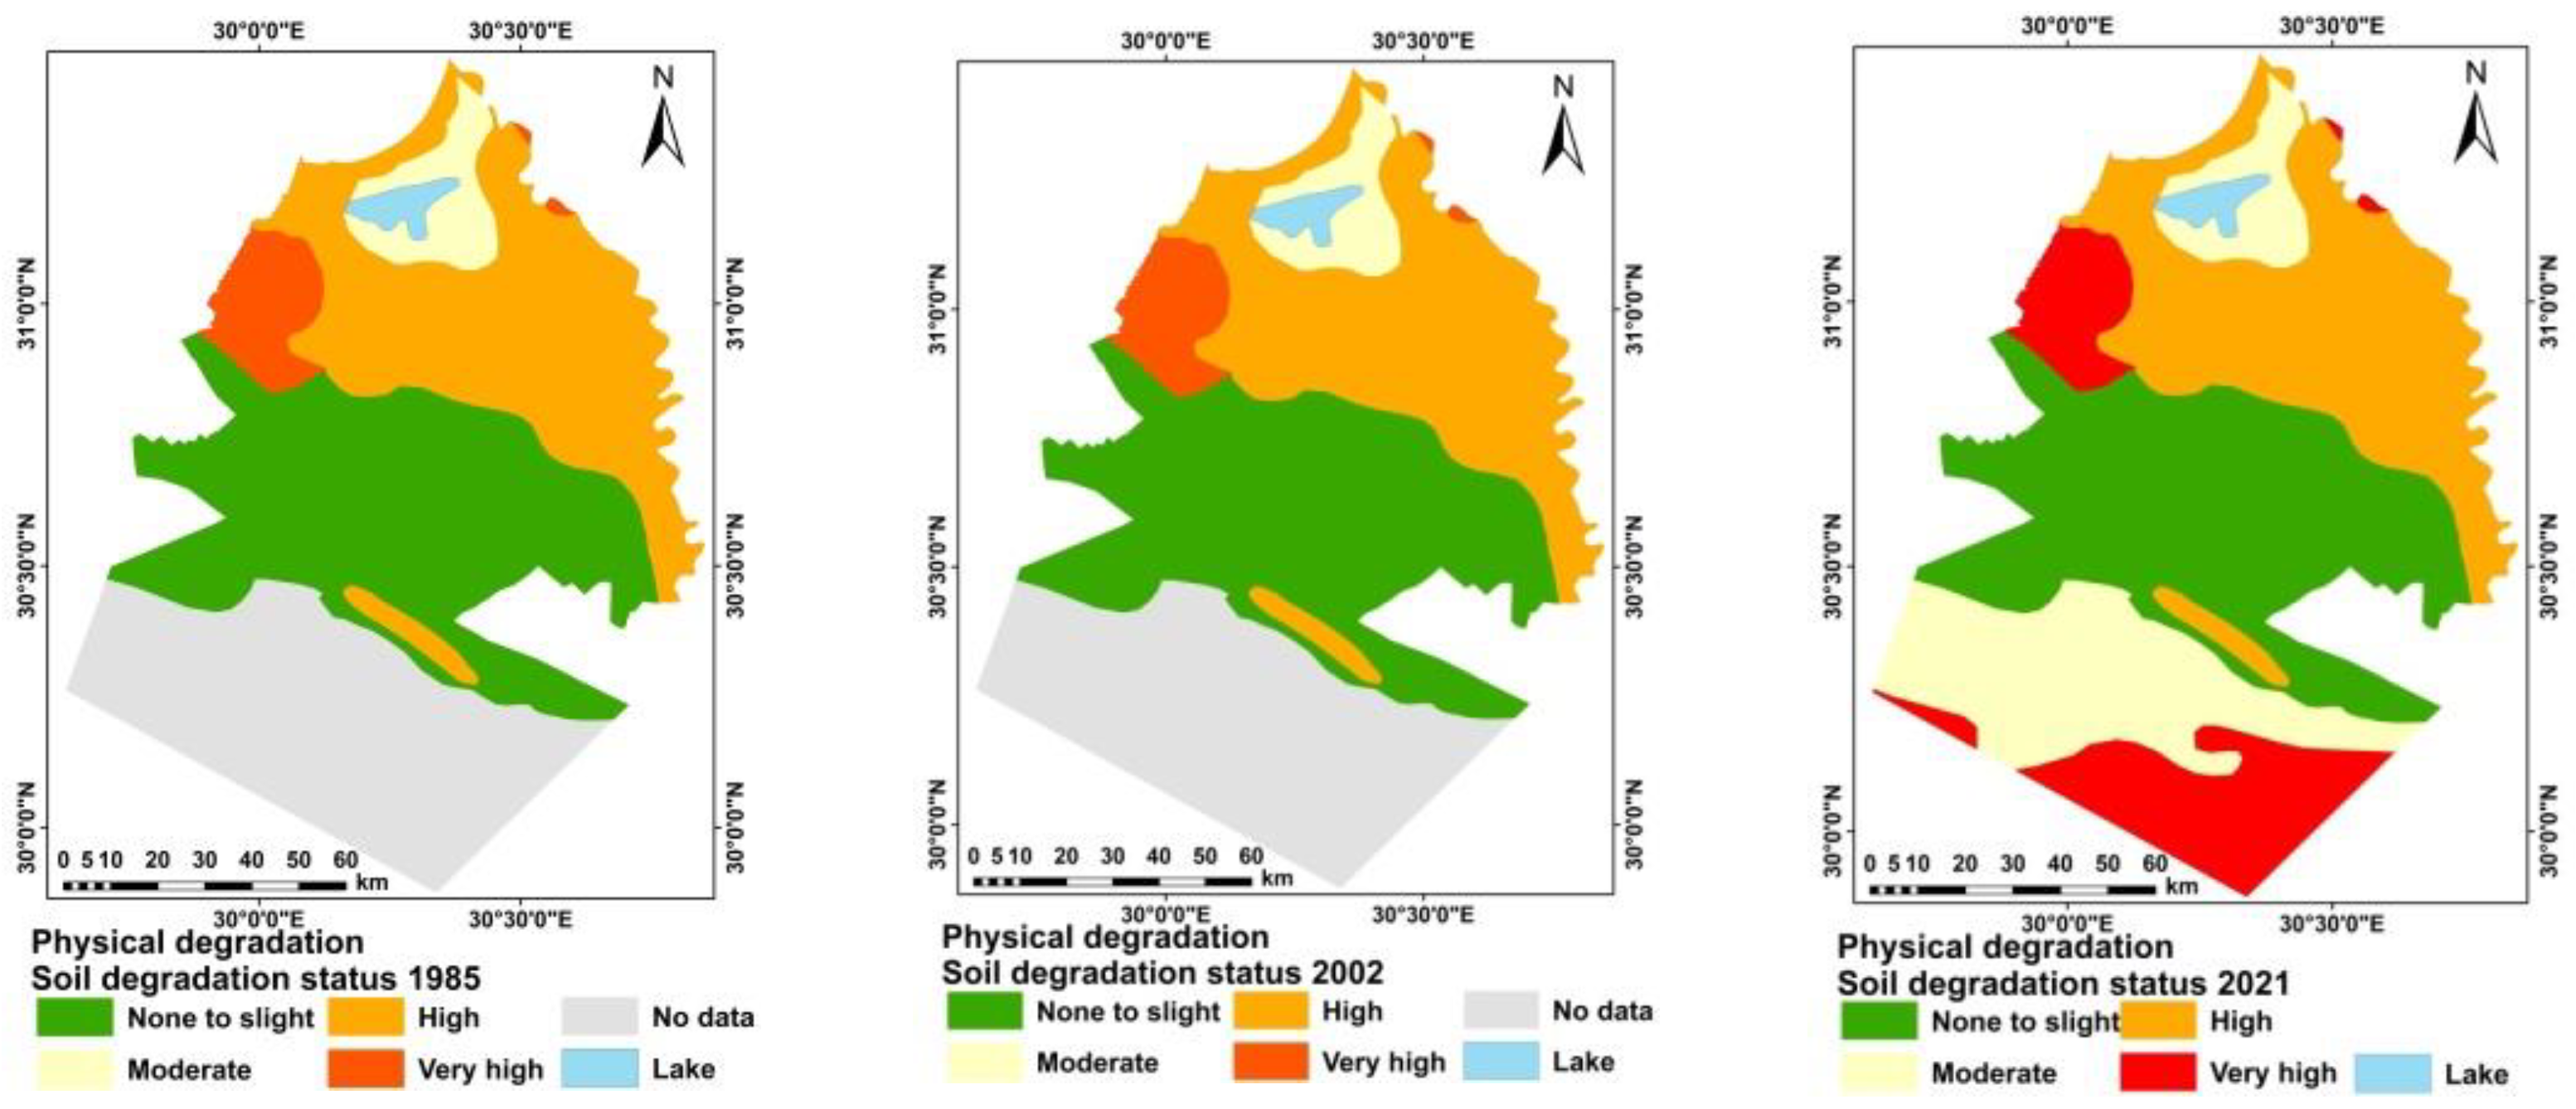
Figure 10). Soil compaction risk, which is determined based on bulk density, is referred to as physical degradation risk (
Figure 11). Biological degradation is calculated upon the organic matter deterioration (
Figure 12).
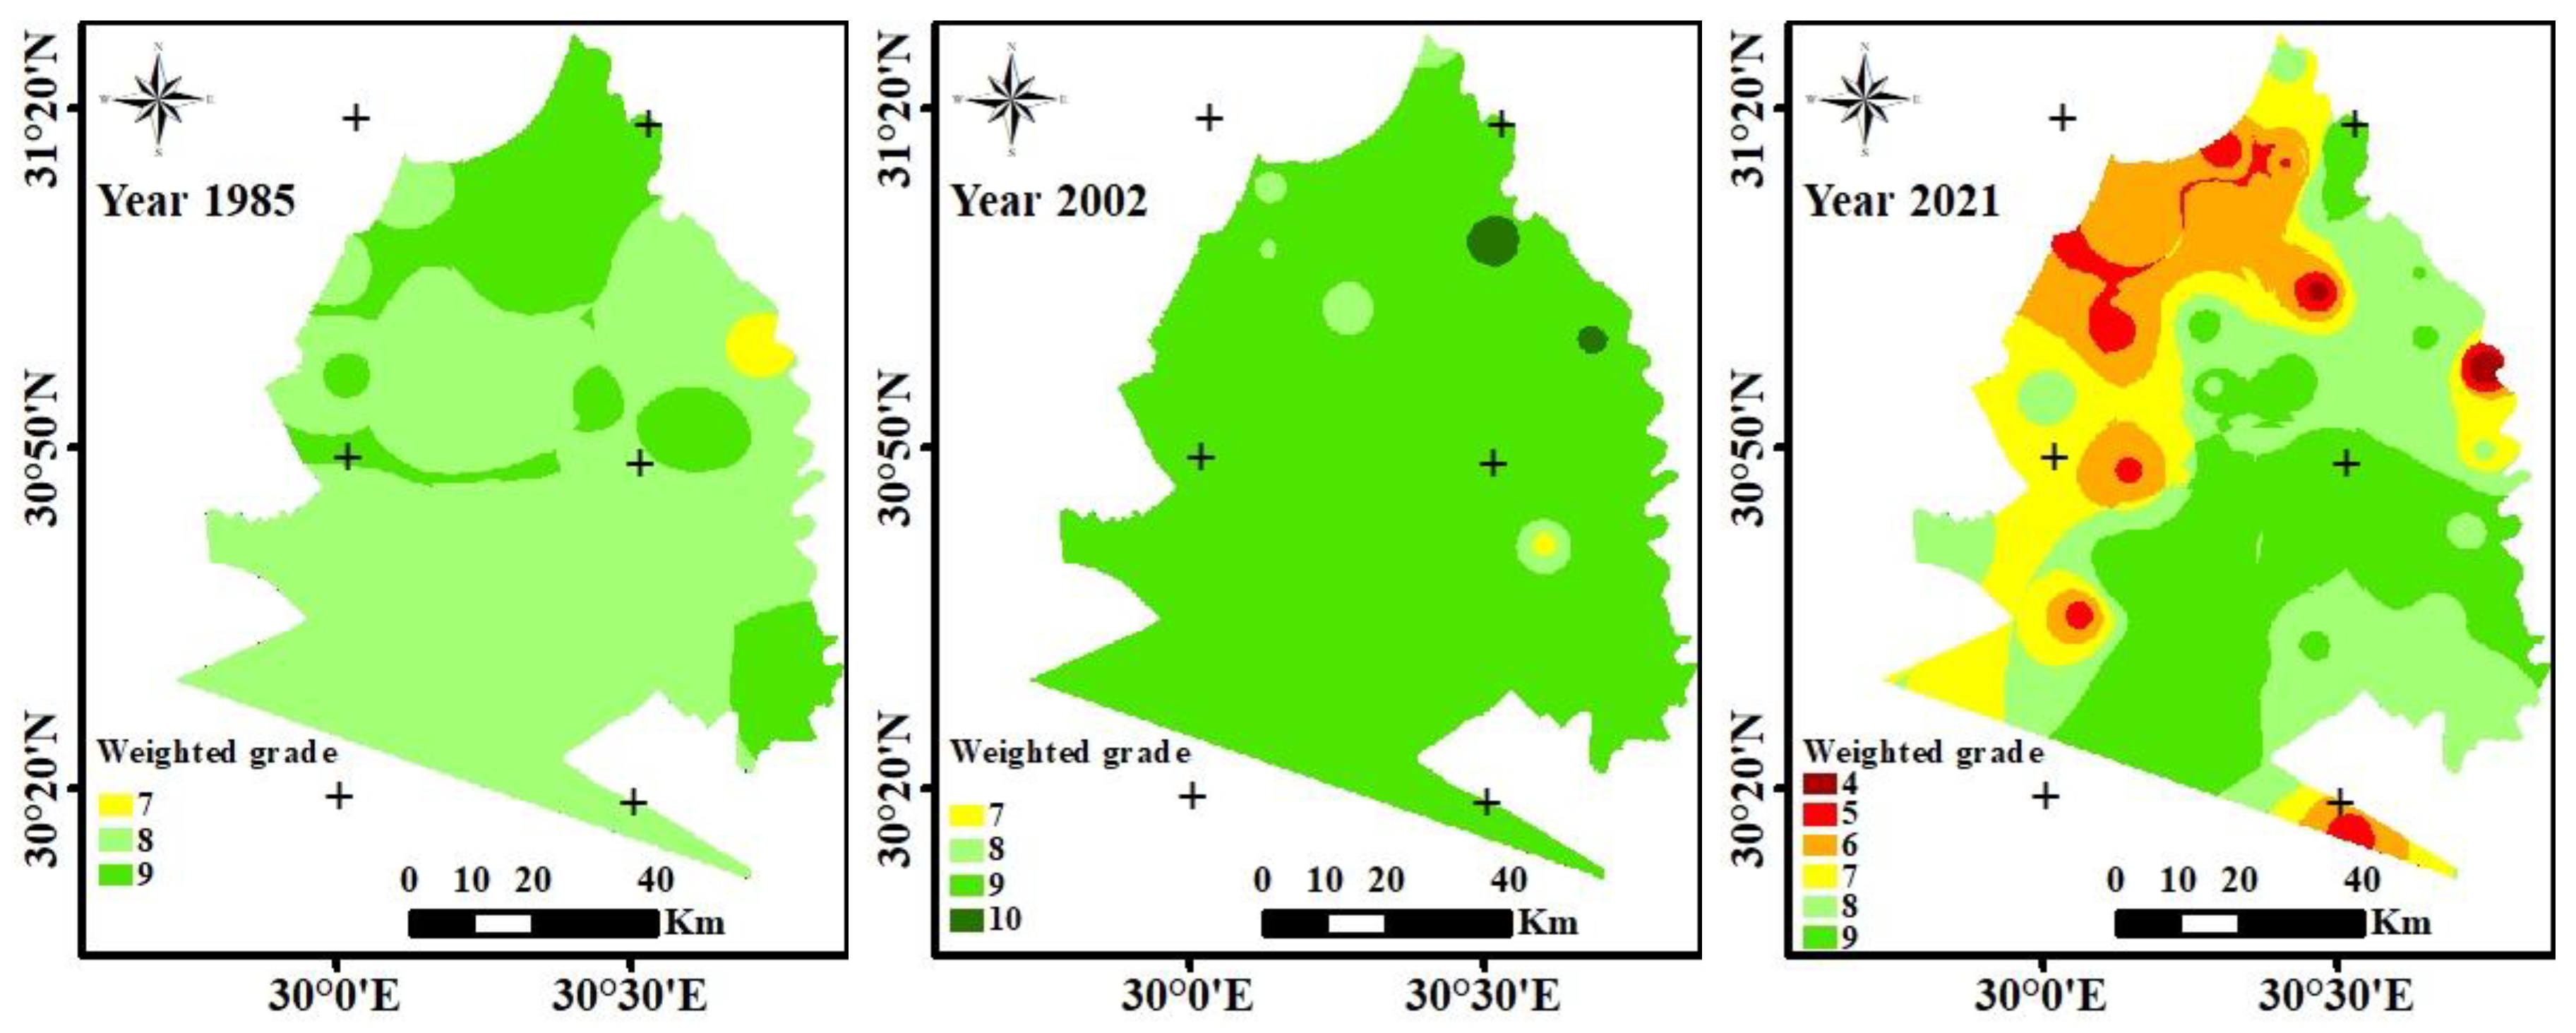
By combining the degree and relative extents of the various degradation classes, the Arc GIS spatial model generated the quantification of total land degradation (
Figure 13). More than 50% of the units have deterioration rates that range from moderate to very high. Landforms and soil degradation severity levels are found to be related. Particularly in the north and clay-covered areas, it is at high levels, although it is only experiencing mild levels of degradation in sandy soils and river terrace soils wadi deposits, however, were a severely deteriorated area.
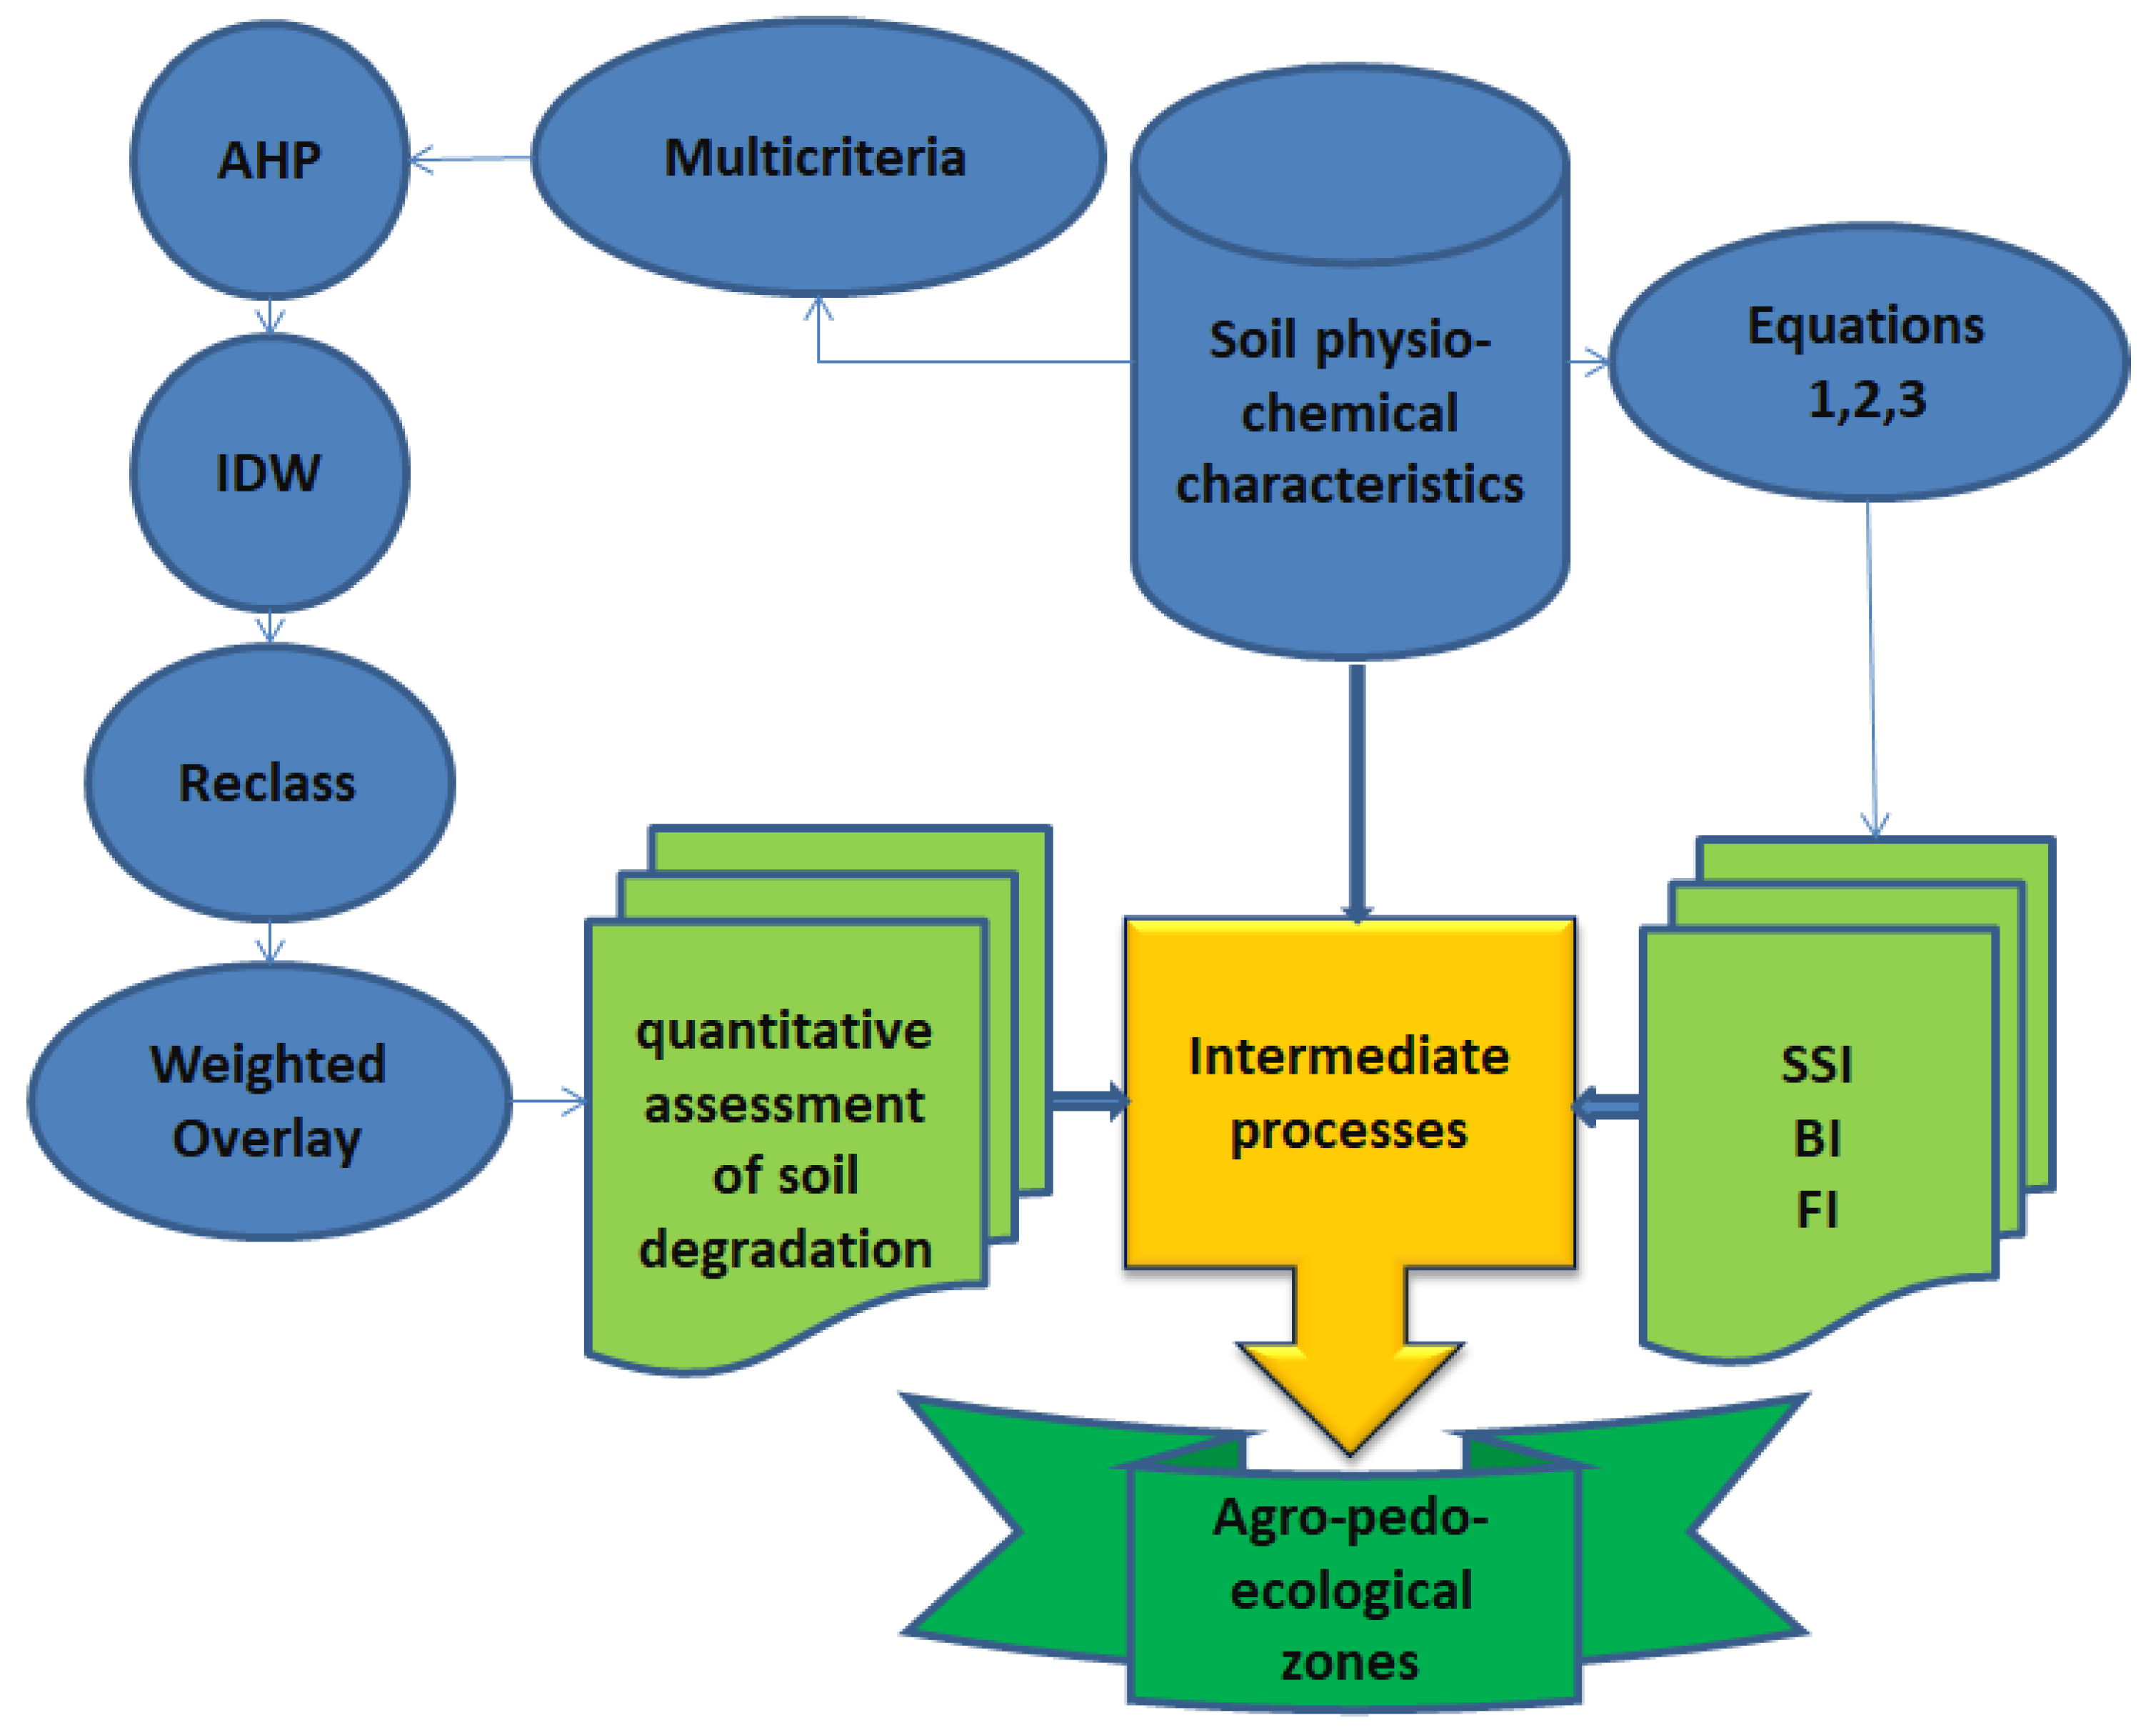
To be successful in combating land degradation, a better awareness of its origins, effect, degree, and familiarity with climate, soil, water, land cover, and socioeconomic aspects is required. As a result, assessing land degradation is a fundamental aim of a decision support system for reversing deterioration. The study intends to use a neural network approach to measure the dynamic of land degradation in the north delta over a 50-year period. The research region is in Egypt’s north delta (El-Beheira Governorate). Spatial models for overall qualitative land deterioration were constructed in 1985, 2002, and 2021 using the Model Builder tool in ArcGIS 10.3 (spatial analyst extension) for land degradation mapping. Land degradation variables (salinization, alkalinization, compaction, lime concentration, and water logging) were collected in a raster and each data set was rated on a scale of 1 to 5 (very low, low, moderate, high, and very high scale). The data sets were then weighted based on their impact on the overall model (more weight = greater effect). From 1985 to 2021, the total degradation change for highly degraded soil grew, whereas it dropped for very highly degraded soil. However, the low deteriorated soil grew over time, at the cost of the highly degraded soils, as a result of the reclamation process and soil management.
4. Discussions
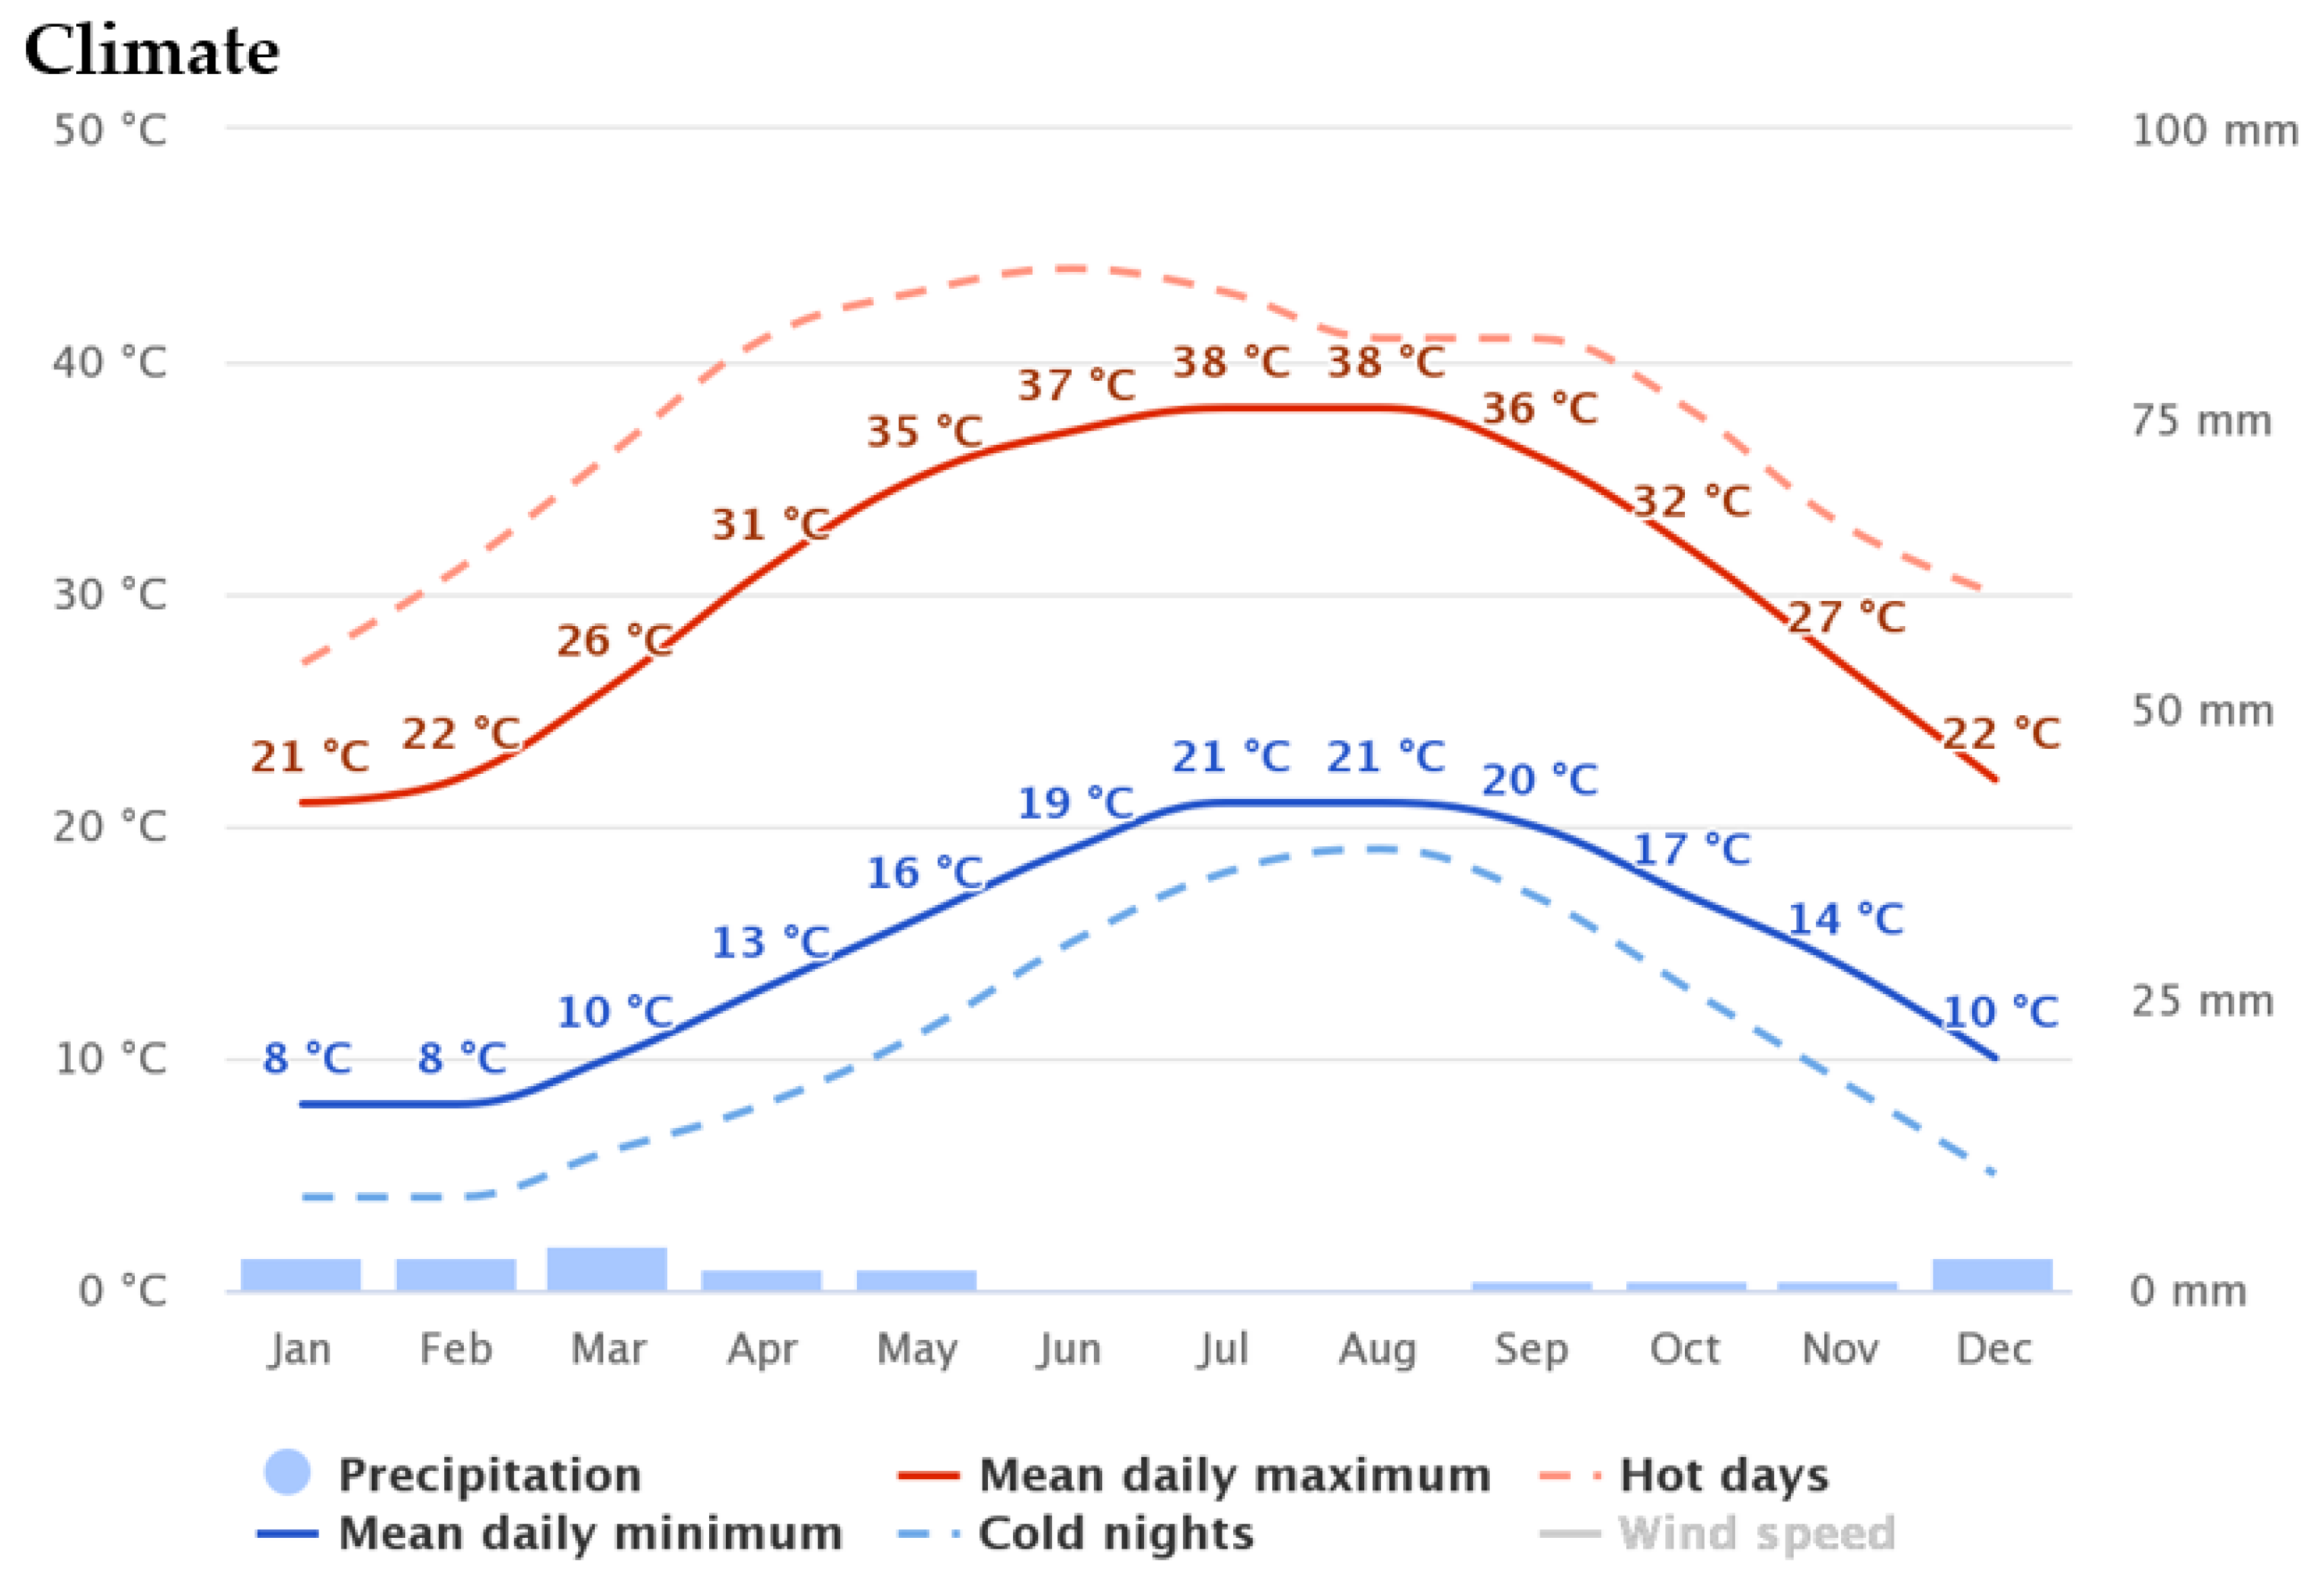
The majority of the agricultural soils in these areas are saline and have low productivity due to the predominance of soluble salts because of the dry, arid climate [
77]. In addition, the use of low-quality irrigation wastewater to meet the increasing irrigation water requirements is a result of the scarcity of surface water resources [
78]. This leads, under harsh climatic conditions, to an increase in the concentration of salts in the upper horizon through evaporation, especially in clay soils.
The groundwater table depths of the old agricultural lands were typically between 120 and 130 cm, which is deep, with some parts having (80 cm), which had a moderate depth level. Most soils have a high clay texture overall (45 to 68%), and some additionally have a sandy clay loam texture (40–50%). According to reports, the former reclaimed agricultural area in the north of Egypt had a deep groundwater table that ranged in depth from 100 to 150 cm and was of fine texture (clay loam to clay). Going toward the Mediterranean Sea, these soils were stated to have more clay [
79]. Furthermore, it has been noted that soils in arid and semi-arid areas have a higher build-up of calcium and magnesium carbonates and sulphates and have pH values that are somewhat alkaline (7.8 to 8.6) [
80]. Due to the nature of the parent material from which these soils were created and the insufficient and limited leaching, it has been observed that soils along the northwestern coast are very calcareous. Additionally, due to the limited translocation of carbonates, the predominance of the arid climatic conditions may have aided in the creation of zones or horizons. These soils, which are equivalent to fluvio-marine plain soils in the area, contain low gypsum content (0.10–1.45%), CaCO
3 content (0.35–2.30%), and organic matter at the top layer that ranged between 1.11 and 2.55% [
81]. The El-Beheira governorate’s reclaimed soils, which had been irrigated with drainage waters since the 1960s, were reported to have a texture that ranged from sandy, silty loam to clay, a calcium carbonate content between 2 and 20%, and very little organic matter [
82]. However, it was shown that these soils’ acquired organic matter concentration was adequate for agricultural productivity despite the existing arid circumstances [
82].
These old, reclaimed lands have a clay texture (30–60% clay) and a non-saline character (EC ≤ 4.0 dS m
−1), which may be related to the fact that the soil is from an old flood plain [
12]. Due to poor drainage, these soils have a moderate level (100 cm) and rather deep-water table [
83]. There is a second stratum of sandy clay loam in this soil as well. These soils had a pH that varied from 7.2 to 8.1, and possess a sandy clay loam area with a major clayey texture (50 to 69%). The pH was in the desired range (7–8). The maximum EC value was 21.13 dS m
−1, which indicates that salinity is only moderately affecting the EC range [
83]. The pH of some reclaimed sandy soils west of the Nile delta and calcareous soils inside El-Beheira Governorate lands was alkaline (7.5 to 8.5), according to other studies [
78,
79,
80,
82,
83,
84,
85].
As a result, the parent material from which some of these soils are generated may be to blame for the alkaline soil pH of these lower soil layers [
83,
85,
86,
87]. Old reclaimed agricultural areas may have EC values as high as 15 dS m
−1 [
83,
86]. Additionally, fluvio-marine plain soils were said to have an EC varying from 2.24 to 25.09 dS m
−1 to the north of Egypt [
81]. These values were comparable to the EC of flood plains (clayey agricultural soils) to the north of the delta, where salinity ranged from 1.6 to 20.5 dS m
−1 [
88]. Overall, some soils’ lower levels showed a noticeable rise in salt. The upward migration of salts from lower strata during dry periods, during irrigation intervals, and during the period without irrigation at the end of the season may explain this occurrence [
87]. The loss of moisture from the top layers through evaporation and, in some regions, the capillary rise of salty fluids from the shallow water table may also be contributing factors to the increase in soil salinity values [
87].
The majority of coastal lands were clayey (25–57%), with sandy clay loam everywhere. Salinity (EC 4.0 dS m
−1) affects coastal soils [
13]. These soils’ pH varies from the top layer to the lower level, with the top layer having a small area of near neutrality (pH = 7.5). However, the majority of the land was found to have an alkaline pH, with a value of 8.81 from 60 to 80 cm. This range is found naturally in reclaimed desert soil that had an alkaline (pH) throughout its layers and profile, and these results are consistent with other research [
83,
87] that claimed coastal region soils and recently reclaimed soils have a pH range of 7.9–8.5. Furthermore, according to [
87], soils from recovered lakes had a pH that was slightly alkaline (8.0–8.31). However, it has been claimed that a soil pH above 8.70 indicates that CaCO
3 predominates and that MgCO
3 or Na
2CO
3 is present in these soils [
89]. From another angle, the inflow of lake water at these soils may be the cause of this pH increase [
87]. Some of these soils have increased salinity, which may be the result of poor drainage, seepage from low-quality lake water, or intrusion of seawater [
81]. Overall, higher EC values were demonstrated, possibly as a result of the limited permeability of the clayey soils next to the lake [
87]. Higher EC values for the top layer of these soils may be a sign of seawater intrusion causing waterlogging [
79,
87]. However, it was noted that the arid natural regions to the north of Egypt had soil salinities that varied from 6.5 to 31 dS m
−1 [
88]. Additionally, some recently recovered alluvial/marine soils near northern lakes may have EC values as high as 30 dS m
−1 [
83]. The prolonged exposure of these soils to lake seawater may be to blame for the rise in soil salinity. In addition, the lake is shallow, with a depth range of 10 to 90 cm, with the eastern and central portions of the lake having the deepest depths reported [
90]. Furthermore, it has been noted that a shallow saline water table can cause salt to flow through the soil by capillary rise and evapotranspiration [
78,
79,
80,
81,
82,
83,
84,
85,
86,
87,
88,
89,
90,
91,
92,
93,
94,
95,
96]. This can result in salt buildup on the surface of the soil. Additionally, the high groundwater table may be a contributing factor to the limited leaching capacity and salinity of these soils [
79,
80,
81,
82,
83,
84,
85,
86,
87]. Furthermore, it was claimed that elevated Mg
2+ concentrations indicated that these soils were primarily of marine origin [
89].
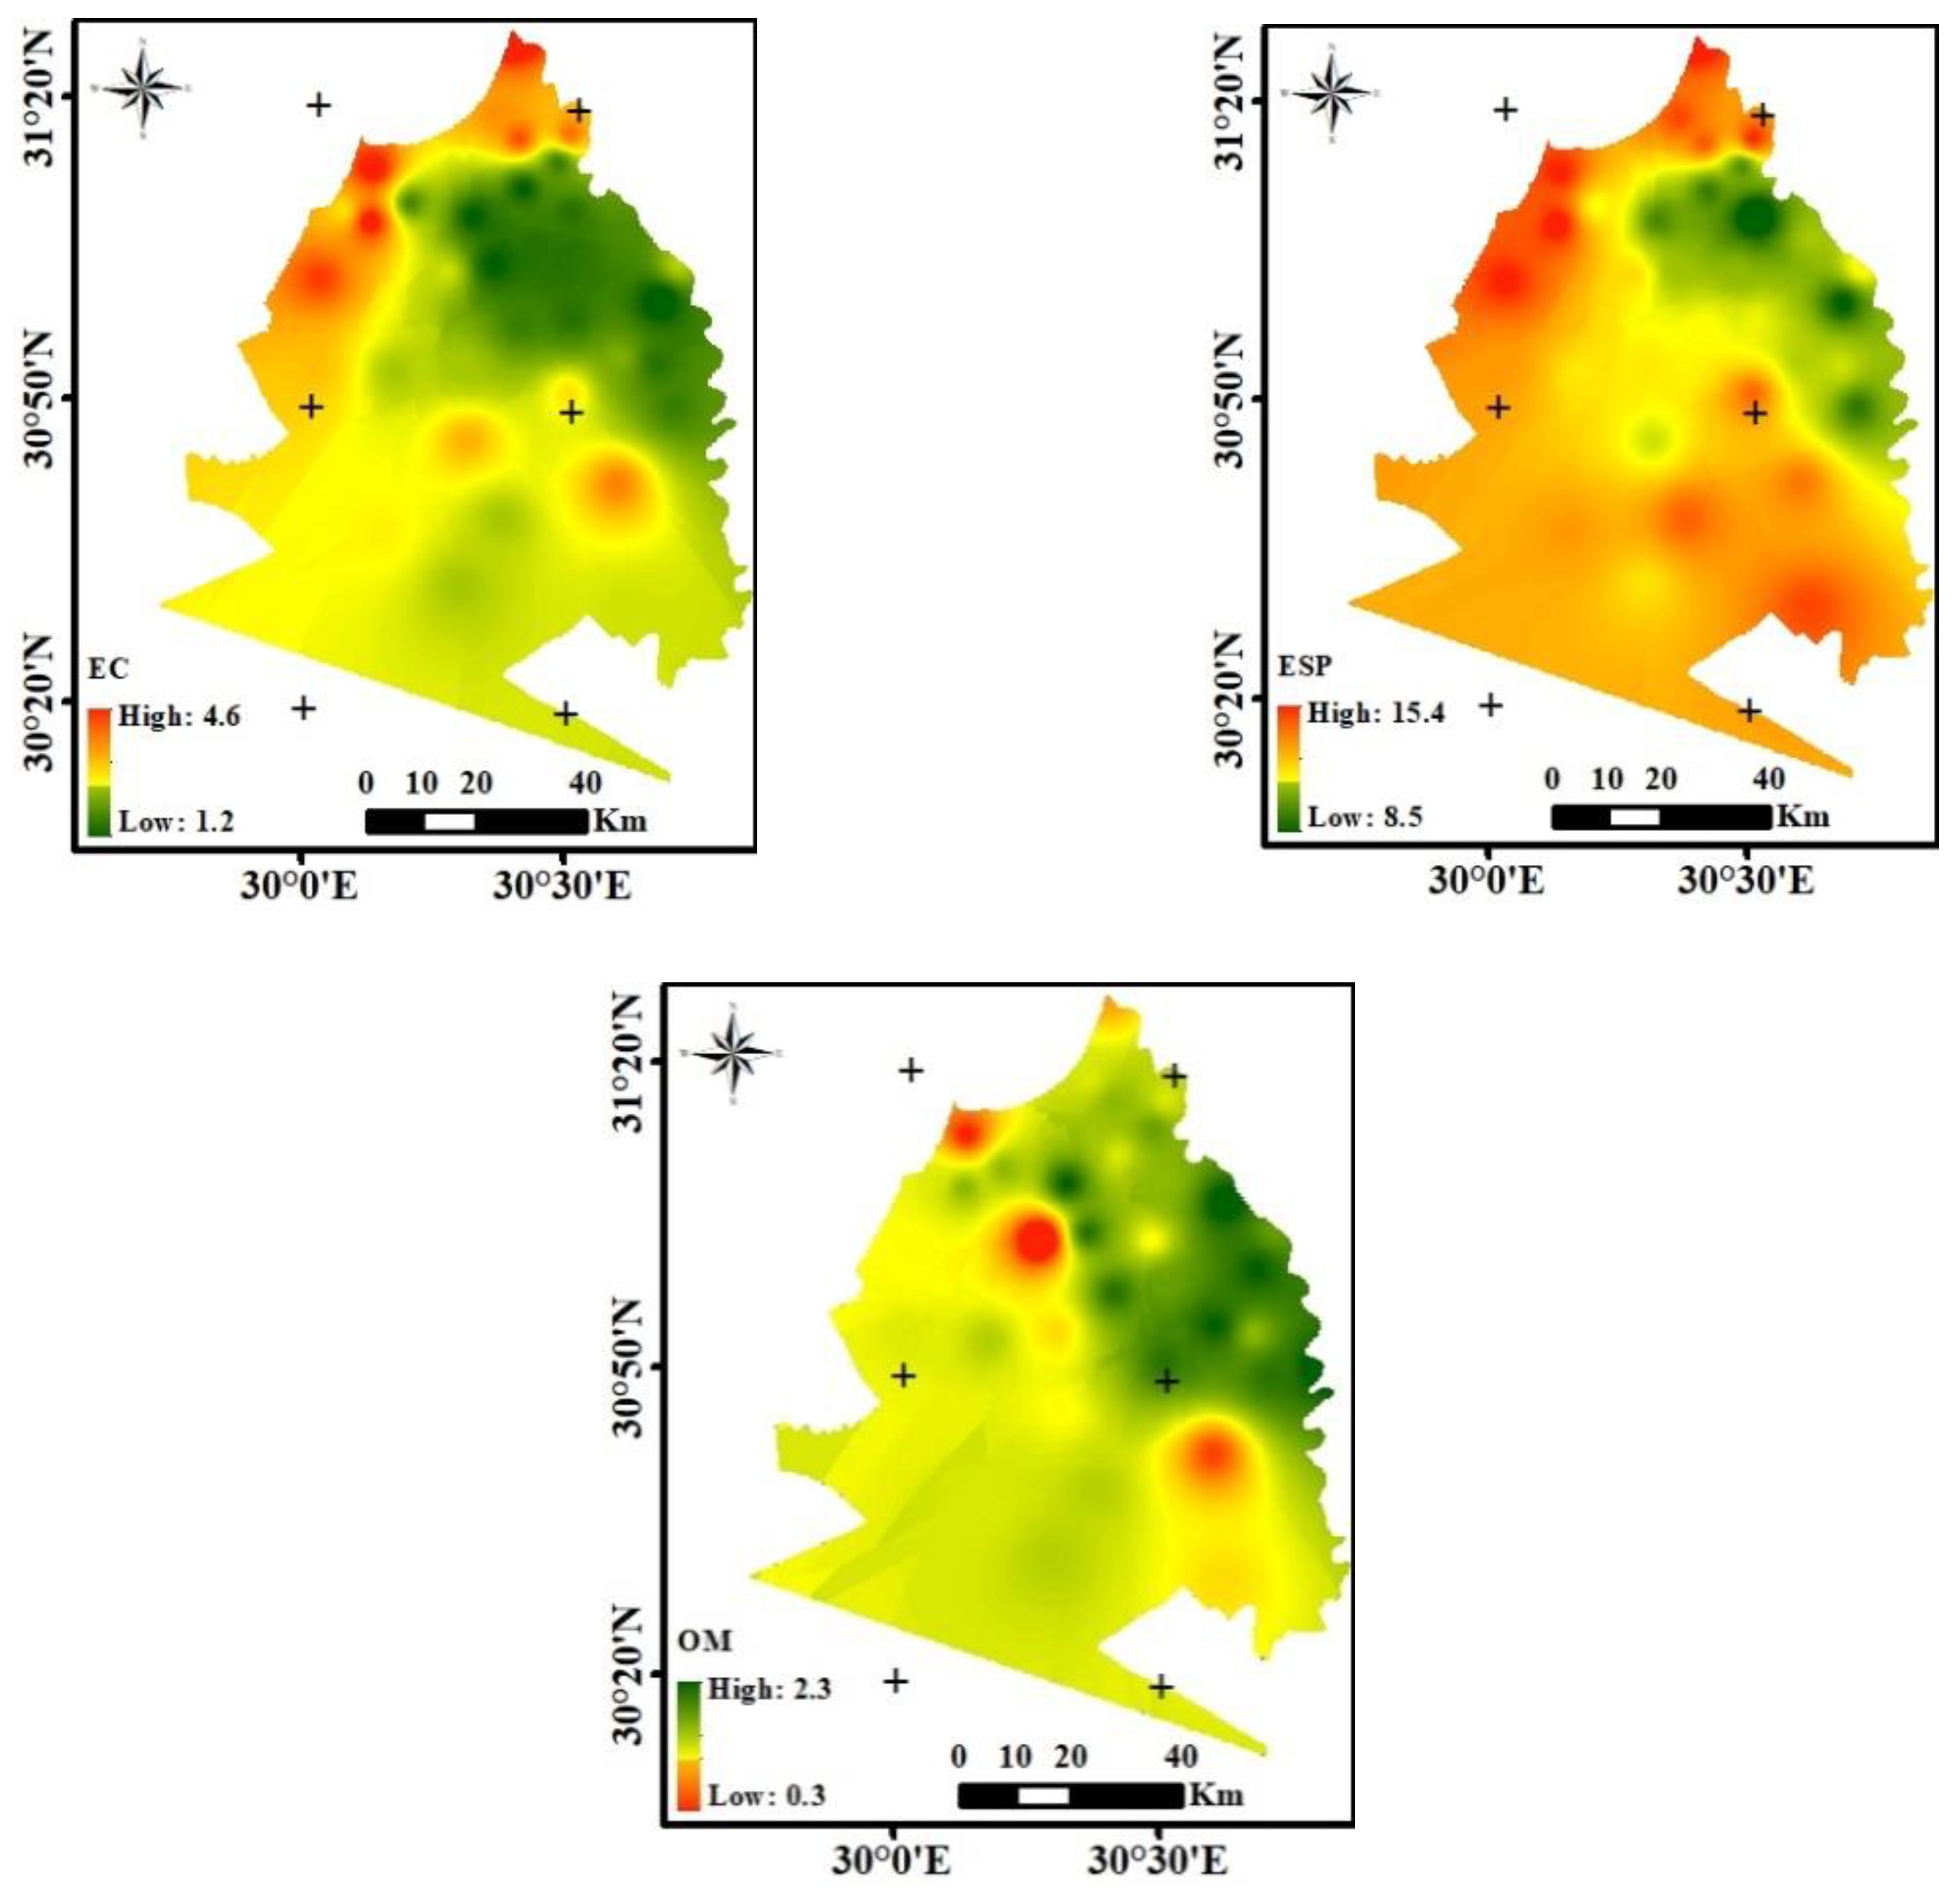
ESP ranges between 6.3 and 10.5%, cation exchange capacity is rather low as it ranges between 2.4 to 6.8 meq/100 g soils, and the available nitrogen, phosphorous, and potassium are ranges from 0.3 to 0.7, 0.9 to 1.6, and 5.8 to 9.3 ppm, respectively. In the southern part of the study area, the soil texture is sandy, with profile depths ranging from 60 to 120 cm. The findings show that the aeolian plain (sand ripples of varied elevations and almost flat to undulating sand sheets), table land (almost flat and gradually slope areas), and old deltaic plain are the primary physiographic units in the examined area (sequence of old river terraces) [
91,
92,
94].
Soil erosion is also a major threat for soil degradation that directly affects biodiversity [
97,
98]. Soil erosion occurs slowly in a discontinuous process in small parts of the northern region (coastal and lacustrine deposits) by precipitation, while wind erosion occurs at the same rate in the southern part of the region (aeolian and wadi deposits). Although the erosion process is not at an alarming rate (non to slight), it does lead to the loss of topsoil and ecological degradation.
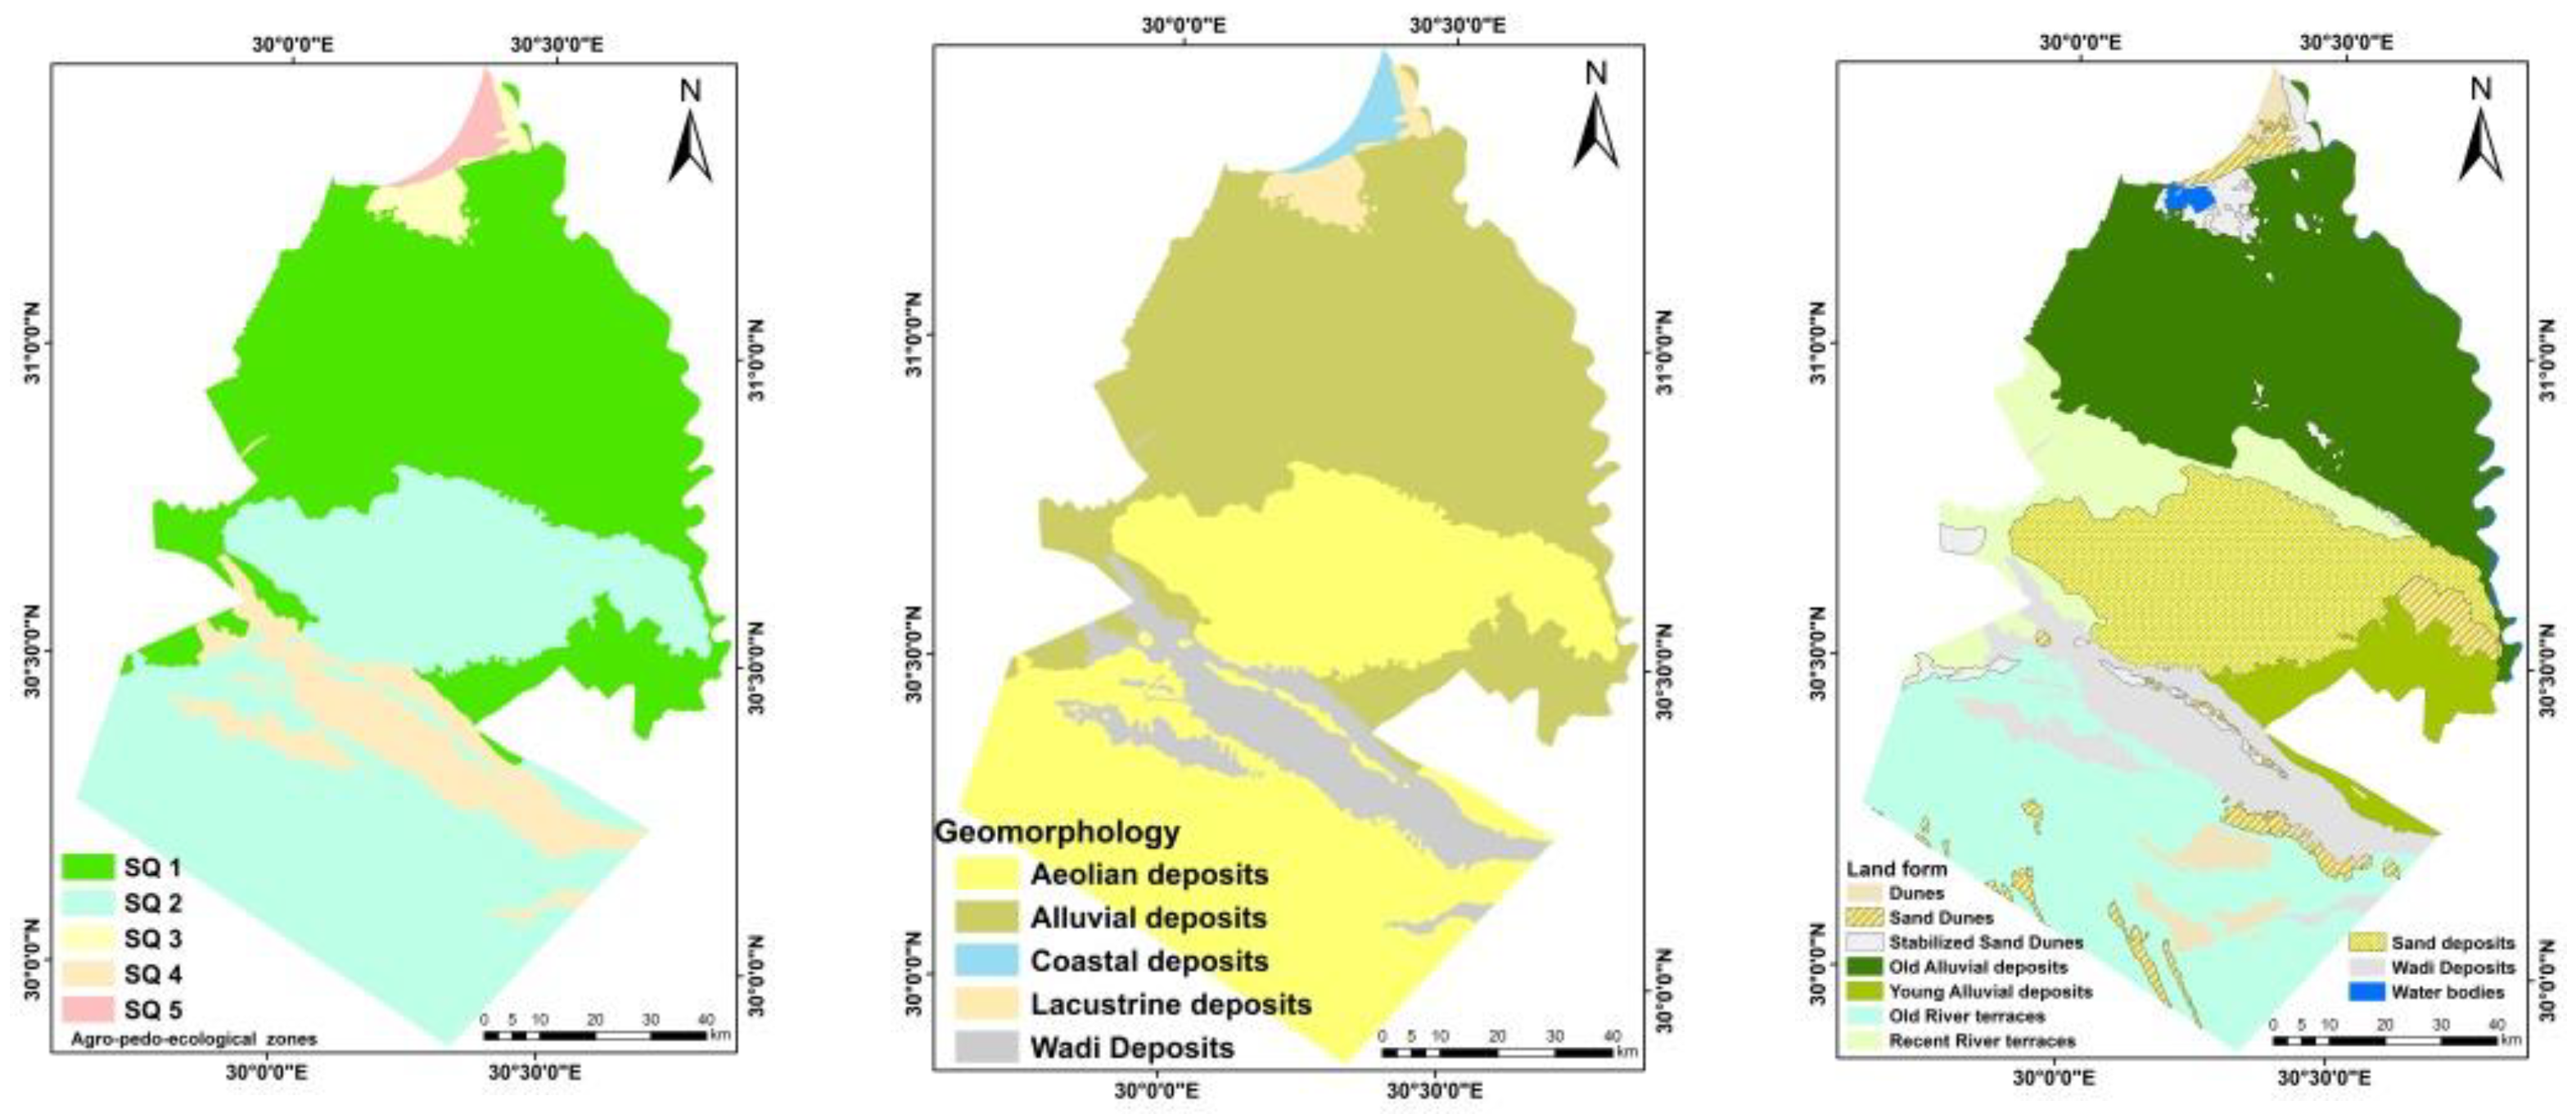
The study area is classified into five agro-pedo-ecological zones (SQ1, SQ2, SQ3, SQ4, and SQ5) as shown in
Figure 14. Qs1 (alluvial deposits) areas produce mainly rice, cotton and wheat, but water shortages and soil degradation have undermined agriculture in the region. The nature of rice cultivation, which consumes large amounts of water, helps to improve the quality of the land by ridding the soil of the salts in it. The study area is already experiencing a water crisis; given the existing environmental problems, water scarcity imposes limits on the economic development. The area is characterized by high land quality and soil fertility, despite the problems of deterioration in it, such as salinization, compaction, and waterlogging.
SQ2 (aeolian deposits) would increase the cultivated area, especially since the types of lands there are good, the fertility rate and their quality are moderate, and there are all kinds of crops such as wheat, corn, vegetables, and fruits. There is an area 50–70 cm away from a mud flat, that was an historic passage for the Nile River that helped to develop agriculture in the area, resulting in a high quality of crops.
SQ3 (lacustrine deposits) and SQ4 (costal deposits); the most important problems inherent in these two areas are salinity, alkalinity, and soil waterlogging, and only salinity-tolerant plants such as rice are present in them. Sabkha is a morphological feature in the area along with salt crust on soil surface.
SQ5 (wadi deposits); lands are marginal, in addition to the exposure of the roots by the effect of the wind on the crops. It also has wetlands, where groundwater resides from the surface of the soil, impeding the growth of plants
Since landform is a key component of soil formation and a soil mapping criterion [
94], it is practical to employ landform when arranging soil data. Geomorphology enhanced the results and enabled us to employ computer-assisted techniques by combining them with satellite data, field observations, and geomorphology. The ever-growing availability of earth observation data and the well-established use of GIS lead to the development of automated workflows and toolboxes for environmental management [
99,
100,
101].


 ,
, 


