Abstract
Rural settlements in mountainous areas change slowly and are not easy to measure. Reclamation is an important spatial indication of their demise. To measure the spatial–temporal variation of rural settlements extinction from the perspective of regional reclamation projects, and to provide a reference for the scientific evolution of rural settlements in mountainous areas. Based on the data of reclamation projects in Chongqing, China, from 2017 to 2021, with the number of projects, the scale of construction and the scale of newly cultivated land as indicators, coefficient of variation, gravity center model and spatial autocorrelation were used to analyze the distribution characteristics, gravity shift and spatial pattern evolution characteristics of reclamation projects at different spatial scales. The results show that: (1) From the time dimension, the number of reclamation projects, the scale of construction and the scale of newly cultivated land all showed a downward trend, but the differences in the absolute and relative scales of each index gradually decreased, showing a spatiotemporal equilibrium trend. (2) Reclamation projects showed different agglomeration characteristics at different spatial scales. At the regional level, the reclamation projects are concentrated in the city cluster of the Three Gorges reservoir area in Northeast Chongqing. At the district/county level, the reclamation projects are mainly concentrated in Fengjie County (458), followed by Yunyang County (330) and Pengshui County (305), and the least is Wansheng District (32) with an average of about 165. (3) All the centers of gravity in the moving track of the reclamation project center of gravity are located in the city cluster of the Three Gorges reservoir area in northeast Chongqing, and the spatial distribution is geographically balanced. (4) There is a significant agglomeration in the distribution of reclamation projects at the district and county scales. The high-high agglomeration area was mainly concentrated in the city cluster of the Three Gorges reservoir area in northeast Chongqing, and the low-low agglomeration area was mainly distributed in the city proper of Chongqing. The extinction of rural settlements reclamation is affected by regional nature, economy and society, but the land policy is the main driving force. At the same time, we should carefully treat the counties where the rural settlements are disappearing too fast, so as to avoid the drastic changes in the amount and space of cultivated land associated with them.
1. Introduction
Mountainous areas account for about 24% of the total land area in the world, 66.7% of the total land area in China, and 76% of the total land area in Chongqing [1,2]. Rural settlements play a vital role in the rural system, enabling farmers to focus on agriculture and providing them with living places; As a spatial carrier, rural settlements carry farmers’ production and life [3]. Rural settlements in mountainous areas have a long history, experienced the change of dynasties, historical vicissitudes and institutional changes, but the changes are slow and have become “living fossils” of economy and society. The common development patterns of rural settlements in mountainous areas are spatial dispersion, relying on mountains and being far away from the urban economic center. Spatial dispersion of rural settlements is not conducive to infrastructure construction, limits the effective utilization of public resources, and hinders large-scale agricultural production [4]. From the perspective of reclamation, the characteristics of spatial–temporal differentiation of rural settlements in mountainous areas were measured to provide a reference for the optimization of the spatial pattern of rural settlements.
Rural settlements in mountainous areas have attracted a lot of scholars’ attention. In the Spanish Pyrenees, tourism and recreation have caused the abandonment of rural settlements on the valley floor; Distance to campsites and roads is the main driver [5]. Colombia is one of the countries with the largest internally displaced population in the world. Socioecological and geopolitical processes drive rural to urban migration [6]. In the eastern Region of the Black Sea, the second residence of urban to rural migration is located in rural settlements and tourism-developed areas outside metropolitans [7]. Mount Pilion in central Greece is famous for its rural character with rich natural assets [8]. In the Hindu Kush Himalayan region of northern Pakistan, the average family size of the community is about seven people, and the rural settlements are small and scattered [9]. In Tanzania, rural residential sites are closely related to cultivated land and population space [10]. In the Nexpa River basin in Michoacan, Mexico, rural settlements are scattered and are mainly accessed through paths and trail networks [11]. In the Annapurna region of Nepal, tourism causes rural settlements to form a spatial hierarchical structure from inside to outside [12]. In Greece, on Paros Island, the Laciti Plain and Crete island, rural settlements are located in places where more fertile land can be seen with frequent use [13]. China is in the interwoven stage of comprehensive rural revitalization and rapid urbanization, and rural settlements in mountainous areas have become a hot research topic. In Zada County, west of The Himalayas in China, the growth of rural settlements follows the “short-headed S-shaped” function and general expansion law [14]. In Baota District, Shaanxi Province, China, rural settlements are located near counties and towns, close to rivers, farmland and county-level roads, with a sunny slope [15]. In the Loess hilly region of China, the spatial pattern of rural settlements has obvious topographic gradient differentiation, with significant river and road orientation [16]. In Zhangjiakou city, China, the mountainous transect is dominated by the evolution trend of arable land and rural settlements, with a slow evolution process and regular spatial form [17]. In the Panxi region of Sichuan Province, China, geological disasters are the main driving force behind the spatial reconstruction of rural settlements in mountainous areas [18]. In Jilin Province, China, rural settlements were expanded from small to large through exchange mechanisms [19]. In Shandong province, China, the rural population first decreased and then reached a relatively stable state, while the area of rural settlements decreased rapidly after a brief increase [20]. In Qixingguan District, Guiyang, China, rural settlements are “large scattered and small concentrated” [21]. In Fang County, Hubei Province, China, the spatial expansion of rural settlements was significant, patch density decreased, and average patch size increased from 2001 to 2018. rural settlements are more and more obvious to the low gradient regional agglomeration characteristics with superior terrain conditions. Physical geographical factors are the basic factors affecting the spatial pattern evolution of rural settlements in mountainous areas, and social economic and regional conditions are important factors, while policy factors such as “increase and decrease link” and “poverty alleviation relocation” further drive the spatial pattern evolution of rural settlements in mountainous areas [22]. In Tongzhou District, Beijing, China, the number of rural settlements continued to decrease from 1961 to 2015, with a cumulative decrease of 43.30%, while the total area continued to increase by 146.64%. There are four evolution modes, namely, extinction mode, diffusion mode, filling mode and fusion mode [23]. In Shengzhou city, Zhejiang Province, China, nature, social economy and system jointly contributed to the change of rural settlements [24]. In The Caotangxi Watershed of the Three Gorges Reservoir Area of China, the high-altitude declining settlements are gradually migrating to the low-altitude dynamic settlements, and the transition position of cultivated land function is closest to the ecologically vigorous settlements [25]. In Chengkan Village, the core area of Huizhou, Anhui, China, clans live in compact communities, and the architectural layout is gradually dispersed outward along the main road from gathering inwards around ancestral temples [26]. In Jizhou District, Tianjin city, China, an integrated model was adopted to optimize the layout of rural settlements, which could improve the suitability of land use and solve the hollowing of villages [27]. In the Sichuan Basin, China, rural settlements are highly dispersed, and government subsidies, transportation services, accessibility of intermediate market towns and industrial development are the key factors for rural centralized resettlement [28]. In Shaanxi, China, rural settlement consolidation should be carried out prudently in remote areas [29]. In The Beijing–Tianjin–Hebei region of China, the agglomeration, scale and synergistic effect of urban agglomeration should be brought into full play: coordinate and improve the relationship between rural people and land, and build an orderly and dense distribution pattern of urban and rural spatial development with reasonable layout and complementary functions [30]. Guangdong Province, China, 1980–2015, the development of rural settlements experienced obvious stages: increase (1980–2000); Stability (2000–2005); Decline (2000–2010); And increase (2010–2015) [31]. In Pengshui County, Chongqing, China, rural settlements are “living fossils” of economic society, with spatial dispersion and slow change [32]. In Fangxian County, Hubei Province, China, building a transformation path with strong feasibility of village-scale rural residential land consolidation potential in alpine areas is conducive to improving the conversion rate of high-quality cultivated land consolidation [33]. In Shanyang County, Shaanxi Province, China, most of the areas with high consolidation potential are located in areas with flat terrain, convenient transportation, close to the central city and good social and economic development [34]. In Xundian Hui and Yi Autonomous County, Yunnan Province, China, the overall scale of rural settlements expanded significantly, the landscape shape tended to be regular, and the average patch size increased. The characteristics of agglomeration to areas with superior terrain conditions are increasingly obvious [35]. Xichang, Sichuan, China, has a high degree of fragmentation of rural settlements, and the number of micro and small rural settlements accounts for 94.8% of the total number [36]. In Zhuxi County, Qinling-Bashan Mountains, China, the actual potential of rural settlements is 904.63 ha, only 65.42% of the traditional potential [37]. In Fanjing Mountain area, Guizhou, China, residential areas are scattered in mountain valleys along road branches and rivers [38]. In Sichuan Basin, China, rural settlement dispersion is positively correlated with pedigree diversity and tillage rate [39]. In Qinghai Province, China, the morphological structure of rural settlements is characterized by obvious geographical agglomeration and gradient change, as well as national characteristics, showing a regular change from farming town to farming and animal husbandry town and then to animal husbandry town, and finally becoming pastoral city [40]. In Qiantang Town, Chongqing, China, the policy of “balance between increase and decrease” was adopted. Centralized resettlement in rural areas led to significant spatial and social restructuring, strengthened the village and town hierarchy system, and expanded the social network of immigrants [41]. In The Beijing-Tianjin-Hebei region of China, rural settlements are transferred to urban land within the original rural settlements [42]. In Chongqing, China, centralized rural resettlement helps to alleviate the conflict between rural recession and people-oriented urbanization needs [43]. In Beijing, China, the rural settlements tend to be more complex and diversified from exurbs to rural–urban fringe areas; There is a physical decline pattern in the outer suburbs, which leads to the hollowing out of rural industries and population [44]. In Huishan, Wuxi, China, in the past 20 years or so, the rural settlements have expanded and contracted in recent years, leading to the gradual reduction of the total scale of land use [45]. In Shandong Province, China, the multi-functional hierarchical structure of rural settlements is mainly middle–low grade, presenting four spatial distribution patterns of “gradient”, “point domain” and “band” [46]. The spatial distribution of rural settlements in China has several types, such as aggregation distribution, random distribution and uniform discrete distribution, with significant regional differences. In the hilly and mountainous transition zone, the density of rural settlements is high, and the spatial distribution pattern is mainly random [47].
The existing research mainly focuses on the distribution characteristics, change process and driving factors of rural settlements in mountainous areas. Other scholars have also studied rural-urban migration from the perspective of sustainable smart cities [48,49]. Because the rural settlements in mountainous areas are spatially dispersed and change slowly, it is difficult to study from the time section. The reclamation projects promoted by a series of policies such as poverty alleviation and rural revitalization policies in China have led to the rapid extinction of rural settlements, which provides a new perspective and opportunity to observe and study the evolution law of rural settlements in mountainous areas. From the principles of case study credibility and generalization [50], this paper chooses a typical mountain, Chongqing China, based on reclamation (both for the rural settlements reclamation) project data between 2017 and 2021, in districts and counties as evaluation units, by using the coefficient of variation, the center of gravity model and spatial auto-correlation method, quantitative analysis of reclamation projects in the distribution characteristics of different spatial scales, shift and spatial pattern evolution characteristics.
2. Case Study
2.1. Overview of Research Region
Pengshui County is located in the southeast of Chongqing, China, in the lower reaches of Wujiang River, a tributary of the Yangtze River, between 07°48′–108°35′ E, 28°57′–29°50′ N. Chongqing is located in southwest China and the upper reaches of the Yangtze River, between 105°17′–110°11′ E, 28°10′–32°13′ N; it is 470 km long from east to west and 250 km wide from north to south, and covers an area of 82,400 square kilometers with jurisdiction over 38 districts and counties (26 districts, 8 counties and 4 autonomous counties). In 2021, the GDP of Chongqing reached CNY 2789.40 billion, with the per capita GDP reaching CNY 86,879, slightly higher than China’s per capita GDP of CNY 80,976 and higher than the world’s per capita GDP level. By the end of 2021, Chongqing had 32.12 million permanent residents, an increase of 350,000 over the previous year. Among them, the urban population was 22,591,300, accounting for 70.32% of the permanent population, an increase of 0.86 percentage points over the previous year. The annual population outside the city was 4,125,600, and the migrant population outside the city was 2,227,700, with a net outflow of population. The population is dominated by the Han nationality, and the ethnic minorities are mainly Tujia and Miao. The landform is mainly hilly and mountain, of which mountain accounts for 76%. The Yangtze River runs 691 km across the country and joins the Jialing and Wujiang rivers. Chongqing is a subtropical humid monsoon climate, rich in climate resources, three-dimensional climate is obvious, with early spring hot summer, autumn rain warm winter, abundant precipitation, humid air, rain and heat season, frequent disasters, as well as less sunshine, low wind speed, cloudy characteristics. The annual average temperature of the city is 17.5 °C, the annual average rainfall is 1125.3 mm, and the annual average sunshine duration is 1154.4 h, making it one of the areas with the least sunshine in China. Chongqing is a large city, a largely rural area, a large mountain area, and a large reservoir area. A coordinated development pattern of “one district and two groups” was formed, which consisted of the city proper of Chongqing, the city cluster of Three Gorges reservoir area in northeast Chongqing, and the city cluster of Wuling Mountain area in Southeast Chongqing (Figure 1) [2].
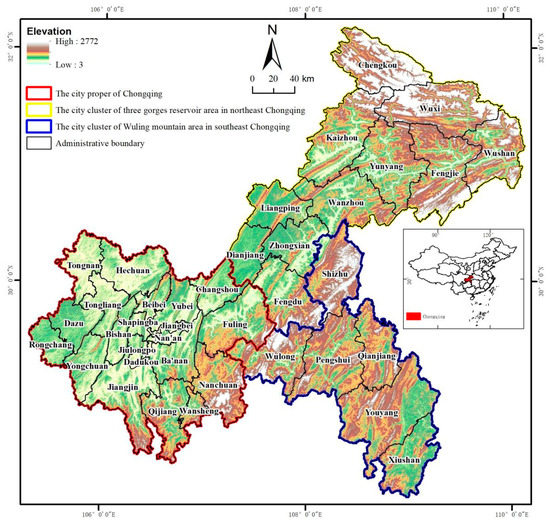
Figure 1.
Administrative division map of Chongqing Municipality, China.
2.2. Data Source and Processing
The data in this paper were obtained from the final data after the completion and acceptance of rural settlement reclamation projects in Chongqing from 2017 to 2021 by Chongqing Land Consolidation Center. By 31 December 2021, 4932 reclamation projects had been accepted. In order to facilitate spatial calculation, five districts (Yuzhong district, Jiangbei District, Nan’an District, Dadukou District and Jiulongpo District) without reclamation projects are deducted from the 38 districts (counties) of Chongqing administrative divisions in 2021, and the remaining 33 districts and counties are taken as research units. After sorting, the attribute database was established based on the statistical data of reclamation projects in 33 districts and counties from 2017 to 2021. The construction scale and newly increased cultivated land of reclamation projects were selected as the basic index parameters, and the number of projects was selected as the index reflecting the frequency of reclamation projects in each district and county. Other data are from Chongqing Statistical Yearbook from 2017 to 2021 [51].
3. Research Methods
3.1. Gravity Center Model Method
The gravity center of a reclamation project means that a large project area is composed of project subareas, and the gravity center of a certain attribute of a large project area is calculated by the attribute and geographical coordinates of each project subarea, and some attribute is analogous to the weight of an object in the physical sense. is the geographic coordinates of the center of gravity of subarea I of the project, and is the quantified value of certain attribute of this subarea of the project. Then the formula for calculating the geographic coordinates of the center of gravity point of this attribute in the large project area is:
Obviously, when the attribute value changes, the center of gravity of the attribute in the large project area will also move. When the geometric center of the region overlaps with the center of gravity of the attribute, it means that the attribute of the region develops evenly. When the center of gravity of the regional attribute is significantly different from the geometric center of the region, it indicates the unbalanced distribution of this attribute in the project area, or “center of gravity deviation”. Deviation direction indicates the development direction and key areas of land reclamation projects, and deviation distance indicates the degree of equilibrium [52,53].
In order to quantitatively analyze the degree of equilibrium, the gravity center offset distance is calculated as through the spatial distance calculation formula, which represents the gravity center offset magnitude [54]. The barycentric coordinates of are and respectively for two consecutive years, then:
where, is a constant ( = 111.11), and is the conversion coefficient of the longitude and latitude coordinates of the Earth’s surface to the plane distance.
3.2. Spatial Autocorrelation
Spatial autocorrelation is a spatial statistical analysis method, which is commonly used to measure the diffusion benefits and agglomeration characteristics of indicators such as economy and urbanization level in different spatial locations of a region [55]; it is usually divided into global spatial autocorrelation and local spatial autocorrelation. The global spatial autocorrelation coefficient is used to judge the overall correlation degree of a certain attribute observation value in the research area, which can judge whether the value of the spatial variable is related to the adjacent space. The most commonly used index to study global spatial autocorrelation is Moran’s I. The local spatial correlation index is a parameter used to study the specific location of spatial aggregation in the same research area and determine the similarity degree of adjacent units; it can be used to identify “hot spots” and check the heterogeneity of data. Commonly used indicators are Local Moran’s I (Local indicators of Spatial Association, LISA). The calculation of spatial autocorrelation is to construct a spatial weight matrix first, then calculate its value and judge the degree of aggregation of its attributes. The calculation formula is as follows:
Formula: is Moran’s I index; is Local Moran’s I index; is the number of research units; and are the attribute values of spatial units and , respectively. is the value of the space weight matrix obtained according to the adjacency criterion. If the two space elements have a common boundary, the space weight is 1, otherwise 0.
4. Results
4.1. Spatiotemporal Distribution of Reclamation Projects
4.1.1. Overall Distribution Characteristics of Reclamation Projects Based on Time Dimension
In terms of time scale, the number of reclamation projects in Chongqing increased first and then decreased, reaching the peak in 2020 and approaching the sum of the preceding two years (Table 1). The scale of reclamation project construction and the scale of newly increased cultivated land have similar rules. The above rules are highly related to the reclamation of rural settlements as an important measure to promote poverty alleviation and build beautiful countryside. The end of 2020 is the crucial point, where poverty reclamation finally projects all the index peaked [56].

Table 1.
Statistics of land reclamation projects for each year from 2017 to 2021 in Chongqing, China.
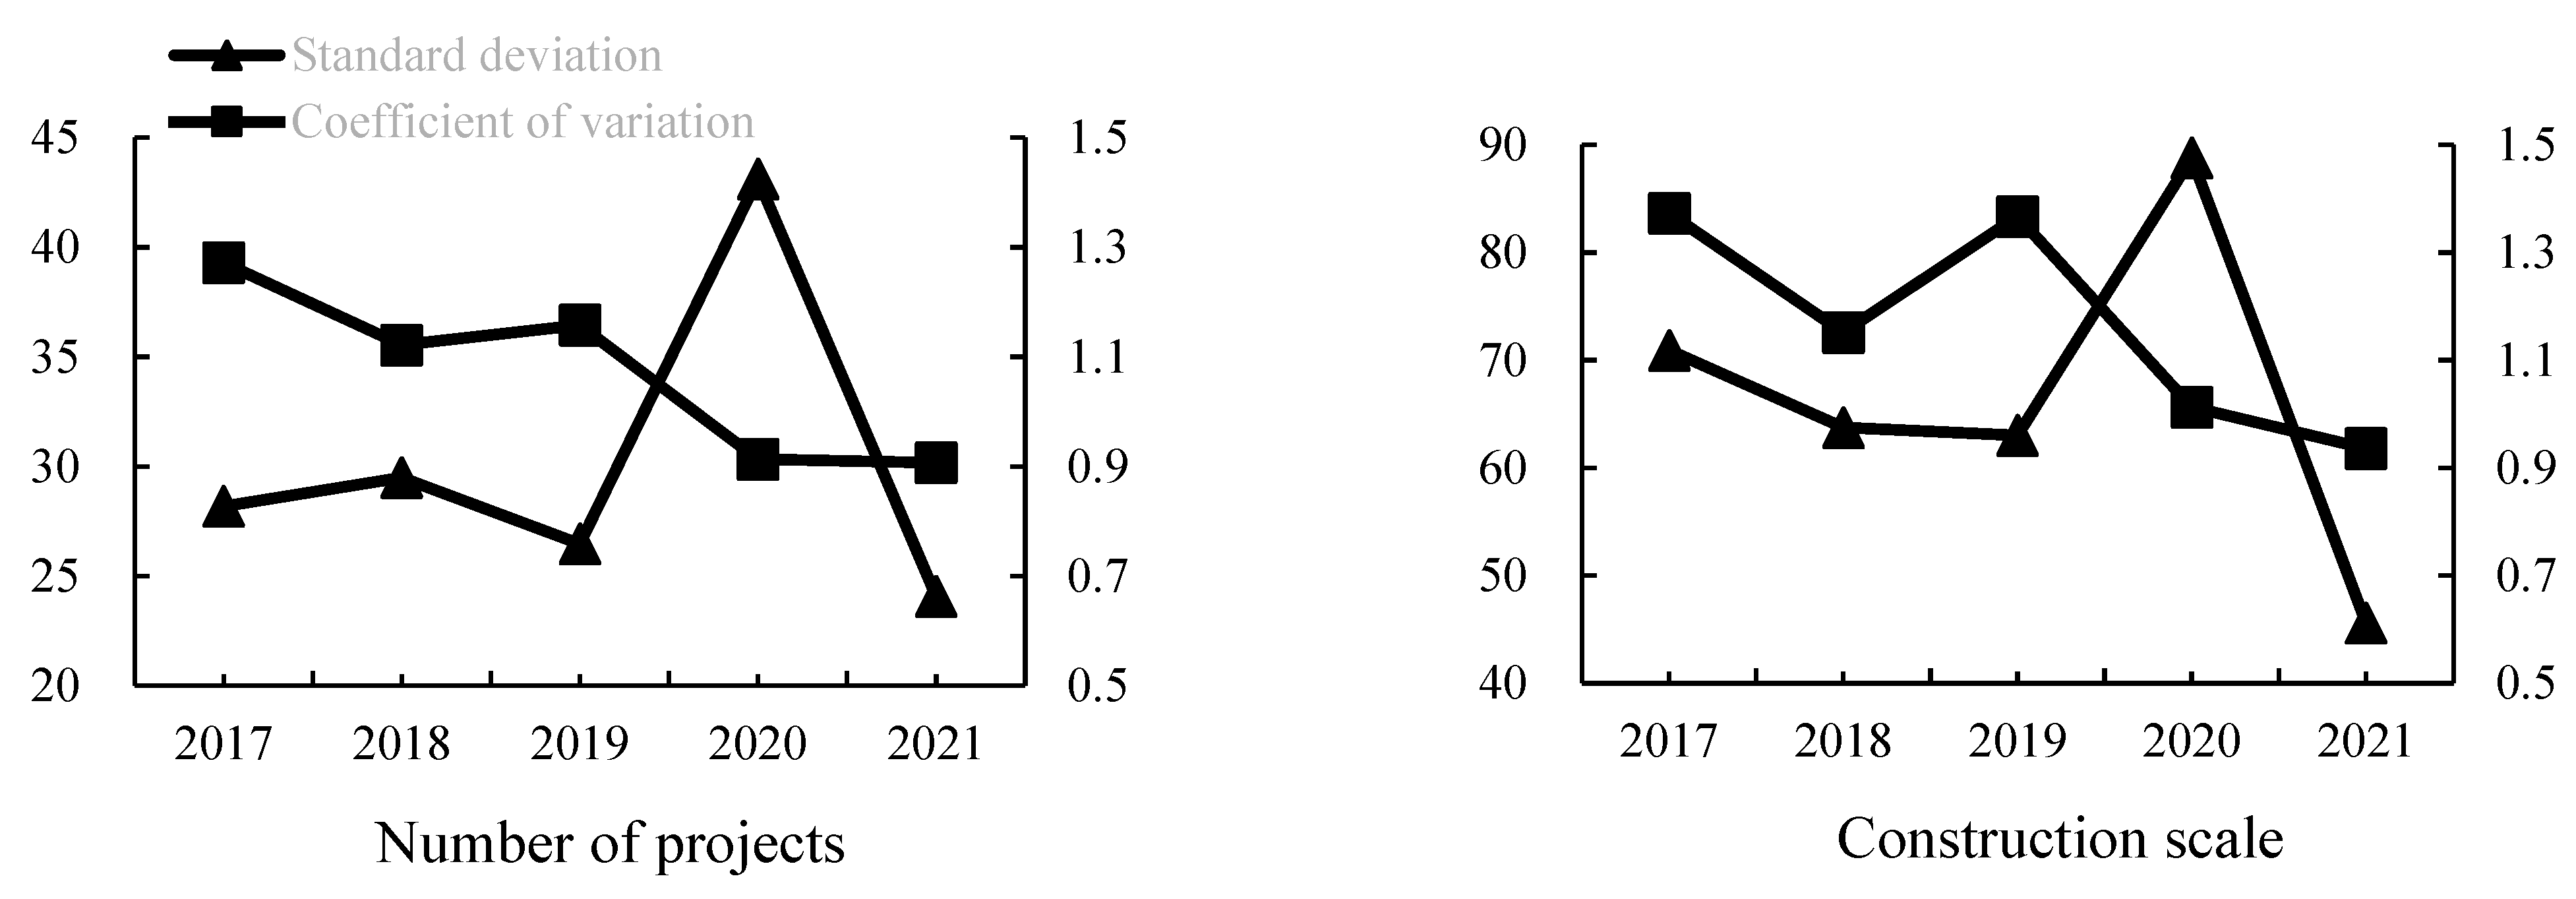
Using the formula of standard deviation index and coefficient of variation , and of statistical data of the number of reclamation projects and construction scale in each district and county from 2017 to 2021 are obtained, respectively (Figure 2).
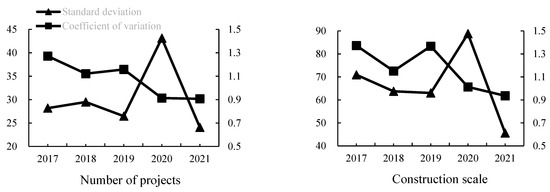
Figure 2.
Standard deviations and coefficients of variation of statistics indexes of land reclamation projects from 2017 to 2021 in Chongqing, China.
- (1)
- On the whole, the standard deviation index () of the number of projects and construction scale shows a wave decreasing trend, indicating that the absolute scale difference of reclamation projects in different districts and counties is gradually decreasing. The coefficient of variation () of the number of projects and construction scale decreased year by year, indicating that the differences in the relative scale of reclamation projects in different districts and counties showed a decreasing trend.
- (2)
- According to the comparison and analysis of each index, the variation rules of the standard deviation index and coefficient of variation of the number of projects and construction scale have a certain degree of synchronization, indicating that there is a strong correlation between them. In 2020, the standard deviation index () of the number of projects and construction scale has a sudden change, instead of decreasing, it increased. As mentioned above, the reclamation of rural settlements in mountainous areas is highly relevant to poverty alleviation. In 2021, the number of projects and standard deviation index of the construction scale returned to a decreasing trend year by year and further decreased.
4.1.2. Overall Distribution Characteristics of Reclamation Projects Based on Spatial Dimensions
- (1)
- From the regional scale, there are obvious regional differences in reclamation projects in Chongqing, China from 2017 to 2021. In terms of the number of projects, the projects are mainly distributed in the three Gorges reservoir area town clusters in the northeast of Chongqing, accounting for 51.87% of the total land reclamation projects in Chongqing. The urban area of the main city and the city cluster project of Wuling Mountain area in southeast Chongqing only accounted for 25.79% and 22.34% of the total project amount, respectively (Figure 3a). In terms of project construction scale, the projects are mainly distributed in the three Gorges reservoir area town clusters in the northeast of Chongqing, accounting for 55.13% of the total land reclamation projects in Chongqing. The urban area of the main city and the city cluster project of the Wuling Mountain area in Southeast Chongqing only accounted for 23.33% and 21.64% of the total project amount respectively (Figure 4a); it is consistent with the research conclusion of “Analysis on the pattern changes and characteristics of rural settlements in the Three Gorges Reservoir Area in the past 30 years” by Zhou Wei et al., that is, the compact degree of rural settlements is relatively low, and the potential for intensive utilization is large [57].
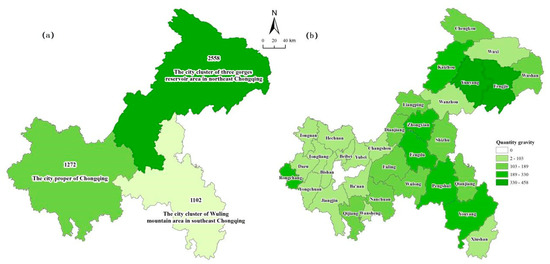 Figure 3. Spatial distributions of the number of reclamation projects on city spatial structure (a) and on county level (b) in Chongqing Municipality from 2017 to 2021.
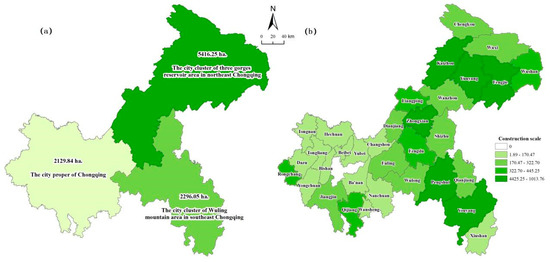 Figure 4. Spatial distributions of the construction scale of reclamation projects on city spatial structure (a) and on county level (b) in Chongqing Municipality from 2017 to 2021.
 - (2)
- From the perspective of district and county scale, the reclamation projects in Chongqing, China from 2017 to 2021 also show obvious regional differences. In terms of the number of projects, the number of reclamation projects is the largest in Fengjie County (458), followed by Yunyang County (330), Pengshui (305), and Wansheng District (32), with an average value (about 165) (Figure 3b). In terms of construction scale, the largest number of reclamation projects is Fengjie County (1013.76 ha), followed by Yunyang County (820.95 ha), Youyang County (665.04 ha) and Beibei District (1.89 ha), with an average of 298.25 ha (Figure 4b); it is consistent with the research conclusion of Chen Mengmeng et al. on “The impact of spatial distribution characteristics and natural background of rural settlements in the hinterland of the Three Gorges Reservoir Area—Taking Fengjie County as an example”, that is, rural settlements are dispersed and have great reclamation potential [58].
4.2. Movement Track of Gravity Center of Reclamation Project
In recent years, some scholars have also applied the gravity center model in land consolidation to conduct a spatial–temporal analysis of project investment [59]; this paper mainly studies the “input and output” index, and studies the gravity center movement trajectory of the reclamation project with Arc GIS 10.2 software(ERSI, Redlands, CA, USA).
4.2.1. Moving the Center of Gravity of Reclamation Project Number
According to the overall movement trend of the number of reclamation projects from 2017 to 2021 (Figure 5), the center of gravity fluctuates in the east-west direction. In terms of the direction and distance of barycenter movement, the number of projects in 2017–2018 shifted to the northeast with a distance of 57 km. During 2018–2019 and 2019–2020, the number of projects shifted from north to south, and the moving distance was 47 km and 43 km, respectively. From 2020 to 2021, the center of gravity of projects will shift to the northwest with a distance of 24 km. Compared with the convergence of the reference points, this indicates that the overall balance of the spatial distribution of reclamation projects in Chongqing has been improved, and the reclamation areas and directions are increasingly stable and clear.
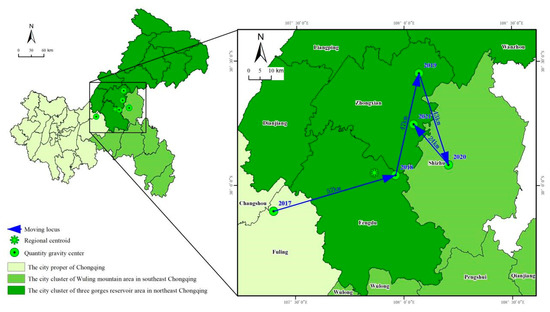
Figure 5.
Moving locus of quantity gravity center of reclamation projects from 2017 to 2021 in Chongqing, China.
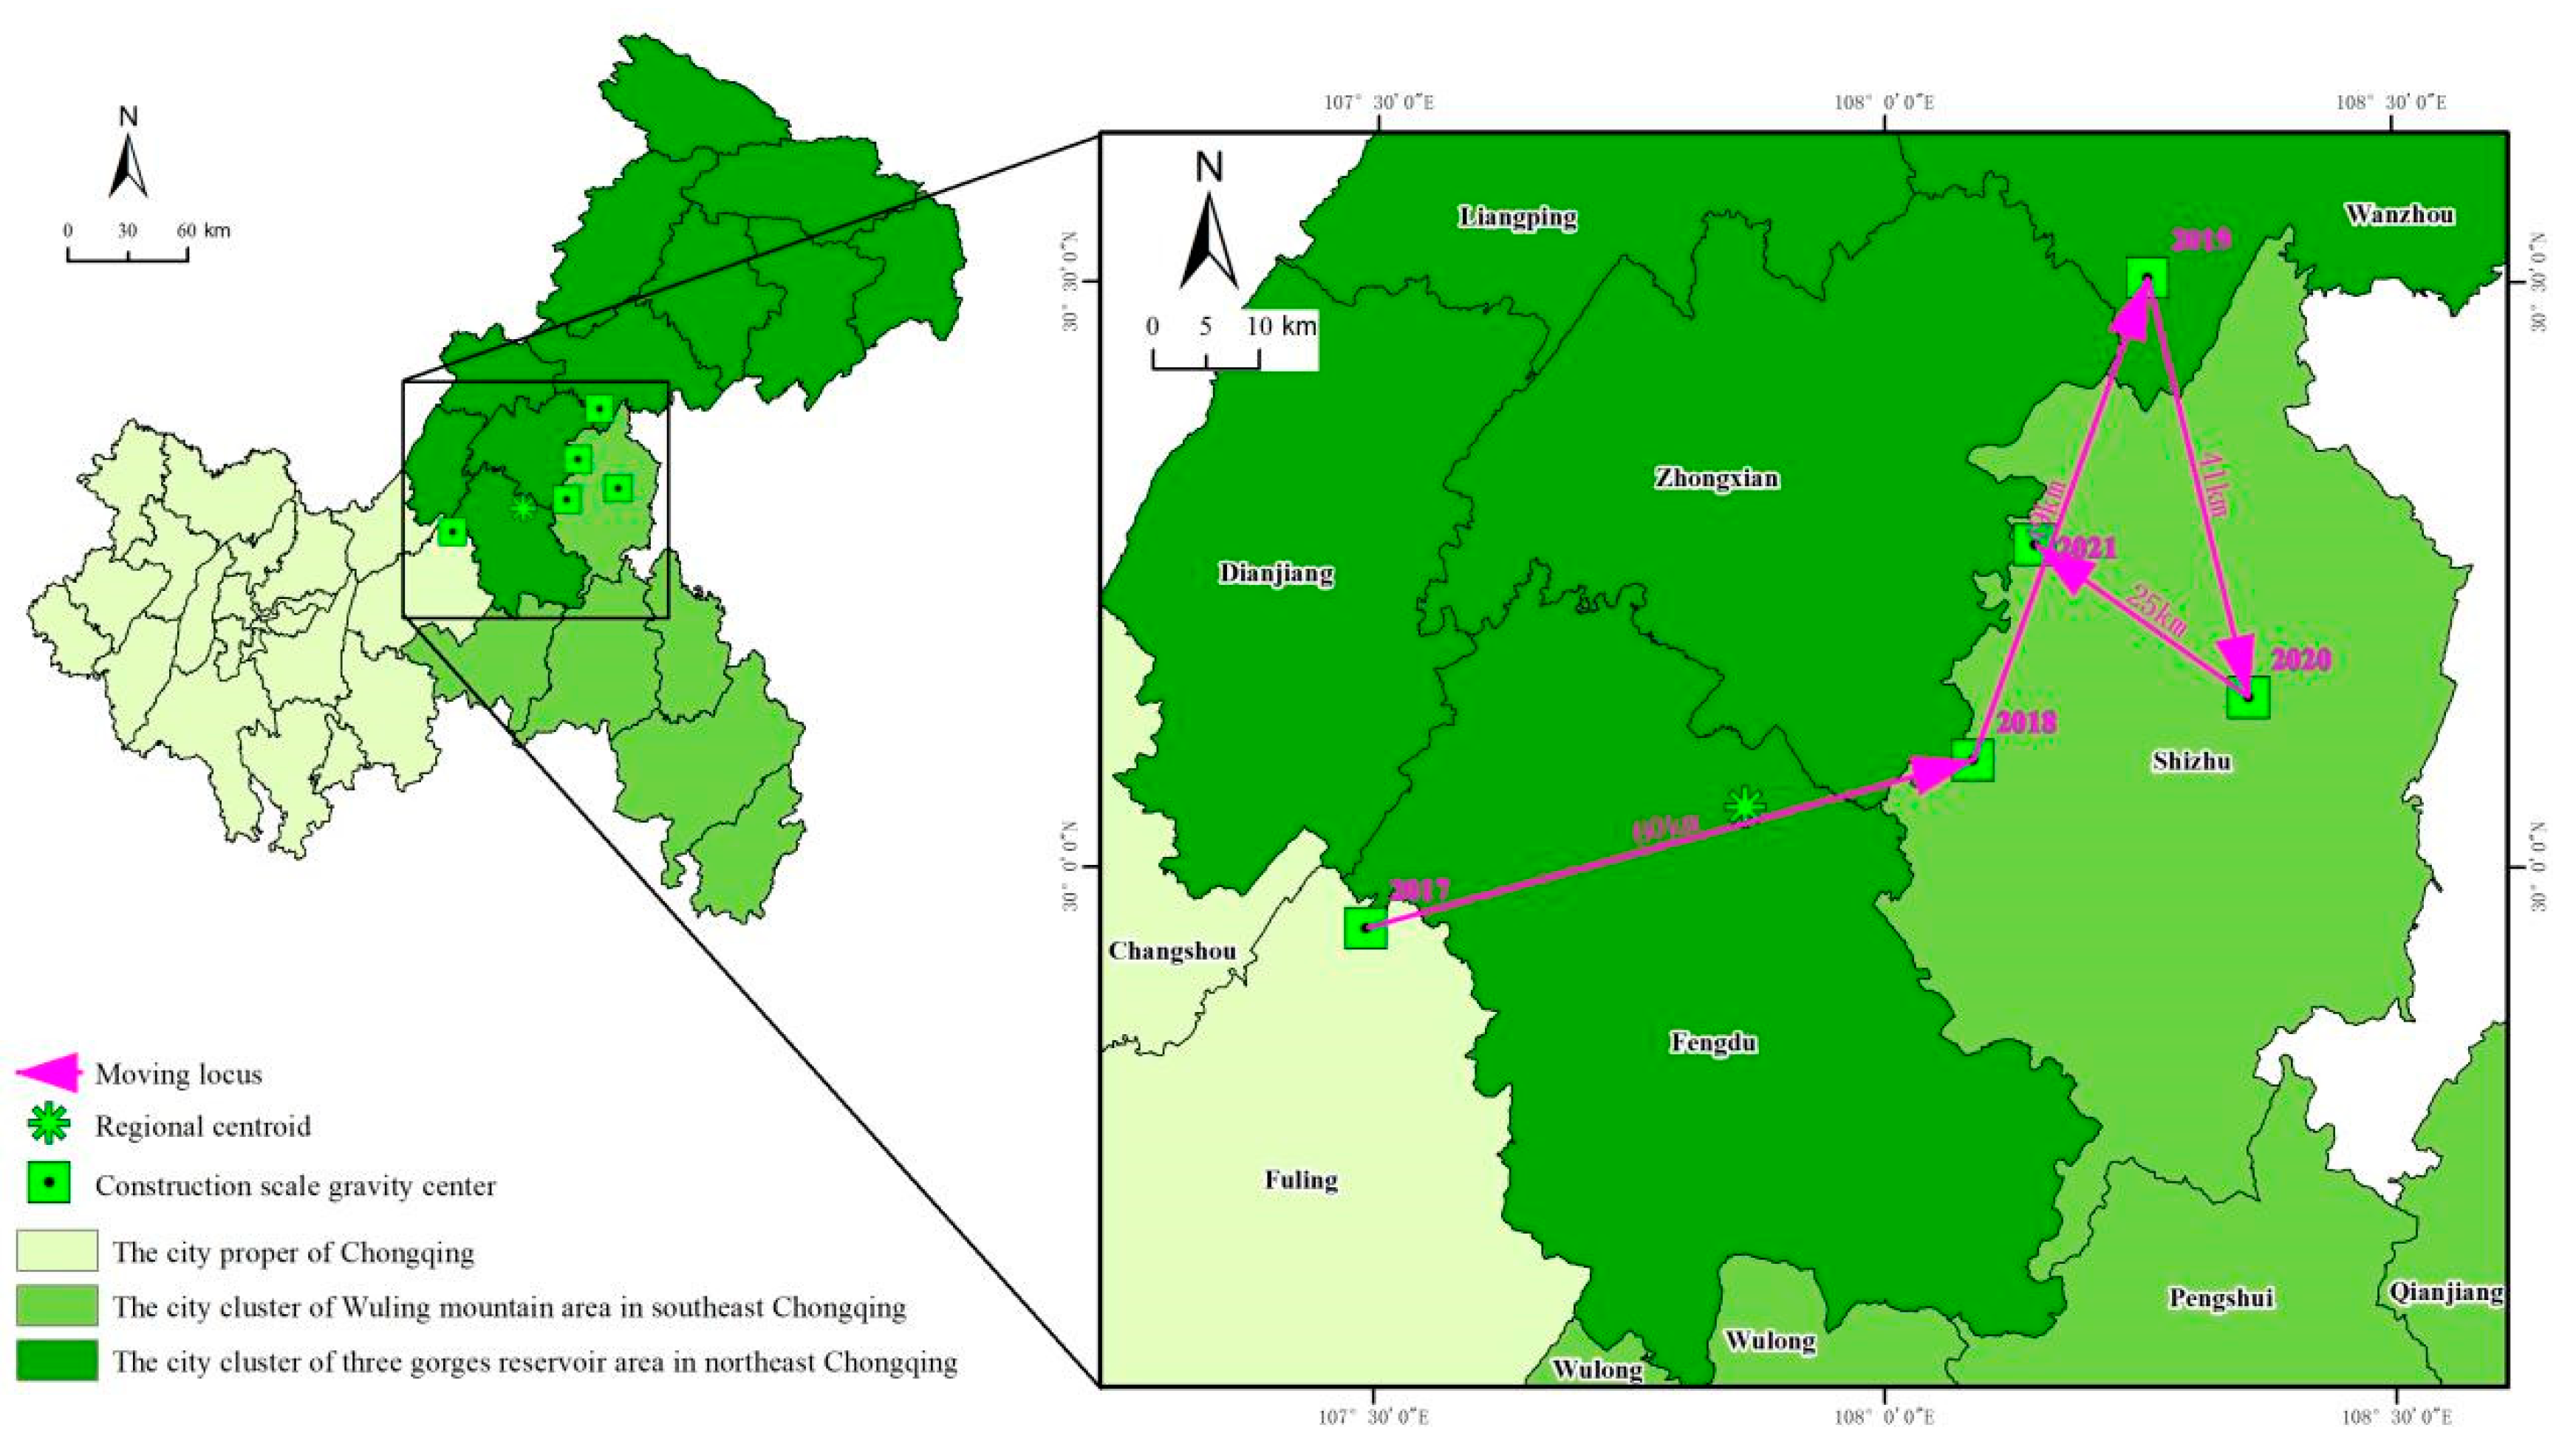
4.2.2. Moving the Center of Gravity of Reclamation Project Construction Scale
From the perspective of the overall movement trend of the center of gravity of reclamation project construction scale from 2017 to 2021 (Figure 6), it fluctuates in the east-west direction. In terms of moving direction and distance, the center of gravity of the project construction scale shifted to the northeast from 2017 to 2018, with a moving distance of 60 km. In 2018–2019 and 2019–2020, the center of gravity of project construction scale shifted from the north to the south, and the moving distance was 49 km and 41 km, respectively. In 2020–2021, the center of gravity of the project construction scale will shift to the northwest, and the moving distance will be 25 km. Compared with the convergence of the reference points, this indicates that the overall balance of the spatial distribution of reclamation projects in Chongqing has been improved, and the reclamation areas and directions are increasingly stable and clear.

Figure 6.
Moving locus of construction scale gravity center of land reclamation projects during 2017 to 2021 in Chongqing, China.
4.2.3. Moving the Center of Gravity of Scale of Newly Added Farmland of Reclamation Project
According to the overall moving trend of the gravity center of the scale of newly added cultivated land of reclamation projects from 2017 to 2021 (Figure 7), it fluctuates in the east–west direction. The moving direction and distance of the gravity center are similar to the number of reclamation projects and construction scale.

Figure 7.
Moving locus of Newly increased cultivated land gravity center of land reclamation projects from 2017 to 2021 in Chongqing, China.
4.3. Spatial Correlation Analysis of Reclamation Projects
4.3.1. Characteristics of Global Agglomeration
Geo DA is a commonly used software to calculate spatial autocorrelation coefficient. In this paper, Geo DA is used to calculate Moran’s I (Table 2) of the total “input” and “output” levels of each district and county in Chongqing, China in five years, and the calculated results all pass the Z test. The results show that the distribution of reclamation projects at the county scale has a relatively significant agglomeration, which is consistent with the spatial distribution of reclamation projects at the county level shown in Figure 4 and Figure 5. At the same time, the positive correlation effect of the construction scale is higher than that of the other two indicators, and the distribution of the two variables of construction scale and newly added cultivated land also presents a significant positive correlation.
Table 2.
Global Moran’s I of land reclamation projects in Chongqing, China.
4.3.2. Spatial Heterogeneity Analysis
The most important aspect of spatial correlation analysis is to find the location of spatial aggregation points or sub-regions. LISA cluster map generated by local autocorrelation analysis can well indicate the spatial correlation degree of each region with the surrounding region. The combination of Geo DA software and Arc GIS software was used to generate a LISA aggregation map to visualize the spatial heterogeneity of “input” and “output” of reclamation projects at the district and county scale (Figure 8). In the figure, “high-high” indicates that the index values of “input” and “output” of reclamation projects in the district and surrounding counties are both high, and the sub-area composed of adjacent districts and counties is commonly referred to as the hotspot area. “Low-low” represents the blind spot area, which is opposite to “high-high”. All research units falling into these two areas have a strong spatial positive correlation, that is, homogeneity. “High-low” indicates that the index values of “input” and “output” of reclamation in the district and county are higher, while those in surrounding counties are lower. “Low-high” means that the index values of “input” and “output” of the reclamation project in the district and county are low, while the index values of the surrounding county are high. The units falling into these two areas indicate that there is a strong spatial negative correlation, that is, heterogeneity. Analysis shows that:
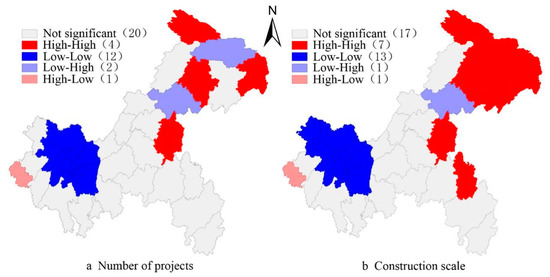
Figure 8.
LISA cluster maps of land reclamation projects in Chongqing, China during 2017–2021.
- (1)
- Overall, between 2017 and 2021, the index of land reclamation project in Chongqing, China LISA gathered diagram represents the characteristics of landscape and the rural settlements reclamation potential is basically consistent, but and the population distribution has a certain difference. Liu Yan et al., in “A Study on the Coupling Relationship between rural residential land and rural population Change in Chongqing”, concluded that the population decrease and land increase were mainly distributed in northeast Chongqing, which was different from this study [60]. Investigate its reason, this research mainly studies the rural settlement reclamation die cut, did not consider nearby concentration increased.
- (2)
- From the location of the agglomeration, the number of reclamation projects and the scale of construction shows different agglomeration characteristics. The high-high area of the number of reclamation projects did not show obvious agglomeration characteristics in Northeast Chongqing three Gorges Reservoir area. The high-elevation areas of the reclamation project construction scale showed obvious agglomeration characteristics in the city clusters of the three Gorges reservoir area in northeast Chongqing and the city clusters of the Wuling mountain area in southeast Chongqing, especially in the city clusters of the three Gorges reservoir area in northeast Chongqing.
- (3)
- According to the number of districts and counties of various types of agglomerations, it is revealed that the hot areas and counties for reclamation in Chongqing from 2017 to 2021 are mainly Fengjie County, Yunyang County, Wushan County, Shizhu County, northeast Chongqing Three Gorges Reservoir Area town group, and Southeast Chongqing Wuling mountain area town group Qianjiang area. The number of items was 4 in high-high area and 12 in low-low areas. There are 7 high-high areas and 13 low-low areas in the construction scale.
5. Discussion
- (1)
- The reclamation and extinction of rural settlements in mountainous areas decreased year by year. By the end of 2021, China’s urbanization rate had reached 64.7%, Chongqing’s urbanization rate reached 70.32%, a large rural population in the city, rural hollowing out serious [61]. Although rural settlements in mountainous areas have a long history and change slowly, the number of reclamation projects and construction scale are decreasing year by year due to the trend of only decreasing but not increasing.
- (2)
- The reclamation, extinction and migration of rural settlements in mountainous areas are consistent. Population migration from rural to urban areas is caused by urbanization. Rural settlements, as the carrier of production and living space in mountainous areas, will gradually disappear and be reclaimed if they are close to cities and towns and gather with urbanization, while those far away from urban economic centers will gradually disappear and be reclaimed. The farther away from the urban center, the compactness of rural settlements is relatively lower and the reclamation potential is larger [57,58]. The coordinated coupling of rural residential land and rural population is an inevitable trend. In “Micro-scale Study on rural hollowing Degree under different terrain Conditions”, Meng Qingxiang et al. concluded that the rural hollowing rate in mountainous areas was the highest, followed by hills and plains, which were 49.33%, 31.23% and 21.99%, respectively [61]; this is consistent with the law that the number of reclamation projects and the scale of construction are mainly concentrated in the less developed city clusters of the Three Gorges Reservoir area in northeast Chongqing, far away from the urban center.
- (3)
- Policy factors are the main driving force to reduce the reclamation and extinction of rural settlements in mountainous areas of China. In this paper, the number of reclamation projects and the standard deviation index S of the construction scale in 2020 have a mutation, which is not decreasing but increasing, which is highly related to the reclamation of rural settlements as an important measure to complete poverty alleviation. Driven by land policies, the economic benefits generated by the transaction of indicators such as the acquisition of new land for land expansion by rural settlements reclamation and the linkage between the increase and decrease of urban and rural construction land are the main driving force to stimulate the reclamation of scattered rural settlements in economically underdeveloped mountainous areas [62].
6. Conclusions
The “time compression” produced by policy factors becomes an opportunity to observe and study the evolution law of rural settlements in mountainous areas. Before 1662, China’s population had many population cycles, but the maximum population did not exceed 200 million [63]. As an important factor restricting the location of rural settlements in mountainous areas, cultivated land is associated with it [32]. A series of land policies promote the rapid extinction of rural settlements reclamation in mountainous areas; The more remote the location and the more complex the terrain, the faster the rural settlements will die out. Although the reclamation of rural settlements in mountainous areas can directly increase the cultivated land, it may also lead to a sharp reduction of cultivated land due to its associated relationship with cultivated land. Therefore, a prudent attitude should be taken when dealing with the reclamation of rural settlements in mountainous areas [29]. In this case study, rural settlements in the city cluster of the Three Gorges reservoir area in northeast Chongqing are rapidly disappearing, which should be paid more attention to. At the same time, the reclamation of rural settlements in the city cluster of Wuling Mountain area in southeast Chongqing and the city proper of Chongqing should be carried out appropriately to comprehensively optimize the spatial pattern of rural settlements; this paper only studies from the perspective of the extinction of rural settlements. In order to more comprehensively quantify the evolution law of rural settlements in mountainous areas, the next step is to conduct in-depth research from the perspective of the transfer to cities, nearby towns, and rural agglomeration points.
Author Contributions
Conceptualization, B.W. and G.L.; methodology, G.L.; software, B.W.; validation, G.L., R.L. and D.L.; formal analysis, R.L.; investigation, G.L.; resources, B.W.; data curation, R.L.; writing—original draft preparation, R.L.; writing—review and editing, G.L. and B.L.; visualization, B.W.; supervision, D.L.; project administration, D.L.; funding acquisition, B.L. All authors have read and agreed to the published version of the manuscript.
Funding
This research was funded by National Social Science Foundation of China “Study on the Effect evaluation and Promotion Strategy of Relocation for Poverty Alleviation in Southwest Minority Areas” (20BMZ148).
Institutional Review Board Statement
Not applicable.
Informed Consent Statement
Not applicable.
Data Availability Statement
Restrictions apply to the availability of these data. Data was obtained from Chongqing Land Consolidation Center and are available from the authors with the permission of Chongqing Land Consolidation Center.
Acknowledgments
The authors would like to thank the anonymous reviewers for their comments and suggestions which contributed to the further improvement of this paper.
Conflicts of Interest
The authors have declared no conflict of interest.
References
- The State Council of the People’s Republic of China. Available online: http://www.gov.cn (accessed on 20 June 2022).
- Chongqing Municipal People’s Government, China. Available online: http://www.cq.gov.cn/ (accessed on 20 June 2022).
- Qu, Y.; Wei, S.; Shang, R.; Zheng, J. Spatial pattern recognition of rural settlements based on “point-surface” feature. Resour. Sci. 2019, 41, 1035–1047. (In Chinese) [Google Scholar]
- Chen, G.; Fang, Y.; Chen, Y.; Shen, M.; Yang, D.; Wang, Q.; Liu, S.; Gao, Y. China Mountain Development Report—Study on Mountain Settlements in China; The Commercial Press: Beijing, China, 2007. (In Chinese) [Google Scholar]
- Gelabert, P.J.; Rodrigues, M.; Vidal-Macua, J.J.; Ameztegui, A.; Vega-Garcia, C. Spatially explicit modeling of the probability of land abandonment in the Spanish Pyrenees. Landsc. Urban Plan. 2022, 226, 104487. [Google Scholar] [CrossRef]
- Feged-Rivadeneira, A.; Andrade-Rivas, F.; González-Casabianca, F.; Escobedo, F.J. Scaling patterns of human diseases and population size in Colombia. Glob. Environ. Chang. 2022, 75, 102546. [Google Scholar] [CrossRef]
- Sulak, B.; Türk, E. Rural dynamics of second home trends in the Eastern Black Sea Region. J. Rural. Stud. 2022, 89, 35–44. [Google Scholar] [CrossRef]
- Katapidi, I. Heritage policy meets community praxis: Widening conservation approaches in the traditional villages of central Greece. J. Rural Stud. 2021, 81, 47–58. [Google Scholar] [CrossRef]
- Uisso, A.M.; Tanrıvermiş, H. Driving factors and assessment of changes in the use of arable land in Tanzania. Land Use Policy 2021, 104, 105359. [Google Scholar] [CrossRef]
- Khalid, Z.; Meng, X.; Rana, I.A.; ur Rehman, M.; Su, X. Holistic Multidimensional Vulnerability Assessment: An empirical investigation on rural communities of the Hindu Kush Himalayan region, Northern Pakistan. Int. J. Disaster Risk Reduct. 2021, 62, 102413. [Google Scholar] [CrossRef]
- González-Arqueros, M.L.; Manuel, E.M.; Bocco, G.; Castillo, B.S. Flood susceptibility in rural settlements in remote zones: The case of a mountainous basin in the Sierra-Costa region of Michoacán, Mexico. J. Environ. Manag. 2018, 223, 685–693. [Google Scholar] [CrossRef]
- Sevenant, M.; Antrop, M. Settlement models, land use and visibility in rural landscapes: Two case studies in Greece. Landsc. Urban Plan. 2007, 80, 362–374. [Google Scholar] [CrossRef]
- Nepal, S.K. Tourism and rural settlements Nepal’s Annapurna region. Ann. Tour. Res. 2007, 34, 855–875. [Google Scholar] [CrossRef]
- Guo, K.; Huang, Y.; Chen, D. Analysis of the Expansion Characteristics of Rural Settlements Based on Scale Growth Function in Himalayan Region. Land 2022, 11, 450. [Google Scholar] [CrossRef]
- Chen, Z.; Liu, Y.; Feng, W.; Li, Y.; Li, L. Study on spatial tropism distribution of rural settlements in the Loess Hilly and Gully Region based on natural factors and traffic accessibility. J. Rural Stud. 2022, 93, 441–448. [Google Scholar] [CrossRef]
- Shi, Z.; Ma, L.; Zhang, W.; Gong, M. Differentiation and correlation of spatial pattern and multifunction in rural settlements considering topographic gradients: Evidence from Loess Hilly Region, China. J. Environ. Manag. 2022, 315, 115127. [Google Scholar] [CrossRef]
- Ji, Z.; Xu, Y.; Sun, M.; Liu, C.; Lu, L.; Huang, A.; Duan, Y.; Liu, L. Spatiotemporal characteristics and dynamic mechanism of rural settlements based on typical transects: A case study of Zhangjiakou City, China. Habitat Int. 2022, 123, 102545. [Google Scholar] [CrossRef]
- Zhong, J.; Liu, S.; Huang, M.; Cao, S.; Yu, H. Driving Forces for the Spatial Reconstruction of Rural Settlements in Mountainous Areas Based on Structural Equation Models: A Case Study in Western China. Land 2021, 10, 913. [Google Scholar] [CrossRef]
- Li, J.; Lo, K.; Zhang, P.; Guo, M. Reclaiming small to fill large: A novel approach to rural residential land consolidation in China. Land Use Policy 2021, 109, 105706. [Google Scholar] [CrossRef]
- Qu, Y.; Jiang, G.; Ma, W.; Li, Z. How does the rural settlement transition contribute to shaping sustainable rural development? Evidence from Shandong, China. J. Rural Stud. 2021, 82, 279–293. [Google Scholar]
- Yang, D.; Sun, J.; Zhang, Y.; Luo, J.; Zhao, Y.; Zhang, J. Classification of rural residential renovation types based on “production-production-production” function in karst mountainous areas: A case study of Qixingguan District. China Land Sci. 2021, 35, 80–89. (In Chinese) [Google Scholar] [CrossRef]
- Yang, B.; Wang, Z.; Zhang, H.; Tan, L. Characteristics and driving mechanism of spatial pattern evolution of rural settlements in mountainous poverty-stricken areas. Trans. Chin. Soc. Agric. Eng. 2021, 37, 285–293. (In Chinese) [Google Scholar]
- Song, W.; Li, H. Spatial pattern evolution of rural settlements from 1961 to 2030 in Tongzhou District, China. Land Use Policy 2020, 99, 105044. [Google Scholar] [CrossRef]
- Cao, Y.; Li, G.; Cao, Y.; Wang, J.; Fang, X.; Zhou, L.; Liu, Y. Distinct types of restructuring scenarios for rural settlements in a heterogeneous rural landscape: Application of a clustering approach and ecological niche modeling. Habitat Int. 2020, 104, 102248. [Google Scholar] [CrossRef]
- Liang, X.; Li, Y. Identification of spatial coupling between cultivated land functional transformation and settlements in Three Gorges Reservoir Area, China. Habitat Int. 2020, 104, 102236. [Google Scholar] [CrossRef]
- Chen, X.; Xie, W.; Li, H. The spatial evolution process, characteristics and driving factors of traditional villages from the perspective of the cultural ecosystem: A case study of Chengkan Village. Habitat Int. 2020, 104, 102250. [Google Scholar] [CrossRef]
- Huang, Q.; Song, W.; Song, C. Consolidating the layout of rural settlements using system dynamics and the multi-agent system. J. Clean. Prod. 2020, 274, 123150. [Google Scholar] [CrossRef]
- Liu, W.; Radmehr, R.; Zhang, S.; Henneberry, S.R.; Wei, C. Driving mechanism of concentrated rural resettlement in upland areas of Sichuan Basin: A perspective of marketing hierarchy transformation. Land Use Policy 2020, 99, 104879. [Google Scholar] [CrossRef]
- Zhou, J.; Cao, X. What is the policy improvement of China’s land consolidation? Evidence from completed land consolidation projects in Shaanxi Province. Land Use Policy 2020, 99, 104847. [Google Scholar] [CrossRef]
- Wen, Y.; Zhang, Z.; Liang, D.; Xu, Z. Rural Residential Land Transition in the Beijing-Tianjin-Hebei Region: Spatial-Temporal Patterns and Policy Implications. Land Use Policy 2020, 96, 104700. [Google Scholar] [CrossRef]
- Gong, J.; Jian, Y.; Chen, W.; Liu, Y.; Hu, Y. Transitions in rural settlements and implications for rural revitalization in Guangdong Province. J. Rural Stud. 2022, 93, 359–366. [Google Scholar] [CrossRef]
- Luo, G.; Wang, B.; Luo, D.; Wei, C. Spatial Agglomeration Characteristics of Rural Settlements in Poor Mountainous Areas of Southwest China. Sustainability 2020, 12, 1818. [Google Scholar] [CrossRef]
- Zhang, H.; Wang, Z.; Li, Q.; Mo, Q. Study on the calculation of rural residential consolidation potential at village scale in high mountain area. Trans. Chin. Soc. Agric. Eng. 2019, 35, 38–46. (In Chinese) [Google Scholar]
- Kong, M.; Li, T.; Yang, H.; Wang, Z.; Wu, P. Potential and zoning of rural residential consolidation in Qinling-Bashan Mountains under the background of rural revitalization: A case study of Shanyang County, Shaanxi Province. J. Northwest Univ. (Nat. Sci. Ed.) 2019, 49, 781–790. (In Chinese) [Google Scholar]
- Zhang, T.; Zhang, F.; Xie, Z.; Huang, J. Spatial pattern evolution of rural settlements in mountainous areas of ethnic minorities in Yunnan province under the background of targeted poverty alleviation. Trans. Chin. Soc. Agric. Eng. 2019, 35, 246–254. (In Chinese) [Google Scholar]
- Li, X.; Yang, Y.; Yang, B.; Zhao, T.; Yu, Z. Optimization of rural settlements layout in mountainous areas based on farming radius analysis. Trans. Chin. Soc. Agric. Eng. 2018, 34, 267–273. (In Chinese) [Google Scholar]
- Sun, J.; Luo, J.; Kong, X.; Cui, J.; Tian, T. Based on spatial characteristics of the rural residential areas in qinba mountains partition and potential measurement. J. Hum. Geogr. 2017, 32, 80–87+94. (In Chinese) [Google Scholar]
- Lu, D.; Yang, J.; Mao, W.; Yu, Z.; Wang, Z.; Bai, B. Spatial distribution and reconstruction of rural settlements in mountainous areas. Resour. Environ. Yangtze Basin 2017, 26, 238–246. (In Chinese) [Google Scholar]
- Liu, W.; Henneberry, S.R.; Ni, J.; Radmehr, R.; Wei, C. Socio-cultural roots of rural settlement dispersion in Sichuan Basin: The perspective of Chinese lineage. Land Use Policy 2019, 88, 104162. [Google Scholar] [CrossRef]
- Li, G.; Jiang, G.; Jiang, C.; Bai, J. Differentiation of spatial morphology of rural settlements from an ethnic cultural perspective on the Northeast Tibetan Plateau, China. Habitat Int. 2018, 79, 1–9. [Google Scholar] [CrossRef]
- Liu, W.; Yang, C.; Liu, Y.; Wei, C.; Yang, X. Impacts of concentrated rural resettlement policy on rural restructuring in upland areas: A case study of Qiantang Town in Chongqing, China. Land Use Policy 2018, 77, 732–744. [Google Scholar] [CrossRef]
- Zhou, T.; Jiang, G.; Zhang, R.; Zheng, Q.; Ma, W.; Zhao, Q.; Li, Y. Addressing the rural in situ urbanization (RISU) in the Beijing–Tianjin–Hebei region: Spatio-temporal pattern and driving mechanism. Cities 2018, 75, 59–71. [Google Scholar] [CrossRef]
- Liu, W.; Yang, X.; Zhong, S.; Sissoko, F.; Wei, C. Can community-based concentration revitalise the upland villages? A case comparison of two villages in Chongqing, Southwestern China. Habitat Int. 2018, 77, 153–166. [Google Scholar] [CrossRef]
- Ma, W.; Jiang, G.; Wang, D.; Li, W.; Guo, H.; Zheng, Q. Rural settlements transition (RST) in a suburban area of metropolis: Internal structure perspectives. Sci. Total Environ. 2018, 615, 672–680. [Google Scholar] [CrossRef] [PubMed]
- Chen, C.; Gao, J.; Chen, J. Institutional changes, land use dynamics, and the transition of rural settlements in suburban China: A case study of Huishan District in Wuxi city. Habitat Int. 2017, 70, 24–33. [Google Scholar] [CrossRef]
- Qu, Y.; Jiang, G.; Zhao, Q.; Ma, W.; Zhang, R.; Yang, Y. Geographic identification, spatial differentiation, and formation mechanism of multifunction of rural settlements: A case study of 804 typical villages in Shandong Province, China. J. Clean. Prod. 2017, 166, 1202–1215. [Google Scholar] [CrossRef]
- Yang, R.; Xu, Q.; Long, H. Spatial distribution characteristics and optimized reconstruction analysis of China’s rural settlements during the process of rapid urbanization. J. Rural. Stud. 2016, 47, 413–424. [Google Scholar] [CrossRef]
- Huovila, A.; Bosch, P.; Airaksinen, M. Comparative analysis of standardized indicators for Smart sustainable cities: What indicators and standards to use and when? Cities 2019, 89, 141–153. [Google Scholar] [CrossRef]
- Antwi-Afari, P.; Owusu-Manu, D.G.; Simons, B.; Debrah, C.; Ghansah, F.A. Sustainability guidelines to attaining smart sustainable cities in developing countries: A Ghanaian context. Sustain. Futures 2021, 3, 100044. [Google Scholar] [CrossRef]
- Yin, R.K. Case Studies. In International Encyclopedia of the Social & Behavioral Sciences, 2nd ed.; Wright, J.D., Ed.; Elsevier: Amsterdam, The Netherlands, 2015; pp. 194–201. [Google Scholar]
- Chongqing Municipal People’s Government Statistics Bureau, China. Available online: http://tjj.cq.gov.cn/ (accessed on 20 June 2022).
- Chen, Z.; Wang, Q.; Huang, X. Movement of urban agglomeration gravity and its driving forces in the Changjiang (Yangtze) Delta of China. Sci. Geogr. Sin. 2007, 27, 457–462. (In Chinese) [Google Scholar]
- Li, X. Visualizing spatial equality of development. Sci. Geogr. Sin. 1999, 3, 63–66. (In Chinese) [Google Scholar]
- Yang, X.; Jin, X.; Guan, X.; Guo, B.; Zhou, Y. The spatial distribution of land consolidation projects in China from 2006 to 2012. Resour. Sci. 2013, 35, 1535–1541. (In Chinese) [Google Scholar]
- Wei, X.; Liu, Y.; Wang, N. Spatial disparity pattern of land consolidation projects in Hubei Province. Trans. CSAE 2014, 30, 195–203. (In Chinese) [Google Scholar]
- He, X. Research on the system of homestead reclamation voucher in Henan Province. Agric. Econ. 2020, 10, 80–83. (In Chinese) [Google Scholar]
- Zhou, W.; Cao, Y.; Wang, J.; Yuan, C. Changes and characteristics of rural settlements in the three gorges reservoir area during the past 30 years. Trans. Chin. Soc. Agric. Eng. 2011, 27, 294–300+401. (In Chinese) [Google Scholar]
- Chen, M.; Li, Y.; Zhou, Y. Spatial distribution characteristics and natural background of rural settlements in the Hinterland of the Three Gorges Reservoir Area: A case study of Fengjie County. Sci. Trop. Agric. 2017, 37, 125–133. (In Chinese) [Google Scholar]
- Yang, J.; Wang, Z.; Xie, F.; Zhang, G. Research on spatial-temporal differentiation and regional zoning of land consolidation project investment in Hubei province. China Land Sci. 2015, 29, 74–81. (In Chinese) [Google Scholar]
- Liu, Y.; Yang, Q.; He, X. Study on coupling relationship between rural residential land and rural population change in Chongqing. Transactions of the Chinese society of agricultural engineering 2019, 35, 266–274. (In Chinese) [Google Scholar]
- Meng, Q.; Wu, T.; Li, W.; Zhang, Q.; Li, Z. Microscale study on the degree of rural hollowing under different topographic conditions. J. Northwest Univ. (Nat. Sci. Ed.) 2022, 52, 656–666. (In Chinese) [Google Scholar]
- Wang, P.; Sun, H.; Fan, S.; Dong, Z.; Cheng, F. Research status and prospect of village reclamation in China. J. China Agric. Univ. 2020, 25, 209–220. (In Chinese) [Google Scholar]
- Nan, X. Analysis on the link between urban and rural residential land reduction based on “capacity matching” of cultivated land. Resour. Ind. 2011, 13, 77–82. (In Chinese) [Google Scholar]


Publisher’s Note: MDPI stays neutral with regard to jurisdictional claims in published maps and institutional affiliations. |
© 2022 by the authors. Licensee MDPI, Basel, Switzerland. This article is an open access article distributed under the terms and conditions of the Creative Commons Attribution (CC BY) license (https://creativecommons.org/licenses/by/4.0/).