Article

More Than Thirty Years of Environmentally Sensitive Area Loss in Wuhan: What Lessons Have We Learned from Urban Containment Policy?

1
School of Public Administration, Hubei University, 368 Friendship Road, Wuhan 430062, China
2
School of Economics and Management, Tianjin Chengjian University, No. 26 Jinjing Road, Xiqing District, Tianjin 300384, China
3
College of Public Administration, Huazhong University of Science & Technology, 1037 Luoyu Road, Wuhan 430074, China
*
Author to whom correspondence should be addressed.
Land 2022, 11(8), 1310; https://doi.org/10.3390/land11081310
Submission received: 22 July 2022 / Revised: 8 August 2022 / Accepted: 12 August 2022 / Published: 14 August 2022

Abstract

:
In an attempt to curb urban land growth and protect environmentally sensitive areas during the urbanization period, urban containment policies in different forms have been implemented over the last three decades at the national and local levels. In this study, we measure the extent of environmentally sensitive area loss in the rural–urban fringe of Wuhan City, where massive urban development has taken place, using 34 years of land use data. Based on this measurement, the effectiveness of the basic farmland zoning policy, which was employed nationwide in the second round of the general land use plan, and a local ecological baseline zoning policy is estimated using three different econometric models. The results indicate that arable land and water bodies are the two main types of environmentally sensitive areas encroached by urban areas. When the spatial dependence was considered, the basic farmland zoning policy is ineffective in shrinking the size of urban land within the boundaries of the basic farmland zone. However, the ecological baseline zoning policy seems to work well for preserving the environmentally sensitive area in the rural–urban fringe area. Several policy implications are offered on the basis of these findings.

1. Introduction

Over the past 30 years, China has experienced unprecedented rapid urbanization, and the urbanization rate by the end of 2015 was approximately 56.1% [1]. One of the most apparent characteristics of China’s urbanization is the so-called land economic-led urbanization, where an enormous amount of semi-natural and natural land has been converted for urban use during the urbanization period. Although a “red line” of 1.8 billion mu (120 million hectares) of arable land was protected by the central government, this area was ultimately reduced due to by urban sprawl [2]. Actually, not only farmland has shrunk, but also other environmentally sensitive areas, such as lakes, wetland, forest, and open space, has witnessed a substantial decrease in some Chinese cities due to urban sprawl [3,4,5,6,7]. Environmentally sensitive areas (EBAs) are landscape elements that play great role in maintaining biodiversity, soil, water, and other natural resources in the long run [8,9]. EBAs could provide ecological, recreational and cultural benefits for human beings, and are vital to human safety, health and welfare both at local and regional levels.
Although excessive urban sprawl directly reduces the amount of environmentally sensitive areas, which are the most important parts of the environment/ecosystem, based on the theory of landscape ecology, non-urban to urban land conversion changes the structure and composition of an environmentally sensitive area, thereby changing its ecological function [10]. Urban sprawl can increase land fragmentation [11,12]. More importantly, with the increasing urban land patches, natural spaces are isolated, and the landscape connectivity, which is of great importance to biodiversity, decreased [13,14]. In addition, its indirect impacts on the social value of environmentally sensitive area have long been realized by economists. For example, in the article “Urban Sprawl: Diagnosis and Remedies”, Brueckner, 2000, argued that one of the market failures of urban sprawl is when natural land is converted for urban use, and the social value of open space is seldom considered [15]. Although the non-urban to urban use conversion of a land parcel is largely dependent on whether it can generate enough economic benefits, the social benefits of environmentally sensitive area, such as entertainment benefit, public health benefit, and aesthetic benefit, are potential benefits that do not show up and cannot be estimated by economists. Land use decisions often ignore the values of ecosystem services, such as recreation, urban green space amenity and maintaining biodiversity [16]. Other negative effects caused by urban sprawl include excess travel and congestion, energy inefficiency and air pollution, and inflated infrastructure and public service costs [17].
Planners and policy makers believe that excessive urban land growth that consumes a large number of environmentally sensitive area is more likely to hurt all urban residents. Therefore, a lot of land use planning instruments/policies have been adopted by both central states and local governments all over the world. These urban containment policies have various names and implementation details, but are similar in that their main function is to curb urban sprawl [18]. A typical type of these policies is urban growth boundary (UGB), which has been used in the US [19,20,21,22,23], Australia [24], Saudi Arabia [25], and Switzerland [26]. Other forms of urban containment policy include green belt, urban service boundary and zoning control [18,27,28]. Likely, to curb urban sprawl, protect the natural environment, and build an environmentally friendly society, the Chinese central government presented the concept of “ecological civilization” for the first time in the five-in-one Plan at the 18th National Congress of the Communist Party of China in 2013, highlighting the sustainable and green development goal in the future. More recently, with respect to the relevant land use strategy, the central government integrated the past land use, urban, and regional plans as a unified plan system and is named as the national territory spatial plan (NTSP) [29]. The NTSP requires all local governments to delineate the baseline of ecological protection, permanent basic farmland, and the urban development boundary. In essence, delineating the urban development boundary (it is also named as urban growth boundary and urban construction boundary) and ecological baseline are typical urban containment policies that have been mandated in the land use planning process in China for a long period [30]. Except for delineating development-limiting boundaries, zoning is another approach used to control and guide spatial development. For example, in the second round of General Land Use Plan (2006–2020), which has been implemented in most cities in China, a city should designate different zones, including permitted construction zone, conditionally permitted construction zone, restricted construction zone, and prohibited zone, based on land use type and land use suitability. Although these national and local urban containment policies were implemented in different forms and have different names, they expressed the same overall goal of steering non-urban to urban land conversion in designated areas and limiting new urban development outside a series of development-limiting boundaries. These local urban containment policies were widely adopted by local governments in China. However, as Yang et al. (2020) pointed out in their literature review, as of 2020, most case studies in China focused on the technical aspects of the boundary delineation or management issue related to policy implementation, with few of them considering the effect of these policies on land use dynamics [30]. They even conducted a more accurate literature search and statistics and reported that:
“Of the 49 articles we reviewed, only three articles discuss policy effectiveness. Similarly, the Chinese literature also lacks policy evaluation research.”
(p.30)
Although these urban containment policies have been in place for many years, a straightforward scientific debate and an area of interest for both scholars and policy makers here is whether these policies are effective for achieving their original goal of containing urban sprawl and promoting compact and contiguous urban development pattern. To date, empirical studies of this topic provide mixed results [21,31]. For example, by analyzing the change in the built-up area, number of buildings and building density of four Swiss municipalities, Gennaio et al. (2009) found that most built-up areas and buildings were located within the urban growth boundaries, which suggests that the UGBs are effective instruments for containing urban sprawl [26]. Wassmer (2006) found that both local urban containment and statewide growth management in the US promoted more compact urban development [23]. The results of Woo and Guldmann. (2011) also show the success of state-mandated and local urban containment policies, but the former is more effective than the latter in curbing urban sprawl [32]. However, Hepinstall-Cymerman et al. (2013) found that in the six counties in western Washington, USA, urban land outside the UGBs even expanded more rapidly than urban land inside the boundaries [31]. In China, reported by the only three studies conducted on policy evaluation, the local urban containment policy appears to unlikely achieve their original goal of curbing urban sprawl. For example, Han, Lai, Dang, Tan, and Wu (2009) found through a remote sensing and geographic information system analysis of the long time series of Landsat imageries that in the first and the second planning periods, substantial urban land growth was observed between the sixth ring road and the urban construction boundaries (UCBs) in Beijing [33]. In their study, three different indicators, namely, boundary containment ratio (BCR), boundary sufficiency ratio (BSR), and boundary adjacent development ratio (BADR), were used to examine the effectiveness of the UCBs. These indicators directly compared the newly urban land located inside and outside the boundaries. However, a common challenge being faced in this empirical study is that a simple after and before comparison may not single out the net effect of the local urban containment policy. As Heilig (1997) noted, five kinds of anthropogenic factors, including population growth, rural–urban migration, urbanization and industrialization development, lifestyle change, and changes in economic and political arrangements and institutions, may drive land use change [34]. Additionally, Wassmer (2006) lumped the causal factors of urban land growth in US cities into three categories: “natural evolution,” which comes from the classical urban economic theory model; “flight from blight,” which means that the fiscal, social, economic, and infrastructure blight in the central areas of the US cities push urban residents fleeing away from the city centers; and “fiscalization of land use” [23]. Although differences between the drivers of land use change between Chinese cities and the US cities are noted, measuring the effect of a specific local urban containment policy while neglecting other confounders may generate misleading conclusions, thereby providing unreasonable land use policy implications.
Our study area, Wuhan City, is a city famous for the rich environmentally sensitive areas in China. According to the land use data extracted from Landsat-derived annual land cover product of China (CLCD) from 1985 to 2019, the total area of the environmentally sensitive area (excluding barren land and impervious) in Wuhan by the end of 1985 is about 8301.39 square kilometers, accounting for 96.74 percent of the whole urban territory. In addition to the converging of the Yangtze River and Han River, the largest urban lake in China, DongHu (East Lake), which has about 33 square kilometers in surface area, also exists there. Actually, Wuhan is well known as a “hundreds-of-lakes” city, which has 138 lakes with areas greater than 0.1 km [35]. However, similar to most large cities in China, Wuhan experienced a rapid land and population urbanization from 1988 to 2013, which led to considerable landscape fragmentation and reductions in ecosystem services [7]. To contain urban sprawl and protect semi-natural and natural land, the Department of Land Resource Management of Wuhan City launched several local urban containment policies, such as the ecological baseline policy, land use zoning demonstrated in the General Land Use Plan (2006–2020), and urban growth boundaries. As mentioned before, the effects of these local policies on protecting environmentally sensitive areas from being encroached have not been fully acknowledged by the public as of today. Therefore, the objectives of this study are threefold: (1) to document and quantify land use change, especially quantify the magnitude and direction of environmentally sensitive area loss in Wuhan over a 34-year period; (2) to evaluate how local urban containment policy suspends urban sprawl at the expense of environmentally sensitive area by comparing magnitude with other factors examined by previous literatures; and (3) to provide policy implications for future sustainable land use management.
The remainder of this paper is organized as follows: Section 2 introduces the background of the local urban containment policy in Wuhan. Section 3 describes the method of calculating land use change matrix, the dependent and independent variables of the regression models used to identify the effects of the local urban containment policies on the environmentally sensitive area loss, and the data. Section 4 provides the empirical findings, followed by a discussion of the current policy implementation in Section 5. The final section concludes the paper with a summary of the findings.

2. Local Urban Containment Policies in Wuhan

To protect arable land and improve land use efficiency, the land management departments of some local governments have adopted several types of local and/or national urban containment policies since 2005. In our study, we will quantify these policies, which are taken as key explanatory variables that attempt to explain the variations in the built-up area of 1 sq. km grids in Wuhan City. We first describe the two types of basic urban land containment policies in land use planning in China and then describe the unique policy for curbing urban land growth adopted by the local government in Wuhan.

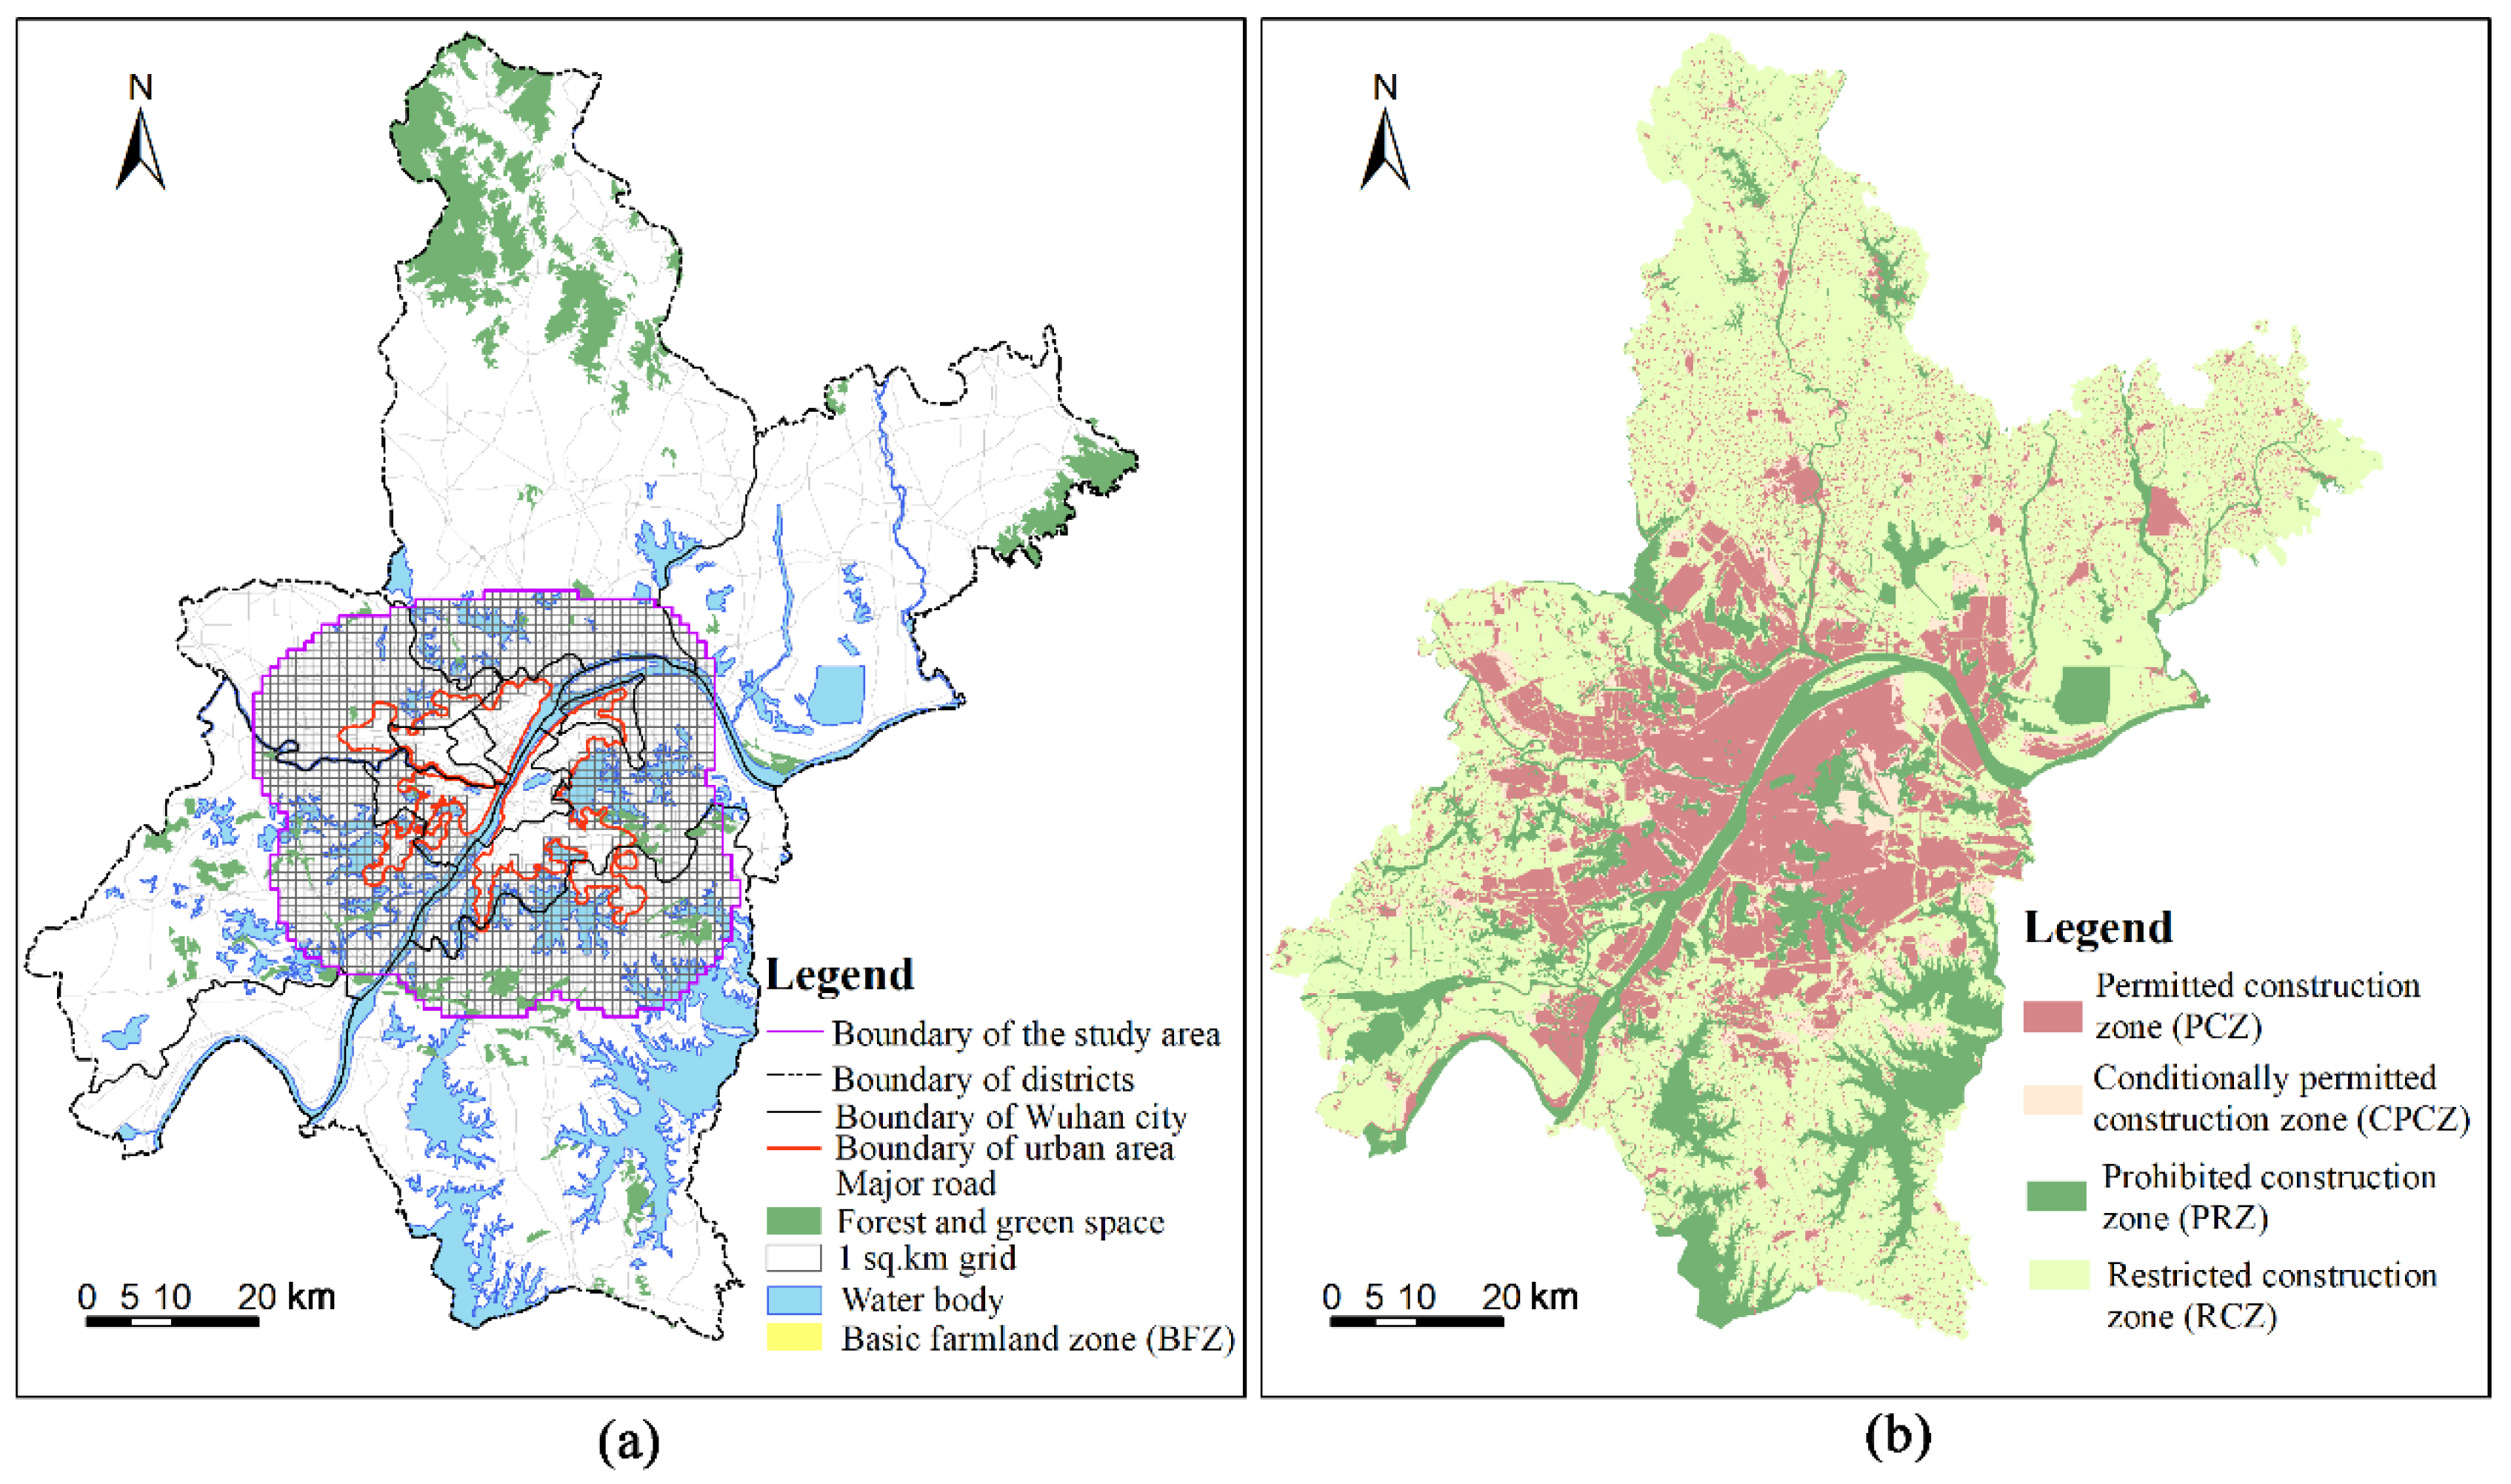
2.1. Basic Farmland Zoning and Built up Area Zoning Policy in General Land Use Plan

Three rounds of land use plan (1987–2000, 1997–2010, and 2006–2020) were made by the local governments in China before year 2005. By the end of 2003, the size of new built-up areas of the whole country had exceeded approximately 32% of its planned quota in the second round of land use plan. During the same period, the area of arable land decreased from 1.951 billion mu in 1996 to 1.831 billion mu in 2005 [36]. With the severity of arable land loss and the conflicts between limited land resources and ongoing urban land demand, the Ministry of Land and Resources (MLR) launched the Outline of the National General Land Use Plan (2006–2020), which required that all levels of local governments had to conduct a second round of general land use planning, in which the planed quotas of farmland and built-up area should be used to prevent farmland loss and contain urban land growth. Moreover, to prevent the extension of urban development, planners were required to set different built-up area zones, including the permitted construction zone (PCZ), conditionally permitted construction zone (CPCZ), restricted construction zone (RCZ), and the prohibited construction zone (PRZ), to steer new urban development within the designated areas and limit the non-urban to urban land use change located inside or outside these areas. Basically, by delineating these zones, urban development is only allowed in PCZ and CPCZ. Particularly, new urban land and industrial land were expected to be located inside PCZ during the planning period. Meanwhile, if there was additional urban land, these additional demands would be placed in CPCZ. The locations of several kinds of projects, such as those associated with energy, transport infrastructure, and national security, can be constructed in RCZ. However, their land use conversions should be approved by local or central governments. To prevent the loss of open space, farmland, and other natural resources, all parcels located in PRZ cannot be converted for urban use. In addition to the four aforementioned zones, basic farmland zones (BFZ) were also observed in the general land use plan map, which means that land parcels located inside BFZs were used for agricultural use, and the occurrence of new development was limited outside of these BFZ boundaries.

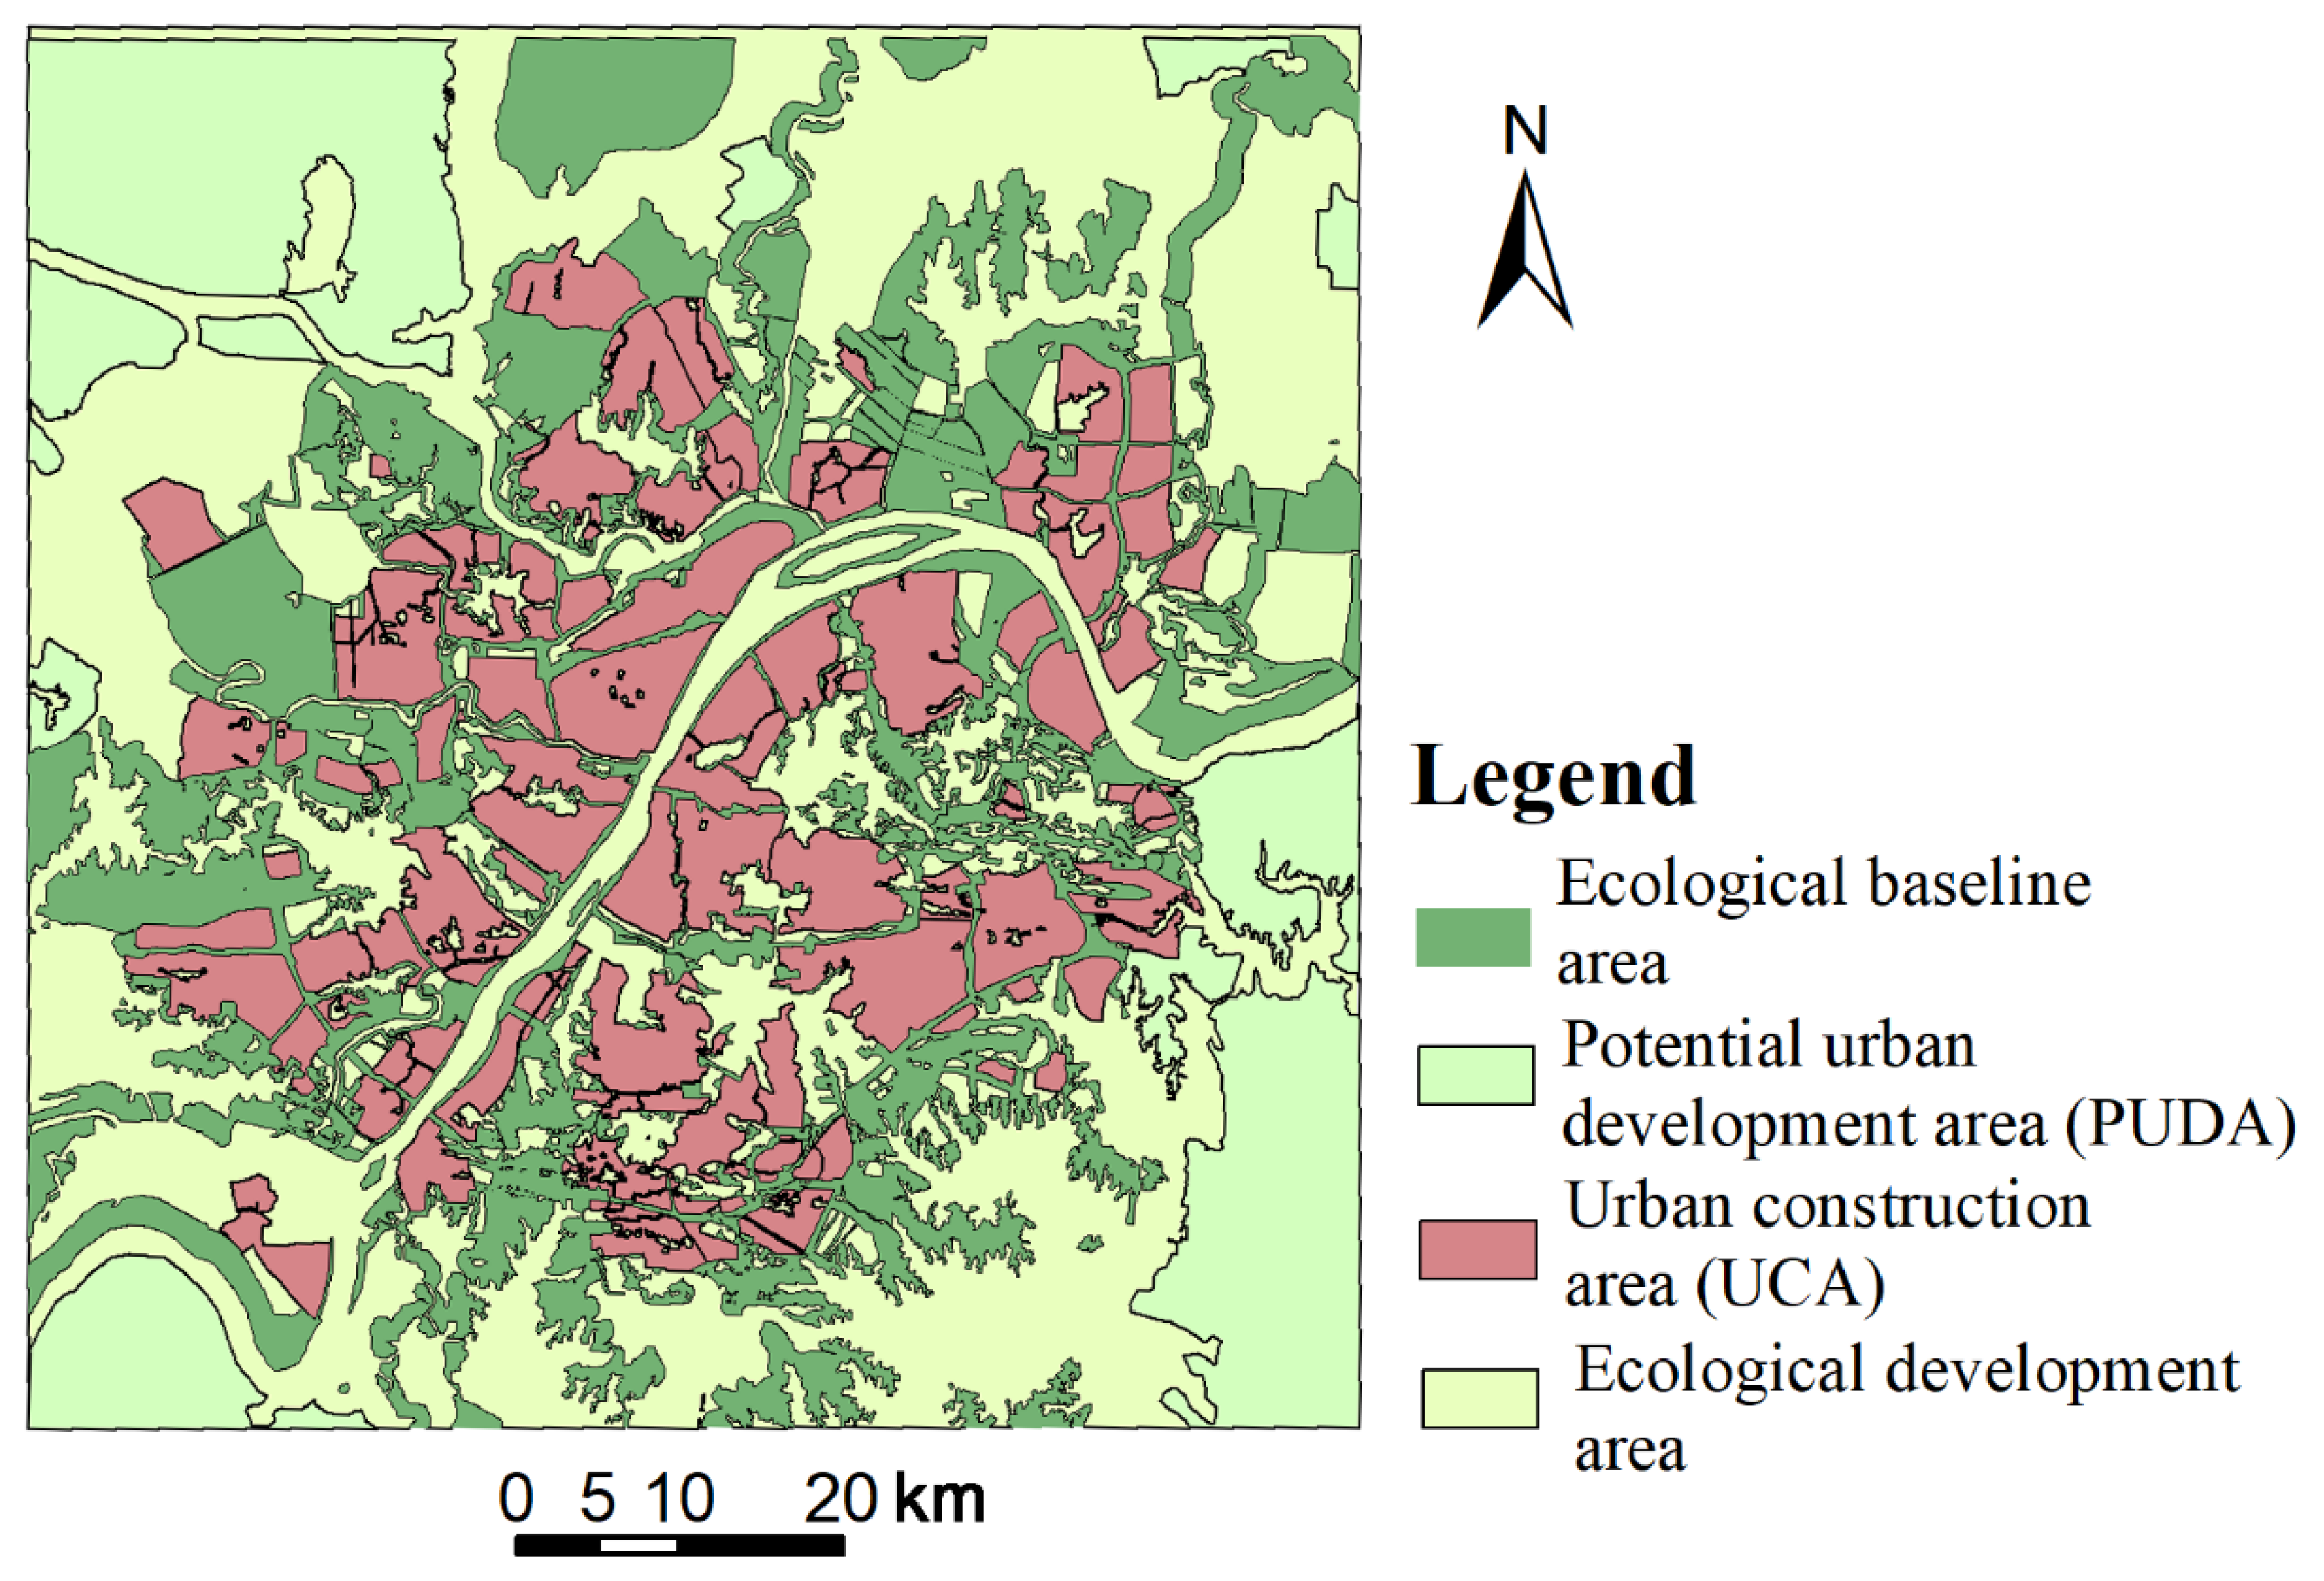
2.2. Ecological Baseline Zoning Policy

Although a national-level zoning policy restricts the urban development in particular areas, the local government in Wuhan made a local urban containment policy as an alternative that delineated the ecological baselines, excluding future urban land growth in “green” areas that are enclosed by these lines (Figure 1). These green areas consist of several types of present land use in 2012: scenic view, natural reserve area, forest, park, river, lake, wet land, reservoir, green space, and farmland. This local policy further prohibits all urban development within the ecological baselines, except for the construction of ancillary facilities for greening and agricultural production, road infrastructure, and infrastructure of emergency and hazard management. Similar to the general land use plan map, areas inside the ecological baselines were classified into two zones, namely, ecological baseline areas (EBA), which means urban development would be strictly contained within their boundaries, and ecological development areas (EDA), which suggests that low-density development and urban constructions subjected to restrictive conditions may be allowed in these areas in the long run. A 1814-square-kilometer area was incorporated within the ecological baselines, with 1566 square kilometers of EBA and 248 square kilometers of EDA. Similarly, the ecological baseline planning also designated areas for future urban land growth, which is named as the urban construction area (UCA) and potential urban development area (PUDA). Non-urban to urban land use conversion during the planning period can occur within UCA, whereas the long-term urban development may be assigned with PUDA.

3. Empirical Models

3.1. Baseline Model

The change of a non-urban parcel to urban use is determined by developers and local governments. In China, a typical land use change procedure is that a non-urban land parcel is first expropriated by local governments from farmers and is then sold to developers for residential, commercial, and industrial use. In other cases, some non-urban land parcels may also be directly converted into non-urban use (such as public infrastructure) or be directly sold to developers by local governments. The latter case may not be driven by market forces, so we only consider the former case, which is determined by the decision of local developers who maximize their benefits through land development. Following Bockstael (1996), the land parcel i that is currently in non-urban land use a will be converted for urban land use k at time t if the net returns of this conversion is greater than the net returns of keeping its original land use status [37], which is given by
W i k t C i k t > W i a t C i a t ,
where W i k t is the present discounted value of the future stream of returns; C i k t is the cost of the conversion, which includes the land use right transformation fee, construction permitting fee, and other payment for infrastructure provision; V i a t is the net benefit of keeping the parcel in the original undeveloped state; and C i a t is the cost.
For simplification, we consider W i k t C i k t in Equation (1) as a systematic portion that can be decomposed into a vector of parcel characteristics and a random error term, which is given by:
V i k t = V i k t ˜ + ε i k t ,
where V i k t ˜ is the average net returns that come from the conversion of land parcel i from undeveloped land use a to developed land use k at time t. ε i k t is the error term that indicates the deviation of net returns of land parcel i from the average net returns.
A common practice of estimating the average net returns in previous studies is based on the urban bid–rent models, in which accessibility to central business district (CBD), population growth, transport cost, and income are the dominant exogenous variables of shaping land use patterns [38]. In addition to these microdeterminants that are related to the behavior of individual’s location choice, parcel geographical features and policy and institutional factors have also been regarded as the determinants of urban land expansion [39]. Following the previous studies [23,40,41,42], the expected average net returns from land parcel i being developed to land use k are given by:
V i k t ˜ = M i t 1 β ˜ k t m + Y i t 1 β ˜ k t y + Z i t 1 β ˜ k t z + R i t 1 β ˜ k t r ,    
where M i t 1 is a vector of variables that represent parcel physical attributes at time t-1; Y i t 1 is a vector of accessibility variables; Z i t 1 is a vector of socioeconomic variables in area i at time t-1; P i t 1 is a vector of variables that denote local land use policies in area i at time t-1; and β k t ˜ = ( β ˜ k t m ,   β ˜ k t y ,   β ˜ k t z ,   β ˜ k t r ) is a vector of coefficients of the vector of explanatory variables X i t 1 = ( M i t 1 , Y i t 1 ,   Z i t 1 , R i t 1   ) .
Combining Equation (2) with Equation (3), the net returns of non-urban to urban land use conversion can be expressed as:
V k t = X i t 1 β k t ˜ + ε k t .

3.2. Spatial Panel Data Model

Equation (4) assumes that the state change in a land parcel is independent from the states of other parcels. However, this assumption seems to be unlikely to capture the spatial structure of land use change data in the real world. For example, as noted by Irwin and Bockstael (2002, 2004), a parcel’s value can be affected by the land use of its neighboring parcels because of potential land use externalities, such as congestion and community benefits [40,41]. In spatial econometric modelling techniques, this effect is the so-called spatial dependence or spillover effect, which can be accounted for by imposing a spatial lag of the independent variable vector on a non-spatial regression model [43,44]. To account for the potential interacting effects among land parcels, a spatial lag model is given by:
V k t = ρ k t W V k t + X i t 1 β k t ˜ + ε k t ,    
where W is the n × n spatial weight matrix with w i j representing the spatial relationships between parcel i and parcel j; ρ k t describes the degree of spatial dependence among different land parcels; V k t = ( V 1 k t , V 2 k t , ,   V n k t ) ; X i t 1 = ( X i 1 t 1 , X i 2 t 1 , ,   X i j t 1 ) ; and β k t ˜ = ( β 1 k t ˜ , β 2 k t ˜ , ,   β j k t ˜ ) ; and ε k t = ( ε 1 k t , ε 2 k t , ,   ε n k t ) .
Equation (8) can be rewritten as:
V k t = ( I n ρ k t W ) 1 X i t 1 β k t ˜ + ( I n ρ k t W ) 1 ε k t     ε k t ~ N ( 0 , σ 2 I n )    
Given that:
( I n ρ k t W ) 1 = I n + ρ k t W + ρ k t 2 W 2 + ρ k t 3 W 3 +      
Rewriting Equation (9) combined with Equation (10), the net returns of non-urban to urban land use conversion can be expressed as:
V k t = X i t 1 β k t ˜ + ρ k t W X i t 1 β k t ˜ + ρ k t 2 W 2 X i t 1 β k t ˜ + ρ k t 3 W 3 X i t 1 β k t ˜ + ε k t + ρ k t W ε k t + ρ k t 2 W 2 ε k t + ρ k t 3 W 3 ε k t +      
Equation (11) demonstrates the nature of spatial dependence among land parcels; that is, the net returns of parcel i  V i k t is not only determined by the value of its own determinants ( X i t 1 ) but also determined by the values of determinants in other locations ( ρ k t W X i t 1 ,   ρ k t 2 W 2 X i t 1 ,   ρ k t 3 W 3 X i t 1 ,   ).
Equation (11) shows that the specific dependence of land parcels is directly determined by the spatial weight matrix W. Unfortunately, W cannot be estimated according to economic theories of spatial econometric applications but needs to be specified in advance [43]. Generally, many spatial weight matrixes can be selected, such as p-order contiguity matrix, in which the off-diagonal element indicates whether two locations share the same border or vertex, inverse distance matrix, in which the element is the inverse distance between two locations, and inverse distance matrix with a cut-off point, and q-nearest neighbor matrixes. Given that no consistent standard for weight selection is provided, the common practice is to specify various models using different spatial weight matrixes and then test whether the results are robust to the weight specifications [43]. In this study, we selected the inverse distance matrix and contiguity matrix to capture the spatial relationships among land parcels. The analysis framework is illustrated in Figure 2.

3.3. Data and Variables

Our study area falls into the capital of Hubei Province, Wuhan city, which covers a total area of 8569 square kilometers. Environmentally sensitive areas with high biodiversity value, such as forest, are located in the northern part. Most of the central area is covered by an impervious surface (urban land) and water (lake and river). Wuhan experienced a fast urbanization period between 1985 and 2019. During this period, it witnessed a 68.57% increase in non-agricultural population, and the gross domestic product (GDP) increased by more than 1484.49 billion RMB [45].
The land use data come mainly from the Landsat-derived annual land cover product of China (CLCD), which was made by Yang & Huang (2021) [46]. The CLCD dataset contains 34 years (from 1985 to 2019) of long-time series land use/land cover information of China, with a resolution of approximately 30 square meters. Based on the Landsat imageries provided by the Google Earth Engine, the annual land use maps were interpreted by a visual interpretation method, and then the spatial–temporal consistency was improved by a post-processing method that incorporates spatial–temporal filtering and logical reasoning. This dataset employs a land classification system that classified the land use/land cover data into nine categories: cropland, forest, shrub, grassland, water, snow/ice, barren, impervious, and wetland. Since environmentally sensitive areas include wildlife habitats, riparian, wetlands, and prime agricultural areas [9], in our study, seven categories of land use (excluding barren and impervious) are classified into environmentally sensitive areas.
According to this dataset, around 96.75% of the whole region was covered by non-urban land by the end of year 1985, whereas around 3.25 of the total area was occupied by urban land. However, the proportion of non-urban land decreased to 86.71%, while this figure of urban land climbed to 13.29% by the end of 2019. Specifically, we mainly focus on the environmentally sensitive area loss at the rural–urban fringe area. This region witnessed the fastest non-urban to urban land conversion over the last 34 years, and nearly 59% of the total non-urban to urban land changes occurred in this area. To identify whether the aforementioned urban containment polices were effective in containing urban land growth so that environmentally sensitive area loss was suspended, we first divided the rural–urban fringe area into 2035 1 sq.km grids. Therefore, the dependent variable in our model is the total area of urban land within 1 sq.km grid (Figure 3a).
We used geographical data coupled with a spatial analysis technique to identify a set of variables that capture the attributes of land parcels in each grid. These attributes are expected to affect the probability of a parcel from being developed into urban use. Parcels with flattened slopes are more convenient and cost less when developed for building construction. Based on the original digital elevation model data DEM data, which were drawn from the Resource and Environment Data Cloud Platform produced by the Chinese Academy of Sciences, we calculated the average slope of each grid. Parcels in grids that are closer to the central business districts (CBDs) were expected to be more valuable for residential and commercial uses. Similarly, parcels near urban lakes, Han River, and Yangtze River may be more likely to be used for real-estate development because they have more scenic view value than other areas. In addition, parcels located closer to industrial parks had a higher probability of being converted for residential use. Here, we distinguish the effect of provincial industrial parks and national industrial parks on parcel development by including two distance-related variables. The datasets on CBDs, national and provincial parks, rivers, and lakes are provided by the Wuhan land resources and planning bureau. As reported by previous studies [47,48], houses within school districts, especially junior high schools, were more expensive than those located outside school districts. Therefore, believing that parcels that are closer to school districts, such as superstar primary school, junior high school, and senior high school, are more likely to be purchased by developers for residential use is reasonable. To control for the impacts of these factors, we used the nearest distances from the center point of a grid to these geographical features to account for their declining impacts on land use conversion. Several of these variables take the log form, and a few of them cannot take the log form because they contain zero values.
In addition to the aforementioned explanatory variables, we also controlled the impacts of road and highway entrance/exit. Road accessibility is a key determinant of driving urban sprawl [47,48,49,50,51]. Road accessibility is measured through two indexes, namely, distance to the nearest highway entrance/exit and distance to the nearest road. Our original road dataset includes the road network information for two different years: 1985 and 2005. We extracted the 2005 road data from the database created in the second national land use survey by the Ministry of Land and Resources of the People’s Republic of China. Based on the road data in 2005, we then updated the road network to 2012 and 2015 according to the digitized version of Hubei and surrounding provinces, highway mileage atlas, and the Baidu Maps. This multiple-year road dataset allows us to create a time-varying variable that captures the effect of main roads on non-urban to urban land use conversion.
Our main explanatory variables of interest are the policy-related variables, which designated the area for urban development or the area for restricting new urban land growth. As described in Section 2, seven zones are delineated by the local government in two plans. Therefore, seven time-varying dummy variables are included in our model, and each dummy variable stands for whether or not a grid is located in the corresponding zone. For example, the dummy variable of a grid for PCZ is equal to one if the grid is in a PCZ in a given year and zero if otherwise. By including these time-varying variables into our model, we can identify whether or not the national and provincial urban containment policy was in effect for suspending environmentally sensitive area loss. Other control variables came from classical monocentric urban economic theory and included the total number of non-agricultural population (NAP), gross domestic product (GDP), the disposable income per month of urban residents (DIPM), and the output value of tertiary industry (TIN). The logic for their selection is that the demand is expected to generate more urban land growth, and the higher the NAP is, and the higher the values of GDP, DIPM, and TIN will be. The descriptive statistics of dependent and independent variables are shown in Table 1.

4. Results

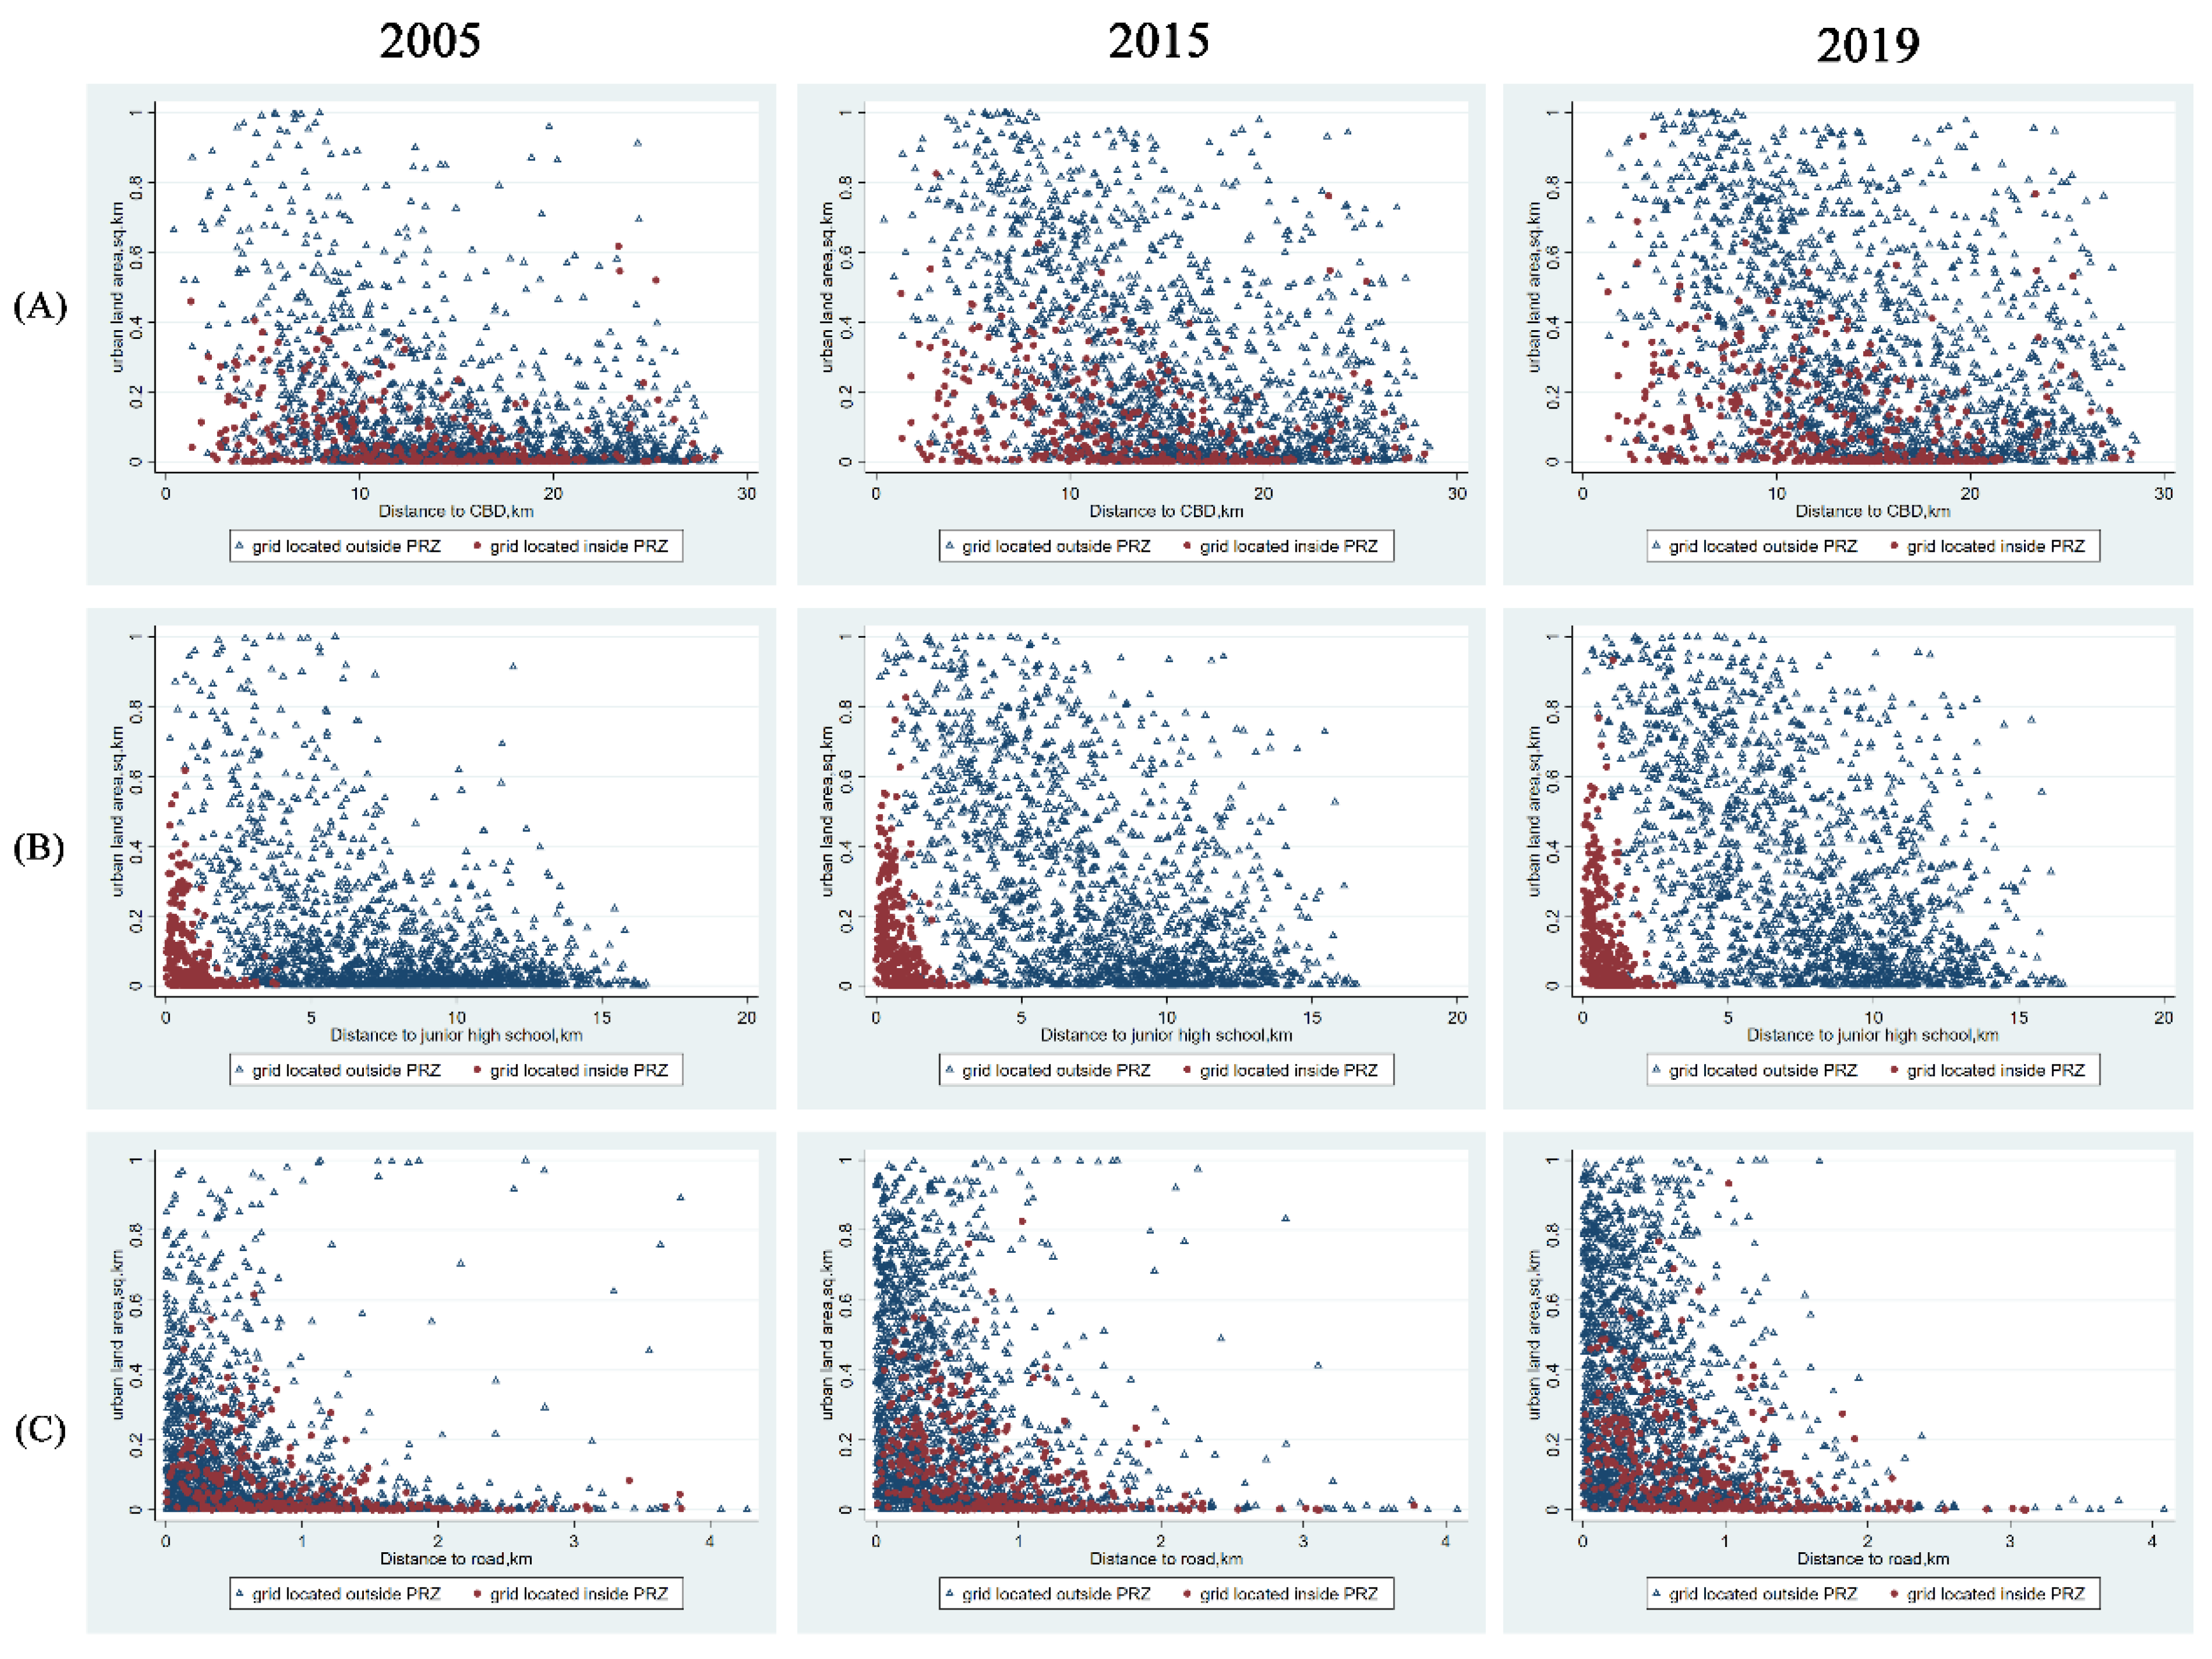
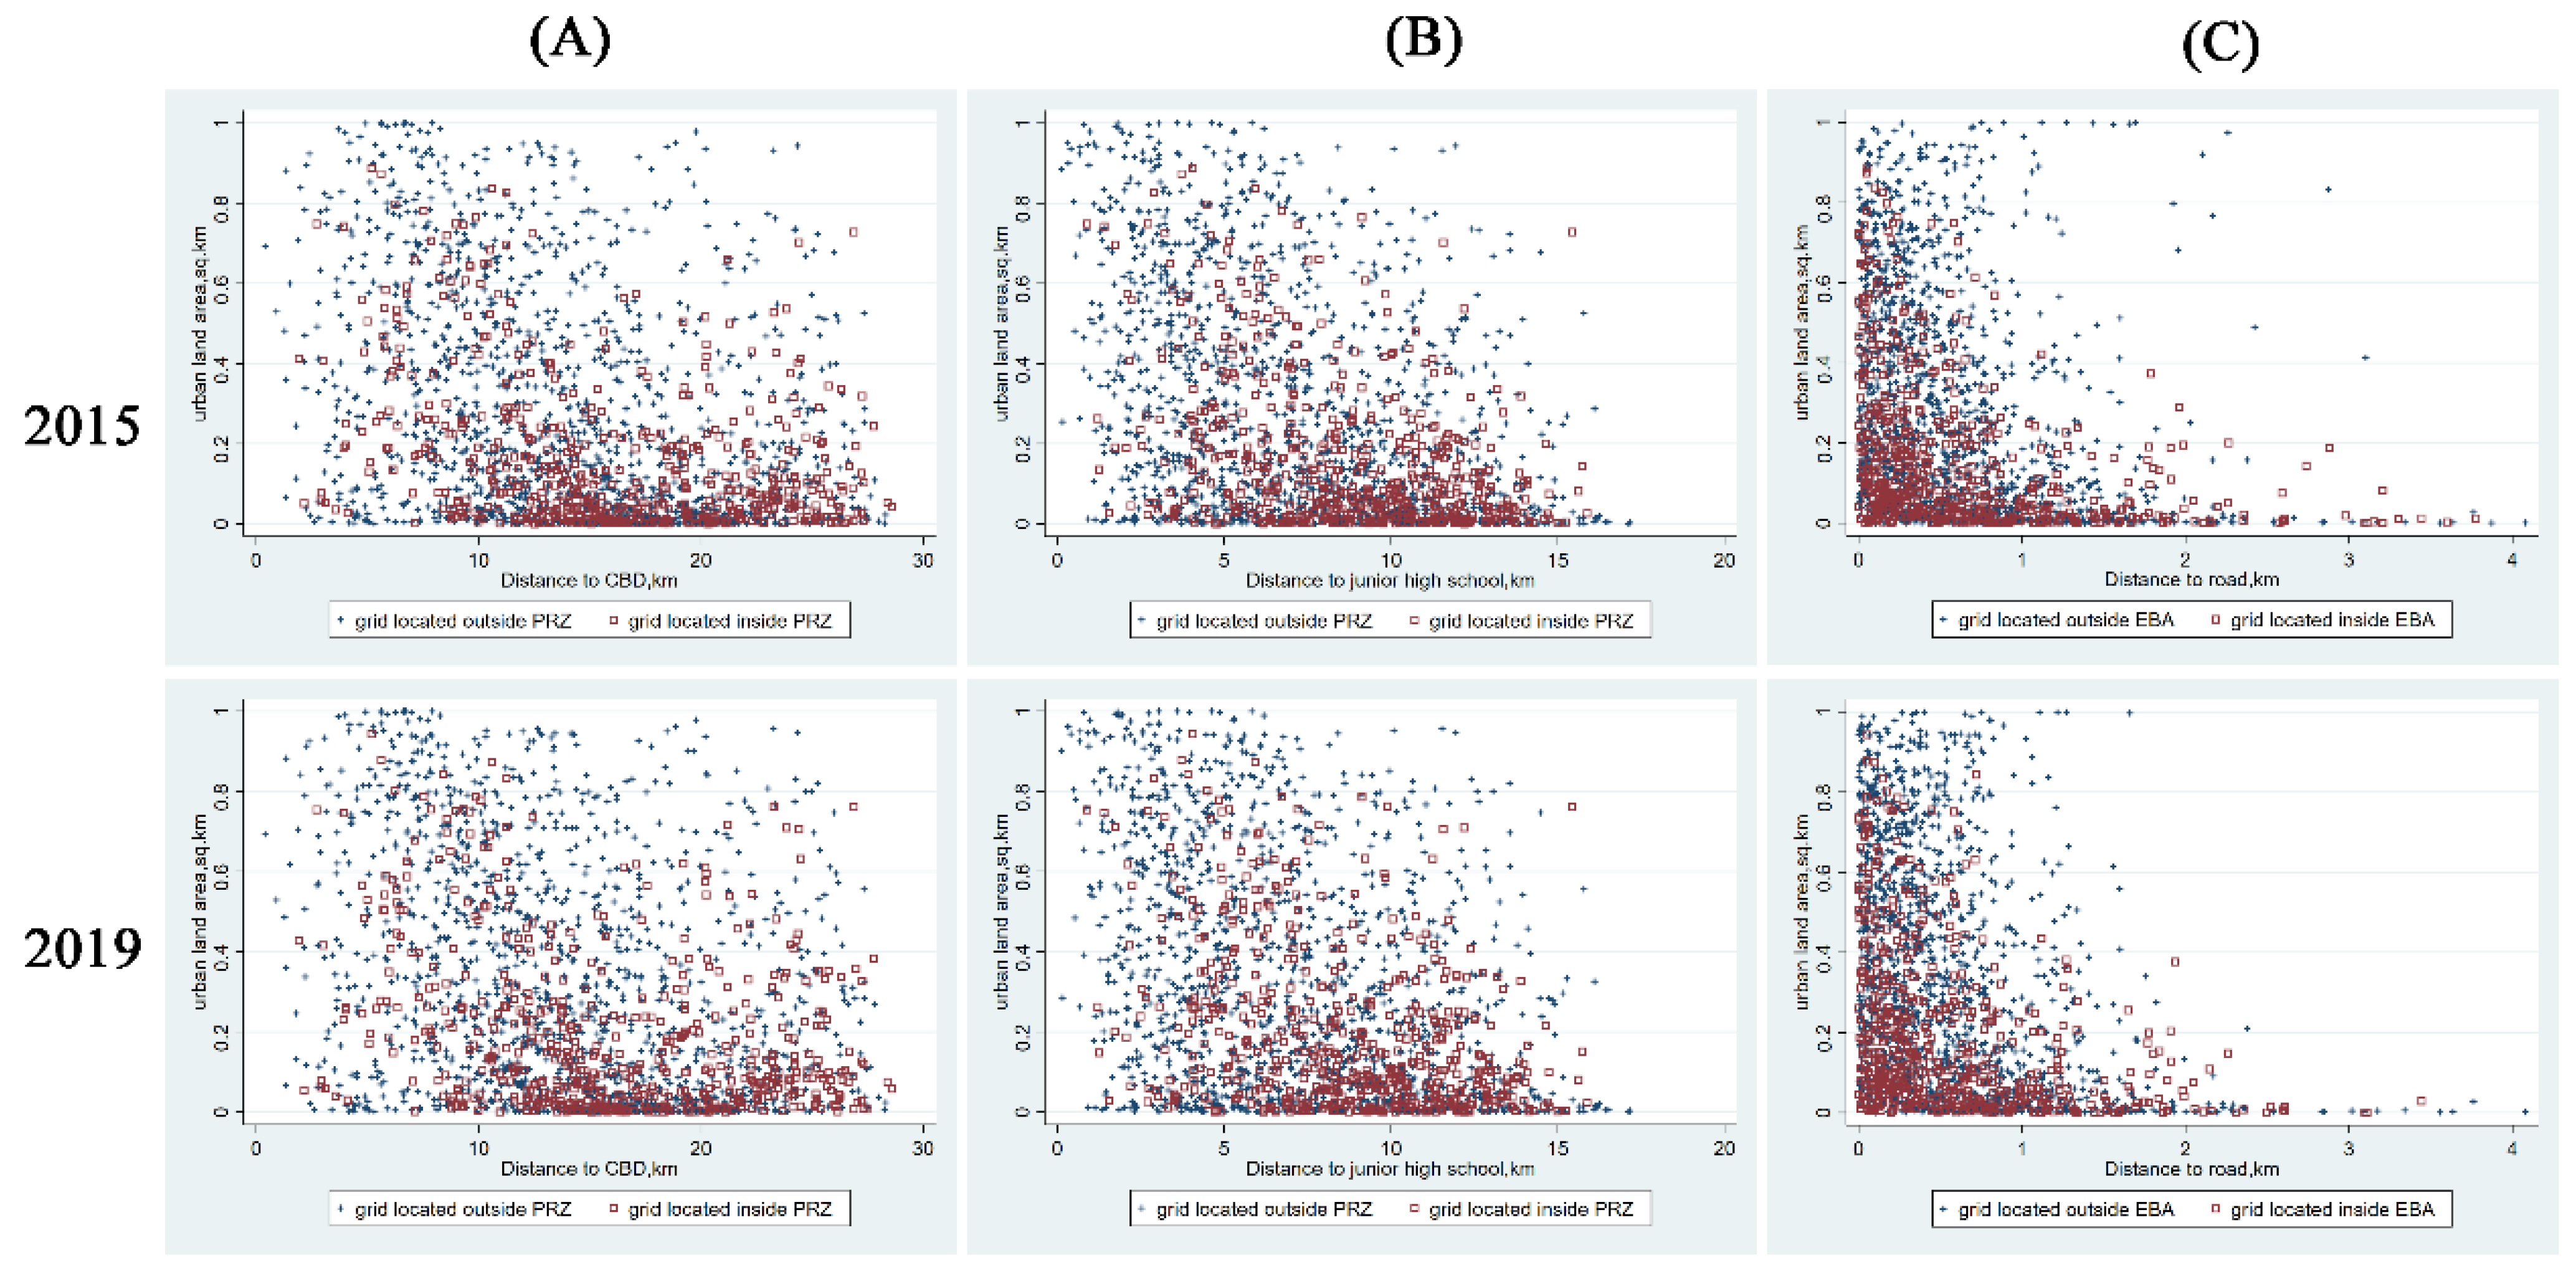
4.1. Spatio-Temporal Change in the Environmentally Sensitive Area in Wuhan

In terms of the area of each type of environmentally sensitive area, Figure 4 suggests, in a given year, arable land and water are the two main types of environmentally sensitive area, accounting for 93.03% of the whole study area in 1985. However, this proportion declined to 68.56% in 2019. Particularly, most of the environmentally sensitive area loss came from the urban land growth that was at the expense of arable land. In the rural–urban fringe area, the total arable land area in 1985 was 1486.37 sq.km. During the study timeframe, arable land experienced a continuously decreasing trend. In 2019, only 1054.93 sq.km arable land remained in the same region, which was a 431.43 sq.km arable land loss compared with that in 1985. Water body followed a similar temporal trend after 1995, that is, increasing from 1985 to 1995, declining between 1995 and 2005, followed by a further decrease between 2005 and 2015, and ending with a relatively small decrease from 2015 to 2019. During the whole study period, the water declined from 406.86 sq.km in 1985 to 340.30 sq.km in 2019. With no surprise, urban land witnessed a significant increase from 1985 to 2019. The urban land area was only 76.62 sq.km, but this figure sharply increased to 585.10 sq.km by the end of 2019. Subsequently, we calculated the land use change matrix, which showed the amount of land use conversion between environmentally sensitive areas and built-up areas. Table 2 presents the land use change matrix during 1985–2019 for Wuhan City as the study area. Approximately 466.20 sq.km of urban land gained from arable land, followed by water body. Around 39.36 sq.km water was encroached by the urban land. A small amount of forest land (4.62 sq.km) also changed into urban land. Grassland and barren land account for a minimal part of the whole land area and experienced a relatively stable change trend.
Figure 5 plots the urban land area of grids regulated by the PRZ policy and grids that were not affected by the PRZ policy against the distance to CBD, road, and junior high school. Row B of Figure 5 shows that the groups of the grid that are controlled and not controlled by PRZ have clear different locations that are related to the junior high schools. In the three years after the policy was put into effect, grids located inside the PRZ became closer to the junior high schools than those outside the PRZ. Most grids, regardless of whether they were regulated or not by the PRZ, are located within a 2 km radius of the major roads (Row C in Figure 5). However, with respect to the distance to CBD, two types of grids do not show a clear difference in location pattern. Figure 5 also shows that most of the grids with an urban area that is greater than 0.5 sq.km (50% of the total grid area) are located outside the PRZs. Moreover, the number of grids inside the PRZs with a high proportion of urban land decreases with the increase in the distance to the junior high school and the roads. Figure 6 plots the urban land area of grids considered to be controlled by the EBA policy and grids without the EBA control against the distance to CBD, road and junior high school. Likewise, for the two groups, most grids are located within a 2 km radius of the major roads (Row C in Figure 6). However, grids in both groups do not show differentiated locational patterns on the distance to road and distance to CBD.

4.2. Regression Results

The results estimated by six separate regressions are presented in Table 3. Most explanatory variables have coefficients that are statistically significant at the 1% level. Columns (1) and (4) show the results estimated by OLS using pooled cross-sectional data, whereas Columns (2) and (5) show the results estimated by fixed effect model using panel data sets. Columns (3) and (6) present the results of Equation (8), which further consider the spillover effects based on Equation (4). In OLS and fixed effect models, most of the R2 indexes are greater than 0.5, indicating that these regressions can explain approximately 50% of the variation of urban land area among the grids. In the fixed effect and spatial auto correlation regressions, which estimate the effects of zoning policies on urban land area, one of the key explanatory variables, PRZ, is substantially correlated with BFZ, which generates multicollinearity problem. Therefore, it is excluded in these two regressions. Similarly, because of multicollinearity, UCA is also omitted in the regressions that identify the effects of EBA policy.
For the two types of urban land containment policy in the second general land use plan, in the pooled OLS and SPDM models, evidence shows that the BFZ policy failed to curb new non-urban to urban land conversion in the rural–urban fringe area. Regression (1), which does not consider the individual fixed and spillover effects, indicates that grids that are designated as PCZs have a larger urban land area. On the contrary, the coefficients for CPCZ and RCZ are statistically negative in the pooled OLS model. Although the latter may suggest the set of RCZ reduced urban land growth, the former effect is of the unexpected sign. In the FE model, the negative coefficient of BFZ suggests that grids located in the BFZs have smaller urban land area compared with those located outside BFZs. Furthermore, the location of a grid within PCZ, CPCZ, or RCZ significantly increases the urban land area in the FE model. Likewise, the positive effects of PCZ, CPCZ, and RCZ are found in the SPDM model. Unsurprisingly, PCZ and CPCZ had positive coefficients because urban development was only allowed in these two types of areas. However, the planning goal of RCZ is to restrict urban development within its boundary, but it had a positive coefficient, which suggests that RCZ is not effective for controlling urban land growth. In addition, in the SPDM model, the basic farmland zoning policy exerts nonzero influences on the urban land area.
As expected, in the pooled OLS model, a set of accessibility variables of a grid has negative effects on the urban land area within the grid. Generally, increasing distances to CBD, highway entrances/exits, junior high schools, roads, national industrial parks, and provincial industrial parks reduces the urban land area. Interestingly, the distance to CBD, which does not show clear effects on the distribution of grids in Figure 5, exerts significant distance decay effects on the urban land area in all grids. Column (1) in Table 3 suggests that, as to be expected from looking at Figure 5, junior high schools have a greater influence on the size of urban area than the distance to road. It also shows larger magnitude of influence on the size of urban land than other accessibility variables, except for distance to CBD. Unfortunately, due to data availability limitations, except for roads, we cannot identify the effects of these accessibility variables on the area of urban land in a grid in the FE model. For major roads, if we consider the individual fixed effects, then it was shown to affect the area of urban land in the FE and SPDM models significantly. This finding is not surprising because the closer to the road a parcel is, the more convenient the development and the less the development cost will be. The final set of variables included in the models reflect the impact of the economic performance on urban land growth. In the OLS and FE models, the results indicate that the grids located in a district with higher GDP, NAP, and TIN values would have more urban land. This is also true for DIPM in the FE model. However, in the SPDM model, these variables derived from classical urban economic theory are not statistically significant.
Column (4), (5), and (6) in Table 3 present the estimated results of EBA and EDA using three different models. In general, the grids located in areas that were designated as EBA and EDA have smaller urban land areas than those located outside the EBAs and EDAs, although the magnitude of these effects vary among the three models. These results suggest that the ecological baseline policy in the rural–urban fringe area illustrated in Figure 1a reduced the urban development in grids located within the areas controlled by this policy significantly. Specifically, on average, the urban land areas in grids within EBA and EDA are expected to be 13.9% and 19.0% smaller than those girds located outside these areas in the SPDM model, respectively. These effects are even greater in the OLS (16.6% and 20.6%) and FE model (20.0% and 21.9%). Accessibility and economic factors have the same sign of coefficients as those in Regressions (1) to (3), where the effects of the ecological baseline policy were examined. In addition, no significant effect was found for slope in the regressions for evaluating the effects of zoning policy in the second general land use plan and in the regressions for evaluating the effects of ecological baseline policy. Although the difference among the results of ecological baseline policy estimated by the three models is minimal, the results of zoning policy in the second general land use plan vary among different models. Therefore, the result we should believe is more of an econometric identification issue. For the OLS and FE models, the p value of F statistic is equal to zero, which suggests we should reject the hypothesis that no individual fixed effects exist. In other words, the FE models seem to perform better than pooled OLS regressions. However, Equation (4) does not incorporate the spillover effect of urban land growth. Therefore, for the remainder of this paper, only the results of SPDM models will be discussed further.

5. Discussion and Policy Implications

5.1. Why Is There So Much Environmentally Sensitive Area Being Converted to Urban Land?

This study uses a long time series of land use dataset to identify the environmentally sensitive area loss in the rural–urban fringe area of a fast urbanization city, Wuhan, China, where the water is of particular abundance in Chinese cities. The statistical results show that arable land and water body are the two main types of environmentally sensitive area that were converted to urban land over the last 34 years. Although the local government has launched different forms of zoning policies to guide urban expansion and preserve farmland and open spaces, the findings of this study provide some empirical evidence that different forms of urban land containment policy presented different degrees of effectiveness for curbing urban land growth and preserving environmentally sensitive area. The ecological baseline policy seems to achieve its intended goal of slowing urban development within the designated area, whereas no obvious differences are observed in urban land areas between the grids inside BFZ and outside BFZ. This finding is not surprising because it reflects the fact that an arable land that is suitable for agricultural production is also suitable for urban development. In most cases, arable land with flatten slopes and remarkable access to road and public services has a higher probability of conversion. Most land parcels in Wuhan have terrain grades that are less than 1, and the mean value of the terrain grades is only 0.28, thereby suggesting that land parcels around the city center is suitable for building construction and providing public infrastructure. This finding is not consistent with the findings of Woo & Guldmann. (2011) [32] and Wassmer (2006) [23]. BFZ is a national policy in China while the ecological baseline policy is more of a local policy in Wuhan. While both local urban containment policy and statewide growth management policies were achieving their intended goals in the US, the national BFZ policy in China seems to be ineffective in our study area.
The failure of the national BFZ policy suggests that land supply and land demand were conflicting. Wuhan is the capital city of Hubei Province and the core city of “1+8 Wuhan metropolitan area” in central China. Since the reform and opening-up policy was implemented in 1978, China had fostered three metropolitan areas, and two of them are located at the coastal region. Although the number of people in the permanent population is high, the central region was clearly lagging behind the three metropolitan areas in the wave of economic growth in the 1990s. Therefore, to promote economic development and reduce the regional difference in social and economic development, China launched its “the Rise of Central China Plan” in 2004. This plan indicates that the central cities will be important manufacturing bases, new type of urbanization areas, modern agricultural development areas, as well as pilot demonstration area of ecological civilization construction. Among these cities, Wuhan is the most important city that not only has the largest scale of economy and the greatest number of urban population but is also the most important transport hub where the Yangtze and Han Rivers intersect and the major rail lines that connect Beijing with Guangzhou, and Shanghai with Chengdu pass intersect in central China. Over the last three decades, Wuhan City has experienced a rapid urbanization rate period. The permanent population has increased from 6.24 million in 1985 to 12.45 million in 2020, whereas the GDP even saw a rocket increase, from 9.732 billion RMB in 1985 to 1561.6 billion RMB in 2020 [45]. It has also become the magnet for domestic and foreign investment in Central China. In 2020, it attracted approximately 11.165 billion USD in foreign direct investment [45]. With the profound economic and population growth, believing there was a vast magnitude of urban land demand during the study timeframe is reasonable, although we were unable to know the real quantity of urban land demand. However, as a city with rich area of water body, natural land with low value of ecosystem services that can be converted for urban land in the rural–urban fringe area of Wuhan City is scarce. As of 2019, the barren land only accounts for 1.35% of the study area, whereas arable land accounts for 51.84% of the study area, followed by water body (16.72 percent). Therefore, if urban sprawl occurs, arable land was inevitably encroached by urban land. Additionally, environmentally sensitive area loss is related to the spatial expansion pattern of urban land. From 1988 to 2013, “leapfrog pattern” which means the dispersed or isolated urban land growth outside the existing urban areas in the six suburb districts accounts for a considerable proportion of urban land growth compared with those in the seven central districts [7]. The leapfrog pattern of urban sprawl can destroy the integrity of arable land and water body, which may hasten the loss of environmentally sensitive area. Du, Ottens, and Sliuzas, 2010 showed that 60% of the shallow water bodies had become urban land, and most lakes in Wuhan were disconnected from the main water network due to the scattered urban land development [52]. Therefore, for other cities in developed countries, if the local authority wants to ensure the effectiveness of an urban containment policy, an accurate urban land demand and supply forecasting should be carried out in the process of policy making. Otherwise, it may fail to achieve the intended goals of curbing excessive urban land growth even under stringent supervision. Additionally, it is should be noted that the effects of the BFZ, EBA, and EDA are only examined using the grid sample located inside the rural–urban fringe area, and their effectiveness and causal explanations can be evaluated using a full data sample.

5.2. Policy Implications for Sustainable Land Use and Environmentally Sensitive Area Protection

Although preventing arable land from being altered for urban use in the rural–urban fringe area is inevitable, the ecological baseline policy that designated most water and green spaces within the boundaries of EBAs is proven to be effective in this rapid urbanization region. However, a water body that possesses high ecological value and plays a great important role in maintaining ecosystem stability and landscape amenity provision has been shrunk and disappeared in a considerable proportion during the study period. This instance is a deficiency of land use management that could have been avoided and should be prevented in future land use management because water to impervious land conversion is hardly reversible. Land use change is not only related to land use sustainability but also linked with ecological sustainability. On the one hand, land use sustainability means that we should meet the urban land needs of the present but cannot compromise the use of land of future generations. As the non-urban land is limited in our study area, if we keep the current low efficient urban land use and the rapid non-urban to urban land conversion speed, we can conclude that there will be no sufficient non-urban land for future generations in the long run. Therefore, the first issue for the local government is that it should balance the urban land supply and need in a given period. This requires the local government accurately forecast the urban land need and urban land supply using advanced techniques, such as system dynamic model. Based on this projection coupled with land suitability assessment, the urban growth boundaries can be set for a given period. Moreover, the local government can also use urban renewal projects, such as renew “urban village”, to increase urban land supply. In addition to increase urban land supply, urban renewal projects can also improve environmental and living quality, enhance existing social networks, and thus contribute to sustainable urban development [53]. On the other hand, land use change can alter landscape structure both at local and regional scale [54]. Based on the theory of landscape ecology, excessive urban land development can reduce ecological sustainability. At the local level, urban sprawl changes the shape of patches and increases the landscape shape complexity. At the regional level, it increases landscape fragmentation and affect connectivity of dominant elements. There is evidence that biodiversity is highly correlated with landscape shape complexity [55]. Therefore, the basic policy implication is that, of the eight land use types, water body, including river, lake, and pond with a large area, should be designated into the EBA region and subjected to stringent preservation.
Beyond these basic important implications, two suggestive policy implications are derived from the empirical findings. As urban land expansion was inevitable and land parcels around the core city are scarce, the local government can allow the low quality of arable land in the suburb to be converted into potential urban land. This measure may contradict with traditional urban economic theory, which indicates that housing and land price that denote the public’s willingness to pay are negatively correlated with distance to CBD. Furthermore, this decentralized development pattern may result in an urban form that encourages long distance to commute to work and increases the cost of public infrastructure provision. However, to ensure adequate urban land supply, offering affordable housing and facing the reality that land parcels with high ecological value are scattered and distributed around the central urban area, a dispersed rather than a strict compact development pattern can protect the environmentally sensitive area in Wuhan City in the long run. At the same time, along with a less compact development policy, the local government can increase investment on the development of public transport network, such as investing more on subway lines, to reduce traffic congestion and increase the willingness of urban residents to pay on housing located at the suburb areas. After all, the causal relationship between metro station and the averaging housing price around the station were uncovered by many previous studies [56,57].
The second suggestion is that the local government should pay attention to the location of a superstar junior high school before it is constructed or change the rule of admission to superstar high school. Housing price is also driven by “school district effect” [47]. Although causal explanations of land development that link “school district effect” to magnitude and spatial pattern of new urban land is rare as of today, our study offers empirical evidence that land development is highly correlated with the distance to the superstar junior high school even when the land parcels were regulated by the EBA policy. Therefore, the local government can use planning method, such as the “2-step floating catchment area” [58], to ensure that urban residents have equal access to high–quality primary and junior high schools. Considering that the data of three time-varying variables, namely, distance to CBD, distance to junior high school, and distance to the highway entrance/exit, are unavailable, a completely panel dataset that can mitigate the problem of endogeneity resulted from unobservable individual heterogeneity.

6. Conclusions

Since the economic growth wave began in the 1990s, most Chinese cities experienced a myriad of urban land growth. Noted by the negative externalities of urban land growth, scholars called for urban containment policy at the national and local levels to prevent excessive environmentally sensitive area loss that resulted from land use conversion. The central government and most of local governments have incorporated urban containment policies in their general land use plan or other spatial plans. Current empirical studies are often limited in terms of offering a discussion on how to design urban containment policy from technical perspectives, with a few of them examining whether these policies were in effect. To fill this gap, this study takes the rural–urban fringe area of a typical fast urbanization city in China as the study area to identify the effectiveness of one national and a local urban containment policy on environmentally sensitive area protection.
Unsurprisingly, a large number of environmentally sensitive areas had been converted for urban land over the last three decades. Arable land and water body are the two main types of environmentally sensitive area that were encroached by the urban development in Wuhan City. Although a basic farmland zoning policy aims at protecting arable land loss, it failed to achieve its intended goal. When considering the spillover effects among grids, the empirical evidence suggests that the ecological baseline zoning policy constrained urban development. Specifically, for the rural–urban fringe area in Wuhan, the grids located inside the EBAs and the EDAs gained 13.9% and 19.0% smaller urban area than those located outside these zones, respectively. The primary policy implication to be derived from this study is that a less compact but with developed public transport network urban form may prevent the environmentally sensitive area from encroaching in the long run.

Author Contributions

Resources, writing—original draft preparation, writing—review and editing, funding acquisition, supervision, project administration, K.Z.; conceptualization, formal analysis, methodology, software, R.T. All authors have read and agreed to the published version of the manuscript.

Funding

This research was funded by Humanities and Social Science Fund of Ministry of Education of China, grant number 17YJC630233.

Institutional Review Board Statement

Not applicable.

Informed Consent Statement

Not applicable.

Data Availability Statement

Not applicable.

Conflicts of Interest

The authors declare no conflict of interest.

References

  1. Gu, C.; Hu, L.; Cook, I.G. China’s urbanization in 1949–2015: Processes and driving forces. Chin. Geogr. Sci. 2017, 27, 847–859. [Google Scholar] [CrossRef]
  2. Liu, Y.; Fang, F.; Li, Y. Key issues of land use in China and implications for policy making. Land Use Policy 2014, 40, 6–12. [Google Scholar] [CrossRef]
  3. Li, Y.; Zhao, S.; Zhao, K.; Xie, P.; Fang, J. Land-cover changes in an urban lake watershed in a mega-city, Central China. Environ. Monit. Assess. 2006, 115, 349–359. [Google Scholar] [CrossRef]
  4. Mao, D.; Wang, Z.; Wu, J.; Wu, B.; Zeng, Y.; Song, K.; Luo, L. China’s wetlands loss to urban expansion. Land Degrad. Dev. 2018, 29, 2644–2657. [Google Scholar] [CrossRef]
  5. Wu, Y.; Li, S.; Yu, S. Monitoring urban expansion and its effects on land use and land cover changes in Guangzhou city, China. Environ. Monit. Assess. 2015, 188, 54. [Google Scholar] [CrossRef] [PubMed]
  6. Xie, C.; Huang, X.; Wang, L.; Fang, X.; Liao, W. Spatiotemporal change patterns of urban lakes in China’s major cities between 1990 and 2015. Int. J. Digit. Earth 2018, 11, 1085–1102. [Google Scholar] [CrossRef]
  7. Zhou, K.; Liu, Y.; Tan, R.; Song, Y. Urban dynamics, landscape ecological security, and policy implications: A case study from the Wuhan area of central China. Cities 2014, 41, 141–153. [Google Scholar] [CrossRef]
  8. Jennings, M.D.; Reganold, J.P. Hierarchy and subsidy-stress as a theoretical basis for managing environmentally sensitive areas. Landsc. Urban Plan. 1991, 21, 31–45. [Google Scholar] [CrossRef]
  9. Ndubisi, F.; DeMeo, T.; Ditto, N.D. Environmentally sensitive areas: A template for developing greenway corridors. Landsc. Urban Plan. 1995, 33, 159–177. [Google Scholar] [CrossRef]
  10. Gounaridis, D.; Newell, J.P.; Goodspeed, R. The impact of urban sprawl on forest landscapes in Southeast Michigan, 1985–2015. Landsc. Ecol. 2020, 35, 1975–1993. [Google Scholar] [CrossRef]
  11. Inostroza, L.; Baur, R.; Csaplovics, E. Urban sprawl and fragmentation in Latin America: A dynamic quantification and characterization of spatial patterns. J. Environ. Manag. 2013, 115, 87–97. [Google Scholar] [CrossRef] [PubMed]
  12. Irwin, E.G.; Bockstael, N.E. The Evolution of Urban Sprawl: Evidence of Spatial Heterogeneity and Increasing Land Fragmentation. Proc. Natl. Acad. Sci. USA 2007, 104, 20672–20677. [Google Scholar] [CrossRef] [PubMed]
  13. Dupras, J.; Marull, J.; Parcerisas, L.; Coll, F.; Gonzalez, A.; Girard, M.; Tello, E. The impacts of urban sprawl on ecological connectivity in the Montreal Metropolitan Region. Environ. Sci. Policy 2016, 58, 61–73. [Google Scholar] [CrossRef]
  14. Marulli, J.; Mallarach, J.M. A GIS methodology for assessing ecological connectivity: Application to the Barcelona Metropolitan Area. Landsc. Urban Plan. 2005, 71, 243–262. [Google Scholar] [CrossRef]
  15. Brueckner, J.K. Urban Sprawl: Diagnosis and Remedies. Int. Reg. Sci. Rev. 2000, 23, 160–171. [Google Scholar] [CrossRef]
  16. Bateman, I.J.; Harwood, A.R.; Mace, G.M.; Watson, R.T.; Abson, D.J.; Andrews, B.; Termansen, M. Bringing Ecosystem Services into Economic Decision-Making: Land Use in the United Kingdom. Science 2013, 341, 45–50. [Google Scholar] [CrossRef]
  17. Ewing, R.H. Characteristics, Causes, and Effects of Sprawl: A Literature Review, in Urban Ecology: An International Perspective on the Interaction Between Humans and Nature; Marzluff, J.M., Shulenberger, E., Endlicher, W., Alberti, M., Bradley, G., Ryan, C., Simon, U., ZumBrunnen, C., Eds.; Springer: Boston, MA, USA, 2008; pp. 519–535. [Google Scholar]
  18. Millward, H. Urban containment strategies: A case-study appraisal of plans and policies in Japanese, British, and Canadian cities. Land Use Policy 2006, 23, 473–485. [Google Scholar] [CrossRef]
  19. Cho, S.-H.; Chen, Z.; Yen, S.T.; Eastwood, D.B. Estimating Effects of an Urban Growth Boundary on Land Development. J. Agric. Appl. Econ. 2006, 38, 287–298. [Google Scholar] [CrossRef]
  20. Cho, S.-H.; Omitaomu, O.A.; Poudyal, N.C.; Eastwood, D.B. The Impact of an Urban Growth Boundary on Land Development in Knox County, Tennessee: A Comparison of Two-Stage Probit Least Squares and Multilayer Neural Network Models. J. Agric. Appl. Econ. 2007, 39, 37057. [Google Scholar] [CrossRef]
  21. Dempsey, J.A.; Plantinga, A.J. How well do urban growth boundaries contain development? Results for Oregon using a difference-in-difference estimator. Reg. Sci. Urban Econ. 2013, 43, 996–1007. [Google Scholar] [CrossRef]
  22. Jun, M. The Effects of Portland’s Urban Growth Boundary on Urban Development Patterns and Commuting. Urban Stud. 2004, 41, 1333–1348. [Google Scholar] [CrossRef]
  23. Wassmer, R.W. The Influence of Local Urban Containment Policies and Statewide Growth Management on the Size of United States Urban Areas. J. Reg. Sci. 2006, 46, 25–65. [Google Scholar] [CrossRef]
  24. Ball, M.; Cigdem, M.; Taylor, E.; Wood, G. Urban Growth Boundaries and their Impact on Land Prices. Environ. Plan. A Econ. Space 2014, 46, 3010–3026. [Google Scholar] [CrossRef]
  25. Mubarak, F.A. Urban growth boundary policy and residential suburbanization: Riyadh, Saudi Arabia. Habitat Int. 2004, 28, 567–591. [Google Scholar] [CrossRef]
  26. Gennaio, M.-P.; Hersperger, A.M.; Bürgi, M. Containing urban sprawl—Evaluating effectiveness of urban growth boundaries set by the Swiss Land Use Plan. Land Use Policy 2009, 26, 224–232. [Google Scholar] [CrossRef]
  27. Ahani, S.; Dadashpoor, H. Urban growth containment policies for the guidance and control of peri-urbanization: A review and proposed framework. Environ. Dev. Sustain. 2021, 23, 14215–14244. [Google Scholar] [CrossRef]
  28. Bae, C.-H.C.; Jun, M.-J. Counterfactual Planning:What if there had been No Greenbelt in Seoul? J. Plan. Educ. Res. 2003, 22, 374–383. [Google Scholar] [CrossRef]
  29. Liu, Y.; Zhou, Y. Territory spatial planning and national governance system in China. Land Use Policy 2021, 102, 105288. [Google Scholar] [CrossRef]
  30. Yang, Y.; Zhang, L.; Ye, Y.; Wang, Z. Curbing Sprawl with Development-limiting Boundaries in Urban China: A Review of Literature. J. Plan. Lit. 2020, 35, 25–40. [Google Scholar] [CrossRef]
  31. Hepinstall-Cymerman, J.; Coe, S.; Hutyra, L.R. Urban growth patterns and growth management boundaries in the Central Puget Sound, Washington, 1986–2007. Urban Ecosyst. 2013, 16, 109–129. [Google Scholar] [CrossRef]
  32. Woo, M.; Guldmann, J.-M. Impacts of Urban Containment Policies on the Spatial Structure of US Metropolitan Areas. Urban Stud. 2011, 48, 3511–3536. [Google Scholar] [CrossRef]
  33. Han, H.-Y.; Lai, S.-K.; Dang, A.-R.; Tan, Z.-B.; Wu, C.-F. Effectiveness of urban construction boundaries in Beijing: An assessment. J. Zhejiang Univ.-Sci. A 2009, 10, 1285–1295. [Google Scholar] [CrossRef]
  34. Heilig, G.K. Anthropogenic Factors in Land-Use Change in China. Popul. Dev. Rev. 1997, 23, 139–168. [Google Scholar] [CrossRef]
  35. Kai, X.; Chunfang, K.; Gang, L.; Chonglong, W.; Hongbin, D.; Yi, Z.; Qianlai, Z. Changes of urban wetlands in Wuhan, China, from 1987 to 2005. Prog. Phys. Geogr. Earth Environ. 2010, 34, 207–220. [Google Scholar] [CrossRef]
  36. Ministry of Natural Resources of the People’s Republic of China. A Review of the 30-Year History of Land Use Planning in China. 2009. Available online: https://www.mnr.gov.cn/dt/ywbb/201810/t20181030_2246134.html (accessed on 10 January 2022).
  37. Bockstael, N.E. Modeling Economics and Ecology: The Importance of a Spatial Perspective. Am. J. Agric. Econ. 1996, 78, 1168–1180. [Google Scholar] [CrossRef]
  38. Alonso, W. Location and land use. In Toward a General Theory of Land Rent; Harvard University Press: Cambridge, MA, USA, 1964. [Google Scholar]
  39. Colsaet, A.; Laurans, Y.; Levrel, H. What drives land take and urban land expansion? A systematic review. Land Use Policy 2018, 79, 339–349. [Google Scholar] [CrossRef]
  40. Irwin, E.G.; Bockstael, N.E. Interacting agents, spatial externalities and the evolution of residential land use patterns. J. Econ. Geogr. 2002, 2, 31–54. [Google Scholar] [CrossRef]
  41. Irwin, E.G.; Bockstael, N.E. Land use externalities, open space preservation, and urban sprawl. Reg. Sci. Urban Econ. 2004, 34, 705–725. [Google Scholar] [CrossRef]
  42. Serneels, S.; Lambin, E.F. Proximate causes of land-use change in Narok District, Kenya: A spatial statistical model. Agric. Ecosyst. Environ. 2001, 85, 65–81. [Google Scholar] [CrossRef]
  43. Elhorst, J.P. Spatial Econometrics: From Cross-Sectional Data to Spatial Panels; Springer: Berlin/Heidelberg, Germany, 2014. [Google Scholar]
  44. LeSage, J.P.; Pace, R.K. Introduction to Spatial Econometrics; CRC Press: Boca Raton, FL, USA, 2009. [Google Scholar]
  45. Wuhan Municipal Statistics Bureau. Wuhan Statistical Yearbook (2020, 2021); China Statistics Press: Beijing, China, 2021. [Google Scholar]
  46. Yang, J.; Huang, X. The 30 m annual land cover dataset and its dynamics in China from 1990 to 2019. Earth Syst. Sci. Data 2021, 13, 3907–3925. [Google Scholar] [CrossRef]
  47. Chan, J.; Fang, X.; Wang, Z.; Zai, X.; Zhang, Q. Valuing primary schools in urban China. J. Urban Econ. 2020, 115, 103183. [Google Scholar] [CrossRef]
  48. Wen, H.; Zhang, Y.; Zhang, L. Do educational facilities affect housing price? An empirical study in Hangzhou, China. Habitat Int. 2014, 42, 155–163. [Google Scholar] [CrossRef]
  49. Meng, M.; Shang, Y.; Yang, Y. Did highways cause the urban polycentric spatial structure in the Shanghai metropolitan area? J. Transp. Geogr. 2021, 92, 103022. [Google Scholar] [CrossRef]
  50. Müller, K.; Steinmeier, C.; Küchler, M. Urban growth along motorways in Switzerland. Landsc. Urban Plan. 2010, 98, 3–12. [Google Scholar] [CrossRef]
  51. Reilly, M.K.; O’Mara, M.P.; Seto, K.C. From Bangalore to the Bay Area: Comparing transportation and activity accessibility as drivers of urban growth. Landsc. Urban Plan. 2009, 92, 24–33. [Google Scholar] [CrossRef]
  52. Du, N.; Ottens, H.; Sliuzas, R. Spatial impact of urban expansion on surface water bodies—A case study of Wuhan, China. Landsc. Urban Plan. 2010, 94, 175–185. [Google Scholar] [CrossRef]
  53. Zheng, H.W.; Shen, G.Q.; Wang, H. A review of recent studies on sustainable urban renewal. Habitat Int. 2014, 41, 272–279. [Google Scholar] [CrossRef]
  54. Peterseil, J.; Wrbka, T.; Plutzar, C.; Schmitzberger, I.; Kiss, A.; Szerencsits, E.; Beissmann, H. Evaluating the ecological sustainability of Austrian agricultural landscapes—The SINUS approach. Land Use Policy 2004, 21, 307–320. [Google Scholar] [CrossRef]
  55. Moser, D.; Zechmeister, H.G.; Plutzar, C.; Sauberer, N.; Wrbka, T.; Grabherr, G. Landscape patch shape complexity as an effective measure for plant species richness in rural landscapes. Landsc. Ecol. 2002, 17, 657–669. [Google Scholar] [CrossRef]
  56. Diao, M.; Leonard, D.; Sing, T.F. Spatial-difference-in-differences models for impact of new mass rapid transit line on private housing values. Reg. Sci. Urban Econ. 2017, 67, 64–77. [Google Scholar] [CrossRef]
  57. Tan, R.; He, Q.; Zhou, K.; Xie, P. The effect of new metro stations on local land use and housing prices: The case of Wuhan, China. J. Transp. Geogr. 2019, 79, 102488. [Google Scholar] [CrossRef]
  58. Wang, F. Measurement, Optimization, and Impact of Health Care Accessibility: A Methodological Review. Ann. Assoc. Am. Geogr. 2012, 102, 1104–1112. [Google Scholar] [CrossRef] [PubMed]
Figure 1. Ecological baseline areas in Wuhan.
Land 11 01310 g001
Figure 2. A schematic representation of the models used in this study.
Land 11 01310 g002
Figure 3. Study area (a), and land use zoning in Wuhan (b).
Land 11 01310 g003
Figure 4. Land use change, 1985–2019, Wuhan City.
Land 11 01310 g004
Figure 5. (A) Urban land area, prohibited construction zone and distances to CBD, (B) junior high school, and (C) road in the three years after the zoning policy in place.
Land 11 01310 g005
Figure 6. (A) Urban land area, ecological baseline area and distances to CBD, (B) junior high school, and (C) road in the two years after the zoning policy in place.
Land 11 01310 g006
Table 1. Descriptive statistics of variables.
VarNameObsMeanSDMinMax
Urban_area10,1750.1510.2310.0001.000
Log(Distance to CBD)10,1759.4630.5285.97910.260
Log(Distance to highway)10,1757.5670.8062.7569.054
Log(Distance to junior high school)10,1758.7750.6164.9009.750
Slope10,1750.2820.2910.0212.787
Distance to national industrial park10,1755120.4585625.1520.00023,836.600
Distance to provincial industrial park10,1756600.1454479.5170.00019,447.500
Distance to lake10,1751888.8212106.0370.00010,880.400
Distance to river10,1757671.1166078.5670.00027,389.801
Log(Distance to road)10,1756.3011.356−3.9619.142
Log(GDP)10,1757.3961.9254.4289.611
Log(NAP)10,17515.3930.20015.16015.683
Log(TIN)10,1756.5612.2033.0489.104
Log(DIPM)10,1756.6451.4074.3908.281
BFZ10,1750.0730.2600.0001.000
PCZ10,1750.2650.4420.0001.000
CPCZ10,1750.0400.1960.0001.000
RCZ10,1750.1810.3850.0001.000
PRZ10,1750.1140.3170.0001.000
EBA10,1750.1180.3230.0001.000
EDA10,1750.1380.3450.0001.000
Table 2. Land use change matrix between environmentally sensitive areas and built-up areas in Wuhan during 1985–2019.
CroplandForestGrasslandWaterBarrenBuilt-Up Area
Cropland963.249.850.4246.400.26466.20
Forest15.5443.840.130.270.004.62
Grassland0.190.060.000.020.000.46
Water74.470.070.01292.930.0239.36
Barren0.000.000.000.000.000.02
Built-up area1.490.010.000.670.0074.44
Table 3. Regression results from different estimation models.
General Land Use PlanEcological Baseline
(1)
Pooled OLS
(2)
FE
(3)
SPDM
(4)
Pooled OLS
(5)
FE
(6)
SPDM
Log(Distance to CBD)−0.0642 *** −0.0684 ***
(0.00893) (0.00909)
Log(Distance to highway)−0.0178 *** −0.0228 ***
(0.00397) (0.00398)
Log(Distance to junior high school)−0.0512 *** −0.0519 ***
(0.00834) (0.00870)
Slope0.00875 0.00845
(0.00834) (0.00829)
Distance to national industrial park−0.00000115 ** −0.00000165 ***
(0.000000522) (0.000000521)
Distance to provincial industrial park−0.00000515 *** −0.00000583 ***
(0.000000918) (0.000000909)
Distance to lake0.00000562 *** 0.00000989 ***
(0.00000170) (0.00000173)
Distance to river−0.00000360 *** −0.00000349 ***
(0.000000454) (0.000000454)
Log(Distance to road)−0.0204 ***−0.00723 ***−0.00499 ***−0.0253 ***−0.00494 *−0.00344 ***
(0.00236)(0.00256)(0.00134)(0.00243)(0.00278)(0.00133)
Log(GDP)0.175 ***0.0342 ***−3.63 × 10⁻¹⁴−0.0539 ***0.364 ***1.87 × 10⁻¹¹
(0.00751)(0.00741)(5.171)(0.00607)(0.0139)(5.267)
Log(NAP)0.325 ***0.438 ***−6.15 × 10−130.670 ***0.579 ***2.16 × 10⁻¹⁰
(0.0111)(0.0141)(15.92)(0.0162)(0.0159)(17.40)
Log(TIN)−0.132 ***−0.307 ***0.261 −0.503 ***0.172
(0.00597)(0.0118)(5.495) (0.0177)(5.835)
Log(DIPM) 0.409 ***−0.5520.0794 ***0.317 ***−0.351
(0.0187)(8.923)(0.00663)(0.0130)(10.23)
BFZ−0.00865−0.0362 ***−0.000549
(0.00798)(0.00769)(0.00702)
PCZ0.0657 ***0.205 ***0.201 ***
(0.00666)(0.00804)(0.00546)
CPCZ−0.0795 ***0.0950 ***0.0908 ***
(0.0130)(0.0139)(0.00898)
RCZ−0.128 ***0.0222 ***0.0696 ***
(0.00676)(0.00740)(0.00639)
PRZ−0.174 ***
(0.00723)
EBA −0.166 ***−0.200 ***−0.139 ***
(0.00952)(0.0100)(0.00504)
EDA −0.206 ***−0.219 ***−0.190 ***
(0.00937)(0.00977)(0.00475)
_cons−3.875 ***−7.574 ***0.0982 ***−8.754 ***−10.18 ***0.0978 ***
(0.195)(0.243)(0.000770)(0.268)(0.283)(0.000766)
W*Urban_area 2.748 *** 2.646 ***
(0.0507) (0.0495)
Year dummiesYesYesYesYesYesYes
Number of observations10,17510,17510,17510,17510,17510,175
R20.5010.552 0.4550.562
adj. R20.5000.552 0.4550.561
AIC−7950.5−17,957.2−14,618.4−7062.6−18,176.5−14,701.0
pseudo-R2 0.144 0.146
Standard errors in parentheses, * p < 0.1, ** p < 0.05, *** p < 0.01.
Publisher’s Note: MDPI stays neutral with regard to jurisdictional claims in published maps and institutional affiliations.

