
Carbon Dioxide and Release of Primary Nutrients in Contrasting Soils Incubated with Feedstocks and Biochar from Cull Potato and Pine Bark


Abstract
:1. Introduction
2. Method and Materials
2.1. Soils
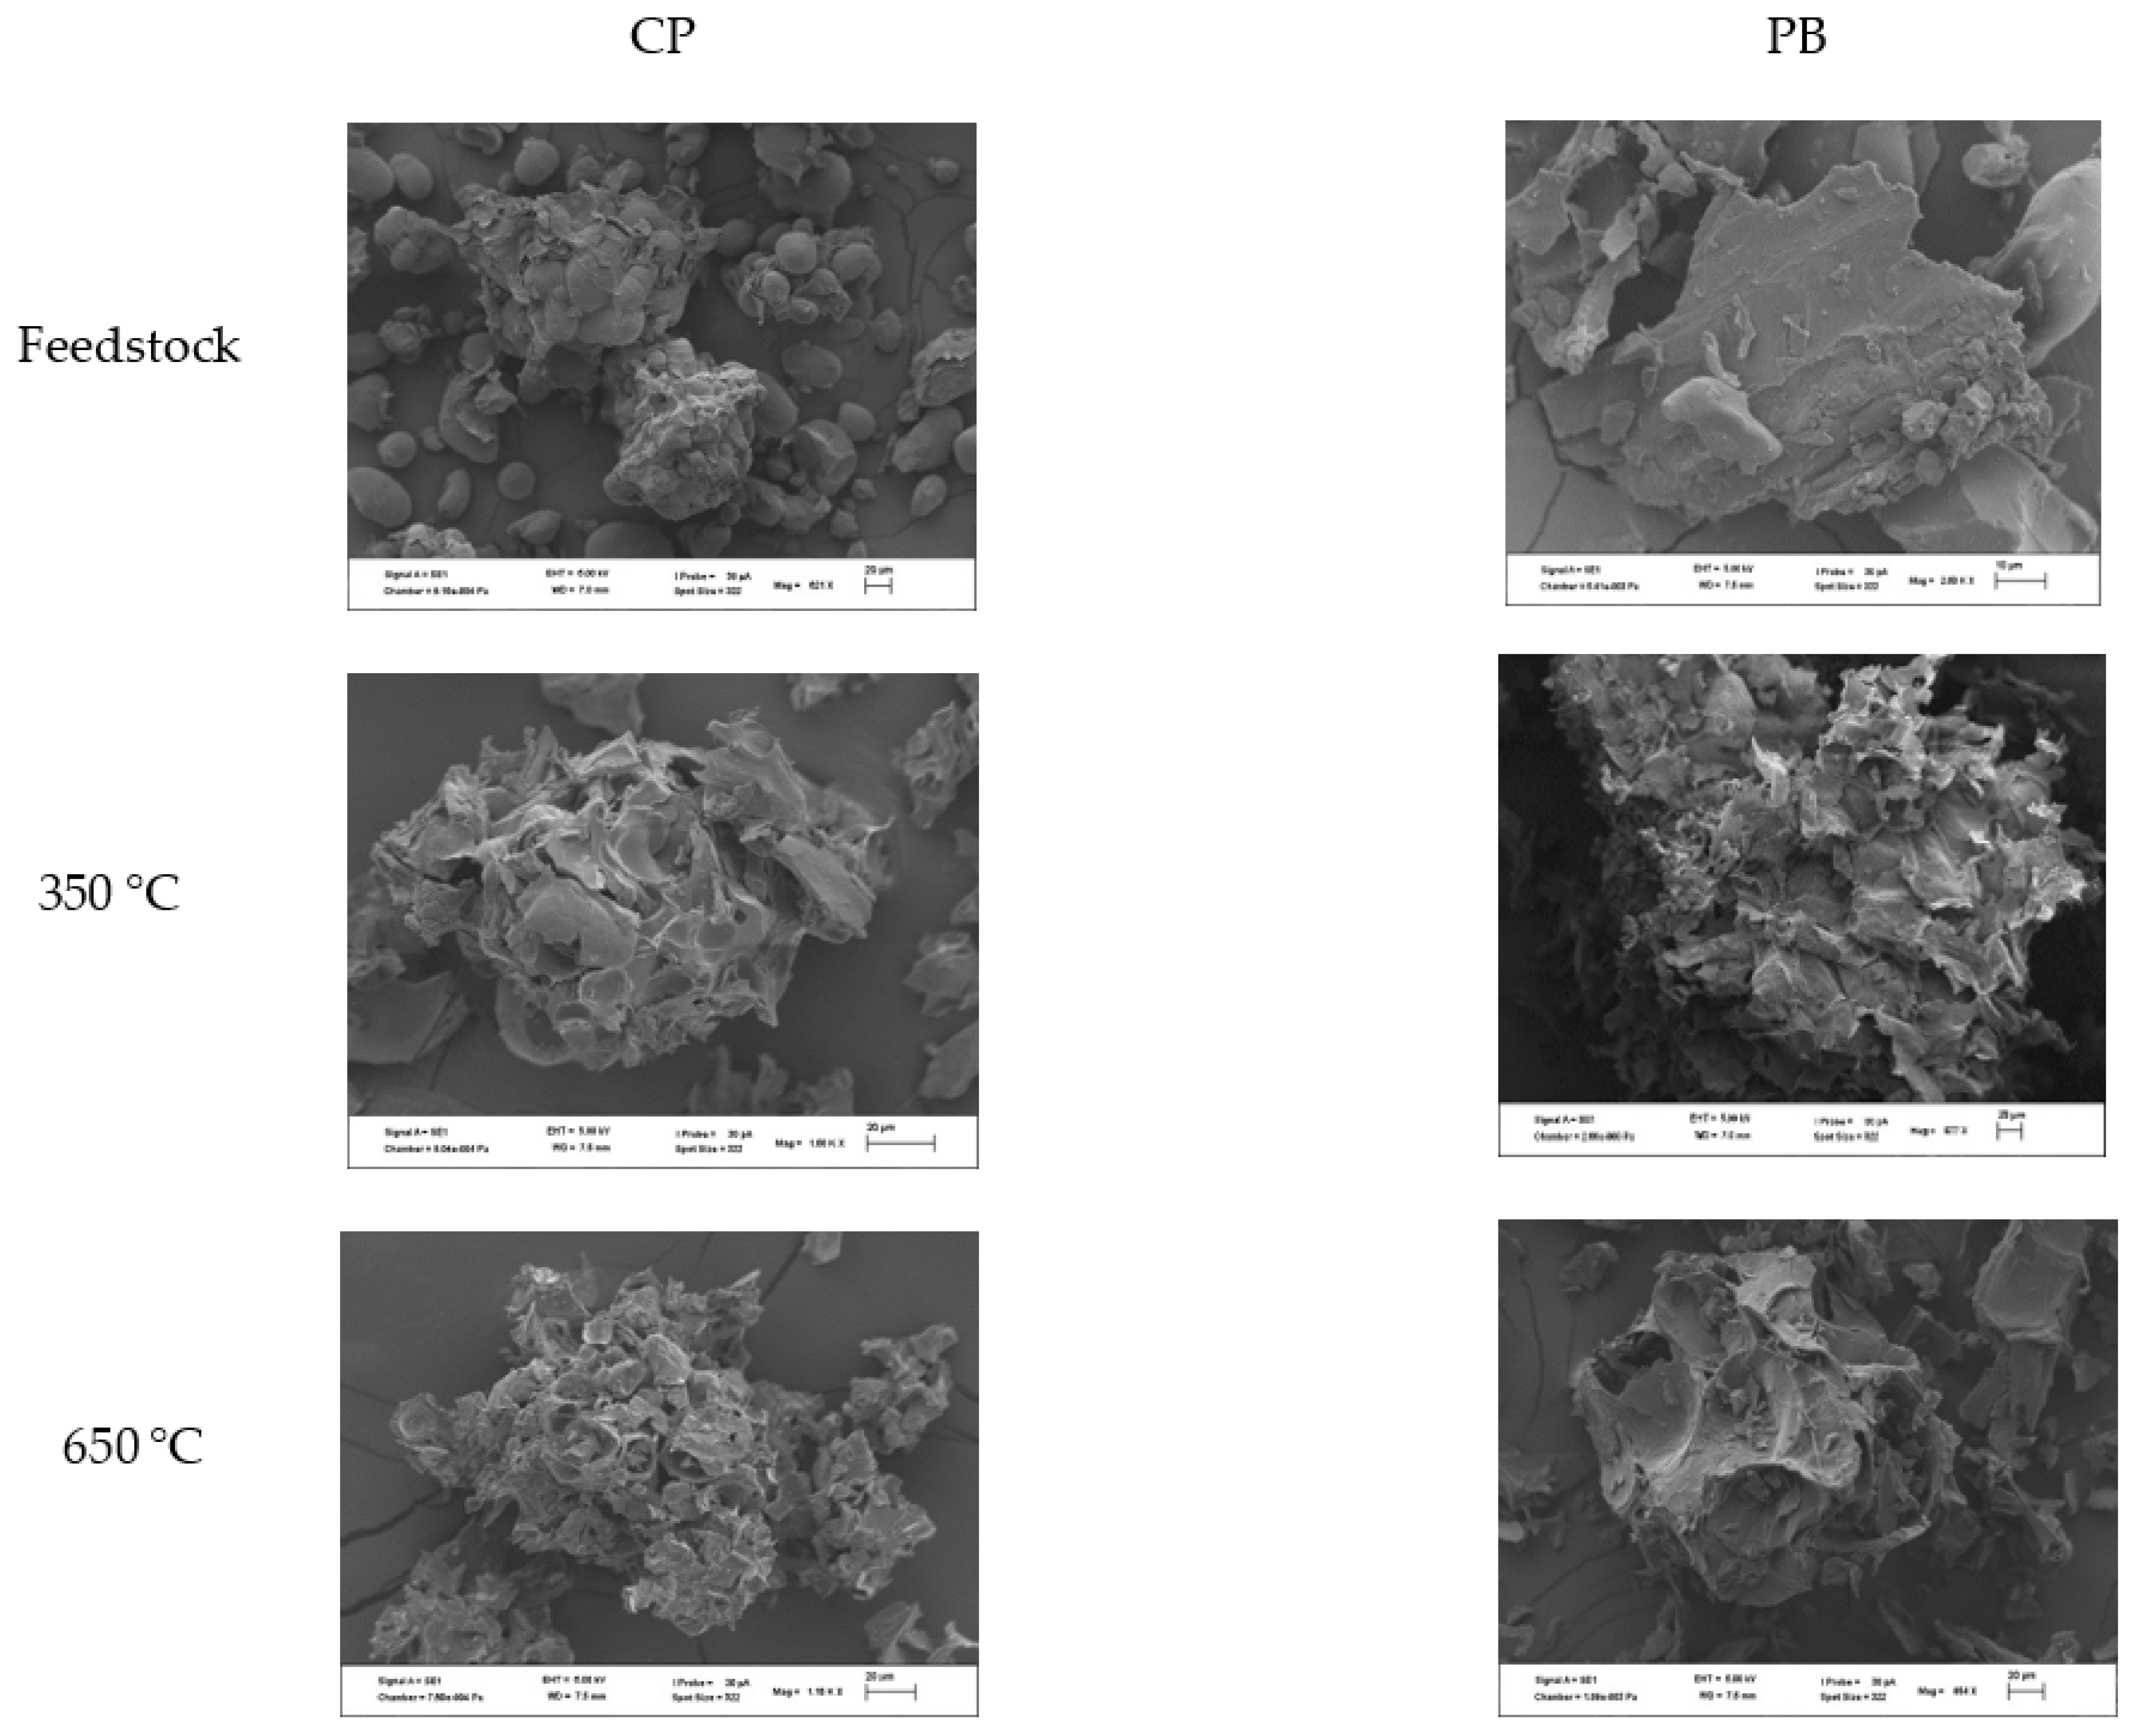
2.2. Biochar Production and Characterisation
2.3. Evolution of CO2-C from Soils Amended with Feedstocks and Biochar Types
2.4. Changes in Mineral Nitrogen, Phosphorus, and Potassium in Soils Amended with the Biochars
2.5. Analysis
2.6. Statistical Analysis
3. Results
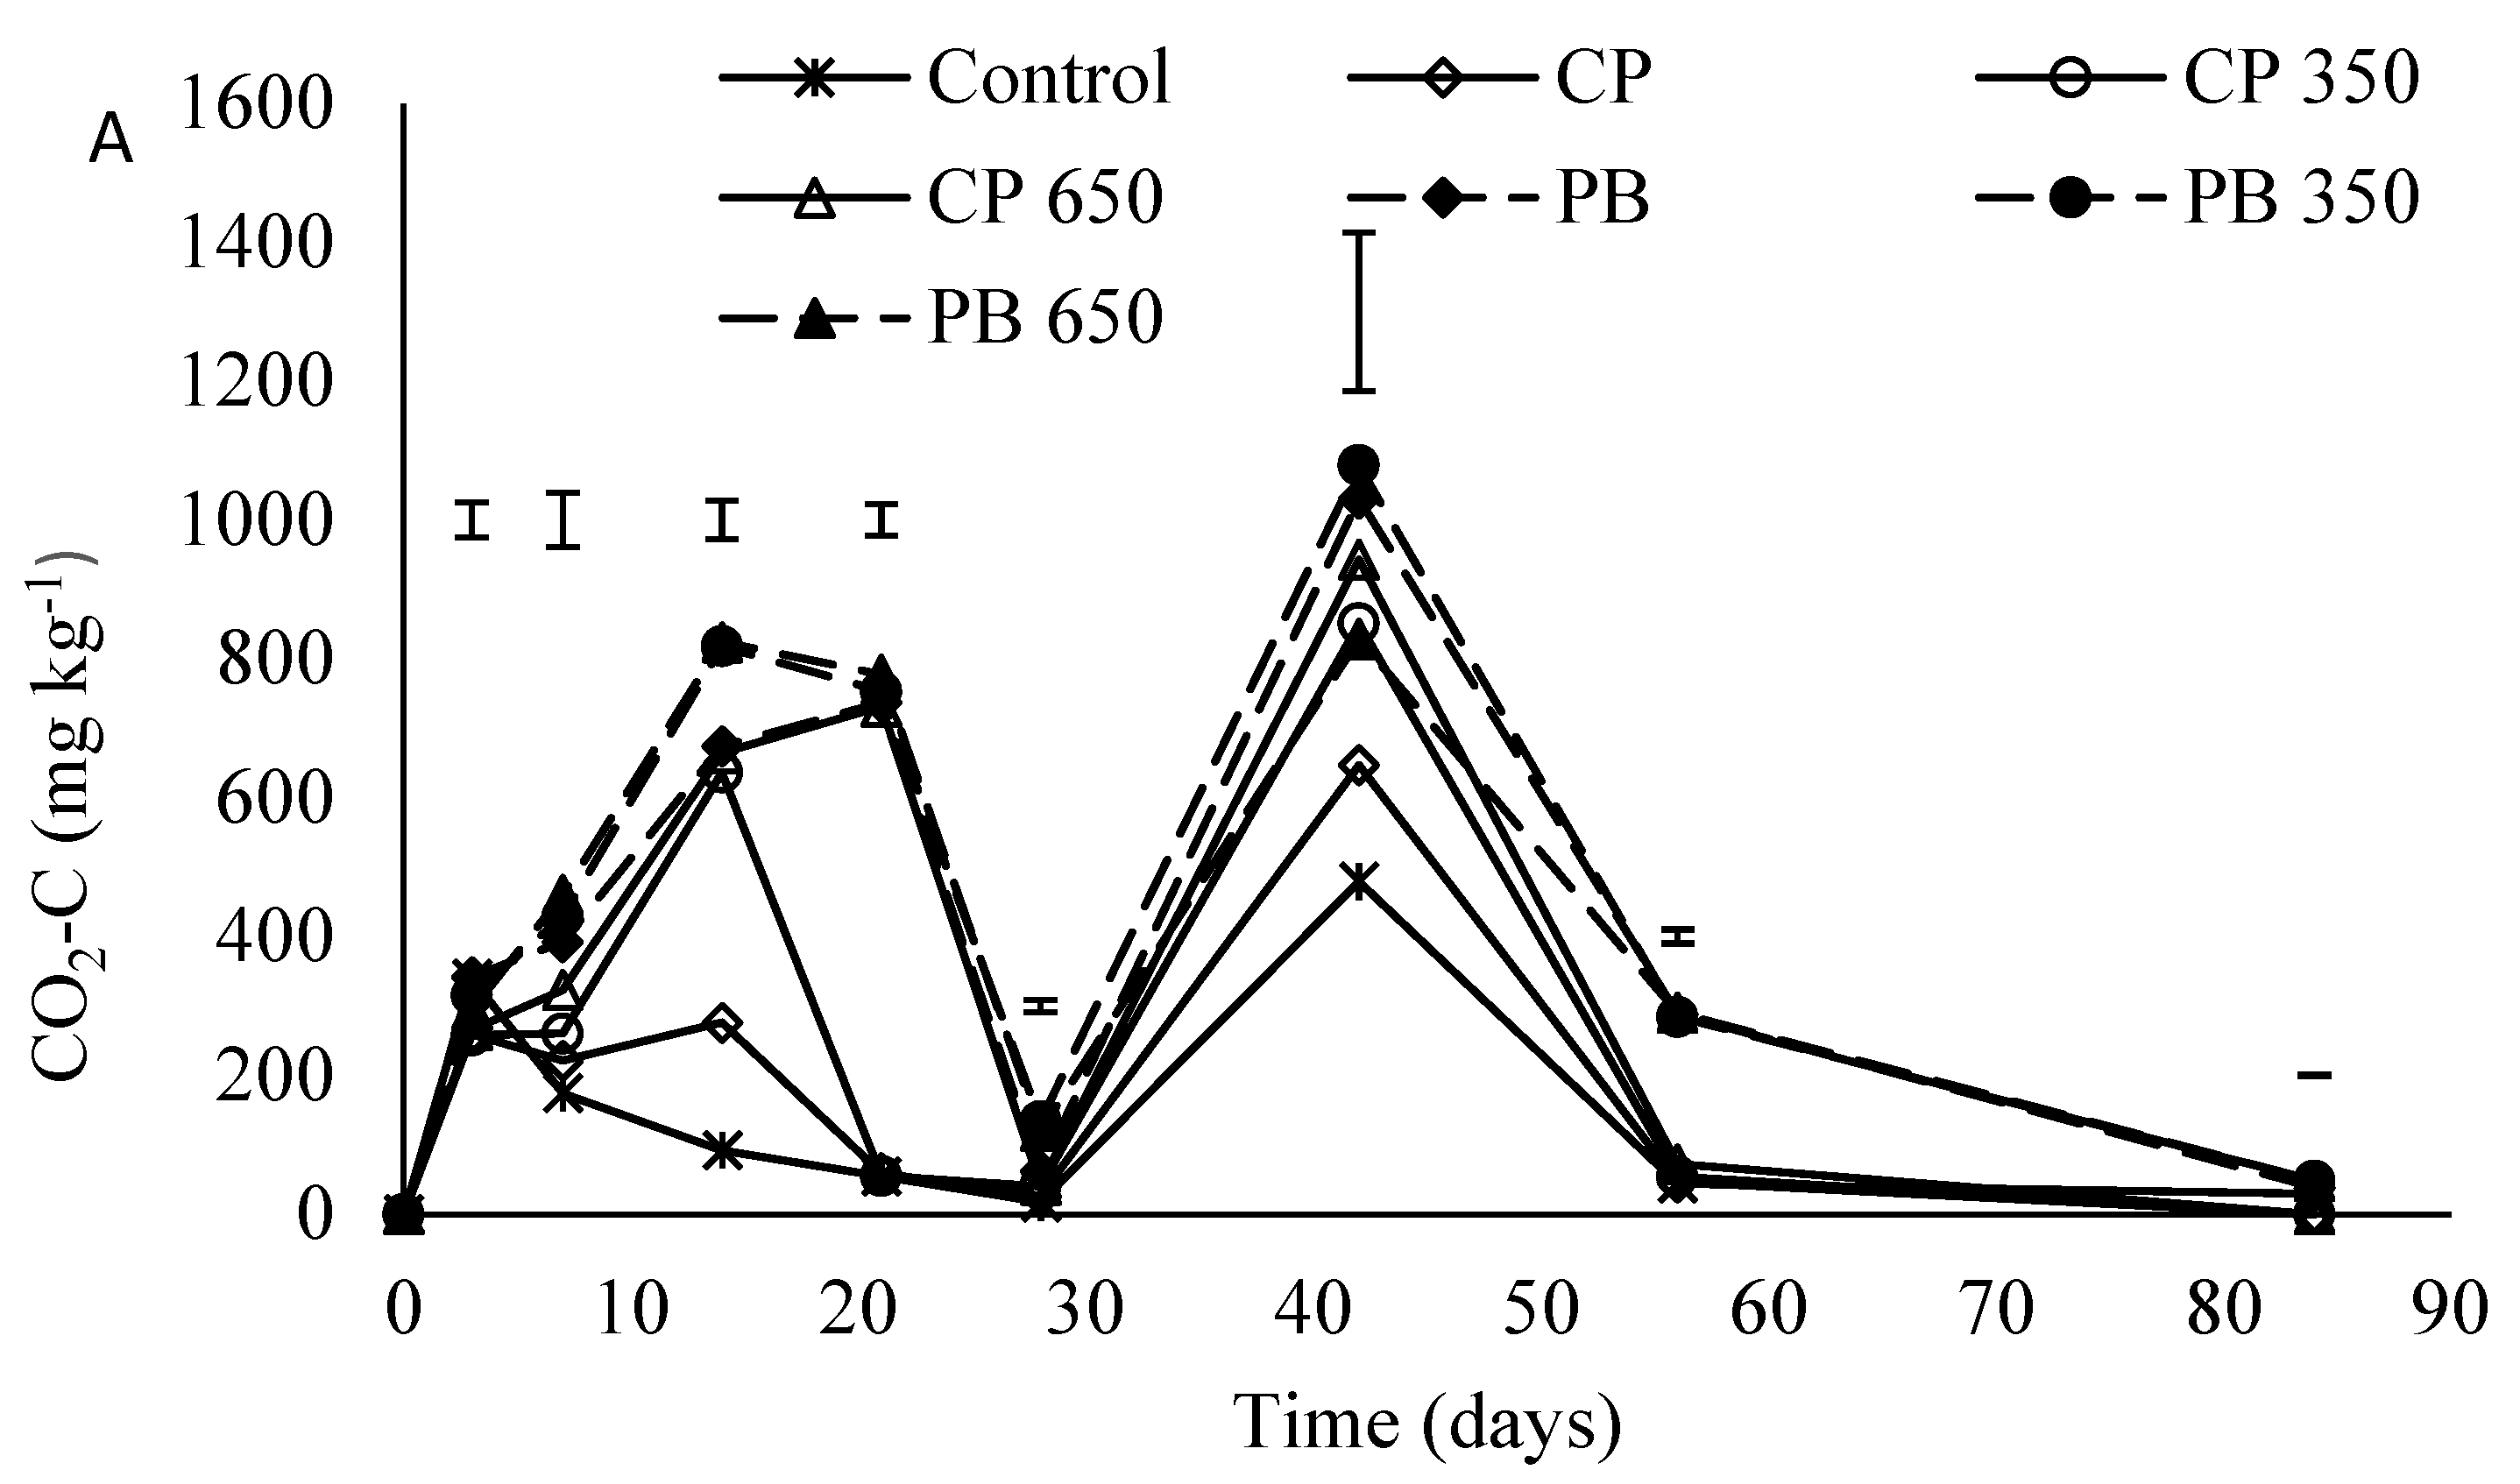
3.1. Carbon Dioxide Emissions (CO2-C)
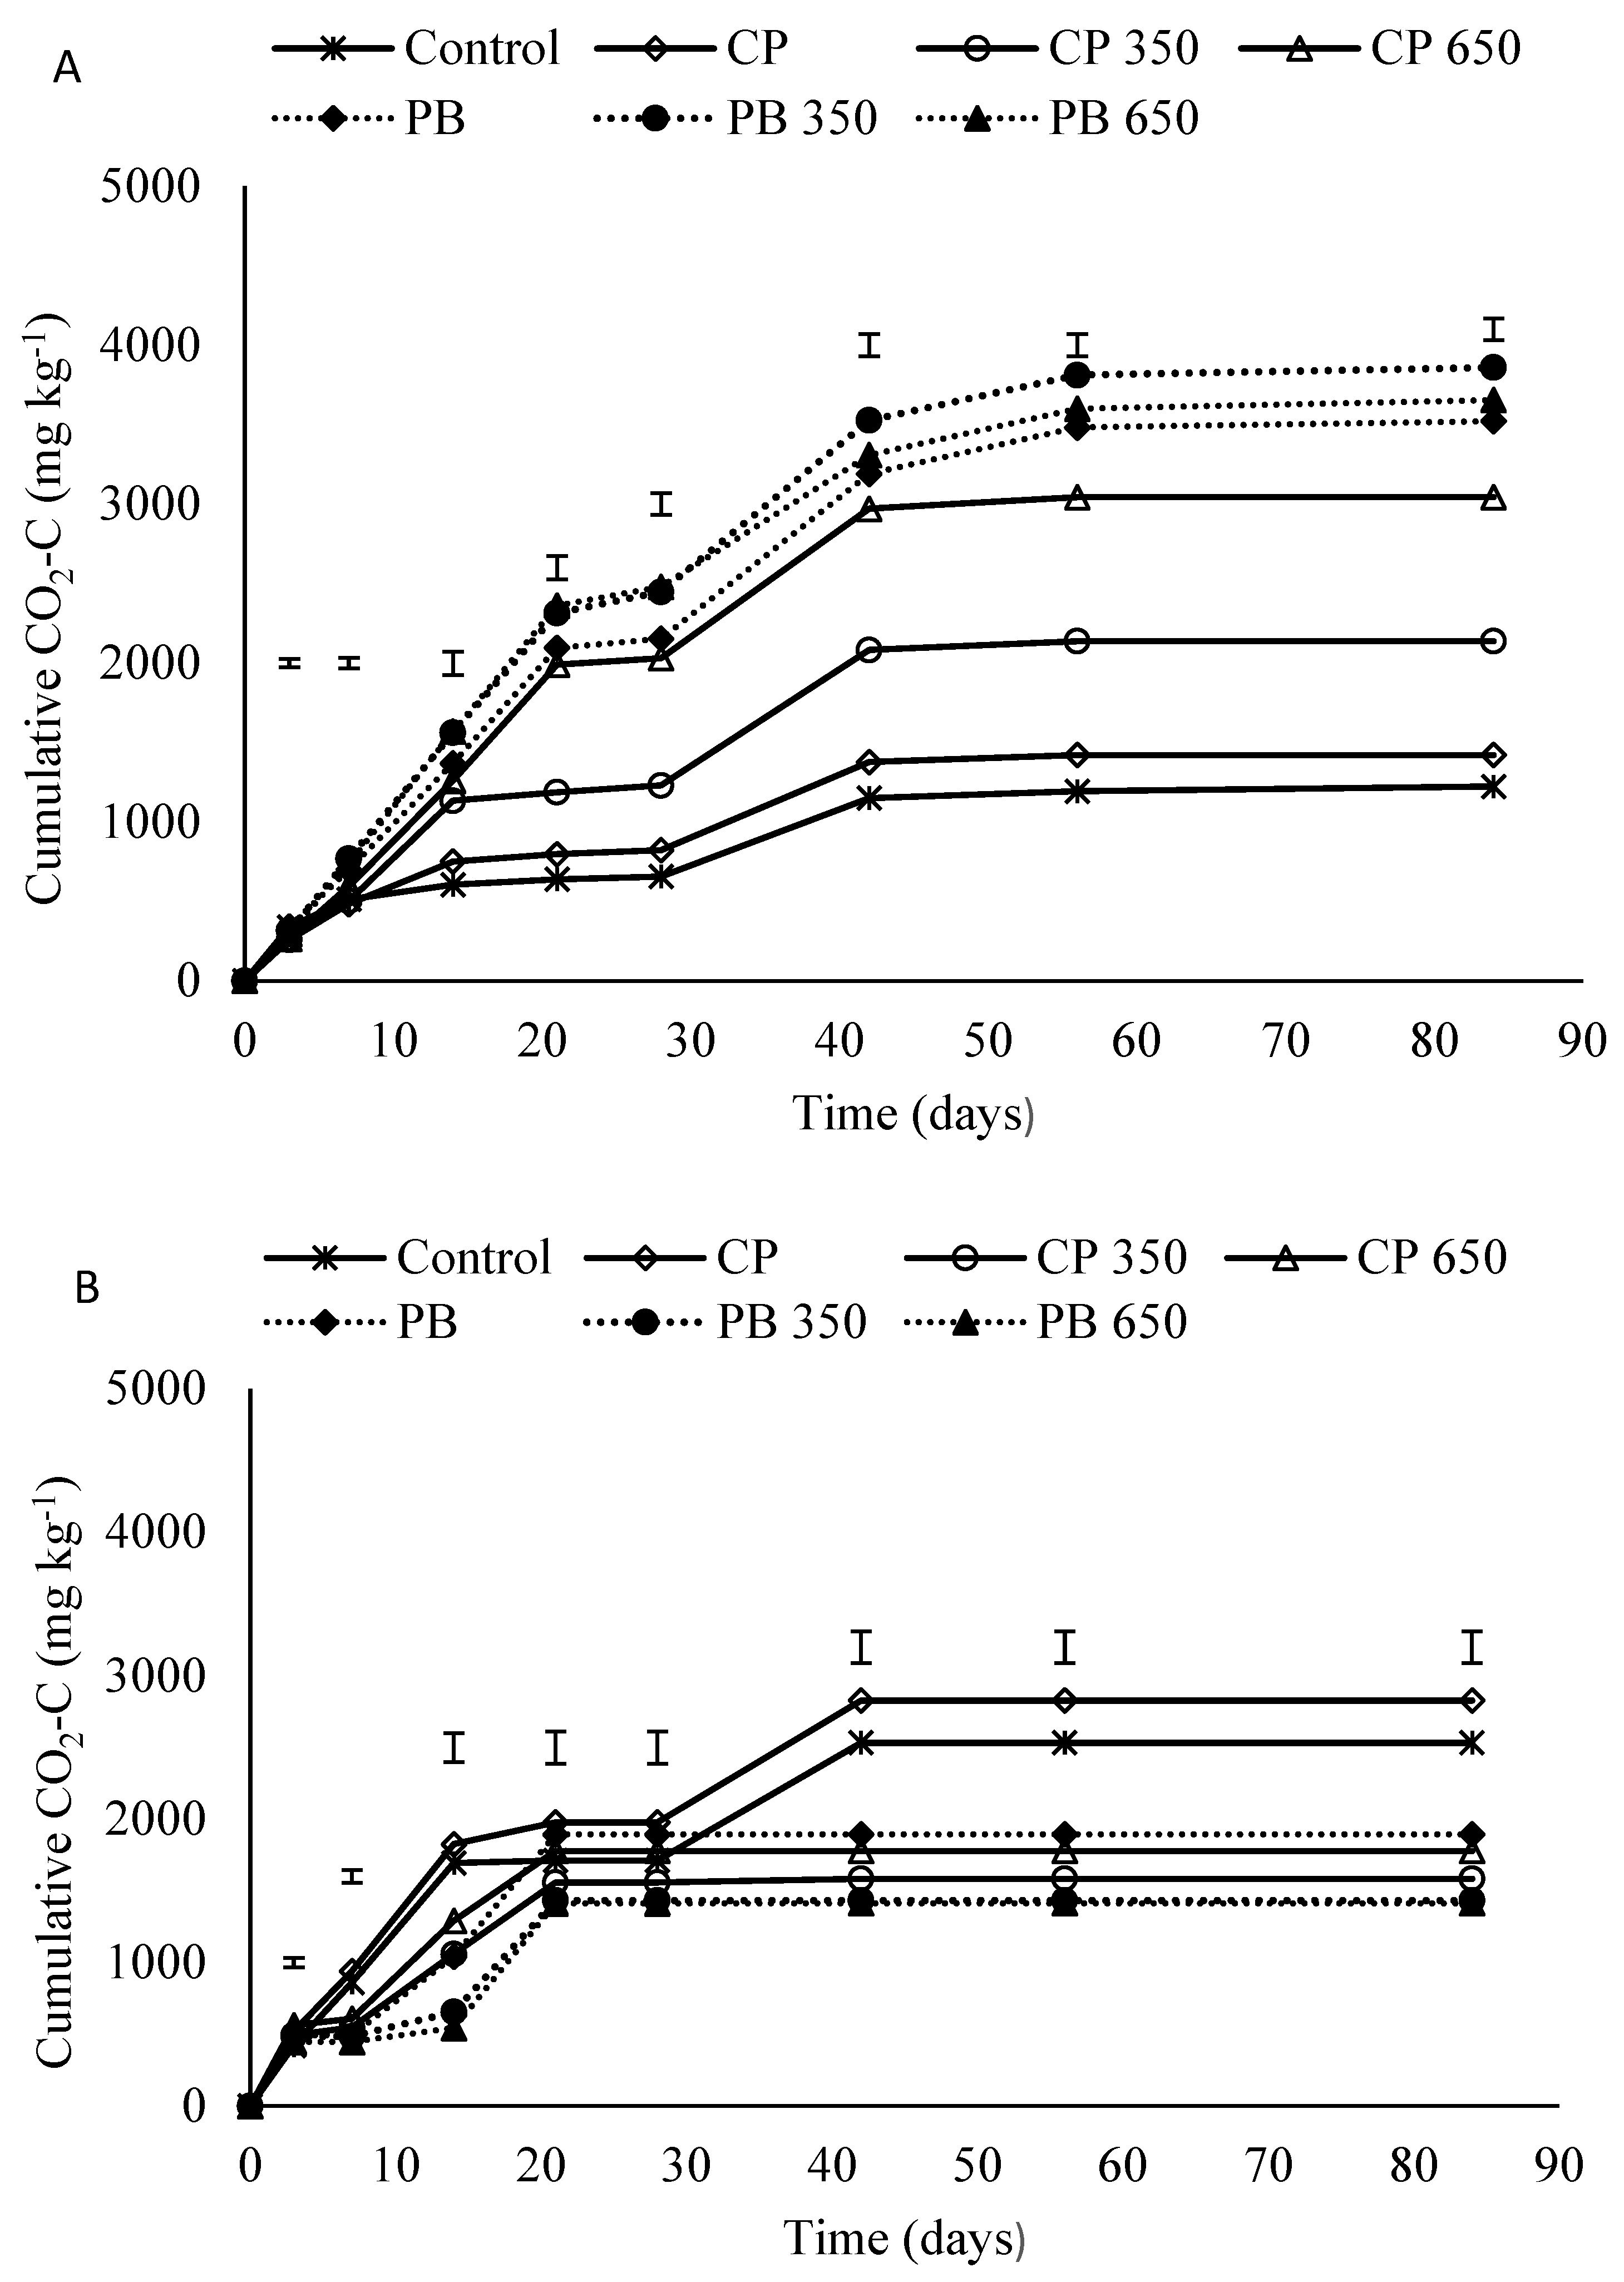
3.2. Cumulative Carbon Dioxide Emissions (CO2-C)
3.3. Ammonium-N Concentration
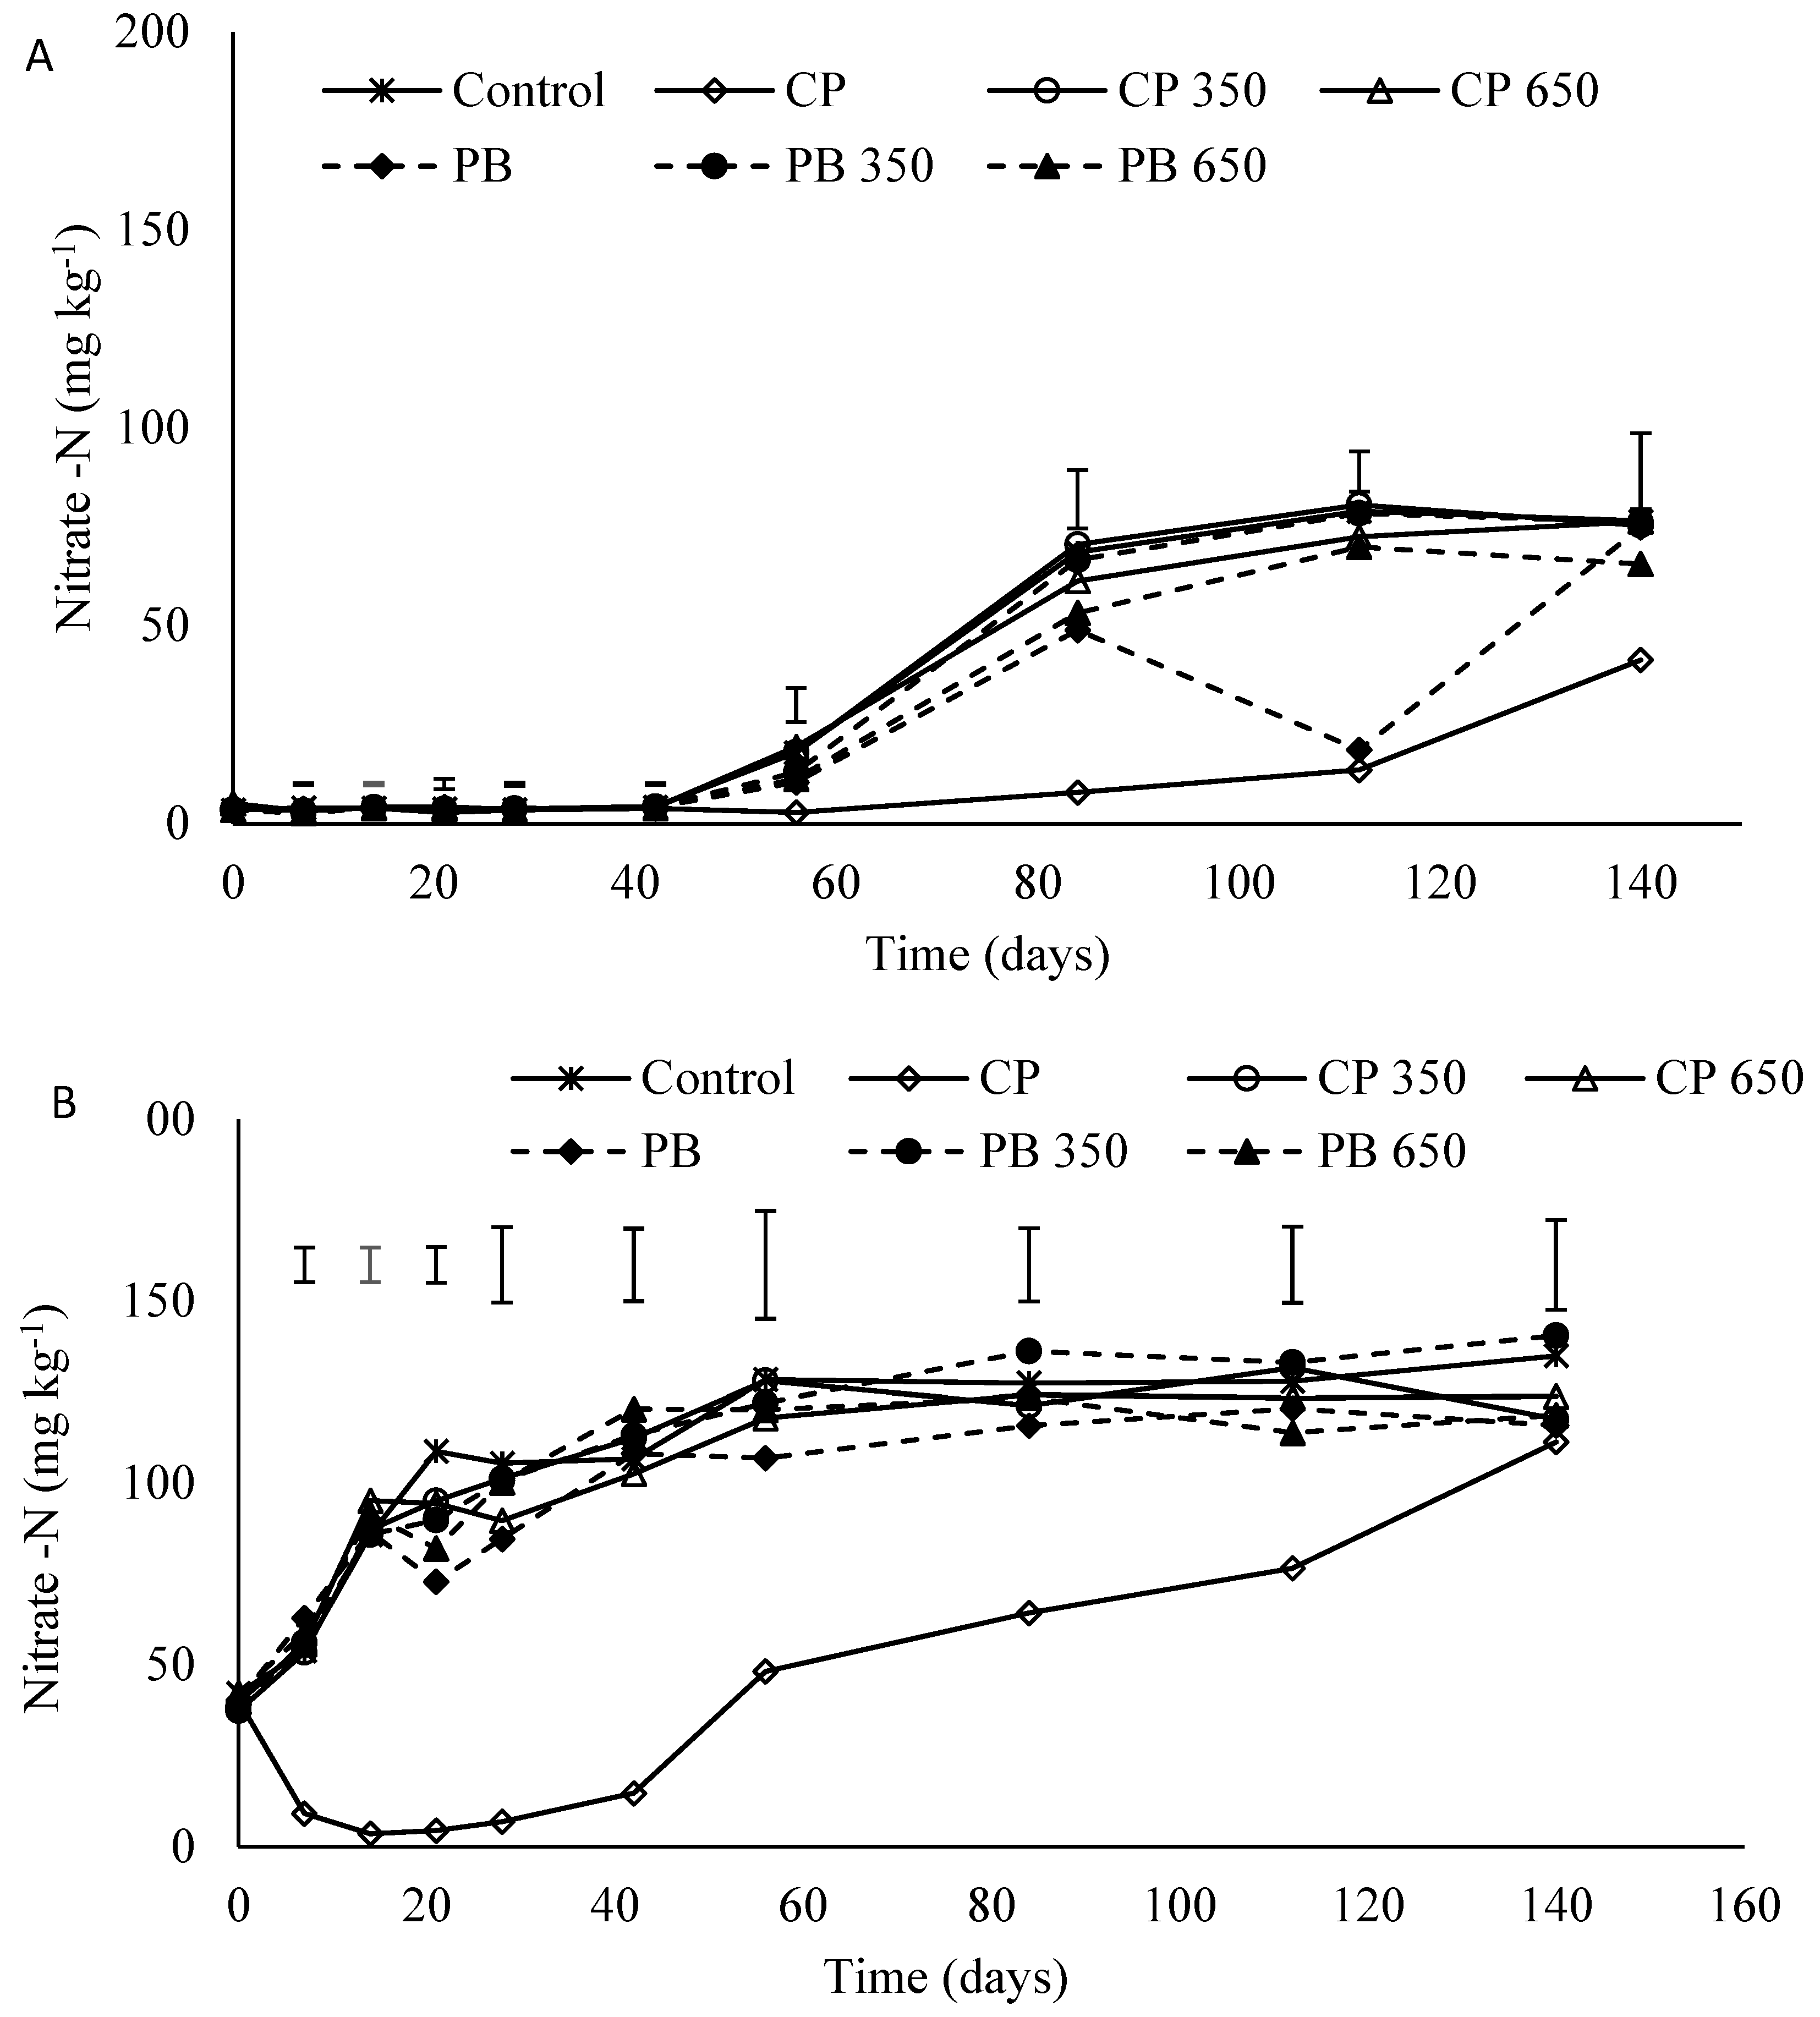
3.4. Nitrate-N Concentration
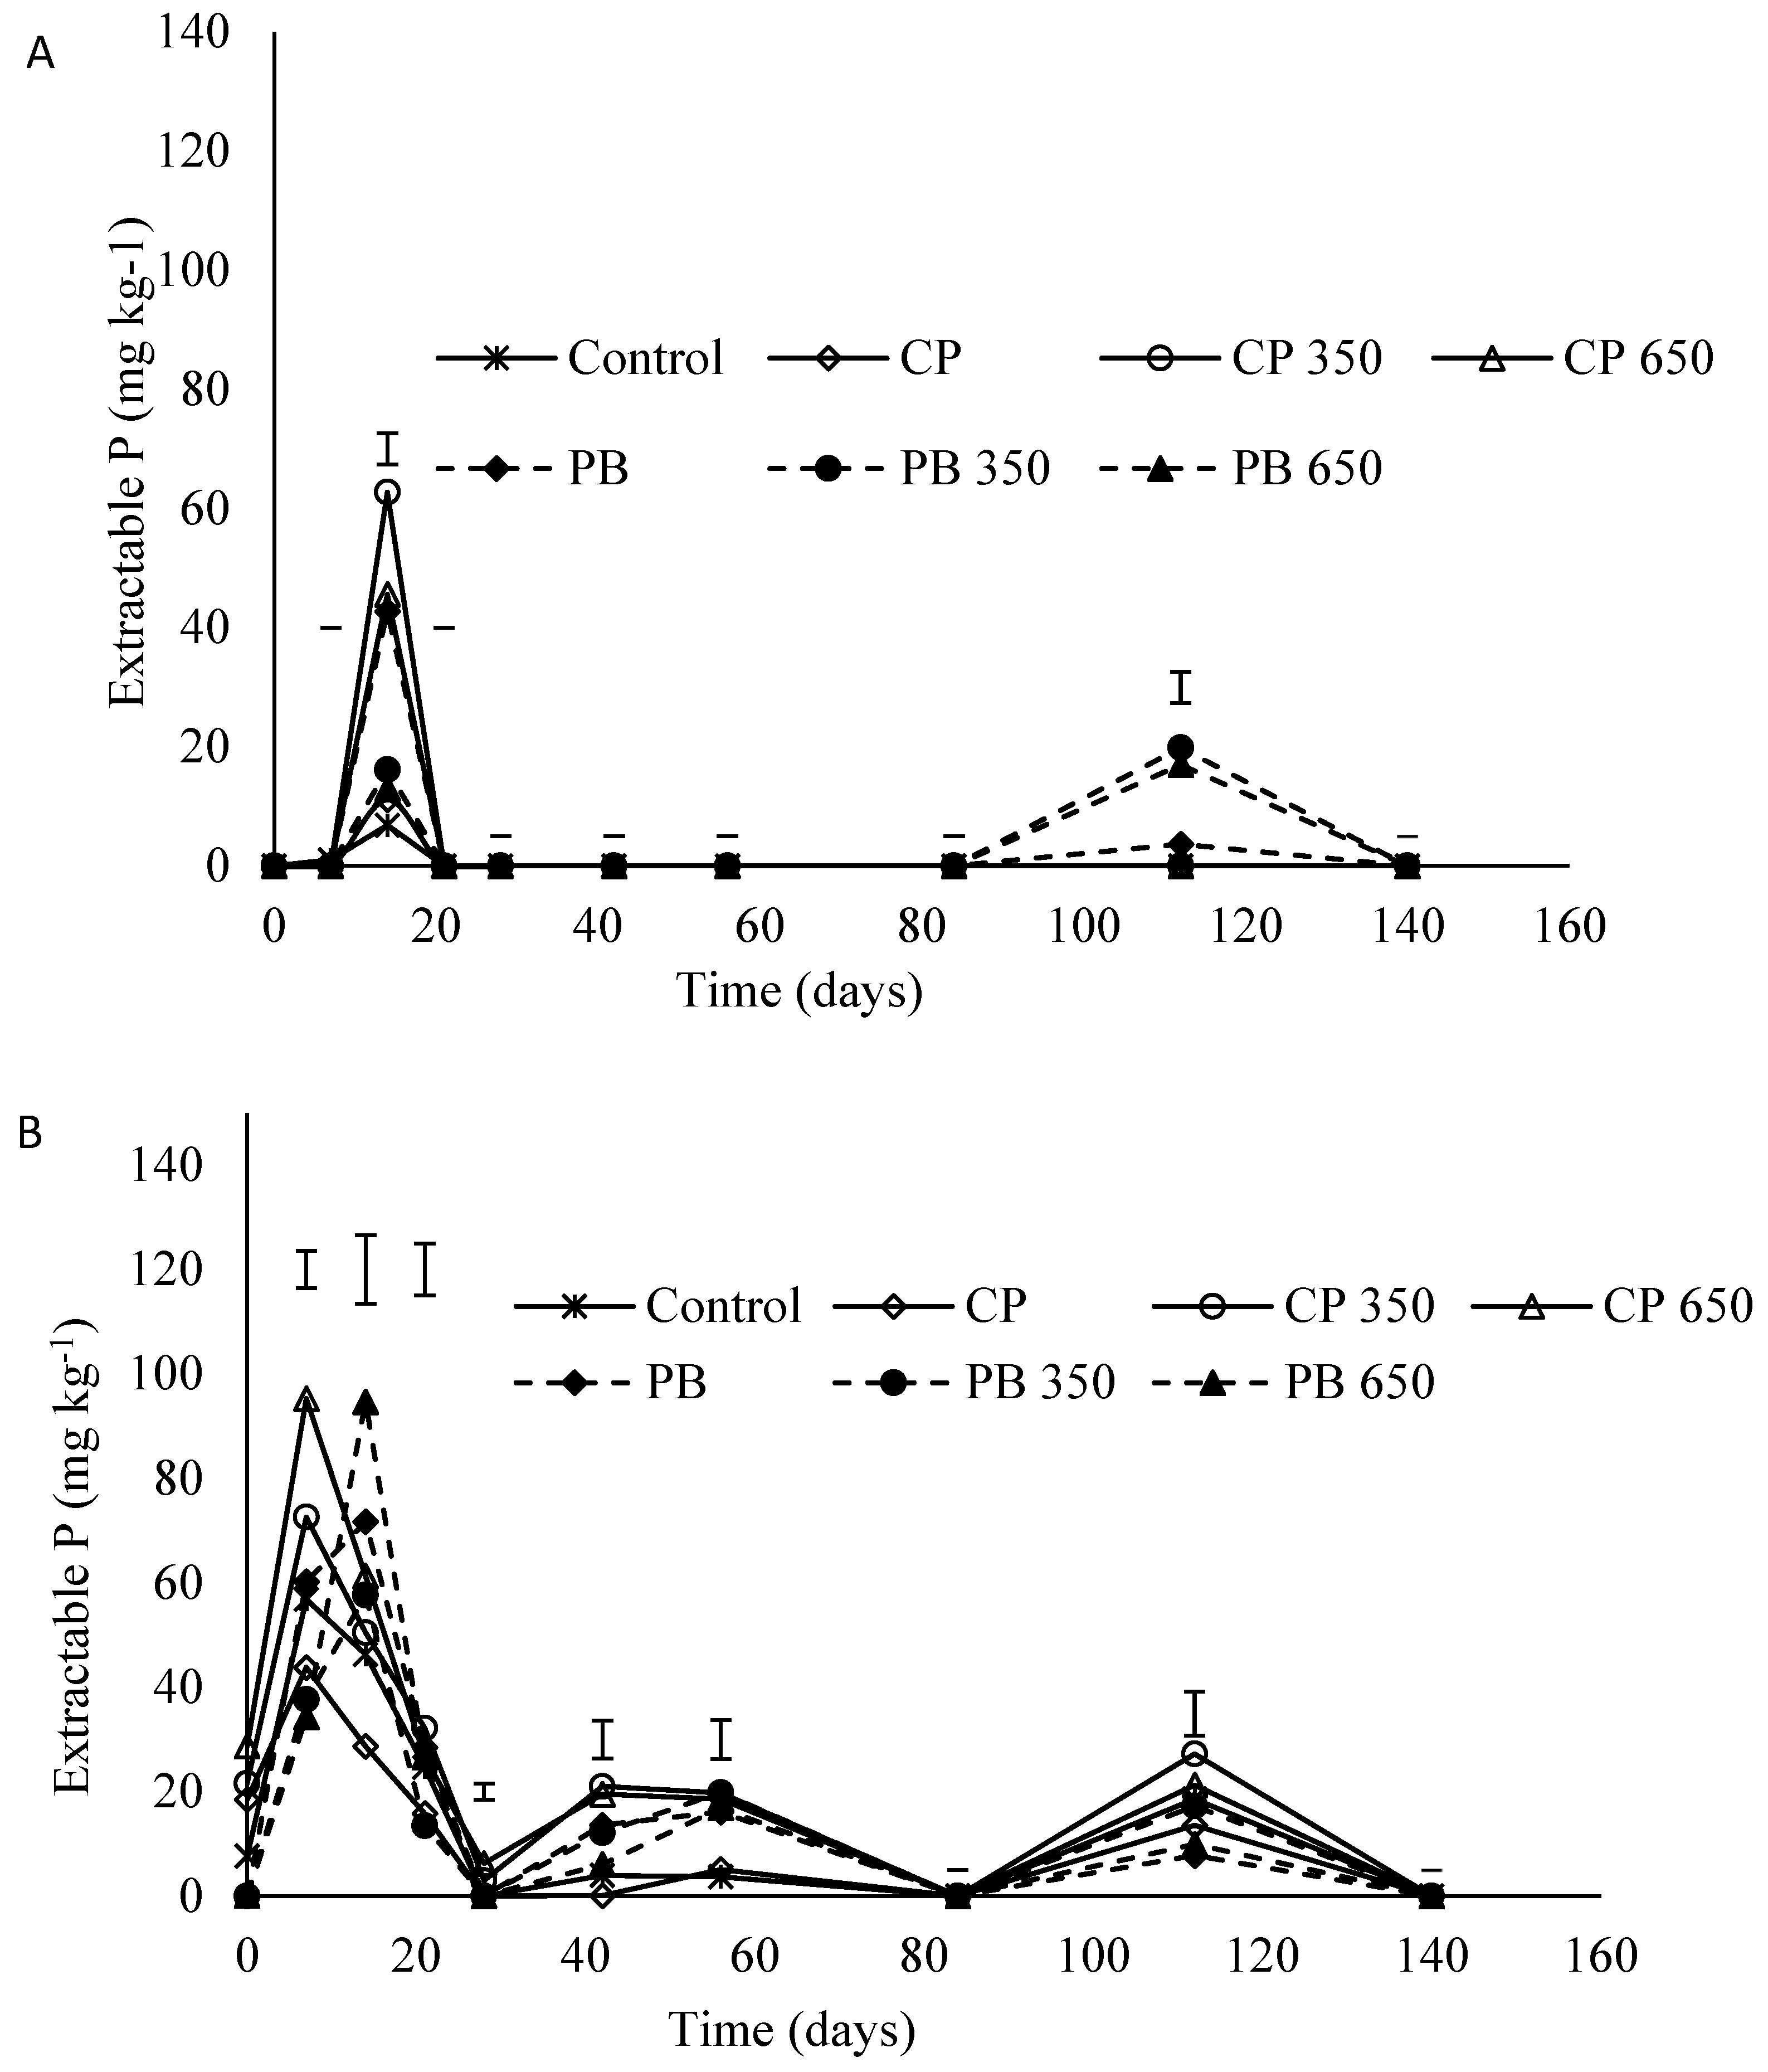
3.5. Extractable P
3.6. Extractable K
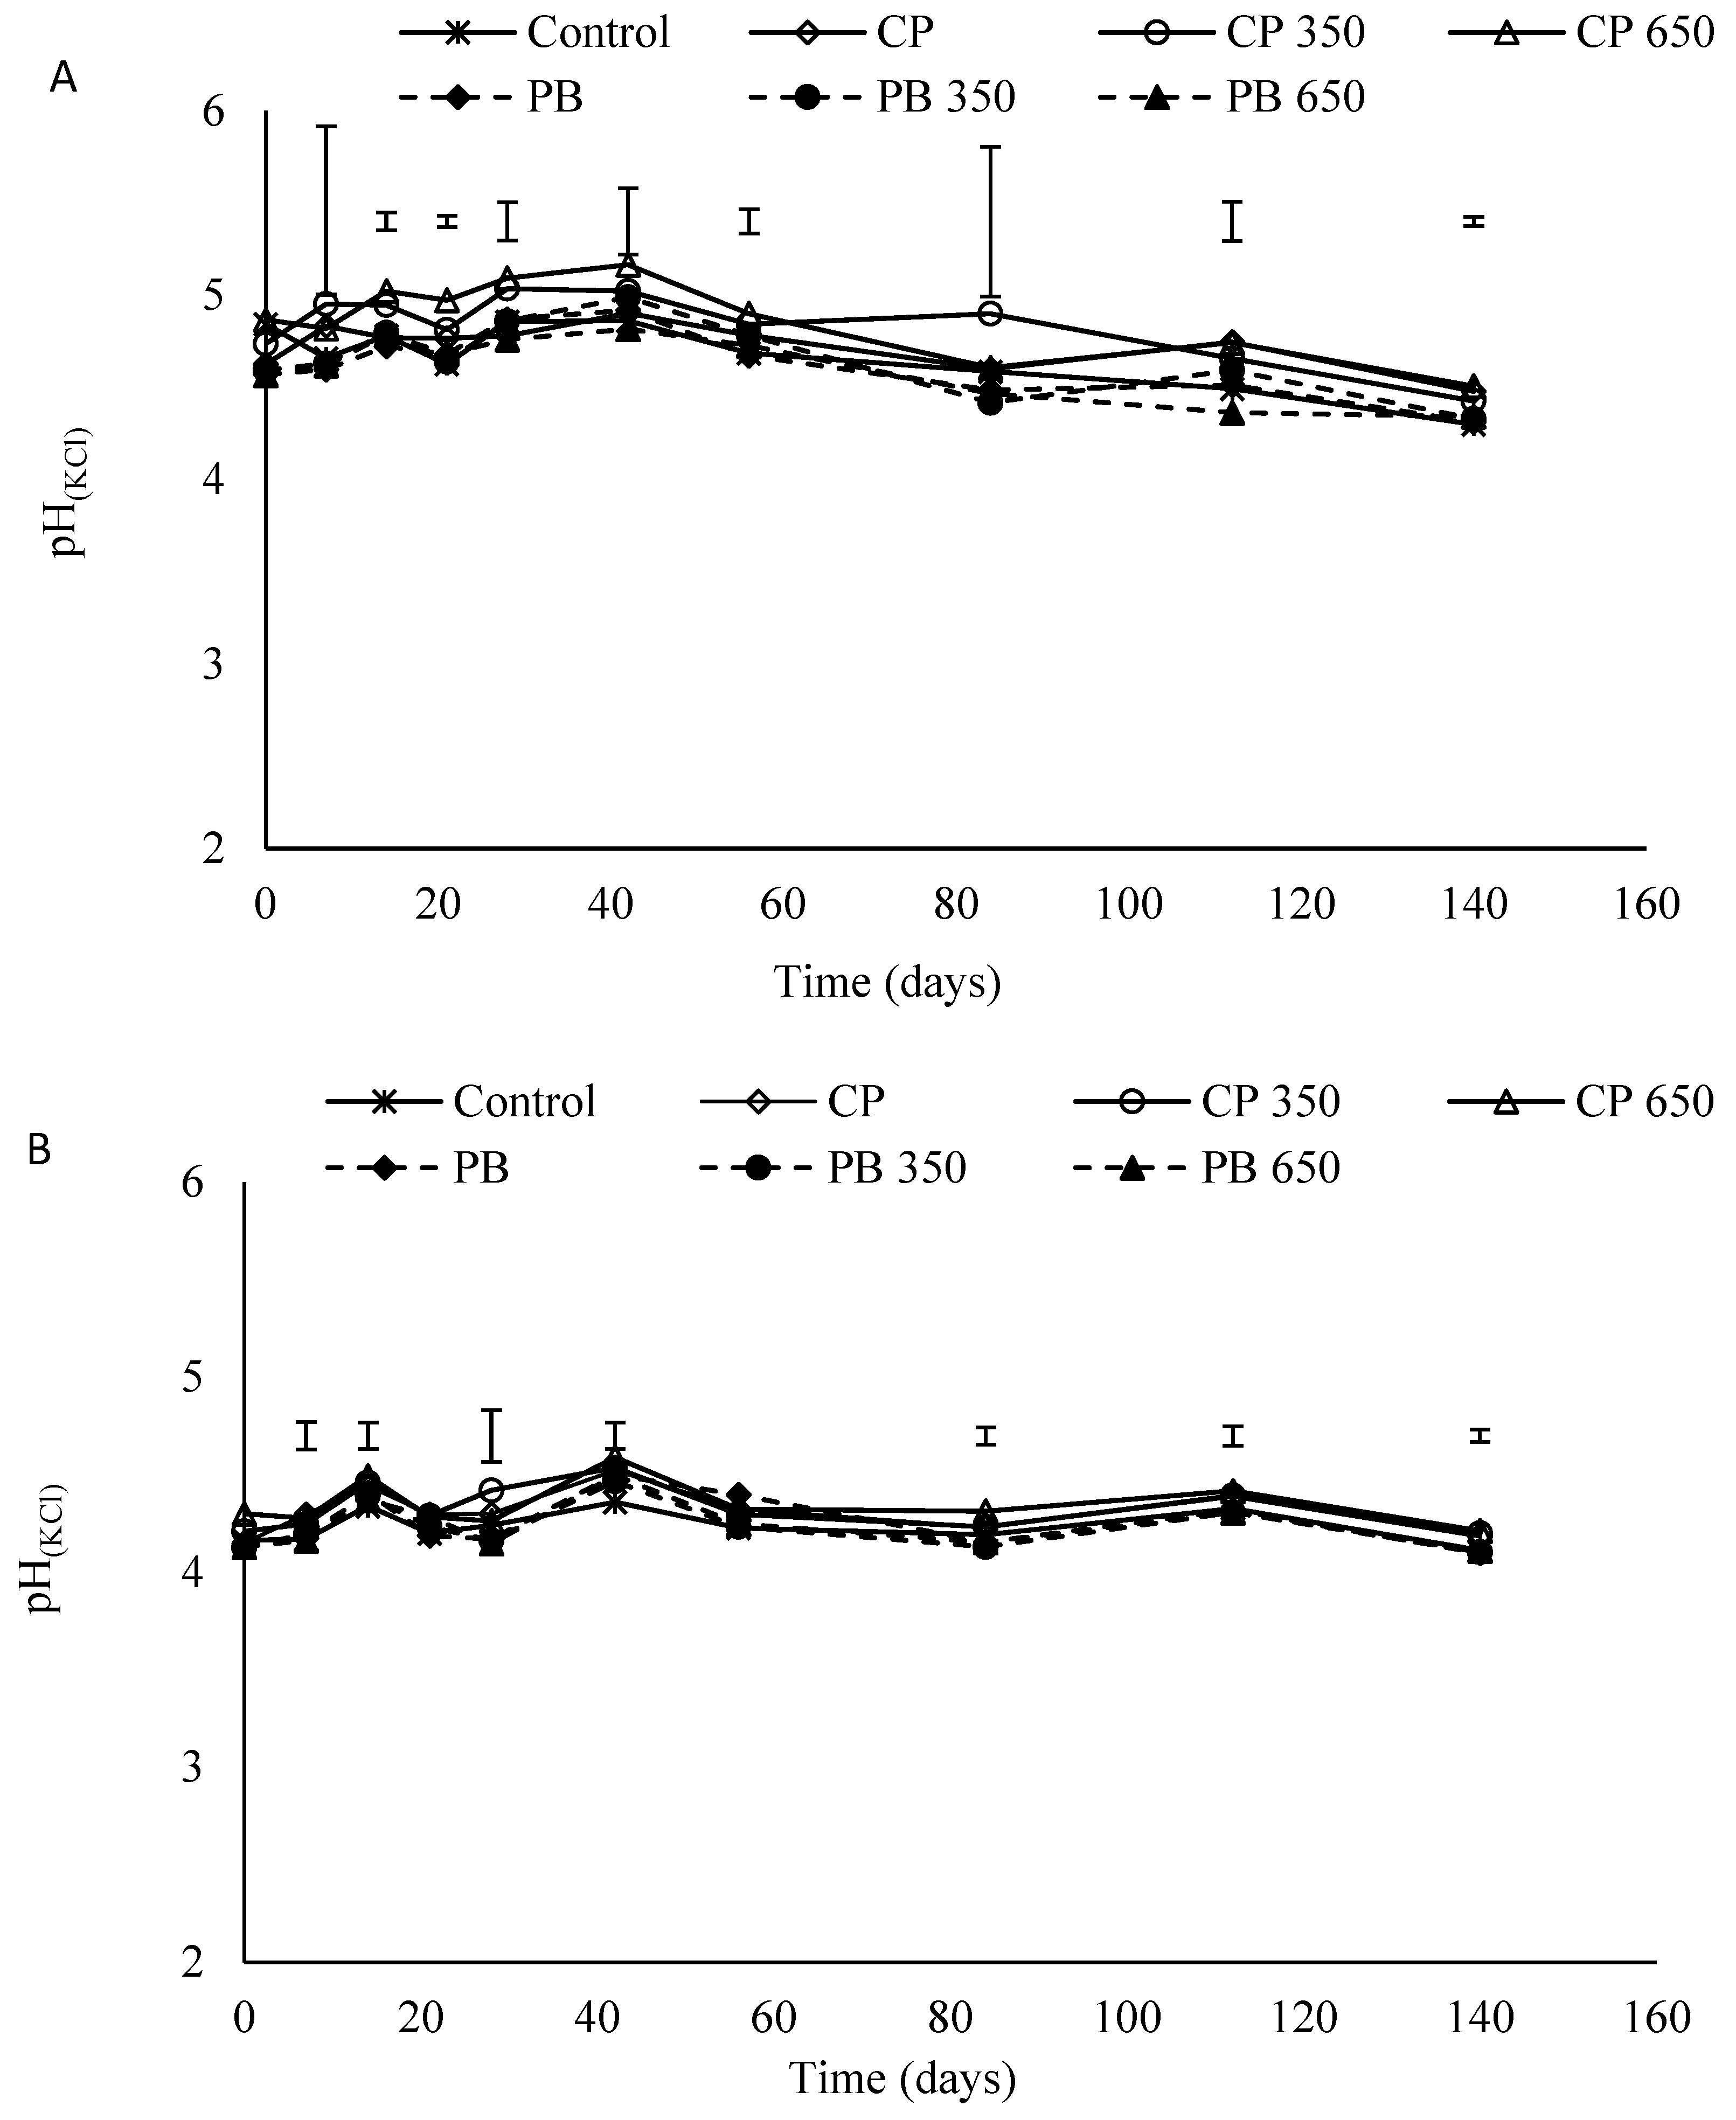
3.7. Soil pH
4. Discussion
5. Conclusions
Author Contributions
Funding
Institutional Review Board Statement
Informed Consent Statement
Data Availability Statement
Acknowledgments
Conflicts of Interest
References
- Sharma, B.; Vaish, B.; Singh, U.K.; Singh, P.; Singh, R.P. Recycling of organic wastes in agriculture: An environmental perspective. Int. J. Environ. Res. 2019, 13, 409–429. [Google Scholar] [CrossRef]
- Baldock, J.; Nelson, P. Soil Organic Matter. In Handbook of Soil Science; Sumner, M.E., Ed.; CRC Press LLC: Boca Raton, FL, USA, 2000; Section B; pp. 25–84. [Google Scholar]
- Larney, F.J.; Angers, D.A. The role of organic amendments in soil reclamation: A review. Can. J. Soil Sci. 2012, 92, 19–38. [Google Scholar] [CrossRef]
- Gugała, M.; Sikorska, A.; Zarzecka, K.; Kapela, K. Changes in the content of total nitrogen, phosphorus and potassium in potato tubers under the influence of the use of herbicides. J. Ecol. Eng. 2015, 16, 82–86. [Google Scholar] [CrossRef]
- Ghosh, B.; Dogra, P.; Sharma, N.; Bhattacharyya, R.; Mishra, P. Conservation agriculture impact for soil conservation in maize–wheat cropping system in the Indian sub-Himalayas. Int. Soil Water Conserv. Res. 2015, 3, 112–118. [Google Scholar] [CrossRef]
- Igalavithana, A.D.; Ok, Y.S.; Usman, A.R.; Al-Wabel, M.I.; Oleszczuk, P.; Lee, S.S. The effects of biochar amendment on soil fertility. Agric. Environ. Appl. Biochar Adv. Barriers 2016, 63, 123–144. [Google Scholar]
- Uzoma, K.C.; Inoue, M.; Andry, H.; Fujimaki, H.; Zahoor, A.; Nishihara, E. Effect of cow manure biochar on maize productivity under sandy soil condition. Soil Use Manag. 2011, 27, 205–212. [Google Scholar] [CrossRef]
- El-Naggar, A.; Lee, S.S.; Awad, Y.M.; Yang, X.; Ryu, C.; Rizwan, M.; Rinklebe, J.; Tsang, D.C.; Ok, Y.S. Influence of soil properties and feedstocks on biochar potential for carbon mineralization and improvement of infertile soils. Geoderma 2018, 332, 100–108. [Google Scholar] [CrossRef]
- Tomczyk, A.; Sokołowska, Z.; Boguta, P. Biochar physicochemical properties: Pyrolysis temperature and feedstock kind effects. Rev. Environ. Sci. Bio/Technol. 2020, 19, 191–215. [Google Scholar] [CrossRef]
- Liu, X.-Y.; Qu, J.-J.; Li, L.Q.; Zhang, A.-F.; Zhang, J.; Zheng, J.-W.; Pan, G.-X. Can biochar amendment be an ecological engineering technology to depress N2O emission in rice paddies?—A cross site field experiment from South China. Ecol. Eng. 2012, 42, 168–173. [Google Scholar] [CrossRef]
- Jones, D.L.; Rousk, J.; Edwards-Jones, G.; DeLuca, T.H.; Murphy, D.V. Biochar-mediated changes in soil quality and plant growth in a three year field trial. Soil Biol. Biochem. 2012, 45, 113–124. [Google Scholar] [CrossRef]
- Keith, A.; Singh, B.; Singh, B.P. Interactive priming of biochar and labile organic matter mineralization in a smectite-rich soil. Environ. Sci. Technol. 2011, 45, 9611–9618. [Google Scholar] [CrossRef] [PubMed]
- Kuzyakov, Y.; Friedel, J.; Stahr, K. Review of mechanisms and quantification of priming effects. Soil Biol. Biochem. 2000, 32, 1485–1498. [Google Scholar] [CrossRef]
- Zornoza, R.; Moreno-Barriga, F.; Acosta, J.; Muñoz, M.; Faz, A. Stability, nutrient availability and hydrophobicity of biochars derived from manure, crop residues, and municipal solid waste for their use as soil amendments. Chemosphere 2016, 144, 122–130. [Google Scholar] [CrossRef]
- Smith, J.L.; Collins, H.P.; Bailey, V.L. The effect of young biochar on soil respiration. Soil Biol. Biochem. 2010, 42, 2345–2347. [Google Scholar] [CrossRef]
- Sohi, S.P.; Krull, E.; Lopez-Capel, E.; Bol, R. A review of biochar and its use and function in soil. Adv. Agron. 2010, 105, 47–82. [Google Scholar] [CrossRef]
- Glaser, B.; Balashov, E.; Haumaier, L.; Guggenberger, G.; Zech, W. Black carbon in density fractions of anthropogenic soils of the Brazilian Amazon region. Org. Geochem. 2000, 31, 669–678. [Google Scholar] [CrossRef]
- Smider, B.; Singh, B. Agronomic performance of a high ash biochar in two contrasting soils. Agric. Ecosyst. Environ. 2014, 191, 99–107. [Google Scholar] [CrossRef]
- Wang, L.; Butterly, C.R.; Wang, Y.; Herath, H.M.S.K.; Xi, Y.G.; Xiao, X.J. Effect of crop residue biochar on soil acidity amelioration in strongly acidic tea garden soils. Soil Use Manag. 2014, 30, 119–128. [Google Scholar] [CrossRef]
- Rawat, J.; Saxena, J.; Sanwal, P. Biochar: A Sustainable Approach for Improving Plant Growth and Soil Properties. In Biochar—An Imperative Amendment for Soil and the Environment; IntechOpen: London, UK, 2019; pp. 1–17. [Google Scholar] [CrossRef]
- Dume, B.; Berecha, G.; Tulu, S. Characterization of Biochar Produced at Different Temperatures and its Effect on Acidic Nitosol of Jimma, Southwest Ethiopia. Int. J. Soil Sci. 2015, 10, 63–73. [Google Scholar] [CrossRef]
- Shafie, S.T.; Salleh, M.M.; Hang, L.L.; Rahman, M.; Ghani, W. Effect of pyrolysis temperature on the biochar nutrient and water retention capacity. J. Purity Util. React. Environ. 2012, 1, 293–307. [Google Scholar]
- Vilakazi, S.P. Characterisation of Potato Waste Biochars and Effect on Carbon Dioxide Emission, Liming Potential and Availability of Primary Macro-Nutrients of Two Amended Contrasting Soils. Ph.D. Dissertation, University of KwaZulu-Natal, Pietermaritzburg, South Africa, 2021. [Google Scholar]
- Angst, T.E.; Sohi, S.P. Establishing release dynamics for plant nutrients from biochar. GCB Bioenergy 2013, 5, 221–226. [Google Scholar] [CrossRef]
- Group, S.C.W. Soil Classification: A Taxonomic System for South Africa; Department of Agricultural Development: Pretoria, South Africa, 1991. [Google Scholar]
- Fey, M. Soils of South Africa; Cambridge University Press: Cape Town, South Africa, 2010. [Google Scholar]
- Non-Affiliated Soil Analysis Work Committee. Handbook of standard soil testing methods for advisory purposes. Soil Sci. Soc. South Afr. Pretoria 1990, 160, 10. [Google Scholar]
- Manson, A.; Miles, N.; Farina, M. The Cedara Computerized Fertilizer Advisory Service (FertRec): Explanatory Notes and Crop and Soil Norms; KwaZulu-Natal Department of Agriculture and Environmental Affairs: Pietermaritzburg, South Africa, 2012. [Google Scholar]
- Murphy, J.A.; Riley, J.P. A modified single solution method for the determination of phosphate in natural waters. Anal. Chim. Acta 1962, 27, 31–36. [Google Scholar] [CrossRef]
- Vilakazi, B.S.; Zengeni, R.; Mafongoya, P. Tillage and Urea Fertilizer Application Impacts on Soil C Fractions and Sequestration. Agronomy 2022, 12, 1725. [Google Scholar] [CrossRef]
- Lourenzi, C.R.; Ceretta, C.A.; Da Silva, L.S.; Trentin, G.; Girotto, E.; Lorensini, F.; Tiecher, T.L.; Brunetto, G. Soil chemical properties related to acidity under successive pig slurry application. Rev. Bras. Ciência Do Solo 2011, 35, 1827–1836. [Google Scholar] [CrossRef]
- Koetlisi, A.; Muchaonyerwa, P. Pyrolysis temperature effects oy yield, physico-chemical characteristics of pine-bark biochars and cadmium sorption. Indian J. Environ. Prot 2018, 38, 197–212. [Google Scholar]
- Singh, B.; Dolk, M.M.; Shen, Q.; Camps-Arbestain, M. Biochar pH, Electrical Conductivity and Liming Potential; Biochar: A Guide to Analytical Methods; CSIRO Publishing Australia: Clayton South, Australia, 2017; pp. 23–38. [Google Scholar]
- Franzluebbers, A.J.; Haney, R.L.; Honeycutt, C.W.; Schomberg, H.H.; Hons, F.M. Flush of carbon dioxide following rewetting of dried soil relates to active organic pools. Soil Sci. Soc. Am. J. 2000, 64, 613–623. [Google Scholar] [CrossRef]
- Rayment, G.E.; Lyons, D.J. Soil Chemical Methods: Australasia; CSIRO Publishing: Collingwood, Australia, 2011. [Google Scholar]
- Iovieno, P.; Bååth, E. Effect of drying and rewetting on bacterial growth rates in soil. FEMS Microbiol. Ecol. 2008, 65, 400–407. [Google Scholar] [CrossRef]
- Miller, A.E.; Schimel, J.P.; Meixner, T.; Sickman, J.O.; Melack, J.M. Episodic rewetting enhances carbon and nitrogen release from chaparral soils. Soil Biol. Biochem. 2005, 37, 2195–2204. [Google Scholar] [CrossRef]
- Bruun, S.; Clauson-Kaas, S.; Bobuľská, L.; Thomsen, I.K. Carbon dioxide emissions from biochar in soil: Role of clay, microorganisms and carbonates. Eur. J. Soil Sci. 2014, 65, 52–59. [Google Scholar] [CrossRef]
- Chintala, R.; Mollinedo, J.; Schumacher, T.E.; Malo, D.D.; Julson, J.L. Effect of biochar on chemical properties of acidic soil. Arch. Agron. Soil Sci. 2014, 60, 393–404. [Google Scholar] [CrossRef]
- Ippolito, J.A.; Laird, D.A.; Busscher, W.J. Environmental benefits of biochar. J. Environ. Qual. 2012, 41, 967–972. [Google Scholar] [CrossRef]
- Fang, Y.; Singh, B.; Krull, E. Biochar carbon stability in four contrasting soils. Eur. J. Soil Sci. 2014, 65, 60–71. [Google Scholar] [CrossRef]
- Brodowski, S.; Amelung, W.; Haumaier, L.; Abetz, C.; Zech, W. Morphological and chemical properties of black carbon in physical soil fractions as revealed by scanning electron microscopy and energy-dispersive X-ray spectroscopy. Geoderma 2005, 128, 116–129. [Google Scholar] [CrossRef]
- Gu, B.; Schmitt, J.; Chen, Z.; Liang, L.; McCarthy, J.F. Adsorption and desorption of natural organic matter on iron oxide: Mechanisms and models. Environ. Sci. Technol. 1994, 28, 38–46. [Google Scholar] [CrossRef] [PubMed]
- Cheng, C.-H.; Lehmann, J.; Thies, J.E.; Burton, S.D.; Engelhard, M.H. Oxidation of black carbon by biotic and abiotic processes. Org. Geochem. 2006, 37, 1477–1488. [Google Scholar] [CrossRef]
- Totsche, K.U.; Amelung, W.; Gerzabek, M.H.; Guggenberger, G.; Klumpp, E.; Knief, C.; Lehndorff, E.; Mikutta, R.; Peth, S.; Prechtel, A. Microaggregates in soils. J. Plant Nutr. Soil Sci. 2018, 181, 104–136. [Google Scholar] [CrossRef]
- Lal, R. Soil Carbon Sequestration Impacts on Global Climate Change and Food Security. Science 2004, 304, 1623–1627. [Google Scholar] [CrossRef]
- Yu, Z.; Ling, L.; Singh, B.P.; Luo, Y.; Xu, J. Gain in carbon: Deciphering the abiotic and biotic mechanisms of biochar-induced negative priming effects in contrasting soils. Sci. Total Environ. 2020, 746, 141057. [Google Scholar] [CrossRef]
- Rousk, J.; Brookes, P.C.; Bååth, E. Contrasting Soil pH Effects on Fungal and Bacterial Growth Suggest Functional Redundancy in Carbon Mineralization. Appl. Environ. Microbiol. 2009, 75, 1589–1596. [Google Scholar] [CrossRef]
- Cao, T.; Meng, J.; Liang, H.; Yang, X.; Chen, W. Can biochar provide ammonium and nitrate to poor soils? Soil column incubation. J. Soil Sci. Plant Nutr. 2017, 17, 253–265. [Google Scholar] [CrossRef]
- De Boer, W.; Kowalchuk, G.A. Nitrification in acid soils: Micro-organisms and mechanisms. Soil Biol. Biochem. 2001, 33, 853–866. [Google Scholar] [CrossRef]
- Zhao, L.; Cao, X.; Mašek, O.; Zimmerman, A. Heterogeneity of biochar properties as a function of feedstock sources and production temperatures. J. Hazard. Mater. 2013, 256, 1–9. [Google Scholar] [CrossRef] [PubMed]
- Robertson, G.P.; Groffman, P.M. Nitrogen transformations. In Soil Microbiology, Ecology and Biochemistry; Elsevier: Amsterdam, The Netherlands, 2007; pp. 341–364. [Google Scholar]
- Li, S.; Harris, S.; Anandhi, A.; Chen, G. Predicting biochar properties and functions based on feedstock and pyrolysis temperature: A review and data syntheses. J. Clean. Prod. 2019, 215, 890–902. [Google Scholar] [CrossRef]
- Cui, H.-J.; Wang, M.K.; Fu, M.-L.; Ci, E. Enhancing phosphorus availability in phosphorus-fertilized zones by reducing phosphate adsorbed on ferrihydrite using rice straw-derived biochar. J. Soils Sediments 2011, 11, 1135–1141. [Google Scholar] [CrossRef]
- Nelson, N.O.; Agudelo, S.C.; Yuan, W.; Gan, J. Nitrogen and Phosphorus Availability in Biochar-Amended Soils. Soil Sci. 2011, 176, 218–226. [Google Scholar] [CrossRef]
- Naeem, M.A.; Khalid, M.; Ahmad, Z.; Naveed, M. Low Pyrolysis Temperature Biochar Improves Growth and Nutrient Availability of Maize on Typic Calciargid. Commun. Soil Sci. Plant Anal. 2016, 47, 41–51. [Google Scholar] [CrossRef]
- van Lith, S.C.; Jensen, P.A.; Frandsen, F.J.; Glarborg, P. Release to the Gas Phase of Inorganic Elements during Wood Combustion. Part 2: Influence of Fuel Composition. Energy Fuels 2008, 22, 1598–1609. [Google Scholar] [CrossRef]
- Singh, A.; Purakayastha, T.J. Characterization of biochar and their influence on microbial activities and potassium availability in an acid soil. Arch. Agron. Soil Sci. 2019, 65, 1302–1315. [Google Scholar] [CrossRef]


| Property | Luvisol | Ferralsol |
|---|---|---|
| pH (KCl) | 4.67 | 3.97 |
| Carbon (%) | 4.45 | 5.40 |
| Nitrogen (%) | 0.268 | 0.403 |
| C/N | 16 | 13 |
| Clay (%) | 39.0 | 23.0 |
| Bulk density (g cm−3) | 1.29 | 1.12 |
| Extractable P (mg kg−1) | 2.73 | 18.6 |
| Extractable K (cmolc kg−1) | 0.063 | 0.338 |
| Exchangeable Ca (cmolc kg−1) | 2.24 | 1.02 |
| Exchangeable Mg (cmolc kg−1) | 2.24 | 0.577 |
| Exchangeable acidity (cmolc kg−1) | 1.60 | 8.00 |
| Treatment | Yield | Ash | Total C | Total N | pH | Extrac. P | Exch.K | CCE |
|---|---|---|---|---|---|---|---|---|
| (%) | (%) | (%) | (%) | mg kg−1 | cmolc kg−1 | (%) | ||
| CP PB | 100 e | 4.40 d | 39 a | 1.1 b | 8.12 c | 81.9 b | 22.7 c | 6.97 a |
| 100 e | 0.436 a | 50.9 b | 0.249 a | 4 a | 14.1 a | 1.14 a | 7.47 a | |
| CP350 PB350 | 30.1 b | 10.7 e | 66.1 c | 2.19 d | 11.1 e | 718 c | 15.9 b | 11.5 b |
| 52.2 d | 0.92 b | 70.3 d | 0.346 a | 6.65 b | 0 a | 0.92 a | 8.01 a | |
| CP650 PB650 | 21.8 a | 15.5 f | 71.5 d | 1.45 c | 12.1 g | 1077 d | 13.7 b | 17.5 c |
| 33 c | 2.15 c | 90.1 e | 0.367 a | 9.1 d | 0 a | 2.55 a | 9.43 ab |
Publisher’s Note: MDPI stays neutral with regard to jurisdictional claims in published maps and institutional affiliations. |
© 2022 by the authors. Licensee MDPI, Basel, Switzerland. This article is an open access article distributed under the terms and conditions of the Creative Commons Attribution (CC BY) license (https://creativecommons.org/licenses/by/4.0/).
Share and Cite
Vilakazi, S.P.; Muchaonyerwa, P.; Buthelezi-Dube, N.N. Carbon Dioxide and Release of Primary Nutrients in Contrasting Soils Incubated with Feedstocks and Biochar from Cull Potato and Pine Bark. Land 2022, 11, 1329. https://doi.org/10.3390/land11081329
Vilakazi SP, Muchaonyerwa P, Buthelezi-Dube NN. Carbon Dioxide and Release of Primary Nutrients in Contrasting Soils Incubated with Feedstocks and Biochar from Cull Potato and Pine Bark. Land. 2022; 11(8):1329. https://doi.org/10.3390/land11081329
Chicago/Turabian StyleVilakazi, Samukelisiwe P., Pardon Muchaonyerwa, and Nkosinomusa Nomfundo Buthelezi-Dube. 2022. "Carbon Dioxide and Release of Primary Nutrients in Contrasting Soils Incubated with Feedstocks and Biochar from Cull Potato and Pine Bark" Land 11, no. 8: 1329. https://doi.org/10.3390/land11081329
APA StyleVilakazi, S. P., Muchaonyerwa, P., & Buthelezi-Dube, N. N. (2022). Carbon Dioxide and Release of Primary Nutrients in Contrasting Soils Incubated with Feedstocks and Biochar from Cull Potato and Pine Bark. Land, 11(8), 1329. https://doi.org/10.3390/land11081329