
Temporal Changes in Land Use, Vegetation, and Productivity in Southwest China

 ,
,
Abstract
:1. Introduction
2. Data and Methods
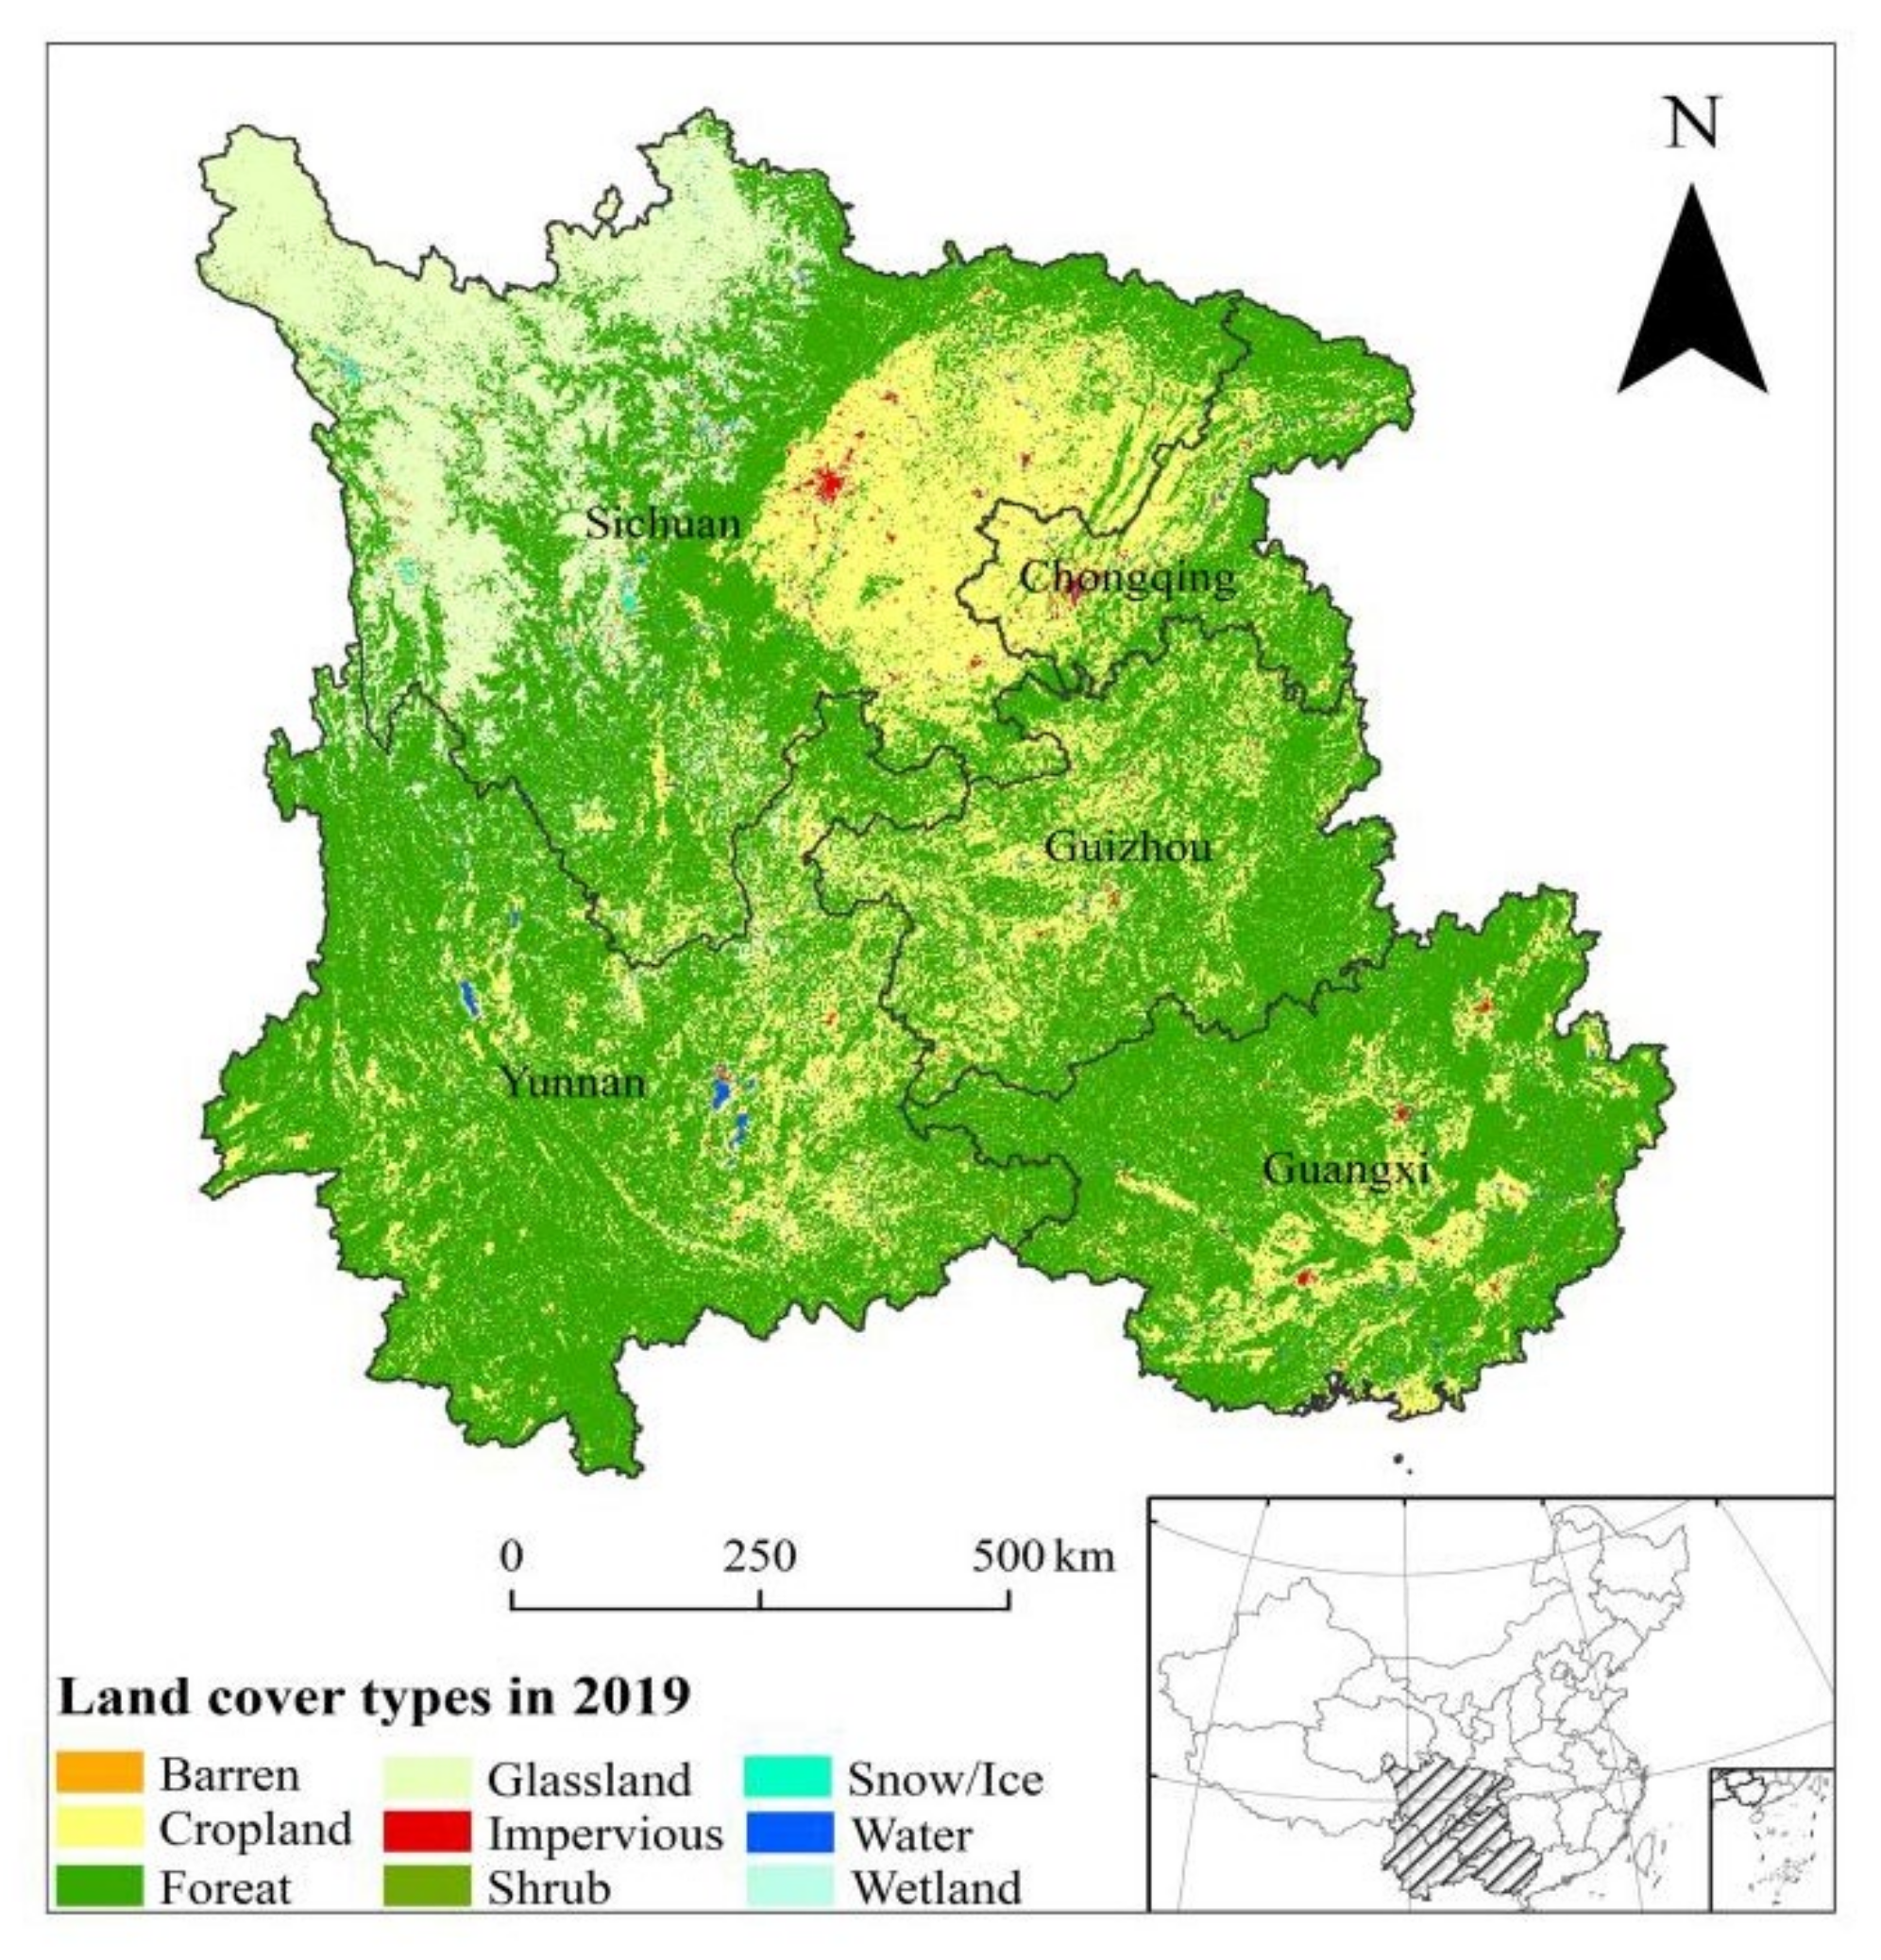
2.1. Study Area
2.2. Data
2.3. Methods
3. Results
3.1. Land Types Changes
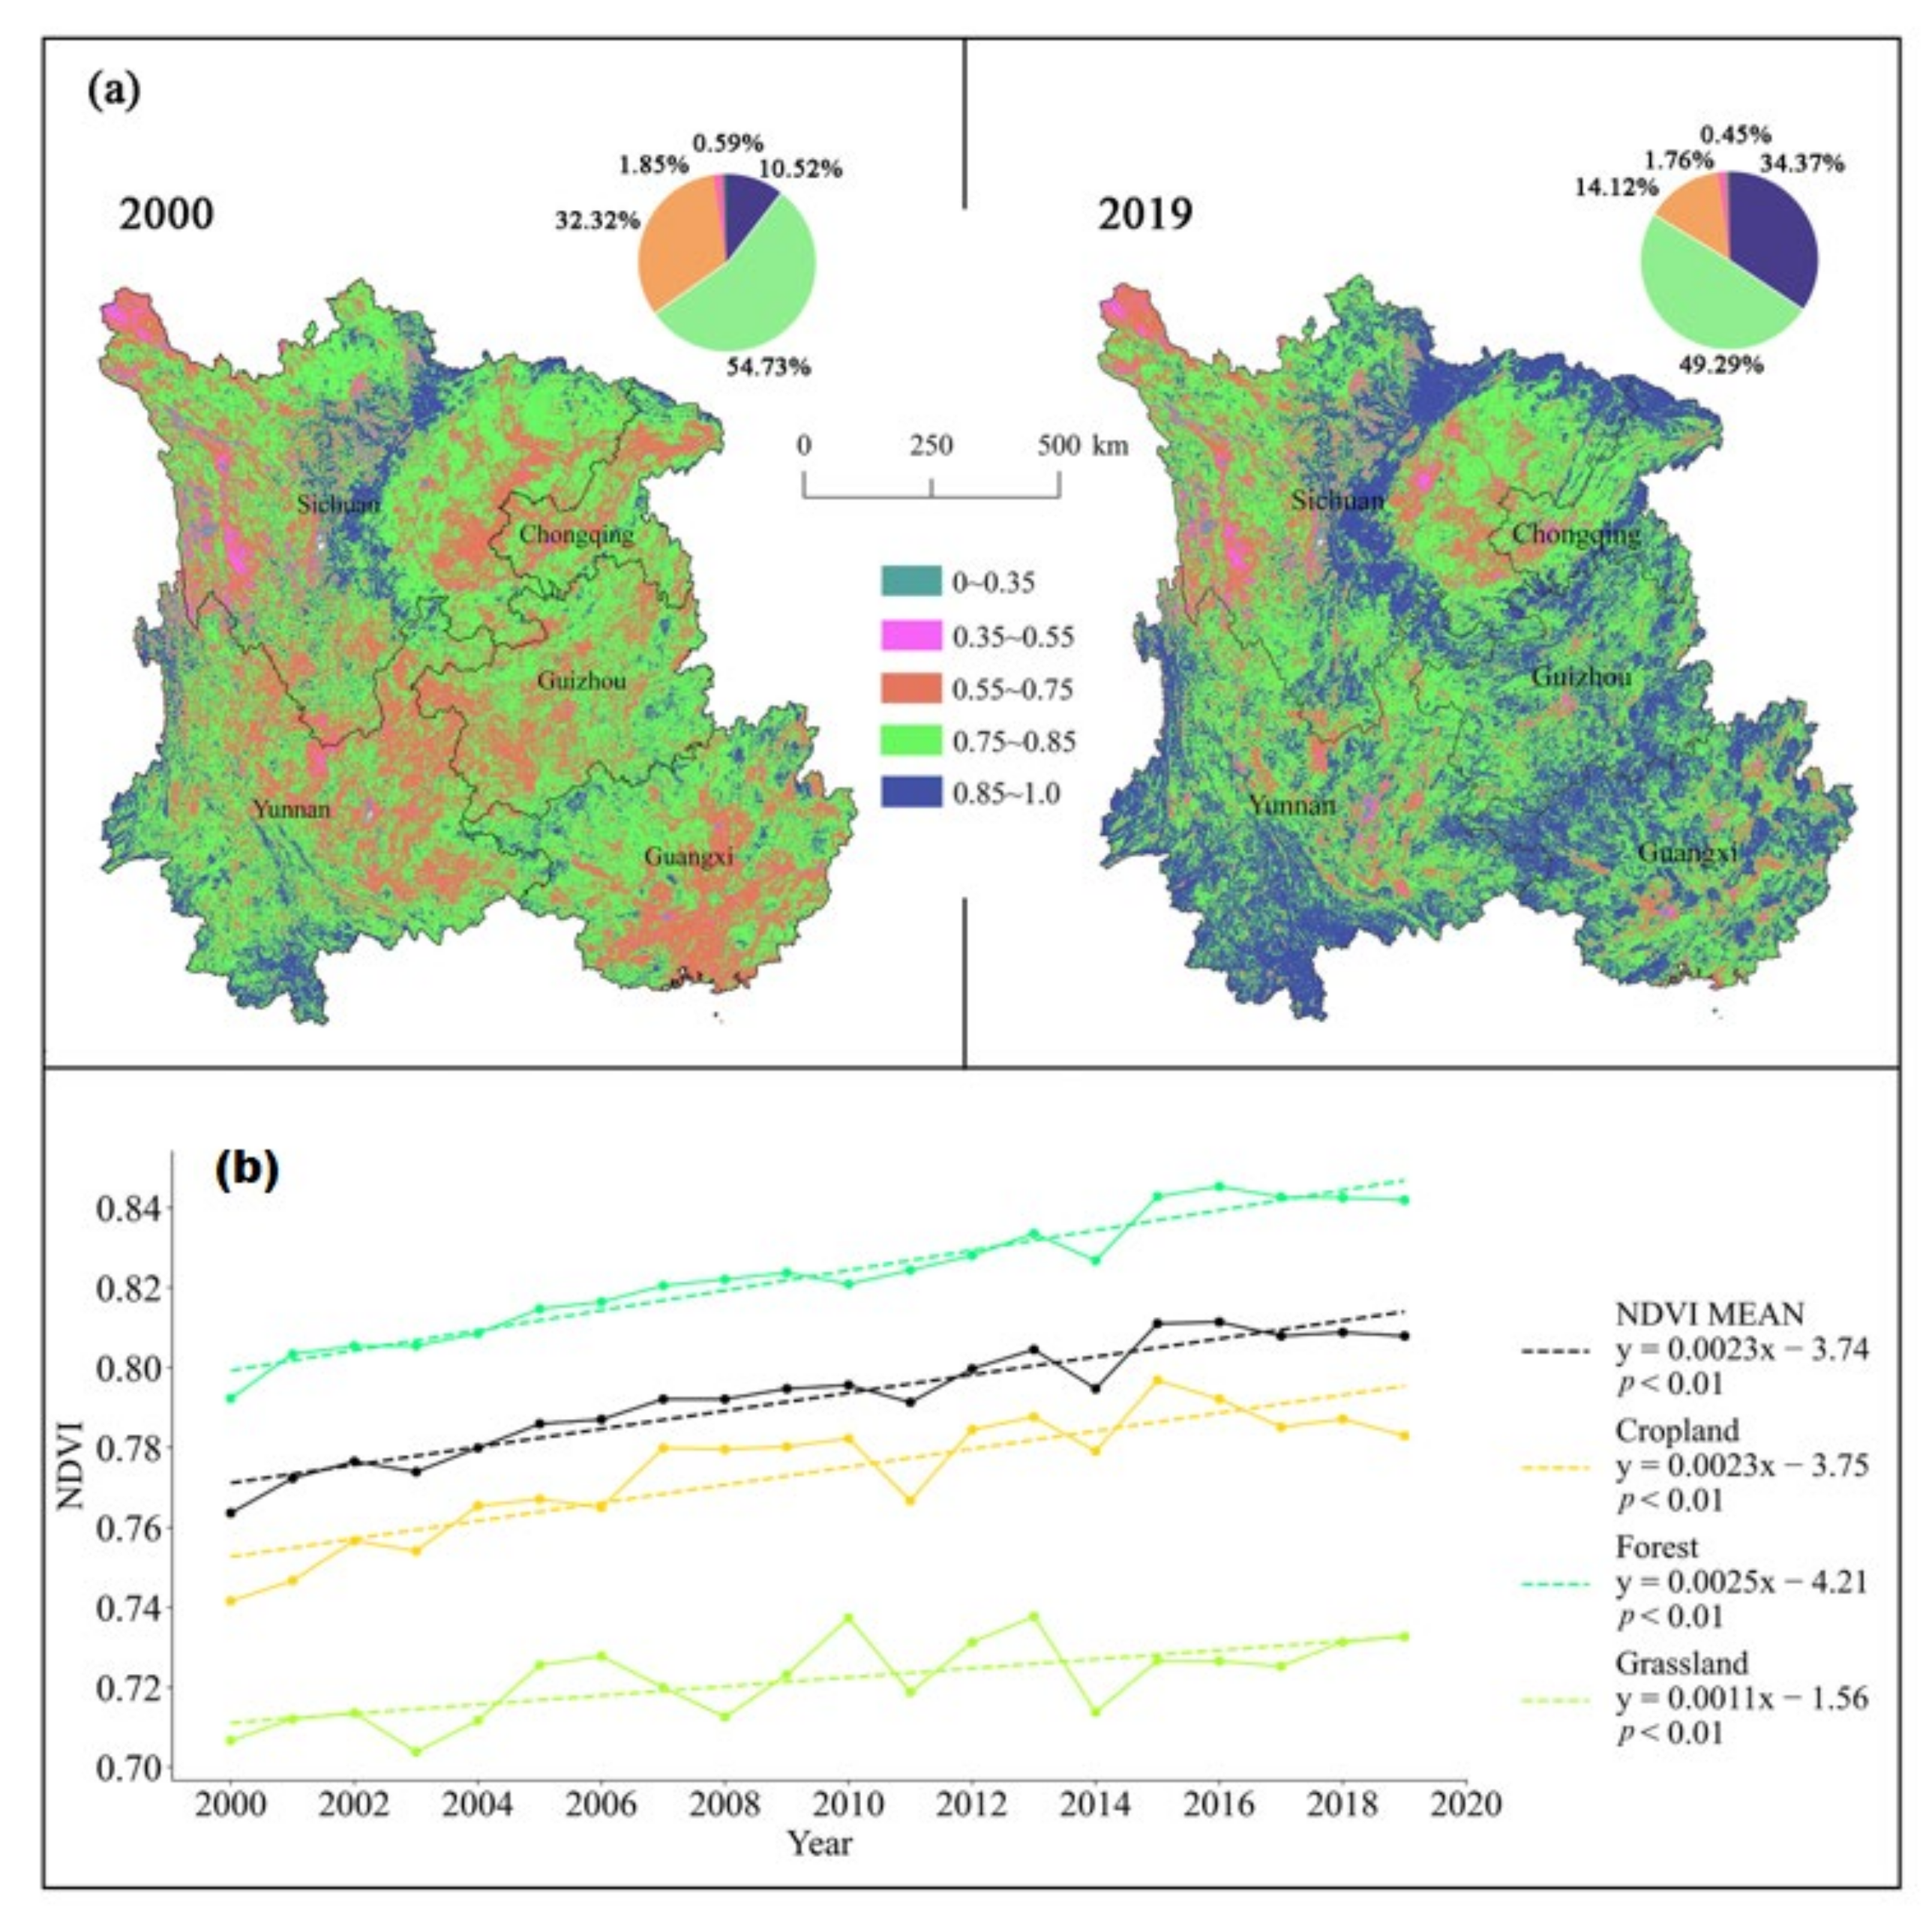
3.2. The Characteristics of Inter-Annual Variation in NDVI
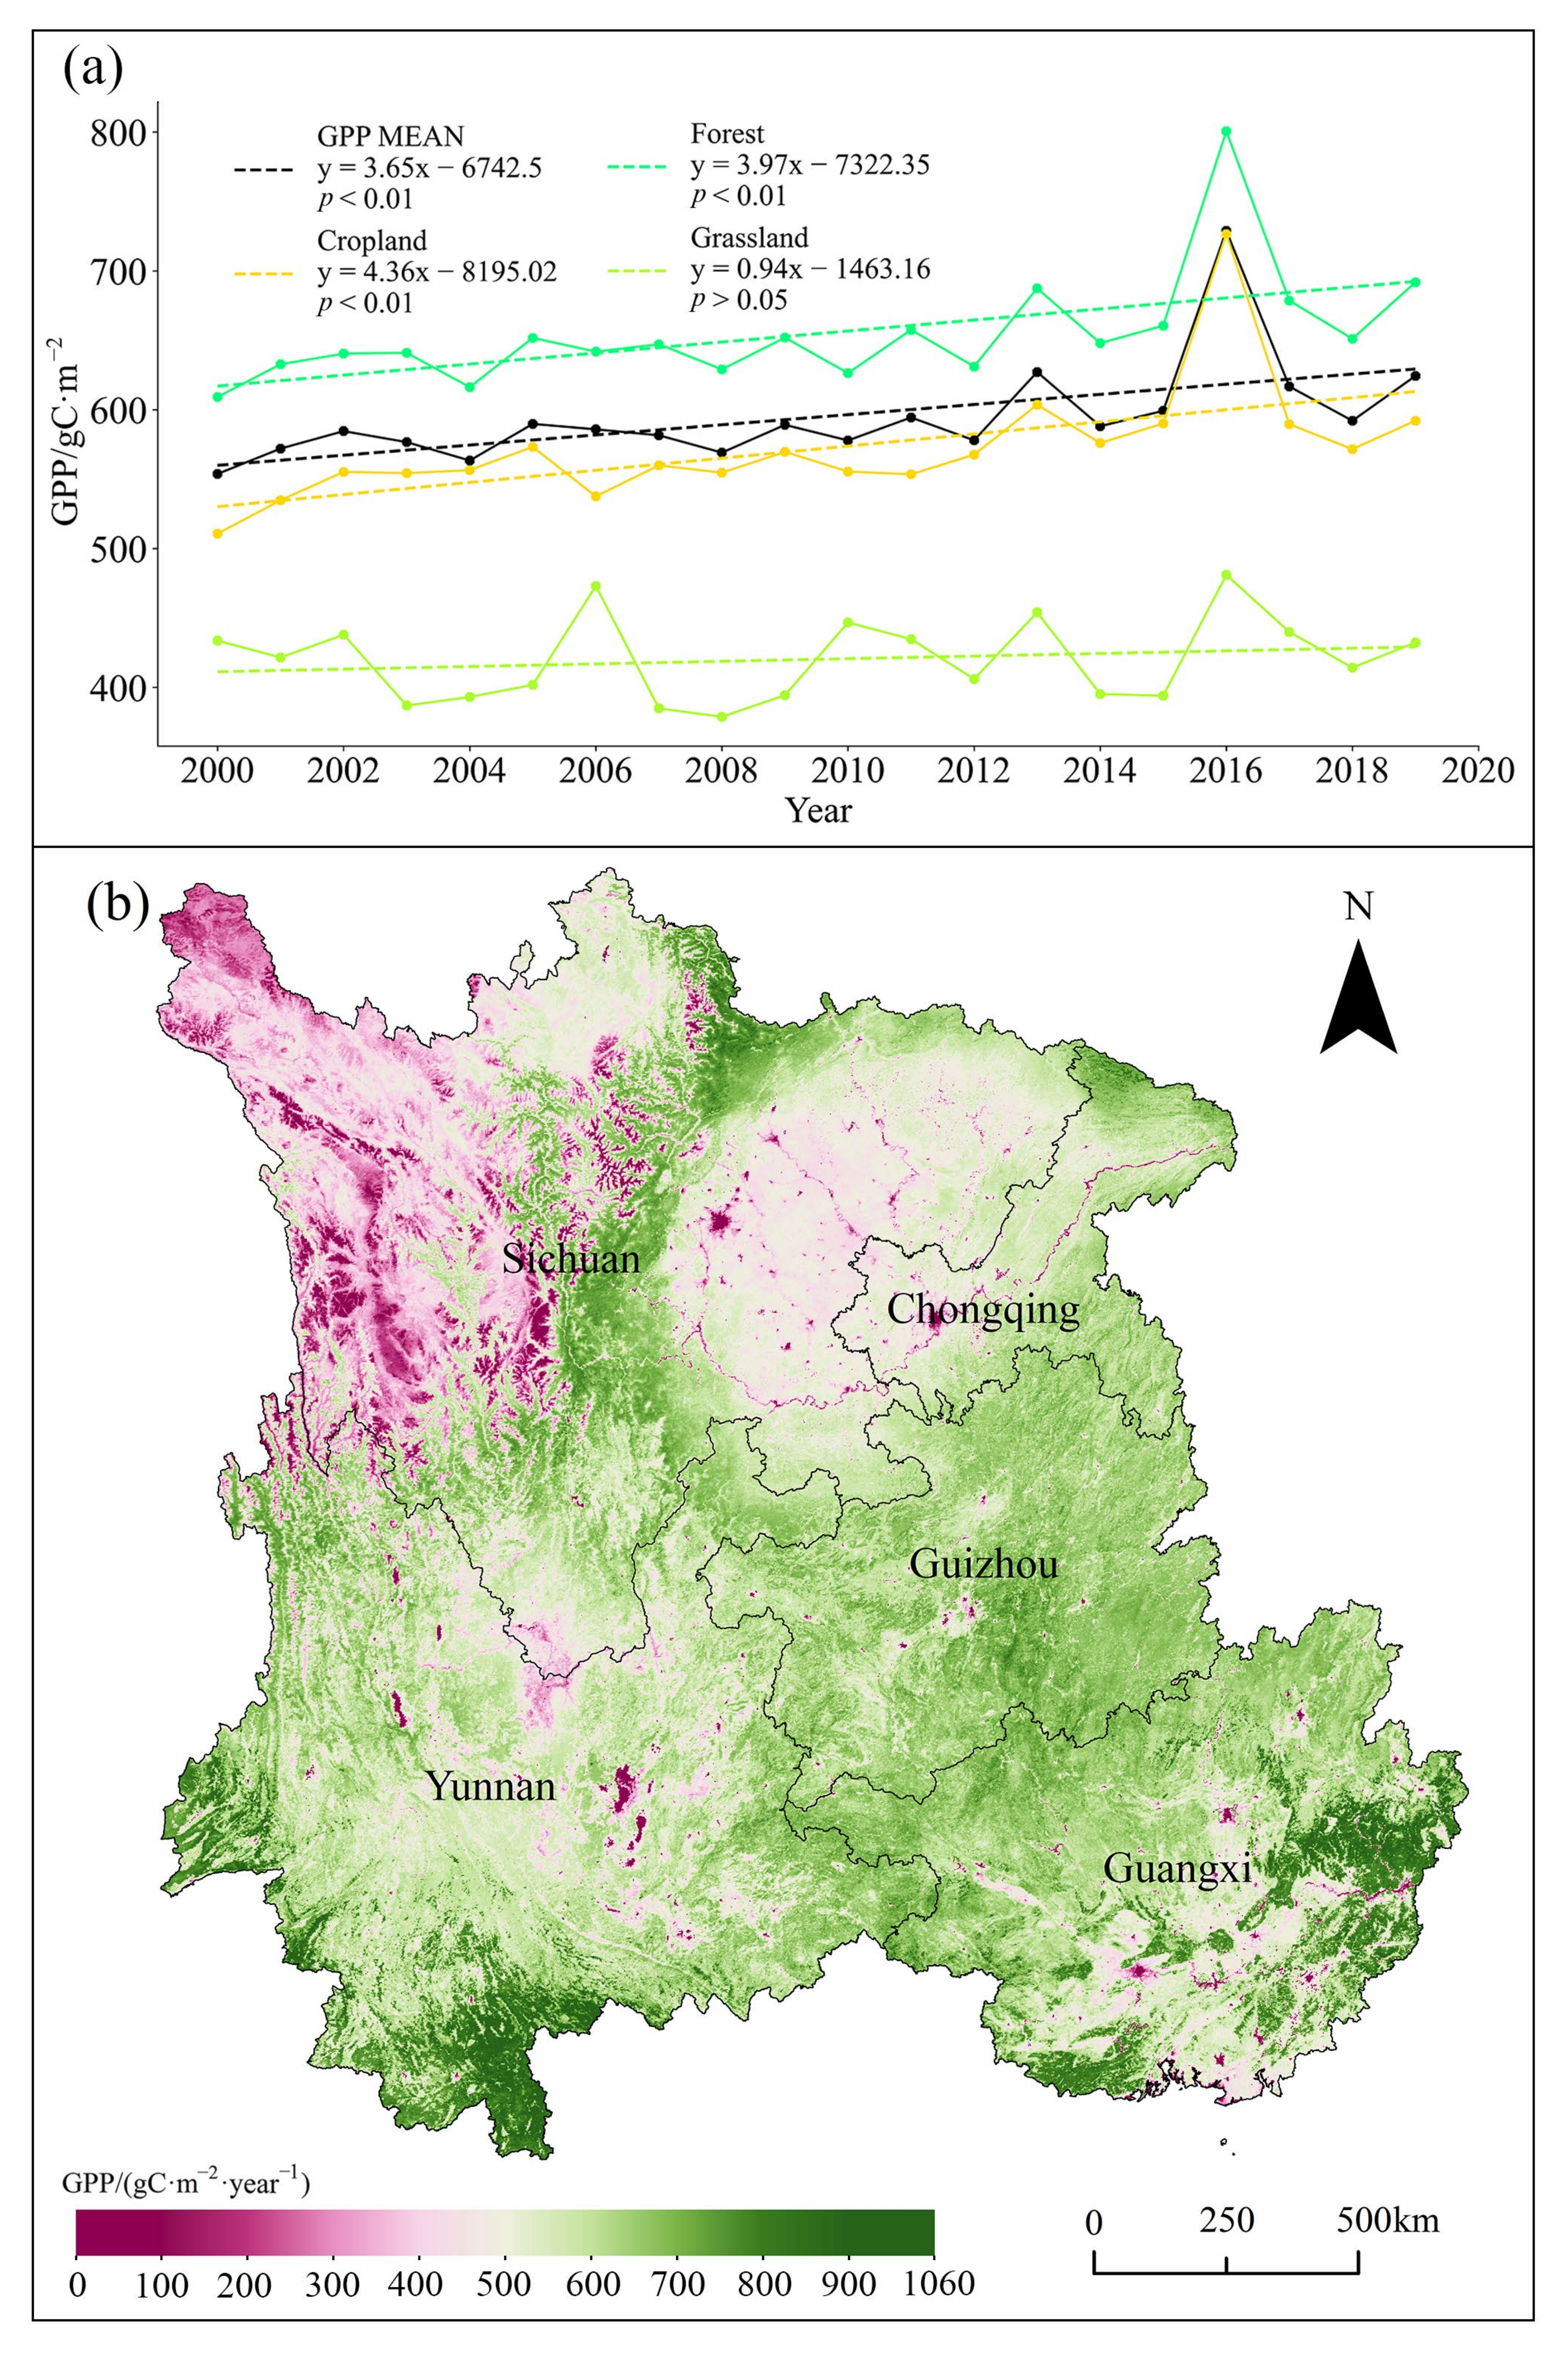
3.3. GPP Changes
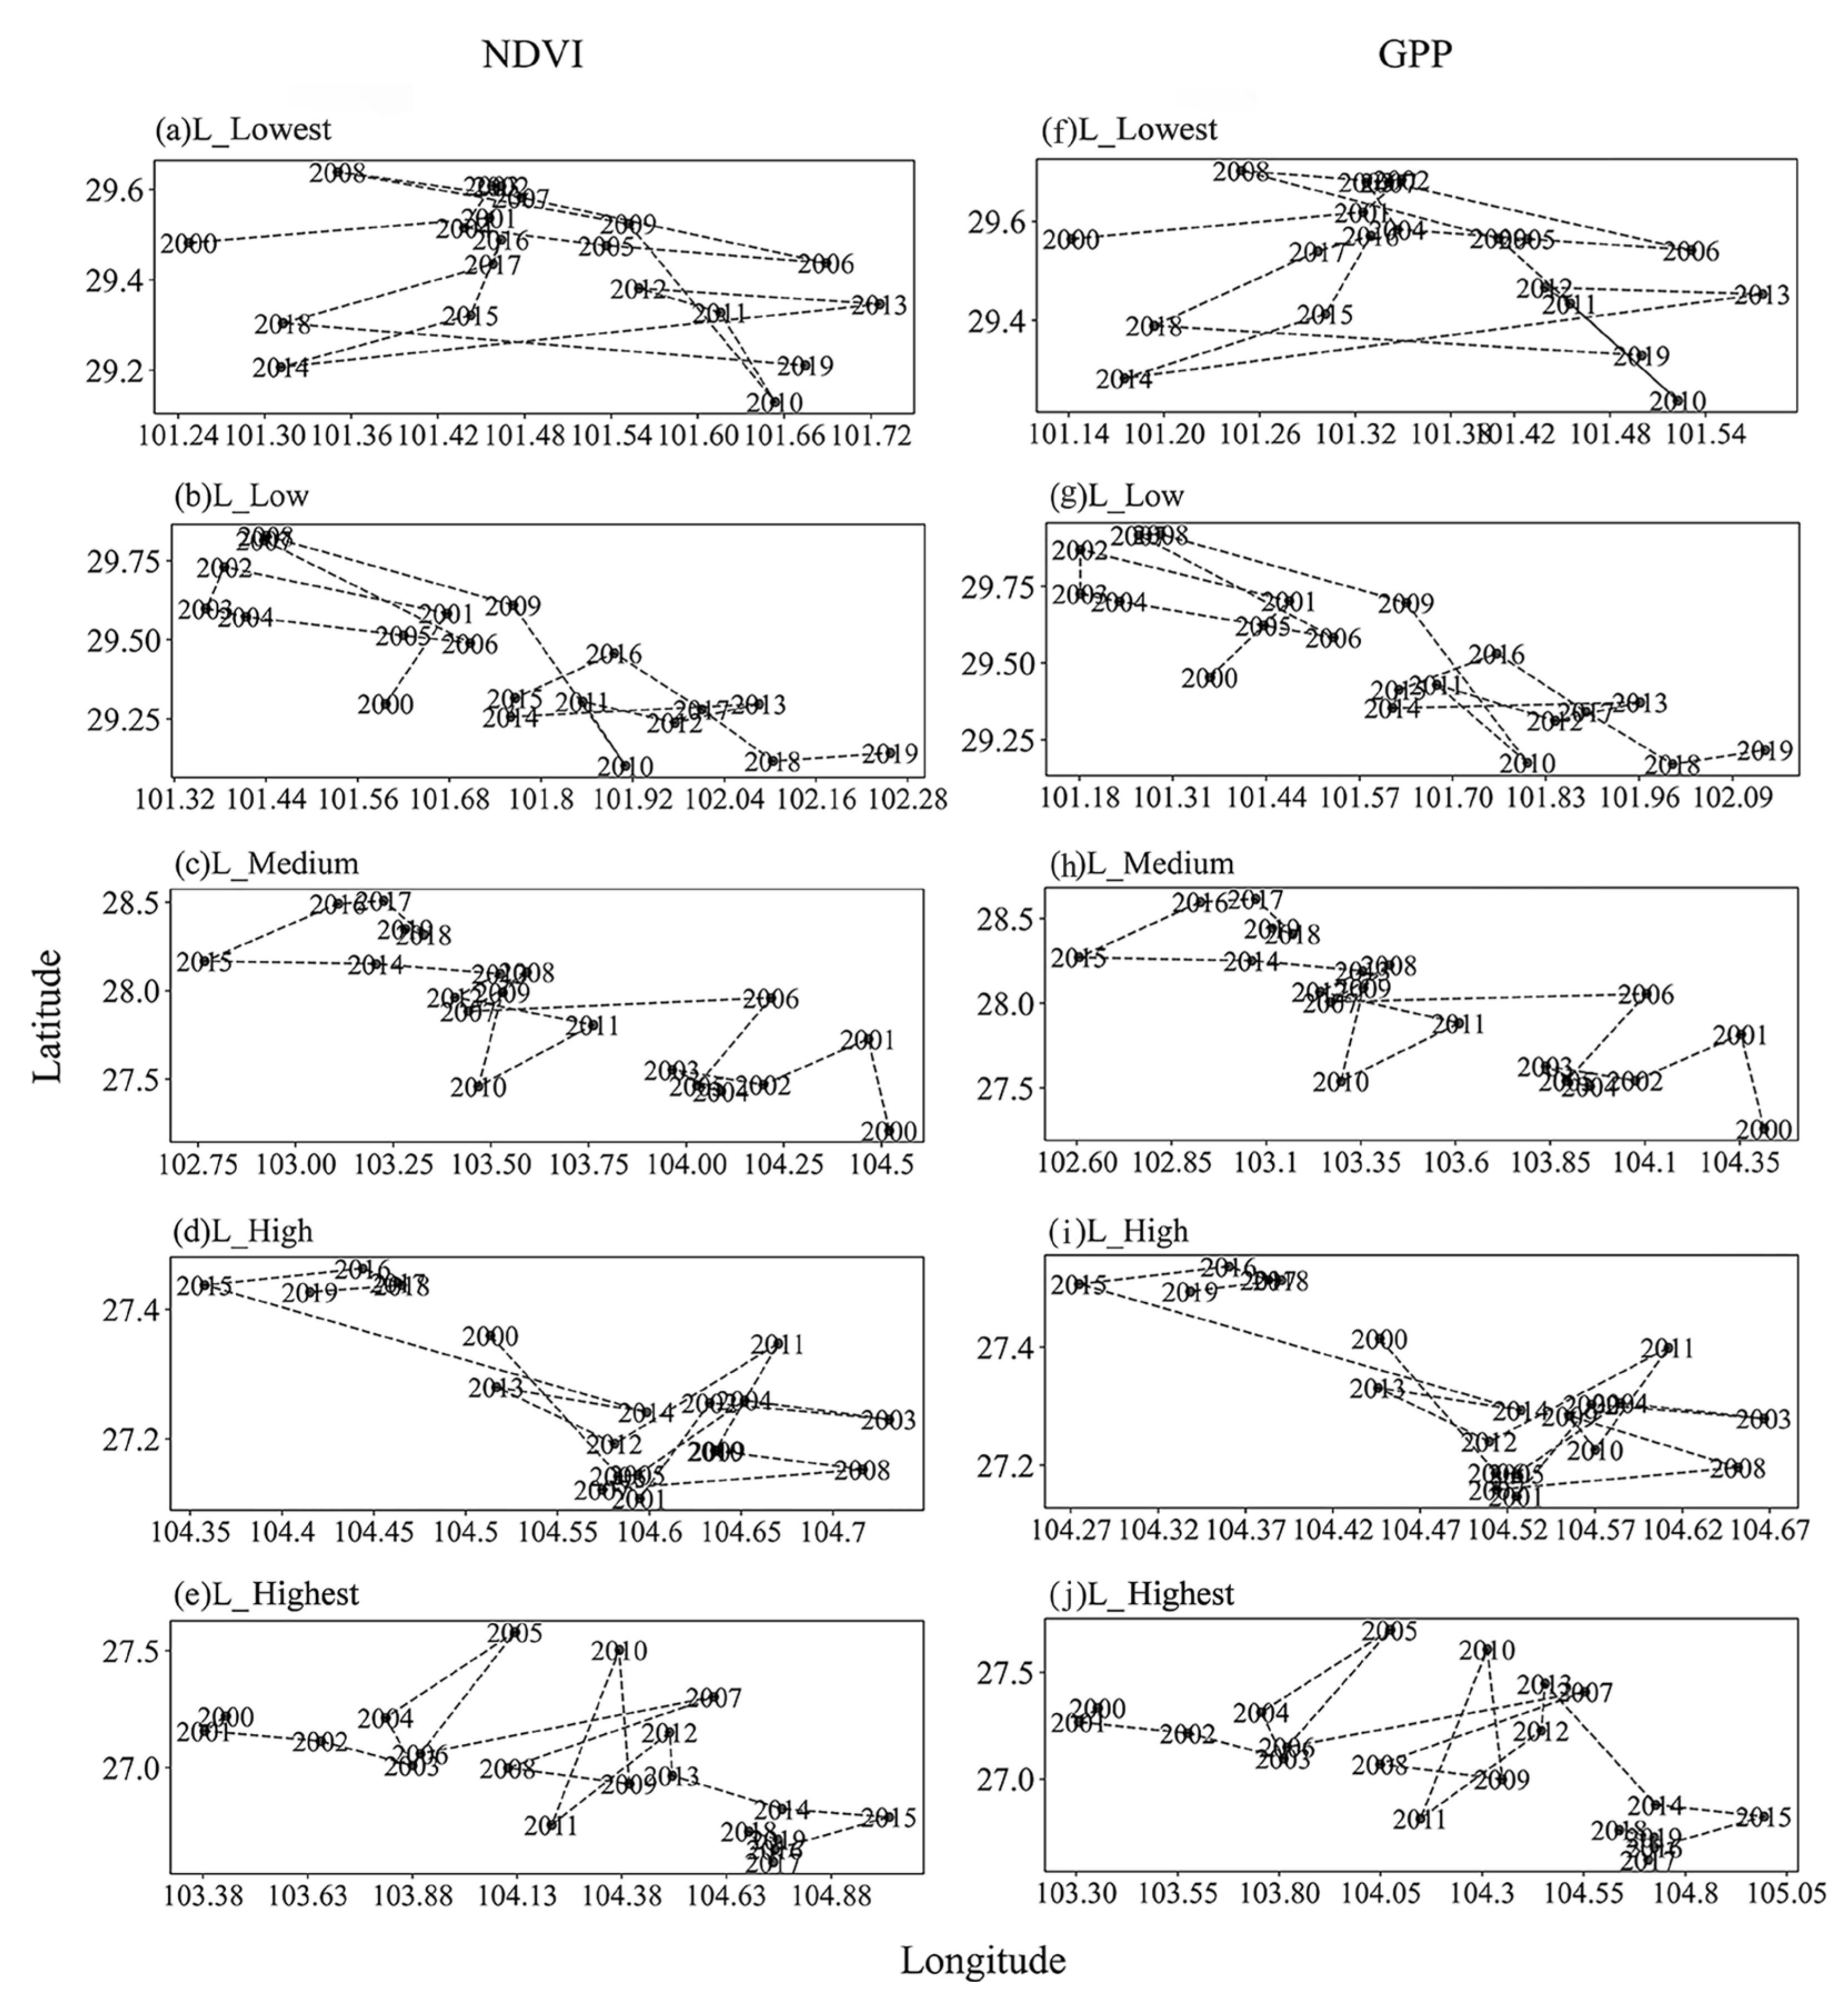
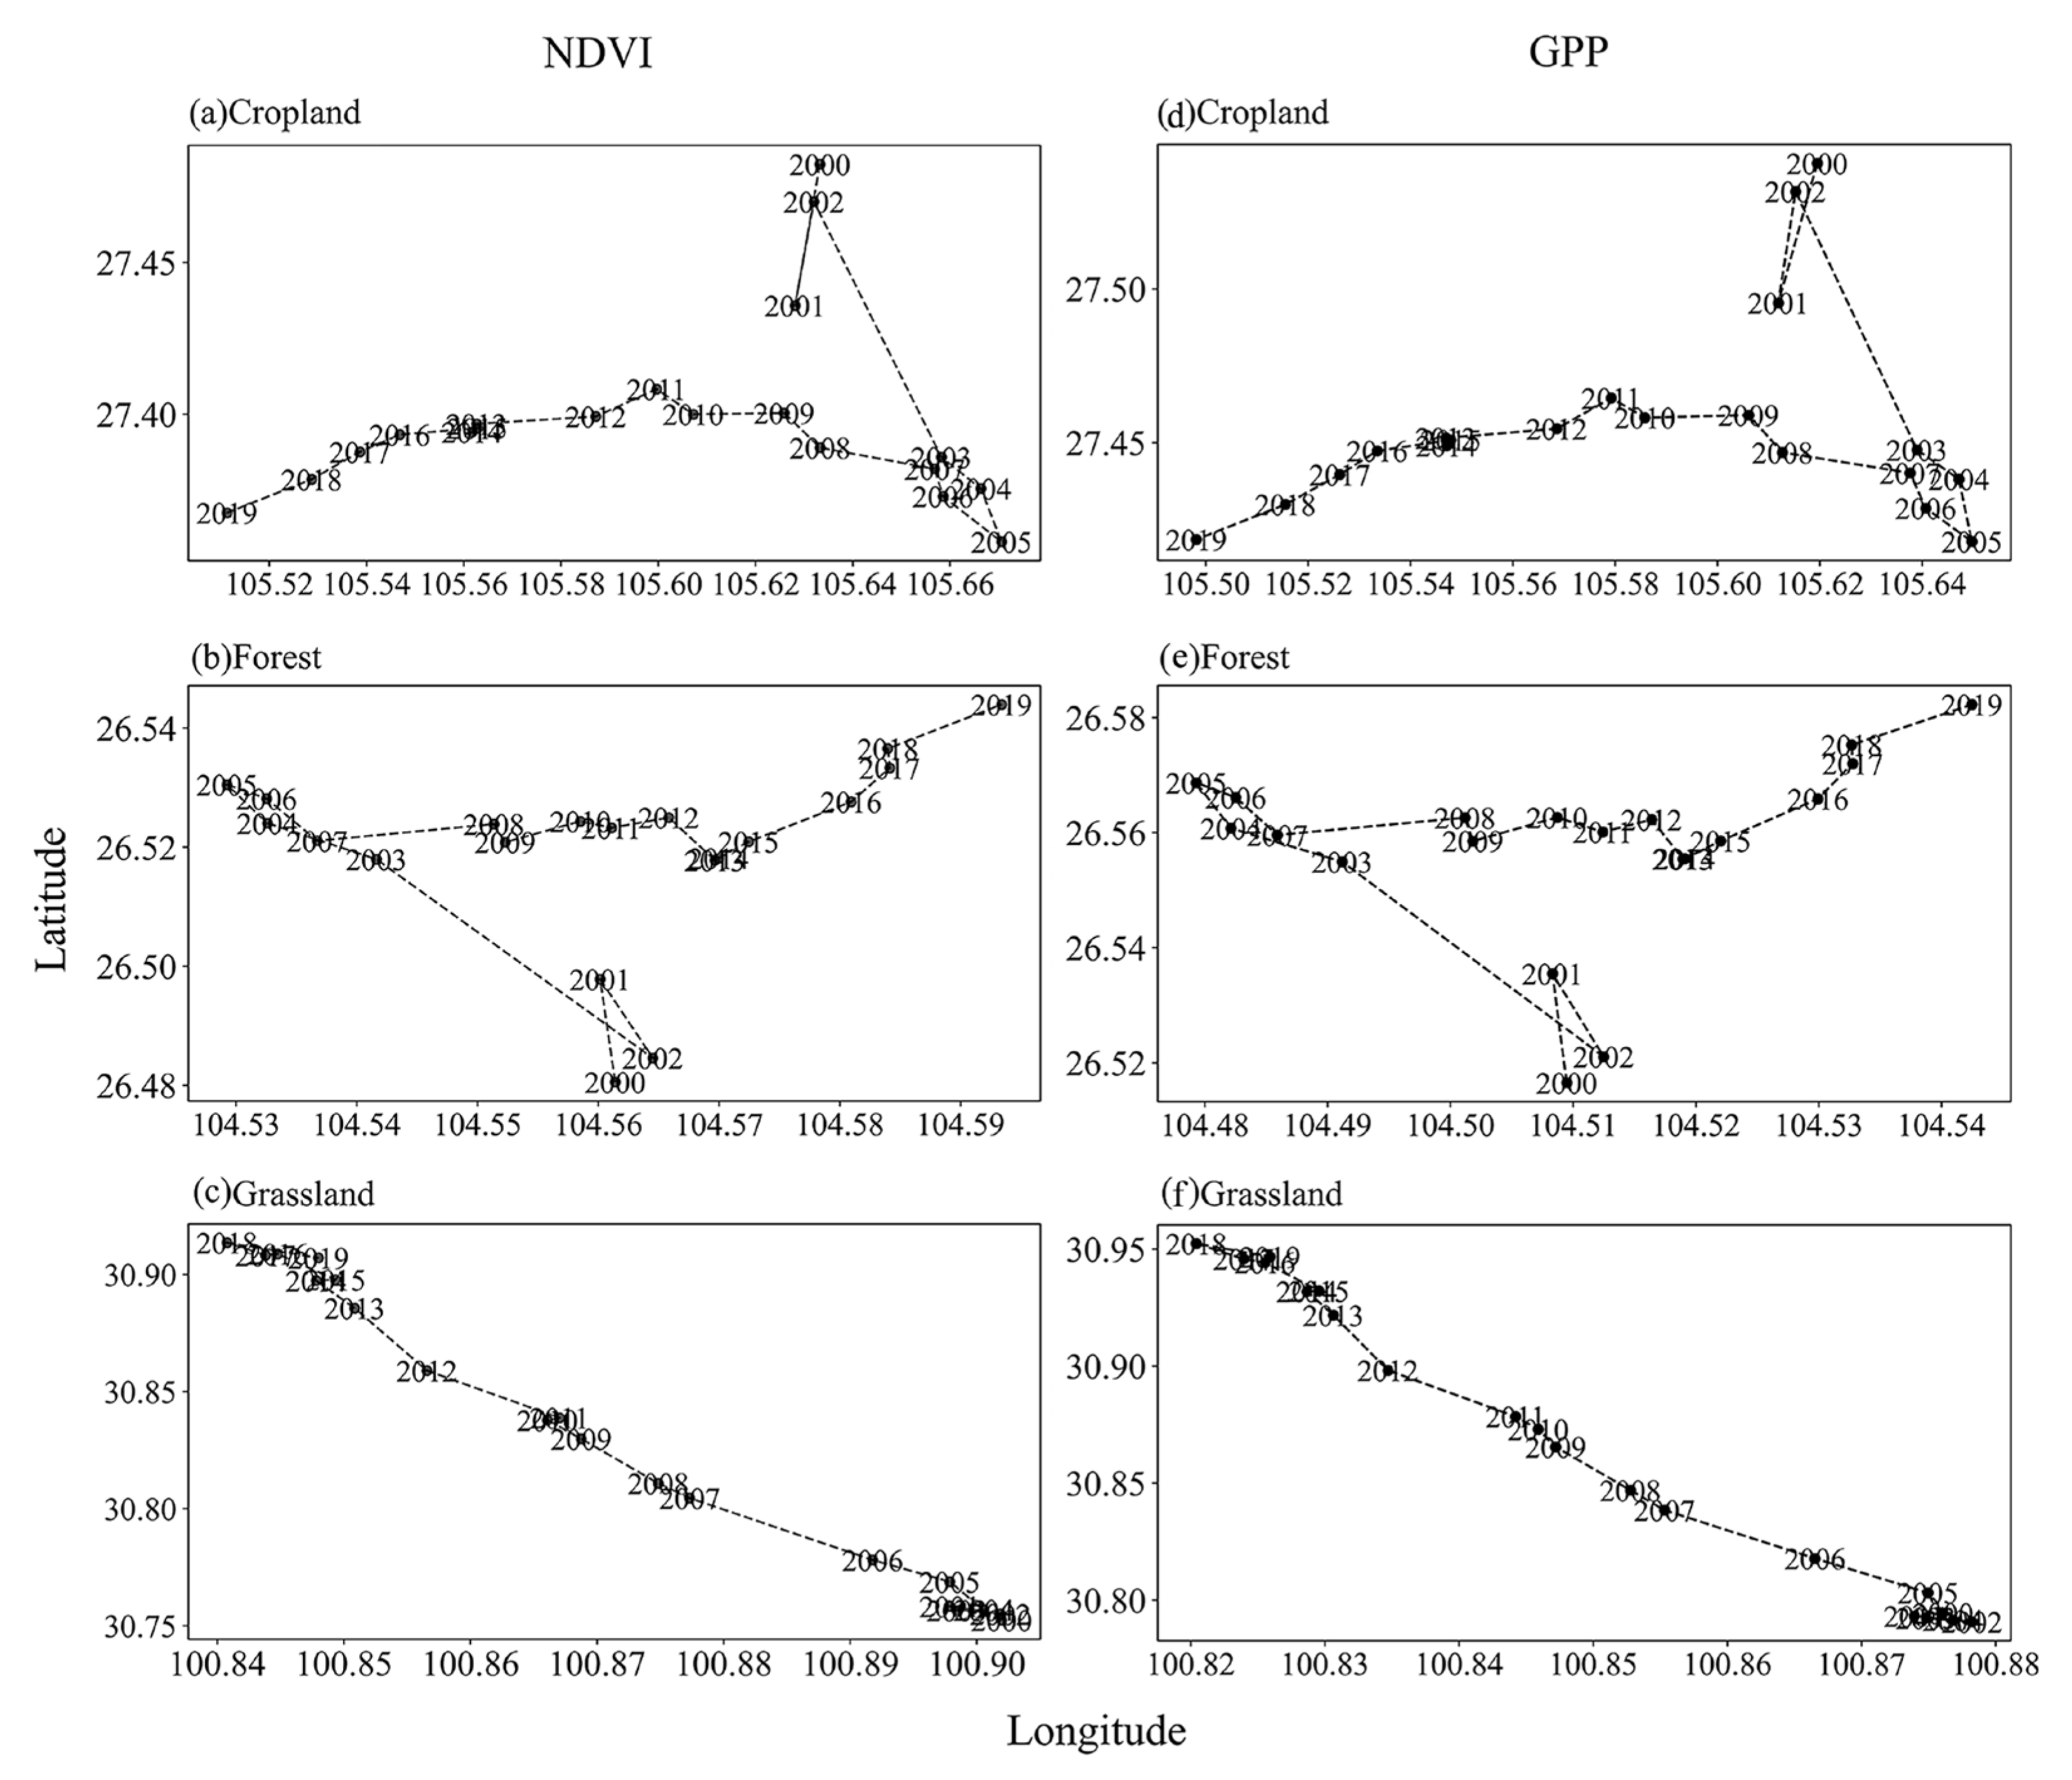
3.4. Changes in the Center of Gravity of NDVI and GPP
4. Discussion
4.1. Spatiotemporal Variation in Land Types and NDVI and GPP
4.2. Migration Changes in NDVI and GPP Centroid
4.3. Implications for Future
5. Conclusions
Author Contributions
Funding
Institutional Review Board Statement
Informed Consent Statement
Data Availability Statement
Acknowledgments
Conflicts of Interest
Appendix A

| 2000–2019 | 0~0.35 | 0.35~0.55 | 0.55~0.75 | 0.75~0.85 | 0.85~1.0 |
|---|---|---|---|---|---|
| 0~0.35 | 4397.62 | 2772.06 | 630.53 | 95.78 | 45.96 |
| 0.35~0.55 | 1089.16 | 11,384.48 | 11,465.65 | 1269.25 | 169.92 |
| 0.55~0.75 | 418.50 | 8424.23 | 136,924.63 | 259,673.48 | 39,192.96 |
| 0.75~0.85 | 57.80 | 1560.78 | 44,215.18 | 395,140.43 | 311,870.61 |
| 0.85~1.0 | 5.03 | 48.18 | 1050.40 | 22,088.73 | 121,421.98 |
References
- Liu, H.; Zhang, M.; Lin, Z.; Xu, X. Spatial heterogeneity of the relationship between vegetation dynamics and climate change and their driving forces at multiple time scales in Southwest China. Agric. For. Meteorol. 2018, 256, 10–21. [Google Scholar] [CrossRef]
- Yan, W.; Wang, H.; Jiang, C.; Jin, S.; Ai, J.; Sun, O.J. Satellite view of vegetation dynamics and drivers over southwestern China. Ecol. Indic. 2021, 130, 108074. [Google Scholar] [CrossRef]
- Huang, J.; Ge, Z.; Huang, Y.; Tang, X.; Shi, Z.; Lai, P.; Song, Z.; Hao, B.; Yang, H.; Ma, M. Climate change and ecological engineering jointly induced vegetation greening in global karst regions from 2001 to 2020. Plant Soil 2022, 475, 193–212. [Google Scholar] [CrossRef]
- Yue, Y.; Liao, C.; Tong, X.; Wu, Z.; Fensholt, R.; Prishchepov, A.; Jepsen, M.R.; Wang, K.; Brandt, M. Large scale reforestation of farmlands on sloping hills in South China karst. Landsc. Ecol. 2020, 35, 1445–1458. [Google Scholar] [CrossRef]
- Li, Y.; Zhang, Y.; Lv, J. Interannual variations in GPP in forest ecosystems in Southwest China and regional differences in the climatic contributions. Ecol. Inform. 2022, 69, 101591. [Google Scholar] [CrossRef]
- Luo, X.; Jia, B.; Lai, X. Contributions of climate change, land use change and CO2 to changes in the gross primary productivity of the Tibetan Plateau. Atmos. Ocean. Sci. Lett. 2020, 13, 8–15. [Google Scholar] [CrossRef]
- Tian, S.; Wang, S.; Bai, X.; Luo, G.; Li, Q.; Yang, Y.; Hu, Z.; Li, C.; Deng, Y. Global patterns and changes of carbon emissions from land use during 1992–2015. Environ. Sci. Ecotechnol. 2021, 7, 100108. [Google Scholar] [CrossRef]
- Zhu, L.; Song, R.; Sun, S.; Li, Y.; Hu, K. Land use/land cover change and its impact on ecosystem carbon storage in coastal areas of China from 1980 to 2050. Ecol. Indic. 2022, 142, 109178. [Google Scholar] [CrossRef]
- Fang, Z.; Ding, T.; Chen, J.; Xue, S.; Zhou, Q.; Wang, Y.; Wang, Y.; Huang, Z.; Yang, S. Impacts of land use/land cover changes on ecosystem services in ecologically fragile regions. Sci. Total Environ. 2022, 831, 154967. [Google Scholar] [CrossRef]
- Jiang, Z.; Lian, Y.; Qin, X. Rocky desertification in Southwest China: Impacts, causes, and restoration. Earth Sci. Rev. 2014, 132, 1–12. [Google Scholar] [CrossRef]
- Dai, Q.; Peng, X.; Yang, Z.; Zhao, L. Runoff and erosion processes on bare slopes in the karst rocky desertification area. CATENA 2017, 152, 218–226. [Google Scholar] [CrossRef]
- Mokhtar, A.; He, H.; Alsafadi, K.; Li, Y.; Zhao, H.; Keo, S.; Bai, C.; Abuarab, M.; Zhang, C.; Elbagoury, K.; et al. Evapotranspiration as a response to climate variability and ecosystem changes in southwest, China. Environ. Earth Sci. 2020, 79, 312. [Google Scholar] [CrossRef]
- Ali, S.; Haixing, Z.; Qi, M.; Liang, S.; Ning, J.; Jia, Q.; Hou, F. Monitoring drought events and vegetation dynamics in relation to climate change over mainland China from 1983 to 2016. Environ. Sci. Pollut. Res. 2021, 28, 21910–21925. [Google Scholar] [CrossRef] [PubMed]
- Sun, H.; Wang, X.; Fan, D.; Sun, O.J. Contrasting vegetation response to climate change between two monsoon regions in Southwest China: The roles of climate condition and vegetation height. Sci. Total Environ. 2022, 802, 149643. [Google Scholar] [CrossRef] [PubMed]
- Bai, X.Y.; Wang, S.-J.; Xiong, K.-N. Assessing spatial-temporal evolution processes of karst rocky desertification land: Indications for restoration strategies. Land Degrad. Dev. 2013, 24, 47–56. [Google Scholar] [CrossRef]
- Sweeting, M.M. Karst in China: Its Geomorphology and Environment; Springer: Berlin/Heidelberg, Germany, 2012; Volume 15. [Google Scholar]
- Zhu, Z.; Piao, S.; Myneni, R.B.; Huang, M.; Zeng, Z.; Canadell, J.G.; Ciais, P.; Sitch, S.; Friedlingstein, P.; Arneth, A.; et al. Greening of the Earth and its drivers. Nat. Clim. Chang. 2016, 6, 791–795. [Google Scholar] [CrossRef]
- Zheng, K.; Wei, J.-Z.; Pei, J.-Y.; Cheng, H.; Zhang, X.-L.; Huang, F.-Q.; Li, F.-M.; Ye, J.-S. Impacts of climate change and human activities on grassland vegetation variation in the Chinese Loess Plateau. Sci. Total Environ. 2019, 660, 236–244. [Google Scholar] [CrossRef]
- Liu, J.; Kuang, W.; Zhang, Z.; Xu, X.; Qin, Y.; Ning, J.; Zhou, W.; Zhang, S.; Li, R.; Yan, C.; et al. Spatiotemporal characteristics, patterns, and causes of land-use changes in China since the late 1980s. J. Geogr. Sci. 2014, 24, 195–210. [Google Scholar] [CrossRef]
- Fang, J.; Guo, Z.; Hu, H.; Kato, T.; Muraoka, H.; Son, Y. Forest biomass carbon sinks in E ast A sia, with special reference to the relative contributions of forest expansion and forest growth. Glob. Chang. Biol. 2014, 20, 2019–2030. [Google Scholar] [CrossRef]
- Ouyang, Z.; Zheng, H.; Xiao, Y.; Polasky, S.; Liu, J.; Xu, W.; Wang, Q.; Zhang, L.; Xiao, Y.; Rao, E.; et al. Improvements in ecosystem services from investments in natural capital. Science 2016, 352, 1455–1459. [Google Scholar] [CrossRef]
- Li, C.; Bai, X.; Tan, Q.; Luo, G.; Wu, L.; Chen, F.; Xi, H.; Luo, X.; Ran, C.; Chen, H.; et al. High-resolution mapping of the global silicate weathering carbon sink and its long-term changes. Glob. Chang. Biol. 2022, 28, 4377–4394. [Google Scholar] [CrossRef] [PubMed]
- Tian, Y.; Wang, S.; Bai, X.; Luo, G.; Xu, Y. Trade-offs among ecosystem services in a typical Karst watershed, SW China. Sci. Total Environ. 2016, 566, 1297–1308. [Google Scholar] [CrossRef] [PubMed]
- Chen, C.; Park, T.; Wang, X.; Piao, S.; Xu, B.; Chaturvedi, R.K.; Fuchs, R.; Brovkin, V.; Ciais, P.; Fensholt, R.; et al. China and India lead in greening of the world through land-use management. Nat. Sustain. 2019, 2, 122–129. [Google Scholar] [CrossRef] [PubMed]
- Xiong, L.; Bai, X.; Zhao, C.; Li, Y.; Tan, Q.; Luo, G.; Wu, L.; Chen, F.; Li, C.; Ran, C.; et al. High-resolution datasets for global carbonate and silicate rock weathering carbon sinks and their change trends. Earth’s Future 2022, 10, e2022EF002746. [Google Scholar] [CrossRef]
- Brandt, M.; Yue, Y.; Wigneron, J.-P.; Tong, X.; Tian, F.; Jepsen, M.R.; Xiao, X.; Verger, A.; Mialon, A.; Al-Yaari, A.; et al. Satellite-observed major greening and biomass increase in south China karst during recent decade. Earths Future 2018, 6, 1017–1028. [Google Scholar] [CrossRef]
- Zhang, S.; Bai, X.; Zhao, C.; Tan, Q.; Luo, G.; Wu, L.; Xi, H.; Li, C.; Chen, F.; Ran, C.; et al. China’s carbon budget inventory from 1997 to 2017 and its challenges to achieving carbon neutral strategies. J. Clean. Prod. 2022, 347, 130966. [Google Scholar] [CrossRef]
- Pettorelli, N.; Vik, J.O.; Mysterud, A.; Gaillard, J.-M.; Tucker, C.J.; Stenseth, N.C. Using the satellite-derived NDVI to assess ecological responses to environmental change. Trends Ecol. Evol. 2005, 20, 503–510. [Google Scholar] [CrossRef]
- Fensholt, R.; Proud, S.R. Evaluation of earth observation based global long term vegetation trends—Comparing GIMMS and MODIS global NDVI time series. Remote Sens. Environ. 2012, 119, 131–147. [Google Scholar] [CrossRef]
- Zhang, X.; Liu, K.; Li, X.; Wang, S.; Wang, J. Vulnerability assessment and its driving forces in terms of NDVI and GPP over the Loess Plateau, China. Phys. Chem. Earth, Parts A/B/C 2022, 125, 103106. [Google Scholar] [CrossRef]
- Wang, Z.; Liu, S.; Wang, Y.; Valbuena, R.; Wu, Y.; Kutia, M.; Zheng, Y.; Lu, W.; Zhu, Y.; Zhao, M.; et al. Tighten the Bolts and Nuts on GPP Estimations from Sites to the Globe: An Assessment of Remote Sensing Based LUE Models and Supporting Data Fields. Remote Sens. 2021, 13, 168. [Google Scholar] [CrossRef]
- Ito, A.; Inatomi, M.; Huntzinger, D.N.; Schwalm, C.; Michalak, A.M.; Cook, R.; King, A.W.; Mao, J.; Wei, Y.; Mac Post, W.; et al. Decadal trends in the seasonal-cycle amplitude of terrestrial CO2 exchange resulting from the ensemble of terrestrial biosphere models. Tellus B Chem. Phys. Meteorol. 2016, 68, 28968. [Google Scholar] [CrossRef]
- Piao, S.; Sitch, S.; Ciais, P.; Friedlingstein, P.; Peylin, P.; Wang, X.; Ahlström, A.; Anav, A.; Canadell, J.G.; Cong, N.; et al. Evaluation of terrestrial carbon cycle models for their response to climate variability and to CO2 trends. Glob. Chang. Biol. 2013, 19, 2117–2132. [Google Scholar] [CrossRef] [PubMed]
- Wu, L.; Wang, S.; Bai, X.; Tian, Y.; Luo, G.; Wang, J.; Li, Q.; Chen, F.; Deng, Y.; Yang, Y.; et al. Climate change weakens the positive effect of human activities on karst vegetation productivity restoration in southern China. Ecol. Indic. 2020, 115, 106392. [Google Scholar] [CrossRef]
- Chen, Y.; Wang, S.; Wang, Y. Spatiotemporal Evolution of Cultivated Land Non-Agriculturalization and Its Drivers in Typical Areas of Southwest China from 2000 to 2020. Remote Sens. 2022, 14, 3211. [Google Scholar] [CrossRef]
- Jiang, S.; Chen, X.; Smettem, K.; Wang, T. Climate and land use influences on changing spatiotemporal patterns of mountain vegetation cover in southwest China. Ecol. Indic. 2021, 121, 107193. [Google Scholar] [CrossRef]
- Ding, Z.; Zheng, H.; Liu, Y.; Zeng, S.; Yu, P.; Shi, W.; Tang, X. Spatiotemporal Patterns of Ecosystem Restoration Activities and Their Effects on Changes in Terrestrial Gross Primary Production in Southwest China. Remote Sens. 2021, 13, 1209. [Google Scholar] [CrossRef]
- Tan, Z.; Tao, H.; Jiang, J.; Zhang, Q. Influences of climate extremes on NDVI (normalized difference vegetation index) in the Poyang Lake Basin, China. Wetlands 2015, 35, 1033–1042. [Google Scholar] [CrossRef]
- Wang, W.; Wang, W.J.; Li, J.S.; Wu, H.; Xu, C.; Liu, T. The impact of sustained drought on vegetation ecosystem in Southwest China based on remote sensing. Procedia Environ. Sci. 2010, 2, 1679–1691. [Google Scholar] [CrossRef]
- Tong, X.; Brandt, M.; Yue, Y.; Horion, S.; Wang, K.; De Keersmaecker, W.; Tian, F.; Schurgers, G.; Xiao, X.; Luo, Y.; et al. Increased vegetation growth and carbon stock in China karst via ecological engineering. Nat. Sustain. 2018, 1, 44–50. [Google Scholar] [CrossRef]
- Yue, X.; Zhang, T.; Shao, C. Afforestation increases ecosystem productivity and carbon storage in China during the 2000s. Agric. For. Meteorol. 2021, 296, 108227. [Google Scholar] [CrossRef]
- Xiao, J.; Zhou, Y.; Zhang, L. Contributions of natural and human factors to increases in vegetation productivity in China. Ecosphere 2015, 6, art233–20. [Google Scholar] [CrossRef]
- Hurtt, G.C.; Chini, L.P.; Frolking, S.; Betts, R.A.; Feddema, J.; Fischer, G.; Fisk, J.P.; Hibbard, K.; Houghton, R.A.; Janetos, A.; et al. Harmonization of land-use scenarios for the period 1500–2100: 600 years of global gridded annual land-use transitions, wood harvest, and resulting secondary lands. Clim. Chang. 2011, 109, 117–161. [Google Scholar] [CrossRef]
- Zhao, A.; Zhang, A.; Liu, X.; Cao, S. Spatiotemporal changes of normalized difference vegetation index (NDVI) and response to climate extremes and ecological restoration in the Loess Plateau, China. Arch. Meteorol. Geophys. Bioclimatol. Ser. B 2018, 132, 555–567. [Google Scholar] [CrossRef]
- Piao, S.; Fang, J.; Ji, W.; Guo, Q.; Ke, J.; Tao, S. Variation in a satellite-based vegetation index in relation to climate in China. J. Veg. Sci. 2004, 15, 219–226. [Google Scholar] [CrossRef]
- Liu, H.; Gong, P.; Wang, J.; Clinton, N.; Bai, Y.; Liang, S. Annual dynamics of global land cover and its long-term changes from 1982 to 2015. Earth Syst. Sci. Data 2020, 12, 1217–1243. [Google Scholar] [CrossRef]
- Rundqvist, S.; Hedenås, H.; Sandström, A.; Emanuelsson, U.; Eriksson, H.; Jonasson, C.; Callaghan, T.V. Tree and shrub expansion over the past 34 years at the tree-line near Abisko, Sweden. Ambio 2011, 40, 683–692. [Google Scholar] [CrossRef]
- Lian, Y.; You, G.J.-Y.; Lin, K.; Jiang, Z.; Zhang, C.; Qin, X. Characteristics of climate change in southwest China karst region and their potential environmental impacts. Environ. Earth Sci. 2015, 74, 937–944. [Google Scholar] [CrossRef]
- Yang, J.; Huang, X. 30 m annual land cover and its dynamics in China from 1990 to 2019. Earth Syst. Sci. Data Discuss. 2021, 1–29. [Google Scholar]
- Piao, S.; Fang, J.; Zhou, L.; Guo, Q.; Henderson, M.; Ji, W.; Li, Y.; Tao, S. Interannual variations of monthly and seasonal normalized difference vegetation index (NDVI) in China from 1982 to 1999. J. Geophys. Res. Earth Surf. 2003, 108, 4401. [Google Scholar] [CrossRef]
- Zhang, Y.; Zhu, Z.; Liu, Z.; Zeng, Z.; Ciais, P.; Huang, M.; Liu, Y.; Piao, S. Seasonal and interannual changes in vegetation activity of tropical forests in Southeast Asia. Agric. For. Meteorol. 2016, 224, 1–10. [Google Scholar] [CrossRef]
- Hou, W.; Gao, J.; Wu, S.; Dai, E. Interannual variations in growing-season NDVI and its correlation with climate variables in the southwestern karst region of China. Remote Sens. 2015, 7, 11105–11124. [Google Scholar] [CrossRef]
- Holben, B.N. Characteristics of maximum-value composite images from temporal AVHRR data. Int. J. Remote Sens. 1986, 7, 1417–1434. [Google Scholar] [CrossRef]
- Yuan, L.; Chen, X.; Wang, X.; Xiong, Z.; Song, C. Spatial associations between NDVI and environmental factors in the Heihe River Basin. J. Geogr. Sci. 2019, 29, 1548–1564. [Google Scholar] [CrossRef]
- Pei, J.; Wang, L.; Wang, X.; Niu, Z.; Kelly, M.; Song, X.-P.; Huang, N.; Geng, J.; Tian, H.; Yu, Y.; et al. Time series of Landsat imagery shows vegetation recovery in two fragile karst watersheds in southwest china from 1988 to 2016. Remote Sens. 2019, 11, 2044. [Google Scholar] [CrossRef]
- López, E.; Bocco, G.; Mendoza, M.; Duhau, E. Predicting land-cover and land-use change in the urban fringe: A case in Morelia city, Mexico. Landsc. Urban Plan. 2001, 55, 271–285. [Google Scholar] [CrossRef]
- Liu, J.; Zhang, Z.; Xu, X.; Kuang, W.; Zhou, W.; Zhang, S.; Li, R.; Yan, C.; Yu, D.; Wu, S.; et al. Spatial patterns and driving forces of land use change in China during the early 21st century. J. Geogr. Sci. 2010, 20, 483–494. [Google Scholar] [CrossRef]
- Lu, F.; Hu, H.; Sun, W.; Zhu, J.; Liu, G.; Zhou, W.; Zhang, Q.; Shi, P.; Liu, X.; Wu, X.; et al. Effects of national ecological restoration projects on carbon sequestration in China from 2001 to 2010. Proc. Natl. Acad. Sci. USA 2018, 115, 4039–4044. [Google Scholar] [CrossRef]
- Chen, Y.; Chen, L.; Cheng, Y.; Ju, W.; Chen, H.Y.H.; Ruan, H. Afforestation promotes the enhancement of forest LAI and NPP in China. For. Ecol. Manag. 2020, 462, 117990. [Google Scholar] [CrossRef]
- Zhang, S.; Bai, X.; Zhao, C.; Tan, Q.; Luo, G.; Cao, Y.; Deng, Y.; Li, Q.; Li, C.; Wu, L.; et al. Limitations of soil moisture and formation rate on vegetation growth in karst areas. Sci. Total Environ. 2022, 810, 151209. [Google Scholar] [CrossRef]
- Pan, Y.; Birdsey, R.A.; Fang, J.; Houghton, R.; Kauppi, P.E.; Kurz, W.A.; Phillips, O.L.; Shvidenko, A.; Lewis, S.L.; Canadell, J.G.; et al. A large and persistent carbon sink in the world’s forests. Science 2011, 333, 988–993. [Google Scholar] [CrossRef]
- Deng, J.S.; Wang, K.; Hong, Y.; Qi, J.G. Spatio-temporal dynamics and evolution of land use change and landscape pattern in response to rapid urbanization. Landsc. Urban Plan. 2009, 92, 187–198. [Google Scholar] [CrossRef]
- Nemani, R.R.; Keeling, C.D.; Hashimoto, H.; Jolly, W.M.; Piper, S.C.; Tucker, C.J.; Myneni, R.B.; Running, S.W. Climate-driven increases in global terrestrial net primary production from 1982 to 1999. Science 2003, 300, 1560–1563. [Google Scholar] [CrossRef] [PubMed]
- Forzieri, G.; Alkama, R.; Miralles, D.G.; Cescatti, A. Satellites reveal contrasting responses of regional climate to the widespread greening of Earth. Science 2017, 356, 1180–1184. [Google Scholar] [CrossRef] [PubMed]
- Yang, H.; Hu, J.; Zhang, S.; Xiong, L.; Xu, Y. Climate Variations vs. Human Activities: Distinguishing the Relative Roles on Vegetation Dynamics in the Three Karst Provinces of Southwest China. Front. Earth Sci. 2022, 10, 799493. [Google Scholar] [CrossRef]
- Piao, S.; Wang, X.; Ciais, P.; Zhu, B.; Wang, T.; Liu, J. Changes in satellite-derived vegetation growth trend in temperate and boreal Eurasia from 1982 to 2006. Glob. Chang. Biol. 2011, 17, 3228–3239. [Google Scholar] [CrossRef]
- Guan, Y.; Zheng, F.; Zhang, P.; Qin, C. Spatial and temporal changes of meteorological disasters in China during 1950–2013. Nat. Hazards 2015, 75, 2607–2623. [Google Scholar] [CrossRef]
- Peng, J.; Zhang, Q.Y.; Bueh, C. On the characteristics and possible causes of a severe drought and heat wave in the Sichuan-Chongqing region in 2006. Clim. Environ. Res. 2007, 12, 464–474. [Google Scholar]
- Huang, R.; Liu, Y.; Wang, L.; Wang, L. Analyses of the causes of severe drought occurring in Southwest China from the fall of 2009 to the spring of 2010. Chin. J. Atmos. Sci. 2012, 36, 443–457. [Google Scholar]
- Sun, L.; Ren, F.M.; Wang, Z.Y.; Liu, Y.Y.; Liu, Y.J.; Wang, P.L.; Wang, D.Q. Analysis of climate anomaly and causation in August 2011. Meteorol. Mon. 2012, 38, 615–622. [Google Scholar]
- Huang, Y.; Xu, C.; Yang, H.; Wang, J.; Jiang, D.; Zhao, C. Temporal and spatial variability of droughts in southwest china from 1961 to 2012. Sustainability 2015, 7, 13597–13609. [Google Scholar] [CrossRef]
- Qiao, Y.; Jiang, Y.; Zhang, C. Contribution of karst ecological restoration engineering to vegetation greening in southwest China during recent decade. Ecol. Indic. 2021, 121, 107081. [Google Scholar] [CrossRef]
- Tong, X.; Brandt, M.; Yue, Y.; Ciais, P.; Rudbeck Jepsen, M.; Penuelas, J.; Wigneron, J.-P.; Xiao, X.-P.; Song, X.-P.; Horion, S.; et al. Forest management in southern China generates short term extensive carbon sequestration. Nat. Commun. 2020, 11, 129. [Google Scholar] [CrossRef] [PubMed]
- Wang, S.; Zhou, L.; Chen, J.; Ju, W.; Feng, X.; Wu, W. Relationships between net primary productivity and stand age for several forest types and their influence on China’s carbon balance. J. Environ. Manag. 2011, 92, 1651–1662. [Google Scholar] [CrossRef] [PubMed]
- He, L.; Chen, J.M.; Pan, Y.; Birdsey, R.A.; Kattge, J. Relationships between net primary productivity and forest stand age in US forests. Glob. Biogeochem. Cycles 2012, 26, 394–415. [Google Scholar] [CrossRef]
- Xu, X.; Liu, H.; Lin, Z.; Jiao, F.; Gong, H. Relationship of abrupt vegetation change to climate change and ecological engineering with multi-timescale analysis in the karst region, Southwest China. Remote Sens. 2019, 11, 1564. [Google Scholar] [CrossRef]
- Zhang, C. Carbonate rock dissolution rates in different landuses and their carbon sink effect. Chin. Sci. Bull. 2011, 56, 3759–3765. [Google Scholar] [CrossRef]
- Škerlep, M.; Steiner, E.; Axelsson, A.L.; Kritzberg, E.S. Afforestation driving long-term surface water browning. Glob. Chang. Biol. 2020, 26, 1390–1399. [Google Scholar] [CrossRef]
- Feng, X.; Fu, B.; Piao, S.; Wang, S.; Ciais, P.; Zeng, Z.; Lü, Y.; Zeng, Y.; Li, Y.; Jiang, X.; et al. Revegetation in China’s Loess Plateau is approaching sustainable water resource limits. Nat. Clim. Chang. 2016, 6, 1019–1022. [Google Scholar] [CrossRef]
- Zhang, L.; Sun, P.; Huettmann, F.; Liu, S. Where should China practice forestry in a warming world? Glob. Chang. Biol. 2022, 28, 2461–2475. [Google Scholar] [CrossRef]
- Zhou, Q.; Luo, Y.; Zhou, X.; Cai, M.; Zhao, C. Response of vegetation to water balance conditions at different time scales across the karst area of southwestern China—A remote sensing approach. Sci. Total Environ. 2018, 645, 460–470. [Google Scholar] [CrossRef]
- Peng, S.-S.; Piao, S.; Zeng, Z.; Ciais, P.; Zhou, L.; Li, L.Z.X.; Myneni, R.B.; Yin, Y.; Zeng, H. Afforestation in China cools local land surface temperature. Proc. Natl. Acad. Sci. USA 2014, 111, 2915–2919. [Google Scholar] [CrossRef] [PubMed]
- Jiang, L.; Zhang, H.; Zhao, F.; Zhang, L.; Wang, X. Warming/cooling effect of cropland expansion during the 1900s~ 2010s in the Heilongjiang Province, Northeast of China. Int. J. Biometeorol. 2022, 66, 1379–1390. [Google Scholar] [CrossRef]
- Heyder, U.; Schaphoff, S.; Gerten, D.; Lucht, W. Risk of severe climate change impact on the terrestrial biosphere. Environ. Res. Lett. 2011, 6, 034036. [Google Scholar] [CrossRef]
- Xi, H.; Wang, S.; Bai, X.; Tang, H.; Luo, G.; Li, H.; Wu, L.; Li, C.; Chen, H.; Ran, C.; et al. The responses of weathering carbon sink to eco-hydrological processes in global rocks. Sci. Total Environ. 2021, 788, 147706. [Google Scholar] [CrossRef] [PubMed]
- Xue, S.-Y.; Xu, H.-Y.; Mu, C.-C.; Wu, T.-H.; Li, W.-P.; Zhang, W.-X.; Streletskaya, I.; Grebenets, V.; Sokratov, S.; Kizyakov, A.; et al. Changes in different land cover areas and NDVI values in northern latitudes from 1982 to 2015. Adv. Clim. Chang. Res. 2021, 12, 456–465. [Google Scholar] [CrossRef]
- Vanneste, T.J.M. Climate Change and Alpine Vegetation Shifts on Mountaintop Summits in Norway. Ph.D. Thesis, Universiteit Gent, Gent, Belgium, 2016. [Google Scholar]

| 2000–2019 | Cropland | Forest | Grassland |
|---|---|---|---|
| Cropland | 264,799.33 | 61,318.48 | 3956.10 |
| Forest | 55,715.85 | 719,978.95 | 4073.26 |
| Grassland | 4231.28 | 10,948.30 | 166,551.06 |
Publisher’s Note: MDPI stays neutral with regard to jurisdictional claims in published maps and institutional affiliations. |
© 2022 by the authors. Licensee MDPI, Basel, Switzerland. This article is an open access article distributed under the terms and conditions of the Creative Commons Attribution (CC BY) license (https://creativecommons.org/licenses/by/4.0/).
Share and Cite
Li, X.; Rong, L.; Zhang, M.; Yang, W.; Zeng, Z.; Yuan, C.; Wang, Q. Temporal Changes in Land Use, Vegetation, and Productivity in Southwest China. Land 2022, 11, 1331. https://doi.org/10.3390/land11081331
Li X, Rong L, Zhang M, Yang W, Zeng Z, Yuan C, Wang Q. Temporal Changes in Land Use, Vegetation, and Productivity in Southwest China. Land. 2022; 11(8):1331. https://doi.org/10.3390/land11081331
Chicago/Turabian StyleLi, Xuan, Li Rong, Mengmeng Zhang, Wensong Yang, Zhen Zeng, Chengjun Yuan, and Qi Wang. 2022. "Temporal Changes in Land Use, Vegetation, and Productivity in Southwest China" Land 11, no. 8: 1331. https://doi.org/10.3390/land11081331