Article

Analysis of the Difference in Changes to Farmers’ Livelihood Capital under Different Land Transfer Modes—A Case Study of Manas County, Xinjiang, China

1
Department of Geography, College of Science, Shihezi University, Shihezi 832000, China
2
Xinjiang Production and Construction Corps Key Laboratory of Oasis Town and Mountain-Basin System Ecology, Shihezi 832000, China
3
College of Water Conservancy & Architectural Engineering, Shihezi University, Shihezi 832000, China
4
Key Laboratory of Modern Water-Saving Irrigation Corps, Shihezi 832000, China
5
Xinjiang Institute of Ecology and Geography, Chinese Academy of Sciences, Urumqi 830011, China
*
Author to whom correspondence should be addressed.
These authors contributed equally to this work.
Land 2022, 11(8), 1369; https://doi.org/10.3390/land11081369
Submission received: 28 July 2022 / Revised: 15 August 2022 / Accepted: 19 August 2022 / Published: 22 August 2022
(This article belongs to the Special Issue Rural Land Use in China)

Abstract

:
Farmers’ livelihoods alter as a direct result of land transfer. This study examined the impacts of land transfer on several indicators of farmers’ livelihood capital, as well as variations in the effects of different land transfer methods on farmers’ capital, in an effort more effectively to enhance farmers’ livelihoods. To compare the changes in farmers’ livelihood capital under four different modes—the farmers’ spontaneous model, centralized and continuous, joint-stock cooperative, and leaseback and re-contracting—this study calculated farmers’ livelihood capital index based on 600 questionnaires in accordance with the sustainable livelihood capital framework. The study’s findings indicate the following outcomes: (1) Farmers’ livelihood capital is significantly impacted favorably by land transfers. (2) Different types of farmers experienced different changes in their livelihood capital after land transfer: purely agricultural farmers’ livelihood capital value increased by 0.138, primarily due to an increase in physical capital; agricultural part-time farmers’ livelihood capital value increased by 0.105; non-agricultural part-time farmers’ livelihood capital value increased by 0.081; and non-agricultural farmers’ livelihood capital value increased by 0.081. (3) The most efficient strategy to increase livelihood capital was to use the leaseback and recontracting model with “village collective + planting leadership company” as the primary business organization. The results provide practical guidance for land transfer in Manas County, and valuable suggestions for improving farmers’ livelihoods in arid areas.

1. Introduction

Rural areas currently have inadequate land income, low land use efficiency, and some farmers have even left their farms [1,2,3]. As a result, appropriate and organized use of land has become crucial [4,5]. The transfer of land use rights is referred to as a land transfer. Improved land use efficiency and higher land revenue are the goals of legally transferring a farmer’s land to other farmers or commercial groups while keeping contracting and usage rights. Land transfer is an efficient way to support rural economic development and raise farmers’ living standards, since it may effectively reduce land abandonment, encourage agricultural scale operations, and boost farmers’ revenue [6,7,8]. Land transfer has drawn a great deal of attention from academics both domestically and internationally due to the rapid expansion of the social economy, which has caused a huge number of farmers in developing nations to move to cities and a corresponding increase in the act of land transfer [9,10]. Because in many other nations outside China land is typically exchanged directly on the land market and is privately held, research on land transfer by foreign academics has tended to concentrate on land transactions, land rent, price, and the land market system [11,12]. For instance, Wineman et al. [9] contend that various effects on land allocation may result from different land market transactions. According to Weldesilassie Alebel B and colleagues, effective land management is a crucial component of rapid urbanization. Kibrom et al. [13] examined how land markets responded to changes in land scarcity in terms of re-rental market participation rates, pricing, and contractual structures, using nationally representative household survey data from Ethiopia, Malawi, and Tanzania. In China, ownership, contractual rights, and management rights are segregated into separate categories, under the notion of “separation of the three rights” [14]. Land transfers in China started to happen in the 1980s. The three main models are the lease model, which is exemplified by the Xiaogang area in Anhui [15], the exchange model exemplified by the Jiangjin area in Chongqing [16] and Shawan County in Xinjiang [17], and the transfer of contractual land rights through subcontracting and transferring to other farmers within a set time frame. Although academics have conducted several studies in this field, most of these have focused on a particular land transfer model [18,19,20], and very few have compared the variations among them.
Farmers are the primary beneficiaries of land transfers. These transfers will directly affect farmers’ livelihoods, and studies on land transfers must take this into account. The land, assets, capabilities, and household income of farmers are collectively referred to as livelihood capital, within the sustainable livelihoods framework proposed by the UK Department for International Development (DFID) [21], and are further divided into natural capital, financial capital, social capital, and human capital [22]. Natural capital is the land that farmers own; financial capital is the money they have or can access; social capital refers to the social resources to which they have access; physical capital includes the tools, materials, equipment, and facilities they use for production and living; and human capital is the knowledge, education, and health status they rely on to make a living. Land transfer alters the amount of land that farmers own, by transferring land management rights. Some farmers may obtain more concentrated land, which may lower their production costs [23,24]. Other farmers may transfer their land to other work and have access to more social resources, which will diversify the sources of their income.
According to the available research, land transfer alters farmers’ capital which affects their means of subsistence. Although there are several types of land transfer, few researchers have looked at variations in how various modalities affect farmers’ capital for livelihood [25]. Most studies, particularly in arid and semi-arid regions, have paid less attention to the difficulties faced by farmers who sustain their livelihoods in less developed areas. Their economic growth is sluggish and resource-poor. There are significant disparities between dry and developed regions in the current state of farmers’ livelihood capital [26,27]. However, the degree of agricultural growth in dry regions is low, and issues with dispersed farmers and fragmented land are significant [28]. The current study findings are intractable. Therefore, it is important to research how farmers in arid and semi-arid areas make a living. The leading agricultural production and animal husbandry area in western China is in the region of Xinjiang [29], which is a typical arid and semi-arid region. According to the third land survey, there are now 70.767 million hectares of cultivated land in Xinjiang. Within Xinjiang, Manas County is situated in the economic region of the Tianshan Mountains’ northern side. The county has a strong base for agricultural growth and is predominantly agricultural [30,31]. In Manas County, a sizable number of land transfer methods have evolved as a result of the expansion of agricultural and rural regions [32]. The revenue of farmers has increased to some extent due to the variety of transfer channels. The productivity of most land in the area is still low, and farmers’ livelihoods are precarious. Farmers that take part in land transfers may only manage to secure a temporary source of income, and be unable to establish a sustainable source of income [33,34]. At present, it is important to investigate how land transfers in Manas County affect farmers’ livelihood capital, and to determine the best way to transfer land.
Therefore, the study region for this work was Manas County in Xinjiang, and the research subjects were 600 farmers who were chosen at random from eight villages and four towns in Manas County. First, the livelihood capital evaluation system was constructed to calculate the sampled farmers’ livelihood capital. Second, the land management method was assessed to determine how Manas County organizes its land transfer. Next, analysis of the land transfer included various changes and differences to farmers’ livelihood capital under various land transfer mechanisms, and finally further assessed the most appropriate land transfer mode in Manas County. The research concept, index system, and research findings of this study can serve as a reference for other arid and semi-arid regions, to improve the efficiency of rural land transfer and the livelihood of farmers in those regions. Although this study investigated only the Xinjiang region of China, the study area is representative of the typical arid and semi-arid regions to which it belongs.

2. Materials and Methods

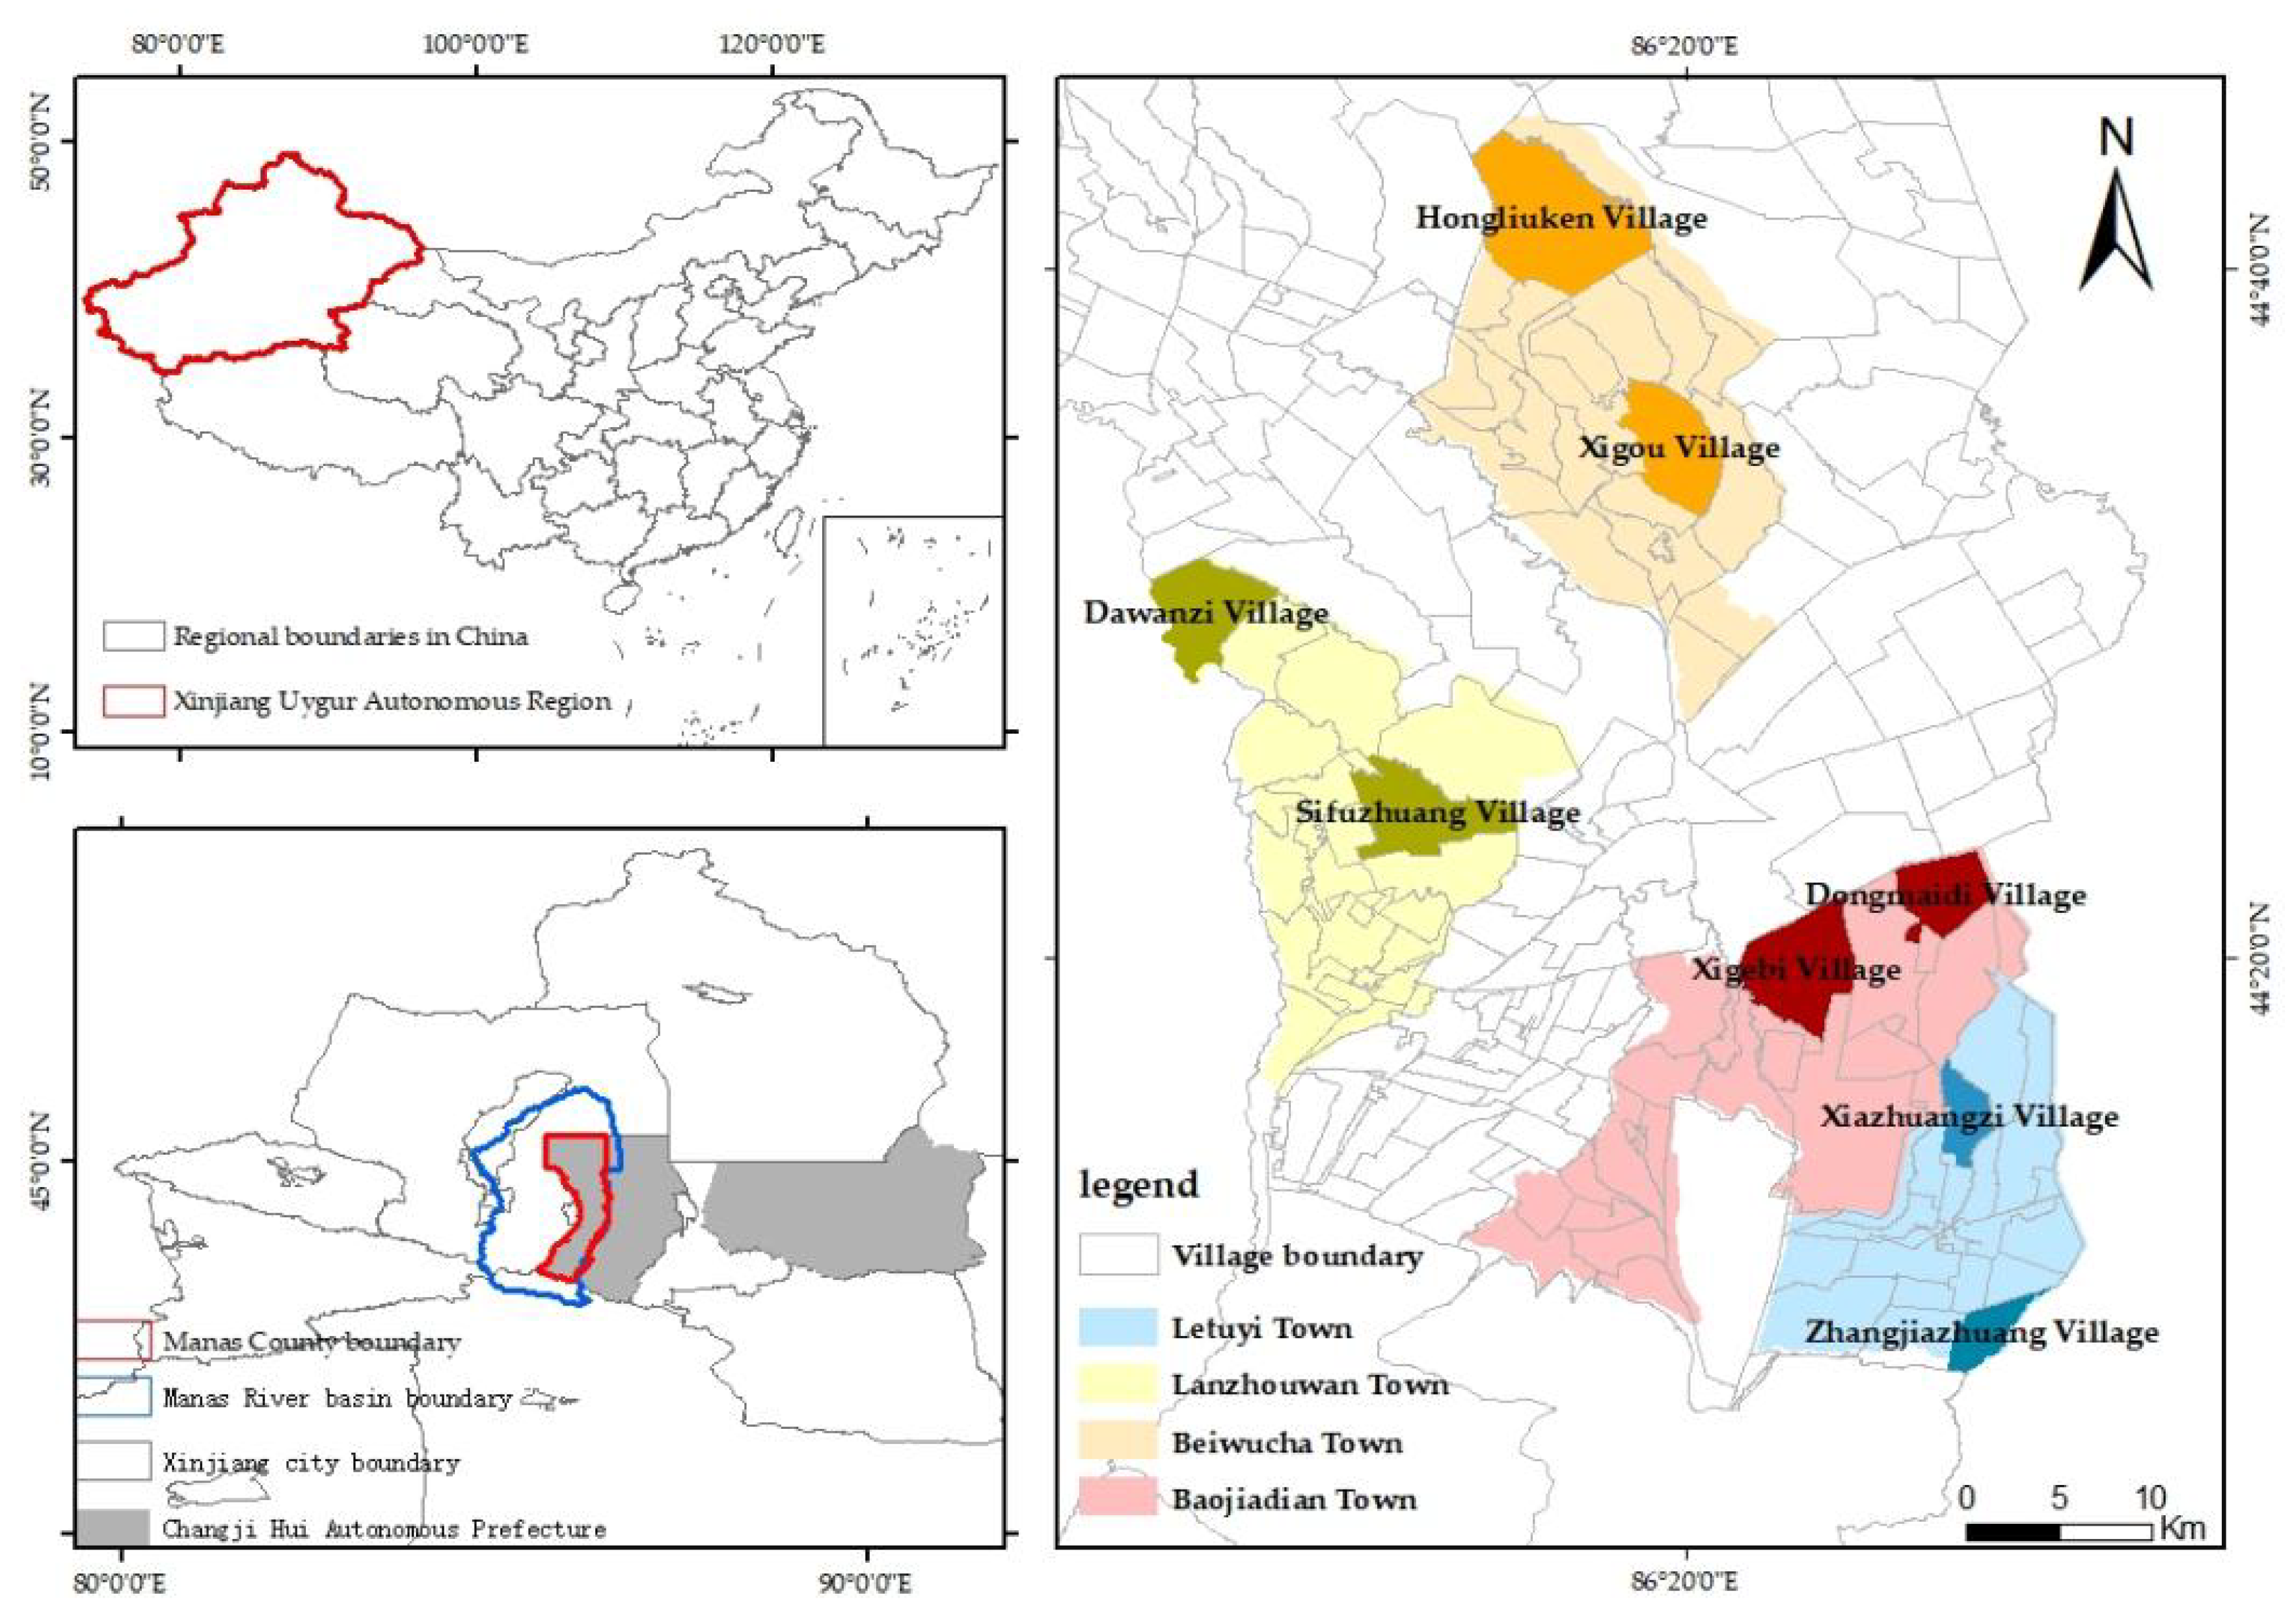
2.1. Study Area Overview

The westernmost county in the Changji Hui Autonomous Prefecture is Manas County, which is part of the Xinjiang Uygur Autonomous Region and is situated in the Manas River Basin. Its location is between 43°21′21″ and 45°20′ N, and 85°40′ to 86°31′32″ east. See Figure 1 for details. Manas County’s overall in 2021 was 1.102 million hectares, including 163,000 hectares of irrigated arable land, 13 townships, 81 administrative villages, 24,311 farmers, and 43,586 rural employees, while 34,669 rural jobs can be found in the countryside (28,718 agricultural workers). The principal industry in Manas County accounted for 475.202 million yuan of the county’s 1534.769 million yuan GDP in 2021 [35]. Situated on the Tianshan Mountains’ northern side, Manas County is a significant agricultural production area. By the end of 2020, Manas County has passed various types of transfer. The current rural land transfer area of Manas County exceeds 25,000 hectares, and the number of households participating in land transfer is 6827, with a transfer rate of 56%, showing great agricultural development potential and research value [36].

2.2. Data Source and Sample Characteristics

Socioeconomic statistics and survey data comprise the majority of this study’s data. The questionnaire data originated from the visiting survey that the research group undertook in Manas County between June and September 2021. The social and economic statistics data were taken from the “Xinjiang Statistical Yearbook” and the “Manas County Statistical Yearbook data” (Table 1). This study selected Xiazhuangzi Village, Zhangjiazhuang Village, Dawanzi Village, Sifuzhuang Village, Hongliukeng Village, Xigou Village, Dongmaidi Village, and Xibibibi Village in Letuyi Town, Lanzhouwan Town, Beiwucha Town, and Baojiadian Town, with consideration given to the difficulty of data acquisition and data integrity. A total of 600 households were chosen at random, including 200 families in nearby villages that were not involved in land transfers and 400 homes in the transfer-affected township itself. A participatory farmer assessment approach [37] was employed to allow in-depth discussions with farm households, focusing mostly on the fundamental circumstances of families, such as income, savings, and educational attainment of family members. In all, 571 valid questionnaires were collected covering the two topics involved in the transfer: form of land transfer and transfer area. The 95.2% effective return rate satisfied the study’s data criteria. Through surveys and interviews, the characteristics of the sample farmers were compiled (Table 2).

2.3. Research Methodology

2.3.1. Division of Farmers and Land Transfer Mode

The farmers in the study area were divided into four groups based on the ratio of their non-agricultural income to total income: agricultural farmers, agricultural part-time farmers, non-agricultural farmers, and non-agricultural part-time farmers. The percentages of their non-agricultural income are shown in Table 3 as less than 10%, 10%–50%, 50%–90%, and more than 90%.
Based on the existing studies, four typical townships in Manas County were chosen as representatives, and two villages in each township were chosen to suggest the four most prevalent land transfer modes in the county: the farmers’ spontaneous mode, the centralized continuous mode, the joint-stock cooperative model, and the leaseback and re-contracting mode. The land transfer modes were classified according to the differences in the operating agents after the land transfers. Different land transfer strategies were categorized according to how the land was managed. The farmers’ spontaneous mode was categorized as individual operation, the centralized continuous mode as family operation, and the joint-stock cooperative model and leaseback and re-contracting mode were defined as collective operation. To compare variations in the changes in farmers’ livelihood capital under various land transfer models, the meanings, transfer modalities, and characteristics of the various models were compiled and studied, as shown in Table 4.

2.3.2. Quantitative Model of Livelihood Capital

In their research evaluating farmers’ livelihoods, local and foreign academics have in recent years proposed a range of assessment index systems [41]. This present study adopted the sustainable livelihood framework (SLF), currently the most popular framework, proposed by the United Kingdom International Development Agency (DFID), taking into account a combination of economic, social, and ecological positions. This study integrated the research findings of Zhang et al. and further separates physical capital into productive capital and living capital, in order to more fully depict the influence of land on farmers’ livelihoods [42]. As a result, six different types of capital were considered in this study: natural capital, financial capital, human capital, social capital, production capital, and living capital. In this article, 18 evaluation elements from six categories were chosen in accordance with the framework and survey data from cities and villages in the Manas River Basin. Table 5 details the material and assignment requirements:
The methods of determining the indicator weights were primarily hierarchical analysis, expert scoring, and the entropy method [43]. In order to eliminate subjectivity in the assignment and the repetitiveness of the indicator attributes, this study used the entropy method to determine the weights. The specific calculation process was as follows.
First, the indicator data were invariantly steeled [44]. This selection used the extreme difference standardization method to standardize the replicated data to eliminate the effect of different data magnitudes; the formula is as follows:
M i j = ( X i j m i n X j ) / ( m a x X j m i n X j )
where Mij is the standardized value of item i under the jth indicator, Xij is the value of livelihood capital assigned to the i-th farmer under the jth indicator, minXj and maxXj are the maximum and minimum values of the jth livelihood capital assigned, respectively.
The Mij was normalized by the formula:
I i j = M i j / i = 1 m M i j + 0.001
where Iij is the normalized value, m is the farmer’s value, and 0.001 is the overall shift to the right to prevent the presence of a 0 value and to facilitate subsequent calculations.
Next, the entropy values and entropy weights ej, Wj, of each indicator were calculated with the following equations:
e j = 1 / ln m i = 1 m I i j ln I i j
W j = 1 e j / j = 1 n ( 1 e j )
where, ej (0 ≤ ej ≤ 1) is the entropy value of the jth indicator, −1/Inm is the information entropy coefficient, Wj is the entropy weight of the jth indicator, and n is the number of livelihood capital indicators.
Finally, the value of the livelihood capital indicator of farm households was calculated, with the magnitude of the value reflecting the level of livelihood capital. The formula is:
B i j = i = 1 n I i j W j    
where Bij is the value of each livelihood capital indicator of the ith farmer, Iij is the normalized value of each livelihood capital indicator of the farmer, and Wj is the weight of each livelihood capital indicator.

2.3.3. Difference-in-Differences Model

The difference-in-differences model [45] involves comparing the effect of a research subject before and after the intervention of a specific factor, and the difference between the two is the net effect of that factor on the research subject [34]. The basic idea is to divide the survey sample into two groups: one group of subjects affected by the specific factor, namely the “experimental group”, and one group of subjects not affected by the specific factor, namely the “control group”. The specific model is expressed as follows:
  Y i j = β 0 + β 1 T r e a t i j + β 2 P e r i o d i j + β 3 D I D i j + ε i j
D I D i j = T r e a t i j P e r i o d i j
where i = 1 represents the pre-intervention period, i = 2 represents the post-intervention period, j represents the subject, Yij represents the value to be measured for the jth subject in period I, Periodij is a time dummy variable, Period1j = 0 represents pre-intervention, Period2j = 1 represents post-intervention, Treatij is a group dummy variable, Treatij = 0 is the control group, Treatij = 1 is the experimental group, DID is the cross term of Treatij and Periodij, the ε ij is the unobserved other variables affecting Yij controlled not to change.
Depending on the characteristics, it is possible to write separate models of changes in the variables to be measured in the control and treatment test subjects, before and after the factor intervention.
The control group Treatij = 0 was modeled as Y i j = β 0 + β 2 P e r i o d i j + ε i j . Therefore, the values to be measured for the control group in the periods before and after the factor intervention were:
Y i j = { β 0 + ε i j ,     i = 1 β 0 + β 2 + ε i j ,     i = 2                    
The changes in the values to be measured in the control group before and after the factor-specific intervention were:
d i f f 1 = ( β 0 + β 2 + ε i j ) ( β 0 + ε i j ) = β 2
The experimental group Treatij = 1 was modeled as   Y i j = β 0 + β 1 + β 2 P e r i o d i j + β 3 P e r i o d i j + ε i j . Therefore, the values to be measured for the control group in the two periods before and after the factor intervention were:
Y i j = { β 0 + β 1 + ε i j ,     i = 1   β 0 + β 1 + β 2 + β 3 + ε i j ,     i = 2                                                                                                                
The changes in livelihood capital in the experimental group before and after the ad hoc factor intervention were:
d i f f 2 = ( β 0 + β 1 + β 2 + β 3 + ε i j ) ( β 0 + β 1 + ε i j ) = β 2 + β 3
Thus, the net effect of a given factor on the observations of the subject to be measured is:
d i f f = ( β 2 + β 3 ) β 2 = β 3
The final value β3 is the final double difference value to be obtained. When β3 > 0, it indicates that the specific factor had a positive effect on the study subject; when β3 < 0, it indicates that the specific factor’s effect was negative effect. The larger the absolute value of β3, the greater the degree of influence of the specific factor on the study subject.

3. Results and Analysis

3.1. Analysis of Changes in Livelihood Capital of Different Types of Farmers

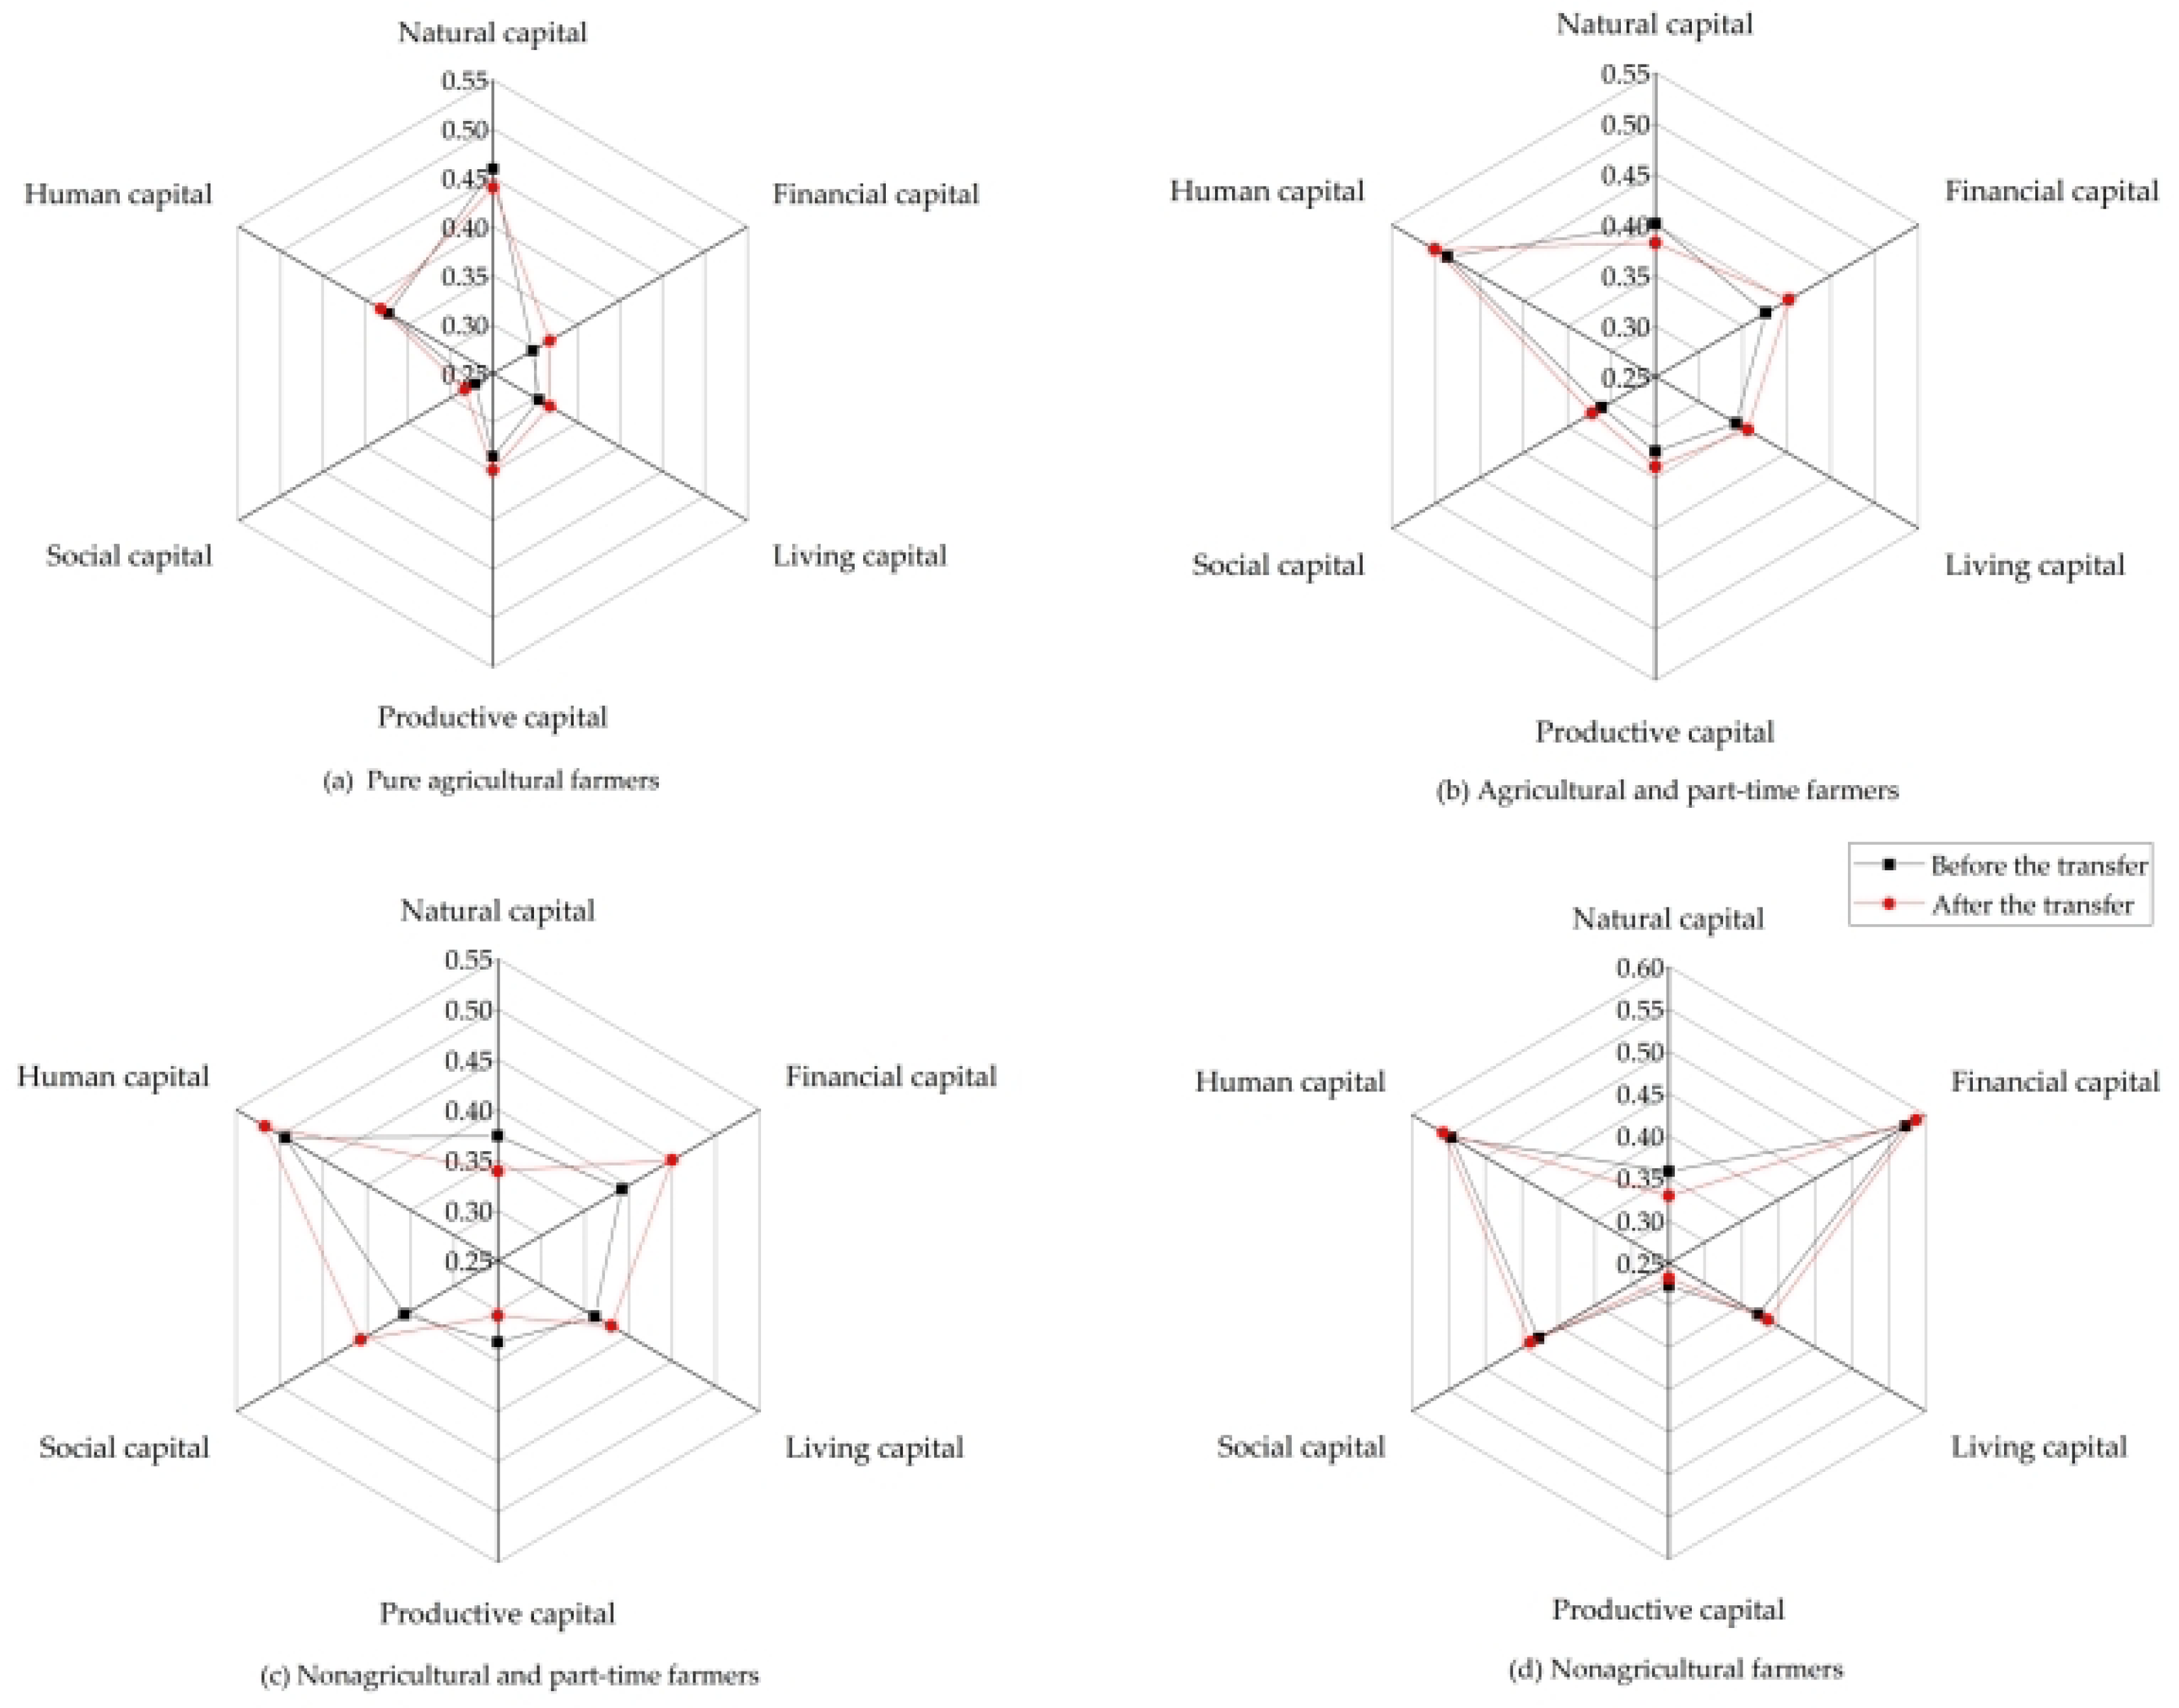
3.1.1. Description of Differences in Livelihood Capital of Different Types of Farmers

As shown in Table 6, the livelihood capital of non-agricultural and non-agricultural part-time farmers before land transfer was higher, with values of 2.553 and 2.309, respectively, while that of purely agricultural and agricultural part-time farmers was lower, with respective values of 2.039 and 2.241. This indicates that part-time farming has a positive effect on the livelihood capital of farmers.
Specifically, natural capital was highest for purely agricultural farmers, followed by agricultural part-time farmers and non-agricultural part-time farmers, while non-agricultural farmers had the lowest natural capital index values; the values were 0.459, 0.401, 0.374, and 0.358, respectively. The natural capital of these farmers was lower because they were engaged in non-agricultural activities, as non-agricultural farmers are mainly engaged in non-agricultural activities to maintain their livelihoods.
Financial capital was highest for non-agricultural farmers, followed by non-agricultural part-time farmers and agricultural part-time farmers, and the lowest values were for purely agricultural farmers, with indicator values of 0.573, 0.392, 0.376, and 0.297, respectively. Differences in financial capital of farmers were found in terms of annual household income, and farmers engaged in non-agricultural activities had a wider range of livelihood sources. Most of them go out to work, so their income is more stable than farming and is not limited by land quality and natural conditions.
Livelihood capital was highest for non-agricultural farmers, followed by non-agricultural part-time farmers and agricultural part-time farmers, and the lowest livelihood capital was for purely agricultural farmers, with livelihood capital values of 0.372, 0.361, 0.342, and 0.304, respectively. Differences in livelihood capital were primarily found in the two indicators of housing quality and availability of transportation, with non-agricultural and part-time farmers not simply dependent on the land for their livelihood, but having a wider variety of livelihood sources and higher living capital.
Purely agricultural and agricultural part-time farmers had greater levels of productive capital than non-agricultural part-time farmers, who had the lowest levels. Production capital returned the following values: 0.335, 0.324, 0.331, and 0.277, correspondingly. The differences in productive capital were primarily due to differences in the number of productive tools, with farmers who were primarily dependent on land as a source of income generally acquiring more productive tools. Additionally, local government is strengthening the construction of farmland water conservation to increase production.
Human capital was highest for non-agricultural farmers, followed by part-time farmers, and was lowest for purely agricultural farmers, with indicator values of 0.546, 0.494, 0.487, and 0.373, respectively. Differences in human capital were mainly manifested in the educational level and health status of the labor force. Non-agricultural farmers had relatively higher education levels and filled a wider range of occupations.
Social capital was highest for non-agricultural farmers, followed by part-time farmers, and lowest for purely agricultural farmers, with indicator values of 0.427, 0.357, 0.311, and 0.271, respectively. As farmers increase their part-time employment, their understanding of national policies increases, and the social security they can enjoy also increases. In the process of engaging in more part-time employment, farmers’ social interactions increase and their social capital increases.

3.1.2. Analysis of the Direction of Change in Livelihood Capital of Different Types of Farmers

Combining Table 6 with Figure 2 above, it can be calculated that the capital worth of pure farmers’ livelihoods after land transfer was 2.177, which was 0.138 more than before the land transfer. Agricultural part-time farmers’ livelihood capital value was 2.346, which was 0.105 higher than before circulation. Non-agricultural part-time farmers’ livelihood capital value was 2.390, which was 0.081 higher than before circulation. Non-agricultural farmers’ livelihood capital value was 2.578, which was 0.025 higher than before circulation. When compared to other capital, pure farmers’ productive capital expanded greatly, while natural and financial capital increased only somewhat. Pure farmers tended to participate in land transfer by moving out plots of land that are far away or of poor quality, keeping plots of land that are of superior quality, and moving onto existing land near to their land to increase their operational scale. To boost the productivity of the remaining land, better instruments were obtained for it the same time.
In contrast to pure farmers, agricultural and non-agricultural part-time farmers’ natural capital declined while their social capital rose dramatically. The other components of their capital were virtually unaffected. Compared to non-agricultural part-time farmers, who continued to focus primarily on land management, they experienced less loss of natural capital. However, these farmers work part-time jobs that will improve their social interactions, diversify their sources of income, and raise their incomes, so building their social and financial capital.
Natural and productive capital in non-agricultural farmers declined, whereas livelihood capital increased. Human, financial, and social capital all changed less, and livelihood capital did not change considerably. Because non-agricultural farmers have forgone agricultural activities and have an income that is entirely unrelated to agriculture, the process of land transfer essentially has no impact on these farmers’ ability to support themselves. As a result, the change in their livelihood capital was insignificant.

3.2. Analysis of Changes in Farmers’ Livelihood Capital under Different Land Transfer Modes

3.2.1. Descriptive Analysis of the Impact of Different Land Transfer Modes on Farmers’ Livelihood Capital

There are variations in the final land management impacts and the advantages that farmers receive from land transfers, as a result of the various methods of trading land management rights in different models and the various operators after the land transfer. Table 7 shows the before-and-after mean differences in farmers’ capital for sustaining their livelihood under various land transfer strategies. The findings reveal that the double difference estimates of the total value of farmers’ livelihood capital before and after land transfer in the four modes were 0.058, 0.071, 0.111, and 0.122, respectively. Based on these findings, it can be said that all four land transfers have a positive impact on farmers’ livelihood capital, at least in part, or that they encourage the expansion of that capital.

3.2.2. Econometric Analysis of the Impact of Different Transfer Modes on the Livelihood Capital of Farmers

This study conducted econometric analysis by various methods on the effect of land transfer on farmers’ livelihood capital, in order to confirm the aforementioned conclusion. Farmers that did not participate in land transfer around the community were considered the control group in this study, whereas farmers in villages that used one of four land transfer modalities were considered the experimental group. The net benefit of each mode on farmers’ livelihood capital was calculated using Equations (6)–(12) and STATA 22.0, specifically with reference to Table 8. The outcomes can be seen in Table 9, which shows positive and significant DID values for individual, family, and collective land transfers on farmers’ livelihood capital, with coefficients of 0.17, 0.183, and 0.2491, respectively. Among the models, the leaseback and re-contract mode and the land stock cooperative mode had higher DID values and a greater impact on farmers’ capital for livelihood.
This study evaluated the variations in impact on farmers’ livelihood capital of the two land transfer mechanisms involving collective management, to further investigate the most suitable land transfer mode in the study region. Farmers who used the land shareholding cooperative method are referred to as control group D, whereas those who used the land-leaseback contracting style were considered experimental group C. The intra-group and component differences in the values of the two models’ livelihood capital indices are shown in Table 10. The DID estimate value for experimental groups C and D was 0.048, as seen in Table 10, which is favorable and significant. This demonstrates that when land was transferred through the land leaseback contractual model, the improvement in farmers’ livelihood capital, notably in financial capital and social capital, was more evident. This is mostly due to the fact that under the leaseback contracting mode, the “village collective + planting leadership firm” is primarily responsible for operating the property. They receive the land rented from the original farmers, design it uniformly, construct agricultural infrastructure, split the property after replanning, and lease it to farmers. This procedure may involve the whole agricultural supply chain, including the production and storage of agricultural goods as well as their distribution and sale. A high level of expertise and organization is required, which may support farmers’ development while the process is being realized. As a result, farmers can gain more from this manner of land transfer since the operational scale is higher after the transfer. The DID value of human capital is negative, which means that the impact of the joint-stock cooperative model is slightly greater than that of the leaseback contracting model on the human capital of farmers. This may be because the land-leaseback contracting model includes a higher degree of modern agricultural technology and a lower participation of ordinary labor in the land transfer. This finding is also supported by the regression results.

3.2.3. Robustness Test
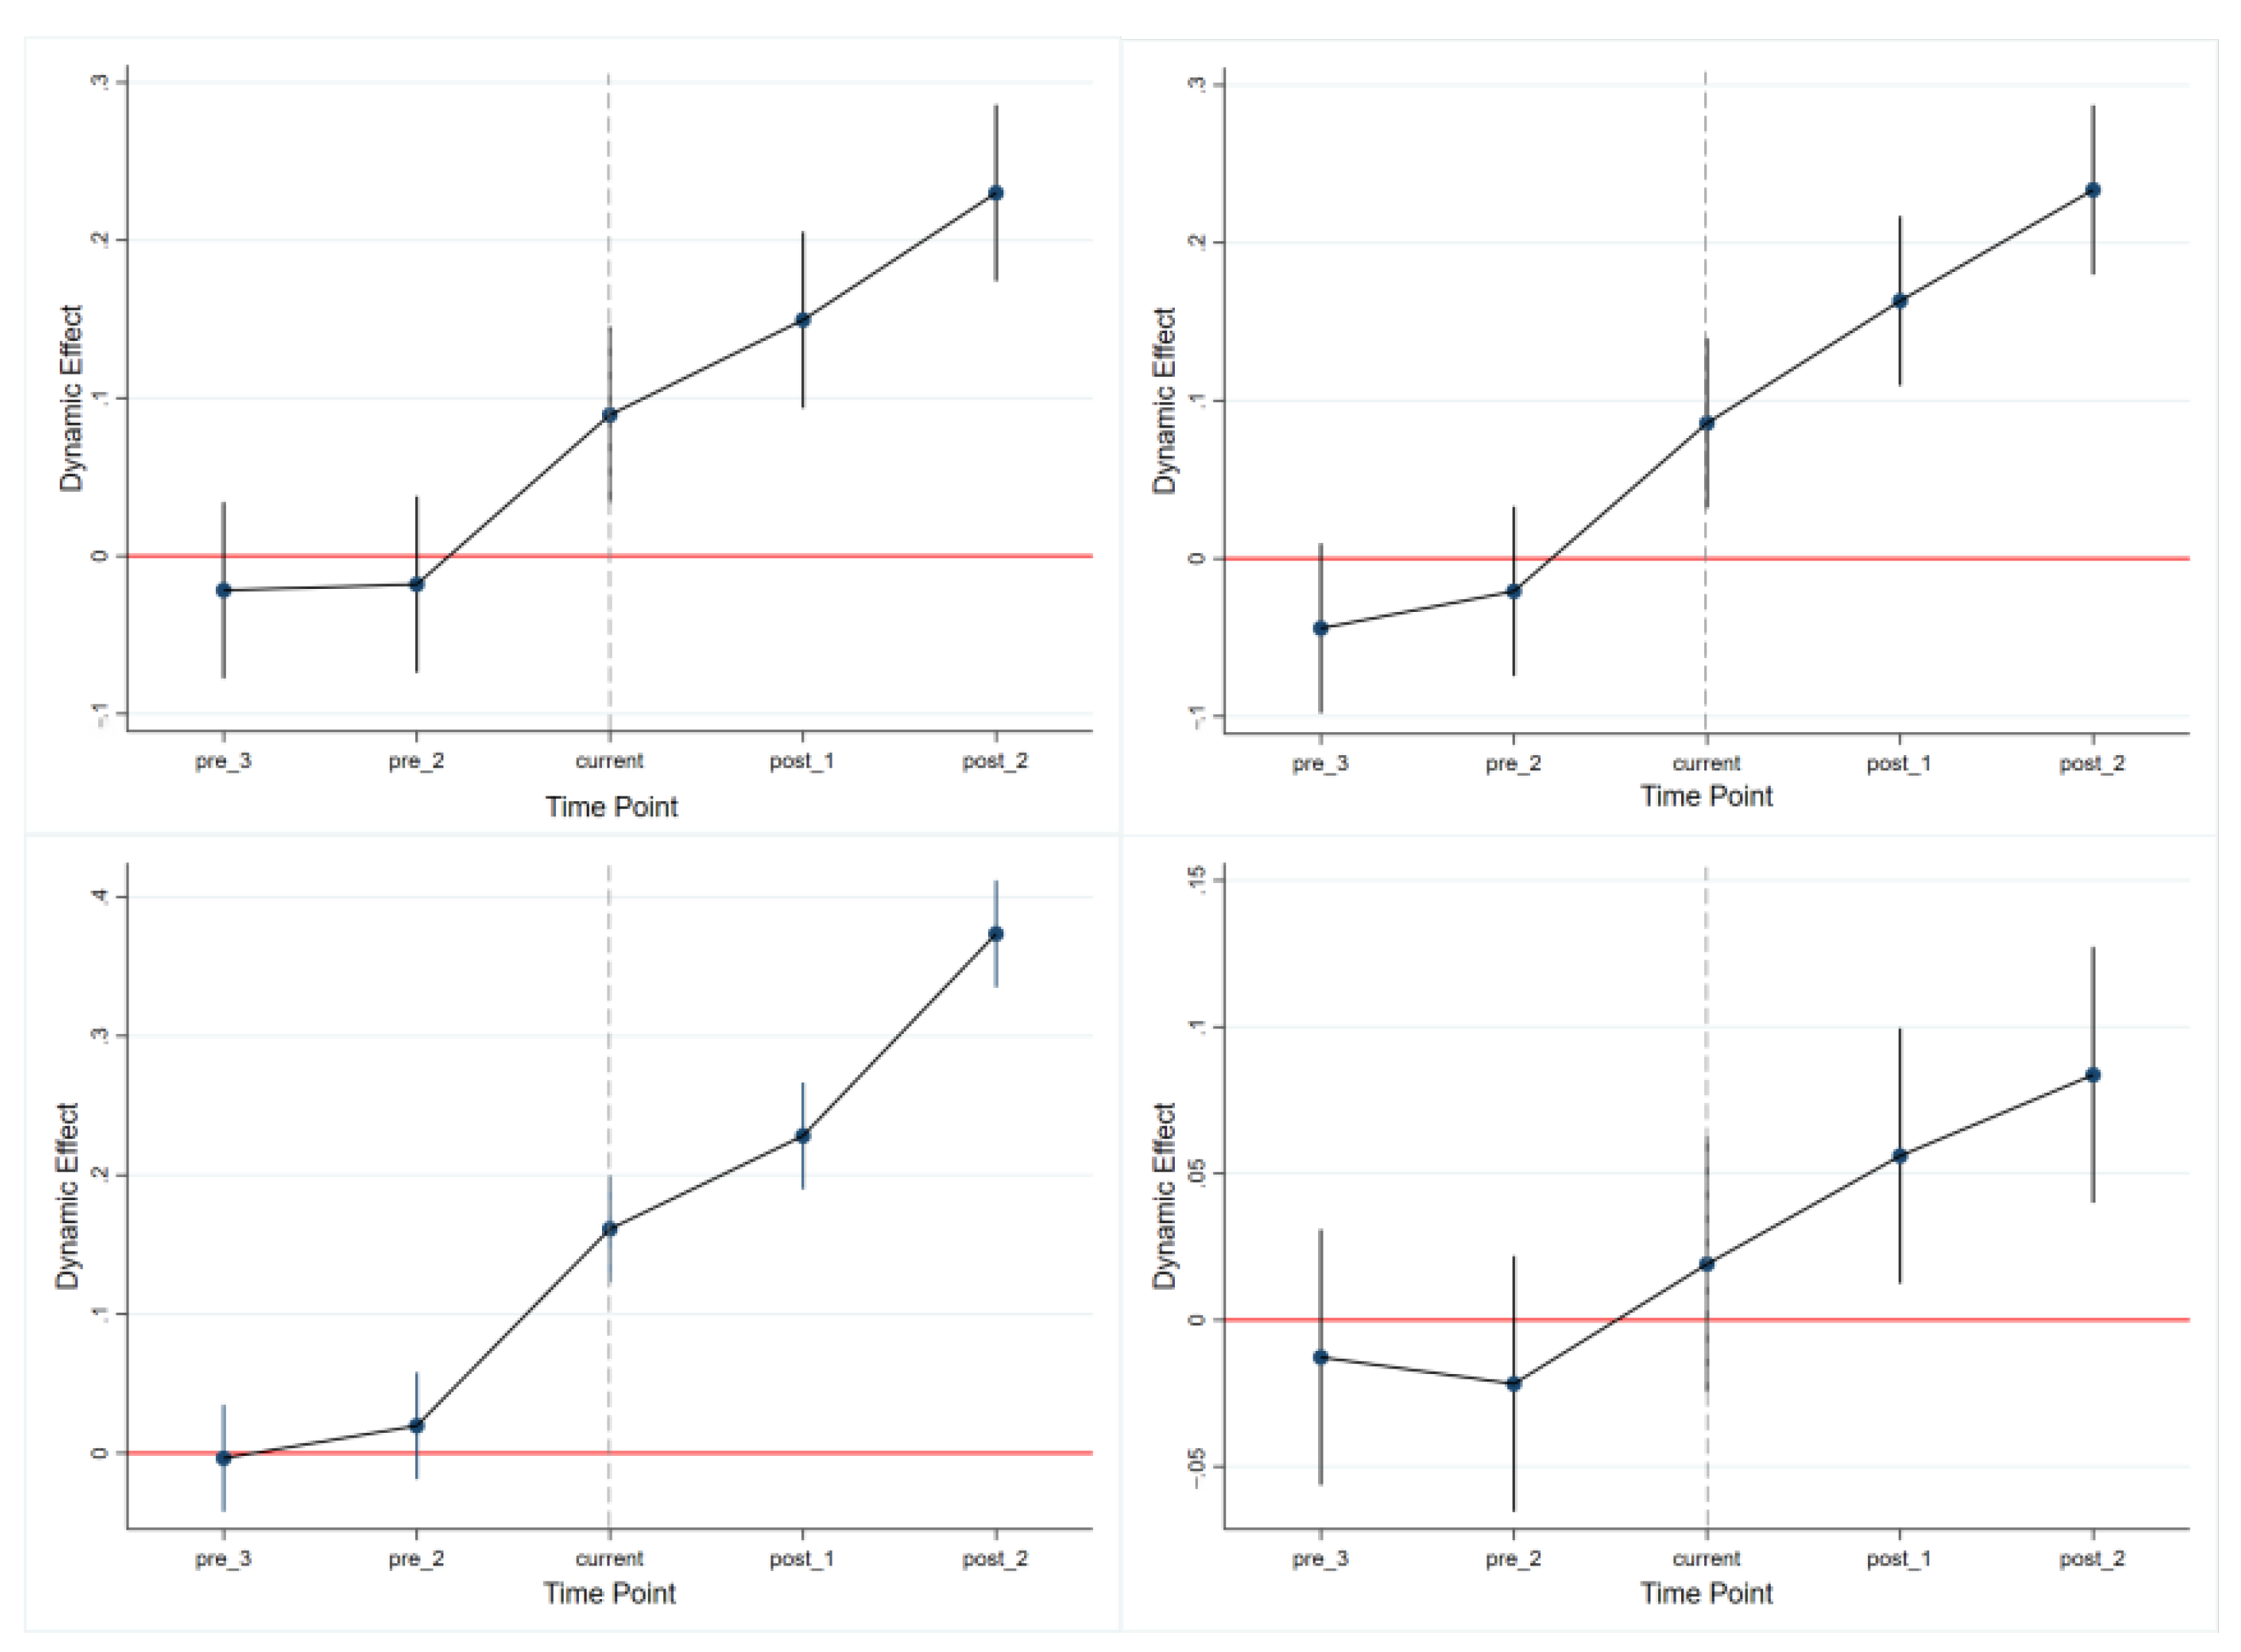
The endogeneity issue in policy evaluation can be better addressed by the twofold difference method, but it must be founded on a number of key presumptions, requiring parallel trend tests and placebo testing [46,47]. In this regard, experiments pertaining to the identification hypothesis from various aspects were conducted in this study.

Parallel Trend Test

The 95 percent confidence interval before land transfer (pre 2, pre 1 in the Figure 3) contained 0, demonstrating that the trend of the change in farmers’ livelihood capital was similar between the experimental and control groups before t. Parallel trend tests were conducted on the aforementioned four groups of experiments, respectively, to confirm the viability of the double difference method and the identifiability of the regression results.

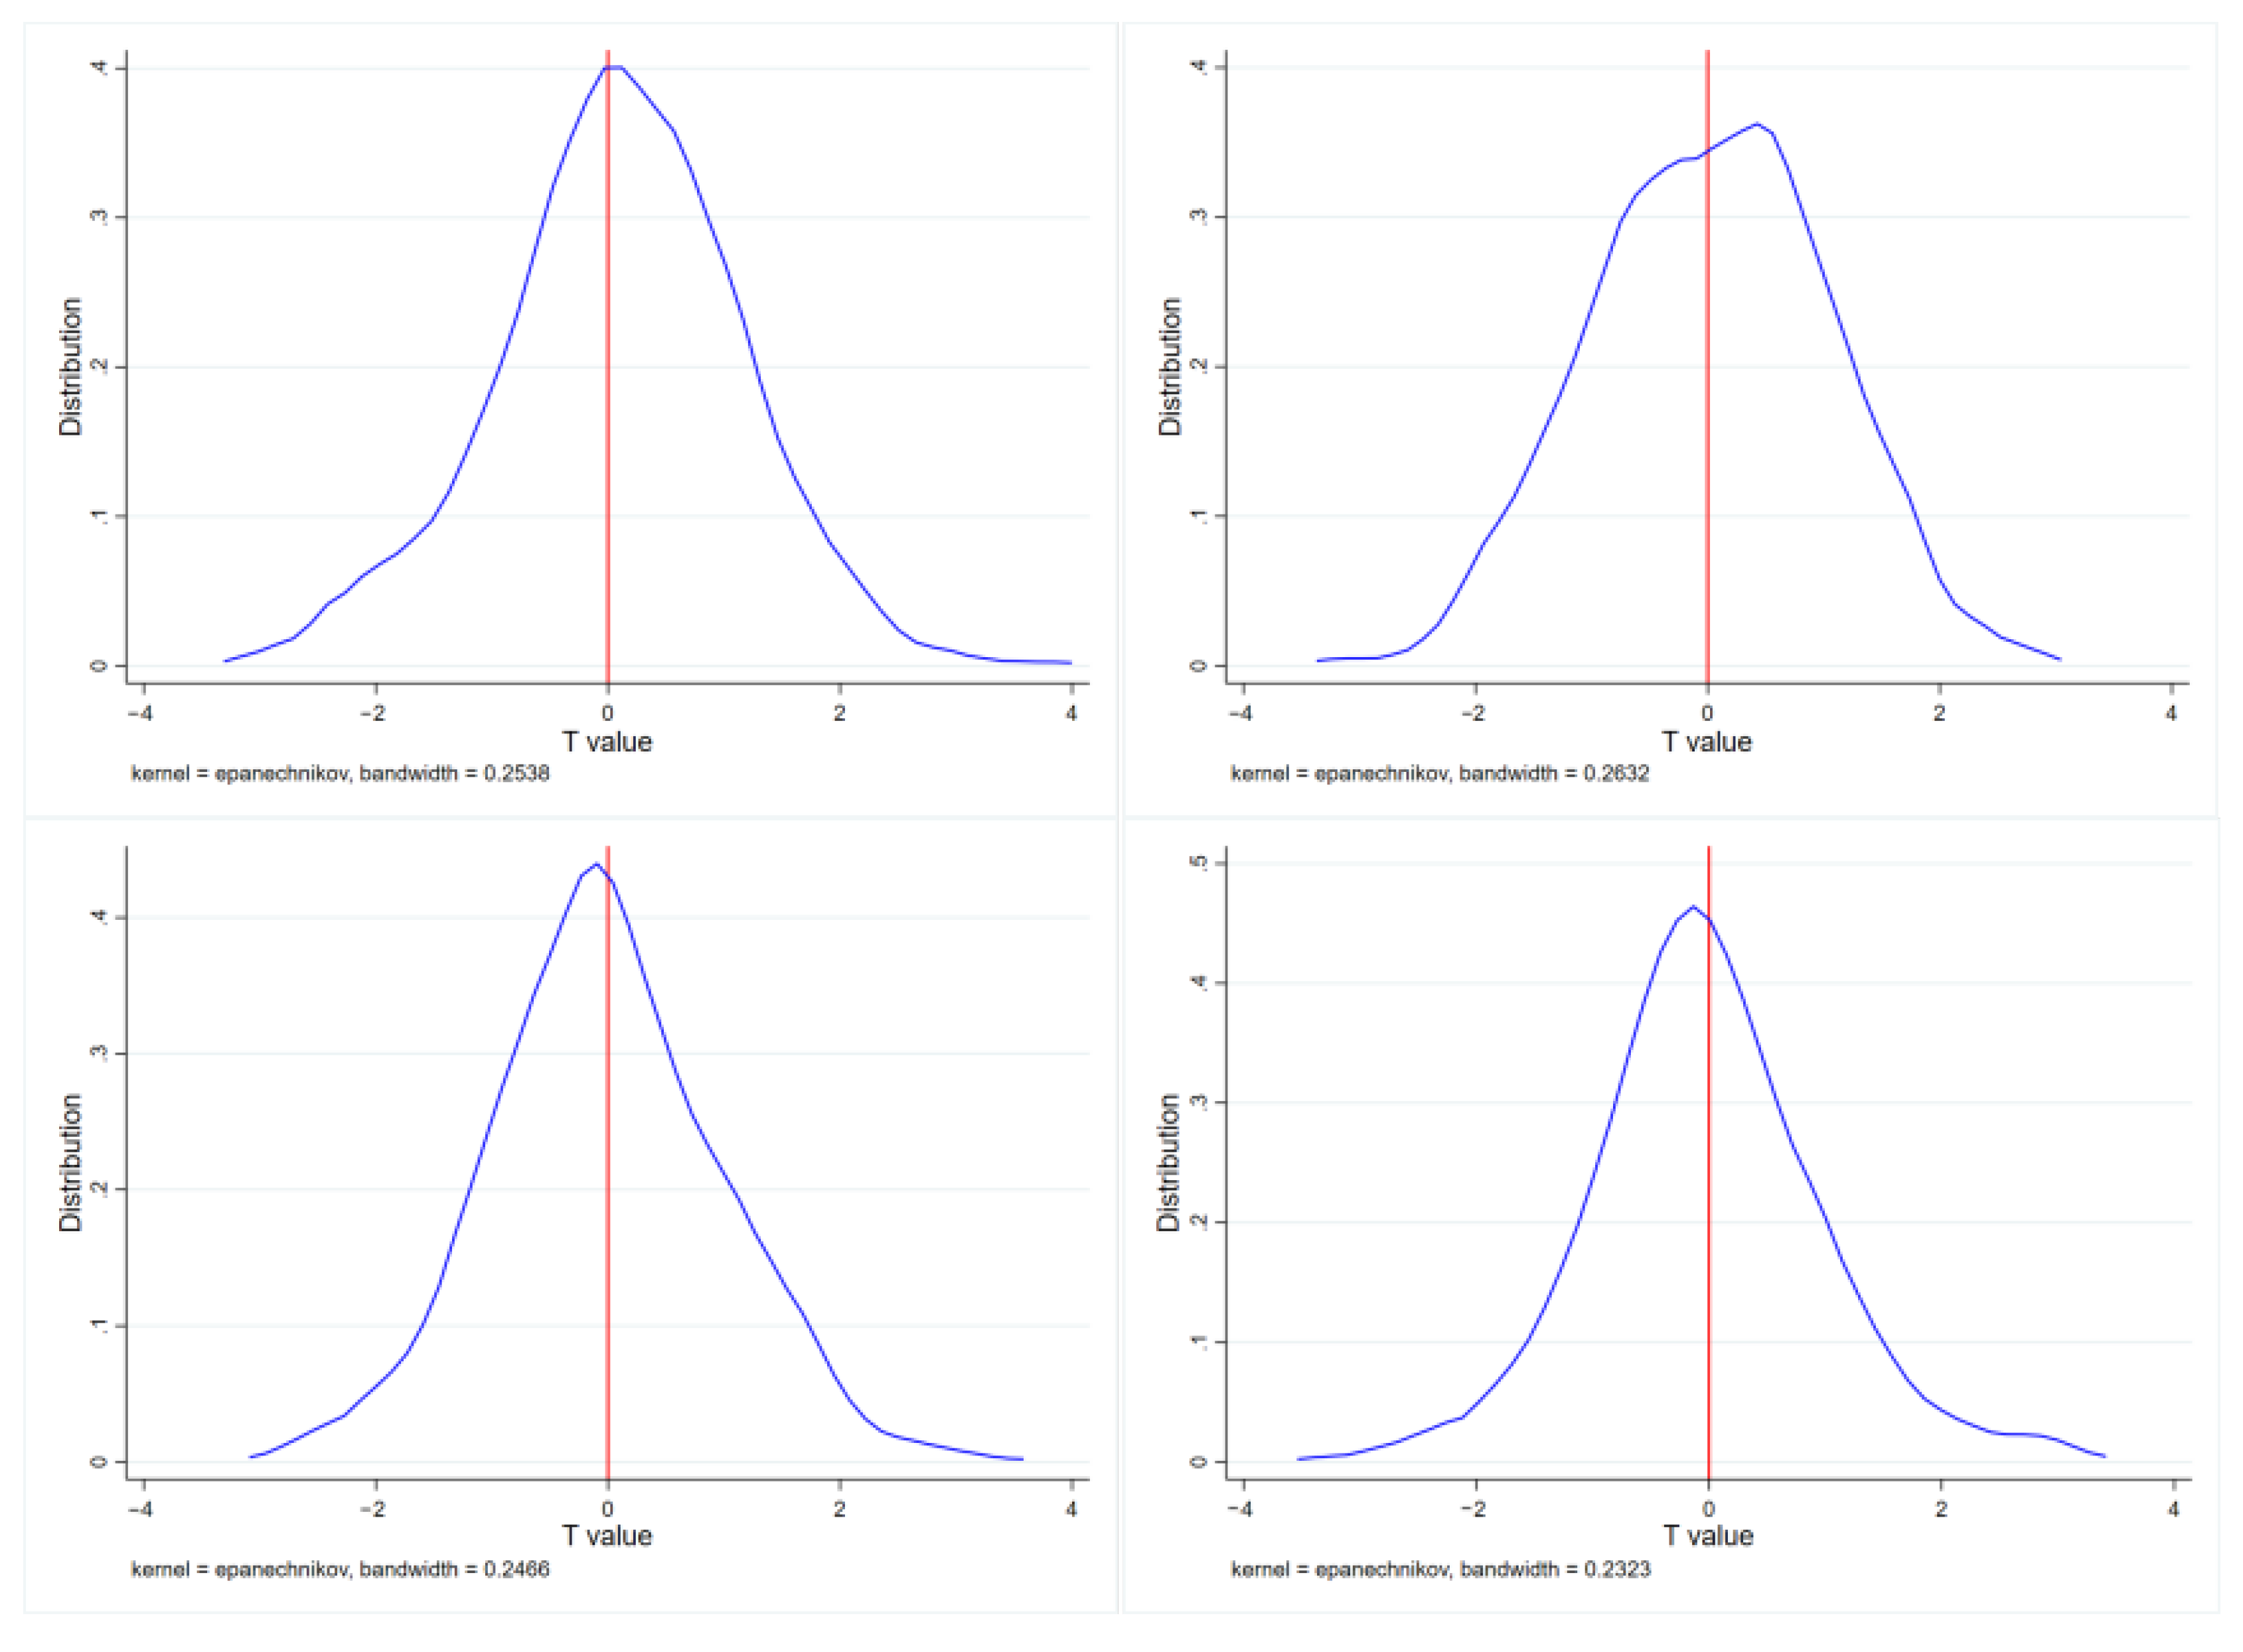
Non-Observed Factor Effects

Although other variables that may affect farmers’ livelihood capital were controlled for, there remain unobserved variables such as farmers’ individual decisions that can have a potential impact on the difference between the experimental and control groups of farmers before land transfer, thus affecting the robustness of the regression results. Therefore, this study took the approach of creating random variables to test whether there was an effect of omitted variables. STATA 16 software was used to calculate and generate random shocks of land transfer on the livelihood capital of specific farmers, and repeated 500 times. Under such a premise, the mean value of DID was estimated, and the results are shown in Figure 4, indicating the distribution of the 500 estimated DIDs. The values of the DIDs in the random process were concentrated around 0 and were significantly far from the estimated values of the real experiment, by which it can be induced that the other farm household characteristics observed for the regression results had almost no effect on the regression results, thus proving that the previous estimation results were robust.

4. Discussion

Land transfers give land to farmers who are better able to farm it, which on the one hand increases the productivity of arable land and the efficiency of land use, and on the other expands the career options of farmers, increases their income, and is an efficient way to support local agricultural and economic development. The market-oriented land transfer policy has had a positive impact on improving urban land use efficiency, according to Jiang et al. [48]. Peng et al. [3] discovered that the scale of land transfers had a U-shaped effect on food crops, and suggested that the Chinese government should promote land transfers to ensure food self-sufficiency. Farmers, who are land operators, should be encouraged to transfer their land. Similar to the conclusions of this paper, Wu et al. [49] and Ren et al. [50] found that land tenure adjustment would improve farmers’ livelihood capital and significantly reduce farmers’ livelihood vulnerability, based on the livelihood sustainability framework. A difference is that this paper refers to Zhang Shichao’s study [42], considering the existence of transfer outliers. In an area complementary to this study, Yang et al. [34] investigated the characteristics of livelihood capital and land transfer within farmers’ livelihood strategies, and considered the influence of livelihood capital on land transfer. Together, their findings demonstrated a mutual relationship between land transfer and farmers’ livelihood capital, further demonstrating that the two topics cannot be studied independently.
Different land transfer models have been implemented due to variations in types of land, economic conditions, and human cultures found in different regions. Each region selects the land transfer model based on the conditions found there, which is advantageous for the success of land transfer and makes it easier to raise standards of living for farmers.
Ref. [51], Zhang [52], Wang [53], and others have studied differences in the impact of the new business model and the government-led model on farmers’ livelihood capital. Similar to existing studies, this paper has compared the two collective operation models again in order to confirm which is most appropriate for Manas County. The results show that the model with the village collective or a leading plantation company as the main operating agent is more effective in raising the standard of living for farm households. The land leaseback and re-contracting model, with village collectives or major plantation companies as the main operators, had the greatest impact on the livelihood capital of farmers in Manas County according to this paper’s comparison of the two collective management models to confirm the most appropriate land transfer model for the area. The study’s findings can serve as a guide for encouraging land transfer in Manas County. In future land transfers, farmers should be encouraged to pool land with scattered plots and lower yields, and they should be asked to promote this model in entire villages, because village collectives and top plantation companies have greater strengths in terms of land cultivation experience, national policies, and economic resources.
In conclusion, even though this study has included new ideas and enhanced previous research, there remain areas that merit further investigation. Since this study did not take into account livelihood strategies, the relationship of mutual influence between land transfer, livelihood strategy, and livelihood capital should be further delineated in the future. The existence of transfer-in and transfer-out behaviors within the process of land transfer indicates differences in farmers’ choices for livelihood strategies.

5. Conclusions

The following findings can be drawn through field surveys, in-depth interviews, and the data analysis in this paper:
(1)
Land transfer had a favorable and clear effect on farmers’ capital for livelihood. The effect of land transfer on farmers’ ability to maintain their way of life was higher when more agricultural operations are engaged. Following land transfers, all types of farmers, from big to small, experienced a transition in their capital of livelihood; purely agricultural farmers > agricultural part-time farmers > non-agricultural part-time farmers > non-agricultural farmers.
(2)
Distinct categories of farmers experienced different changes in their means of subsistence as a result of land transfers. Production capital and natural capital of purely agricultural farmers rose greatly, whereas social capital and natural capital of part-time farmers fell or increased significantly. Non-agricultural farmers’ capital of all types did not change greatly.
(3)
The capital that supports farmers’ livelihoods was found to be affected differently by various land transfer methods. Following land transfer, communal management is more effective than family management, and individual management is more effective than small-scale farming. When comparing the land stock cooperation mode with rural cooperatives as the main body, against the land leaseback and re-contract mode with “village collective + planting leading firm” as the primary management body, the improvement of farmers’ livelihood capital was more evident. As a result, the modes of land leaseback and re-contract were found to enhance effectively the method of land transfer for farmers’ livelihood capital.
According to the survey of Manas County, the area now has sporadic land transfers, single employment of farmers who have been relocated, and ineffective land transfer security measures. On the basis of the findings of this investigation, the following recommendations are made:
(1)
It is advised that the government strengthen the framework for securing land transfers, and increase farmers’ job opportunities. Making it possible for farmers to receive greater advantages from land transfer would encourage more farmers to participate in land transfer. In order to boost farmers’ farming ability, we should provide the transferred farmers with suitable subsidies, strengthen rural infrastructure, and undertake unified land management training. Meanwhile, for farmers who have been relocated, we should improve social security, offer assistance and job possibilities, and promote the migration of labor to secondary and tertiary industries.
(2)
The government should actively encourage land scale transfer and management while nurturing new commercial entities. We should actively promote the circulation of the entire village, encourage collective management, maximize the allocation of collective land resources, cultivate the development of rural cooperatives, position large farmers, establish leading businesses, form other teams, increase scientific and technological training, establish an industry chain for the production, processing, and sale of agricultural products, and actively advance the construction of “village colliders”.

Author Contributions

Conceptualization, D.L.; methodology, Y.W. and Y.C.; software, Y.M. and D.L.; validation, D.L. and G.Y.; formal analysis, H.X.; investigation, G.Y.; resources, Y.W.; data curation, D.L.; writing—original draft preparation, Y.C. and D.L.; writing—review and editing, Y.W.; visualization, G.Y. and D.L.; supervision, Y.W. and Y.C.; project administration, Y.W.; funding acquisition, Y.W. All authors have read and agreed to the published version of the manuscript.

Funding

This research was funded by the Shihezi University High-level Talents Research Start Project (Project Number: RCZK2018C41 and RCZK2018C22), key areas of science and technology research program projects (Project Number: 2021AB021), Shihezi University’s innovative development special project “Study on the New Urbanization Development Model and Path Selection of the Southern Xinjiang Corps” (Project Numbers: CXFZSK202105), and Shihezi University Youth Innovation and Cultivation Talent Program Project “Study on the Estimated Appropriate Ecological Water Requirement of Aibi Lake Wetland in Xinjiang” (Project Numbers: KX00300302).

Institutional Review Board Statement

Not applicable.

Informed Consent Statement

Informed consent was obtained from all subjects involved in the study.

Data Availability Statement

Not applicable.

Conflicts of Interest

The authors declare no conflict of interest.

References

  1. Li, C.; Jiao, Y.; Sun, T.; Liu, A. Alleviating multi-dimensional poverty through land transfer: Evidence from poverty-stricken villages in China. China Econ. Rev. 2021, 69, 101670. [Google Scholar] [CrossRef]
  2. Liu, Z.; Rommel, J.; Feng, S.; Hanisch, M. Can land transfer through land cooperatives foster off-farm employment in China? China Econ. Rev. 2017, 45, 35–44. [Google Scholar] [CrossRef]
  3. Donghui, P.; Jingrong, L.; Krishna, P.; Yunsheng, M. Land transfer and food crop planting decisions in China. Appl. Econ. Lett. 2021, 28, 1777–1783. [Google Scholar] [CrossRef]
  4. Karita, K. Creating land markets for rural revitalization: Land transfer, property rights and gentrification in China. J. Rural. Stud. 2020, 81, 68–77. [Google Scholar] [CrossRef]
  5. Chao, Z.; Yunjuan, L.; Anthony, F. Tracing Agricultural Land Transfer in China: Some Legal and Policy Issues. Land 2021, 10, 58. [Google Scholar] [CrossRef]
  6. Qiu, T.; Luo, B.; Li, S.; He, Q. Does the basic farmland preservation hinder land transfers in rural China? China Agric. Econ. Rev. 2020, 12, 39–56. [Google Scholar] [CrossRef]
  7. Li, H.; Zhang, X.; Li, H. Has farmer welfare improved after rural residential land circulation? J. Rural. Stud. 2019, 93, 479–486. [Google Scholar] [CrossRef]
  8. Wang, J.; Xin, L.; Wang, Y. How farmers’ non-agricultural employment affects rural land circulation in China? J. Geogr. Sci. 2020, 30, 378–400. [Google Scholar] [CrossRef]
  9. Wineman, A.; Liverpool-Tasie, L.S. Land markets and the distribution of land in northwestern Tanzania. Land Use Policy 2017, 69, 550–563. [Google Scholar] [CrossRef]
  10. Xu, D.; Yong, Z.; Deng, X.; Zhuang, L.; Qing, C. Rural-Urban Migration and its Effect on Land Transfer in Rural China. Land 2020, 9, 81. [Google Scholar] [CrossRef] [Green Version]
  11. Loka, A.; Danielle, D.; Fiona, W. Property rights and rural justice: A study of U.S. right-to-farm laws. J. Rural. Stud. 2019, 67, 120–129. [Google Scholar] [CrossRef]
  12. Leonhardt, H.; Braito, M.; Penker, M. Why do farmers care about rented land? Investigating the context of farmland tenure. J. Soil Water Conserv. 2021, 76, 89–102. [Google Scholar] [CrossRef]
  13. Kibrom, A.; Jordan, C.; Guush, B. Are land rental markets responding to rising population pressures and land scarcity in sub-Saharan Africa. Land Use Policy 2020, 101, 105139. [Google Scholar] [CrossRef]
  14. Dongliang, Z. Farmers Are Growing Further and Further from the Land: Land Transfer and the Practice of Three Rights Separation in China. Soc. Sci. China 2021, 42, 24–43. [Google Scholar] [CrossRef]
  15. Shengbin, O.; Ligen, C. Study on the performance of rural collective land transfer system*—Comparative Analysis of typical cases based on Anhui and Guangxi. Rural. Econ. 2014, 2014, 31–34. [Google Scholar]
  16. Fei, M.; Xiangzhi, K. Government support and model innovation of rural land transfer -- experience and Enlightenment from Jiangjin District, Chongqing. J. Southwest Univ. (Soc. Sci. Ed.) 2011, 37, 126–131. [Google Scholar] [CrossRef]
  17. Han, Z.; Yanmin, S. Study on rural land circulation model in Underdeveloped Areas. Econ. Rev. J. 2015, 3, 98–102. [Google Scholar] [CrossRef]
  18. Cai, J.; Wang, T.; Xia, X.; Chen, Y.; Lv, H.; Li, N. Analysis on the Choice of Livelihood Strategy for Peasant Households Renting out Farmland: Evidence from Western Poverty-Stricken Areas in China. Sustainability 2019, 11, 1424. [Google Scholar] [CrossRef] [Green Version]
  19. Uddin, M.E.; Pervez, A.K.M.K.; Qijie, G. Effect of voluntary cooperativisation on livelihood capital of smallholder dairy farmers in the southwest of Bangladesh. Geo J. 2020, 87, 111–130. [Google Scholar] [CrossRef]
  20. Manlosa Aisa, O.; Hanspach, J.; Schultner, J.; Dorresteijn, I.; Fischer, J. Livelihood strategies, capital assets, and food security in rural Southwest Ethiopia. Food Secur. 2019, 11, 167–181. [Google Scholar] [CrossRef] [Green Version]
  21. Chowdhury, T.A. Applying and extending the sustainable livelihoods approach: Identifying the livelihood capitals and well-being achievements of indigenous people in Bangladesh. J. Soc. Econ. Dev. 2021, 23, 302–320. [Google Scholar] [CrossRef]
  22. He, Y.; Ahmed, T. Farmers’ Livelihood Capital and Its Impact on Sustainable Livelihood Strategies: Evidence from the Poverty-Stricken Areas of Southwest China. Sustainability 2022, 14, 4955. [Google Scholar] [CrossRef]
  23. Zhang, C.; Chen, D. Fragmentation Reduction through Farmer-Led Land Transfer and Consolidation? Experiences of Rice Farmers in Wuhan Metropolitan Area, China. Agriculture 2021, 11, 631. [Google Scholar] [CrossRef]
  24. Ann, G.; Camilla, E. Retired Farmers and New Land Users: How Relations to Land and People Influence Farmers’ Land Transfer Decisions. Sociol. Rural. 2018, 58, 707–725. [Google Scholar] [CrossRef]
  25. Yahui, W.; Xiubin, L.; Liangjie, X.; Minghong, T.; Min, J. Spatiotemporal changes in Chinese land circulation between 2003 and 2013. J. Geogr. Sci. 2018, 28, 707–724. [Google Scholar] [CrossRef] [Green Version]
  26. Ole, M.; Charlotte Filt, M. Land Sparing and Land Sharing Policies in Developing Countries–Drivers and Linkages to Scientific Debates. World Dev. 2017, 98, 523–535. [Google Scholar] [CrossRef]
  27. van Keulen, H.; Kuyvenhoven, A.; Ruben, R. Sustainable land use and food security in developing countries: DLV’s approach to policy support. Agric. Syst. 1998, 58, 285–307. [Google Scholar] [CrossRef]
  28. Kang, M.; Yuxiu, Z.; Mengying, R.; Jing, G.; Tuanyao, C. Land Subsidence in a Coal Mining Area Reduced Soil Fertility and Led to Soil Degradation in Arid and Semi-Arid Regions. Int. J. Environ. Res. Public Health 2019, 16, 3929. [Google Scholar] [CrossRef] [Green Version]
  29. Dingde, X.; Sha, C.; Xi, W.X.; Quan, L.S. Influences of labor migration on rural household land transfer: A case study of Sichuan Province, China Science. J. Mt. 2018, 15, 2055–2067. [Google Scholar] [CrossRef]
  30. Yi, S.; Junxiao, Y.; Yan, W. The empirical study on influencing factors of farmers’scale oper ation performance based on investigation of farmers’agricultural land transfer. Chin. J. Agric. Resour. Reg. Plan. 2014, 35, 26–33. [Google Scholar] [CrossRef]
  31. Yan, W.; Xiaojun, Y. Empirical research on influencing factors of farmer’s farmland transfer behav- ior in Manas county, Xinjiang. J. Arid. Land Resour. Environ. 2013, 27, 7–13. [Google Scholar] [CrossRef]
  32. Yan, W.; Xiaoping, S.; Xiaojun, Y. The analysis of influencing factors about farmers’ farmland transfer behavior in Arid Areas of Xinjiang: Based on structural equation model and the empirical research of farmers in Manas. Wuhan Univ. Technol. (Soc. Sci. Ed.) 2015, 28, 635–642. [Google Scholar] [CrossRef]
  33. Liu, Z.; Chen, Q.; Xie, H. Influence of the Farmer’s Livelihood Assets on Livelihood Strategies in the Western Mountainous Area, China. Sustainability 2018, 10, 875. [Google Scholar] [CrossRef] [Green Version]
  34. Huanxin, Y.; Kai, H.; Xin, D.; Dingde, X. Livelihood Capital and Land Transfer of Different Types of Farmers: Evidence from Panel Data in Sichuan Province, China. Land 2021, 10, 532. [Google Scholar] [CrossRef]
  35. Gao, W.; Han, R. Xin Jiang Statistical Yearbook; Han, R., Ed.; China Statistical Press: Beijing, China, 2021; pp. 4–5. ISBN 978-7-5037-9541-1. [Google Scholar]
  36. Gao, W.; Han, R. Xin Jiang Statistical Yearbook; Han, R., Ed.; China Statistics Press: Beijing, China, 2020; pp. 4–5. ISBN 978-7-5037-8903-8. [Google Scholar]
  37. Temu, A.E.; Due, J.M. Participatory appraisal approaches versus sample survey data collection: A case of smallholder farmers well-being ranking in Njombe District, Tanzania. J. Afr. Econ. 2000, 9, 44–62. [Google Scholar] [CrossRef]
  38. Jian, Z.; Peixin, C. The effect of different farmland transfer patterns on household agricultural productivity based on surveys of four counties in Jiangsu Province. Resour. Sci. 2017, 39, 629–640. [Google Scholar] [CrossRef]
  39. Weiming, T.; Kevin, L.; Pingyu, Z. Land Consolidation in Rural China: Life Satisfaction among Resettlers and Its Determinants. Land 2020, 9, 118. [Google Scholar] [CrossRef] [Green Version]
  40. Xueqi, W.; Wei, Z.; Gaoli, Z.; Tieyi, C. The impact of local government-dominated farmland transfer on farmer’s transfer scale and grain yield in five cities in Jiangsu. Resour. Sci. 2018, 40, 326–334. [Google Scholar] [CrossRef] [Green Version]
  41. Huiqin, L.; Peter, N.; Xuelian, X.; Jingjing, L. A New Livelihood Sustainability Index for Rural Revitalization Assessment—A Modelling Study on Smart Tourism Specialization in China. Sustainability 2020, 12, 3148. [Google Scholar] [CrossRef] [Green Version]
  42. Shichao, Z.; Dongsheng, Z.; Jiajia, J. Integrated features and benefits of livelihood capital of farmers after land transfer based on livelihood transformation. Trans. Chin. Soc. Agric. Eng. 2018, 34, 274–281. [Google Scholar] [CrossRef]
  43. Liu, Z.; Chen, Q.; Xie, H. Comprehensive Evaluation of Farm Household Livelihood Assets in a Western Mountainous Area of China: A Case Study in Zunyi City. J. Resour. Ecol. 2018, 9, 154–163. [Google Scholar] [CrossRef]
  44. Lyu, X.; Peng, W.; Niu, S.; Qu, Y.; Xin, Z. Evaluation of sustainable intensification of cultivated land use according to farming households’ livelihood types. Ecol. Indic. 2022, 138, 108848. [Google Scholar] [CrossRef]
  45. Patrick, A.P. The treatment effect, the cross difference, and the interaction term in nonlinear “difference-in-differences” models. Econ. Lett. 2012, 115, 85–87. [Google Scholar] [CrossRef] [Green Version]
  46. Andrew, M.R.; Evangelos, K.; Ariel, L.; James, F.B. Now trending: Coping with non-parallel trends in difference-in-differences analysis. Stat. Methods Med. Res. 2019, 28, 3697–3711. [Google Scholar] [CrossRef]
  47. Ahlfeldt Gabriel, M. Weights to Address Non-parallel Trends in Panel Difference-in-differences Models. CESifo Econ. Stud. 2018, 64, 216–240. [Google Scholar] [CrossRef]
  48. Jiang, X.; Lu, X.; Liu, Q.; Chang, C.; Qu, L. The effects of land transfer marketization on the urban land use efficiency: An empirical study based on 285 cities in China. Ecol. Indic. 2021, 132, 108296. [Google Scholar] [CrossRef]
  49. Shiman, W.; Yanmei, Y.; Chaozheng, Z.; Ye, S.; Gaohui, W. Effects of Property Rights Adjustment in Rural Land Consolidation on Farmers’ Livelihood Capital Under the Sustainable Livelihood Framework. China Land Sci. 2019, 33, 79–88. [Google Scholar] [CrossRef]
  50. Li, R.; Miao, Z.; Yinrong, C. The Relationship between Livelihood Capital, Multi-functional Value Perception of Cultivated Land and Farmers’ Willingness to Land Transfer: A Regional Observations in the Period of Poverty Alleviation and Rural Revitalization. China Land Sci. 2022, 36, 56–65. [Google Scholar] [CrossRef]
  51. Shanhui, S.; Wei, L. Performance Evaluation and Sensitivity Analysis of Rural Land Circulation Mode. Complexity 2021, 2021, 6615306. [Google Scholar] [CrossRef]
  52. Chaozheng, Z.; Gangjiao, Y. Change of Farmers’ Livelihood Capital before and after Rural Land Consolidation in Different Modes. China Land Sci. 2018, 32, 90–96. [Google Scholar] [CrossRef]
  53. Wenxiong, W.; Xin, Z.; Lihong, Y.; Gangjiao, Y. Comparative Study on Land Use Efficiency before and after Rural Land Consolidation in Different Modes. J. Nat. Resour. 2015, 30, 1104–1117. [Google Scholar] [CrossRef]
Figure 1. Location and overview map of the study area.
Land 11 01369 g001
Figure 2. Direction of change in livelihood capital of different types of farmers.
Land 11 01369 g002
Figure 3. Results of parallel trend testing for DID.
Land 11 01369 g003
Figure 4. Placebo test results.
Land 11 01369 g004
Table 1. Distribution of questionnaires in the study area.
Town NameVillage NameNumber of Questionnaires DistributedNumber of Questionnaires ReturnedQuestionnaire Return Rate
Letuyi TownXiazhuangzi Village504998.0%
Zhangjiazhuang Village504794.0%
Baojiadian TownDawanzi Village5050100.0%
Sifuzhuang Village504692.0%
Beiwucha TownHongliukeng Village5050100.0%
Xigou Village504896.0%
Lanzhouwan TownDongmaidi Village504896.0%
West Next Door Village504794.0%
Surrounding non-transferred villages20018693.0%
Table 2. Descriptive statistics of sample farmers in the Study Area.
TypeFeature DescriptionStatistics
QuantityPercentage
Farmers’ characteristics
AgeUnder 30 years old6511.4%
30–40 years old16729.2%
40–50 years old23340.8%
Over 60 years old10618.6%
Education levelElementary school and below11720.5%
Junior high school30553.4%
High school10618.6%
College and above437.5%
Social identityGeneral public52191.2%
Public officials508.8%
Agricultural Resource Endowment
Number of agricultural laborers1 person10518.4%
2–3 people29651.8%
More than 3 people17029.8%
Existing arable land areaLess than 2 hm²9717.0%
2–10 hm²23741.5%
More than 10 hm²23741.5%
Productive agricultural toolsThere are27247.6%
None29952.4%
Table 3. Classification of farmers by type and criteria.
Farmers TypeClassification CriteriaQuantityPercentage of
Is There Any Non-Agricultural OccupationShare of Non-Farm Income
Purely agricultural farmersNo≤10 percent14523.5%
Agricultural part-time farmersYes10% < x ≤ 50%16323.1%
Non-agricultural part-time farmersYes50% < x ≤ 90%18724.5%
Non-agricultural farmersYes>90%12828.9%
Table 4. Division of dominant modes of land transfer in Manas County.
Township NameVillage NameLand Transfer ModelMode of OperationMeaningFeatures
Letuyi TownXiazhuangzi VillageLeaseback and re-contracting Collective operationThe village collectives or leading plantation companies lease land from farmers, plan the land use in a unified manner, and build farming infrastructure before contracting the land to farmers for cultivation [38].Unified land management and re-planning; land scaling; improved land use efficiency.
Zhangjiazhuang Village
Lanzhouwan TownshipDongmaidi VillageJoint-stock cooperative Farmers voluntarily join together and use their contracted land rights as shares. They give up their land in whole or in part, to be managed and controlled by a collective or professional land operator. At the end of the year the cooperative society divides the profits gained from the operation according to the shares.Increases the source of farmers’ income; achieves resource integration and prioritizes the more efficient use of resources.
Xigebi Village
Baojiadian TownshipDawanzi VillageCentralized and continuous Family operationFarmers with planting experience, mastering planting technology, take advantage of their own land. Some farmers are contracted in a group to achieve large-scale operation. [39]To a certain extent, realizes large-scale operation and mechanized farming to improve farming efficiency and reduce agricultural input costs.
Sifuzhuang Village
North Wuchang TownHongliukeng VillageFarmers’ spontaneous modeIndividual operationSmall-scale land transfer between friends, relatives, neighbors, or farmers who know each other within the village [40].The transfer is more flexible, and the inflow party can choose the scale of land transfer. After the transfer, the operation is still fragmented and the land benefits are not significant.
Xigou Village
Table 5. Farmers’ livelihood capital indicator system.
Livelihood CapitalLivelihood IndicatorsIndicator Meaning and AssignmentWeights
Natural capitalContracted land areaArea of all contracted land per farming household in survey villages (ha.)0.077
Quality of contracted landVery good = 1, good = 0.8, average = 0.6, poor = 0.4, very poor = 0.20.069
Annual production of landAnnual yield of cotton on contracted land of farmers in surveyed villages (kg/ha.)0.072
Financial capitalAnnual household incomeAmount of net household income per farm household in surveyed villages (10,000 yuan)un RMB0.087
Family savingsAmount of household savings per farm household in surveyed villages (10,000 yuan)0.044
Government subsidiesYes = 1, No = 00.043
Living capitalHousing conditionsTranslated into RMB according to the current year’s housing price and existing housing area (Yuan)0.052
Livestock, aquacultureYes = 1, No = 00.032
Transportation ownedMinivan/commercial vehicle = 1, small car = 0.8, electric car = 0.5, bicycle = 0.2, none = 00.045
Produced capitalNumber of productive toolsNumber of mechanized tools used for agricultural production in the homes of farmers in surveyed villages (units)0.056
The degree of improvement of rural infrastructureVery good = 1, good = 0.8, average = 0.6, poor = 0.4, very poor = 0.20.044
Water irrigation facilitiesVery good = 1, good = 0.8, average = 0.6, poor = 0.4, very poor = 0.20.041
Social capitalSocial Security levelVery good = 1, good = 0.8, average = 0.6, poor = 0.4, very poor = 0.20.04
Availability of official positionsYes = 1, No = 00.058
Level of policy understandingVery good = 1, good = 0.8, average = 0.6, poor = 0.4, very poor = 0.20.06
Human capitalNumber of laborersNumber of existing labor force in farm households in surveyed villages0.082
Educational level of family membersCollege and above = 1, high school = 0.8, middle school = 0.6, elementary school = 0.4, illiterate = 0.20.042
Workforce health statusVery good = 1, good = 0.8, average = 0.6, poor = 0.4, very poor = 0.20.056
Table 6. Values of livelihood capital indicators before and after land transfer for different types of farmers.
Pure Agricultural FarmersNatural CapitalFinancial CapitalLiving CapitalProduced CapitalSocial CapitalHuman CapitalLivelihood Capital
Before transfer0.4590.2970.3040.3350.2710.3732.039
After transfer0.4750.3250.3190.390.2830.3852.177
diff0.0160.0280.0150.0550.0120.0120.138
Agricultural Part-Time FarmersNatural CapitalFinancial CapitalLiving CapitalProduced CapitalSocial CapitalHuman CapitalLivelihood Capital
Before transfer0.4010.3760.3420.3240.3110.4872.241
After transfer0.3950.410.3550.3390.3380.5092.346
diff−0.0060.0340.0130.0150.0270.0220.105
Non-Agricultural Part-Time FarmersNatural CapitalFinancial CapitalLiving CapitalProduced CapitalSocial CapitalHuman CapitalLivelihood Capital
Before transfer0.3740.3920.3610.3310.3570.4942.309
After transfer0.3540.430.380.3050.3990.5222.39
diff−0.020.0380.019−0.0260.0420.0280.081
Non-Agricultural FarmersNatural CapitalFinancial CapitalLiving CapitalProduced CapitalSocial CapitalHuman CapitalLivelihood Capital
Before transfer0.3580.5730.3720.2770.4270.5462.553
After transfer0.3430.5870.3850.2680.4380.5572.578
diff−0.0150.0140.013−0.0090.0110.0110.025
Table 7. Within- and between-group differences in farmers’ livelihood capital before and after land transfer in different modes.
The Farmers’ Spontaneous ModeFarmers Not Participating in Land TransferFarmers Participating in Land TransferDiff
Before transfer2.1982.2360.038
After transfer2.2062.3020.096
diff0.0080.0660.058
Centralized and Continuous ModeFarmers Not Participating in Land TransferFarmers Participating in Land TransferDiff
Before transfer2.2112.250.039
After transfer2.2172.3270.11
diff0.0060.0770.071
Joint-Stock Cooperative ModelFarmers Not Participating in Land TransferFarmers Participating in Land TransferDiff
Before transfer2.2172.2510.034
After transfer2.2162.3610.145
diff−0.0010.110.111
Leaseback and Re-Contracting ModeFarmers Not Participating in Land TransferFarmers Participating in Land TransferDiff
Before transfer2.2252.2620.037
After transfer2.2192.3780.159
diff−0.0060.1160.122
Table 8. Details of the grouping of the control and experimental groups in the difference-in-differences model.
Experimental GroupControl Group
Group NameFarmersModeBusiness MethodGroup NameFarmersMode
A1Hongliukeng Village, Xigou VillageThe farmers’
spontaneous mode
Individual businessB1Farmers in surrounding non-transferred villagesUncirculated
A2Dawanzi Village, Sifuzhuang VillageCentralized and continuous modeFamily business
A3Dongmaidi Village, West Next Door VillageJoint-stock cooperative modelCollective management
Xiazhuangzi Village, Zhangjiazhuang VillageLeaseback and re-contracting mode
Table 9. Regression results of different modes of land transfer on farmers’ livelihood capital.
(1) Individual Operation(2) Family Operation(3) Collective Operation
VARIABLESTotalTotalTotal
DID0.170 ***0.183 ***0.249 ***
(0.0162)(0.0137)(0.0104)
Post0.0614 ***0.0673 ***0.0508 ***
(0.0133)(0.00916)(0.00839)
Constant2.263 ***2.268 ***2.303 ***
(0.00381)(0.00377)(0.00250)
Observations8528521710
R-squared0.3990.4430.499
Number of id142142286
Robust standard errors in parentheses: *** p < 0.01.
Table 10. Regression results of land transfer on farmers’ livelihood capital for the joint-stock cooperative mode and the land leaseback and recontracting mode.
(1)(2)(3)(4)(5)(6)(7)
VariablesTotalNatural CapitalFinancial CapitalLiving CapitalProduced CapitalSocial CapitalHuman Capital
DID0.0480 ***0.001210.0166 *0.0110 ***0.00637 **0.0150 ***−0.00223
(0.0132)(0.00160)(0.00991)(0.00367)(0.00311)(0.00480)(0.00515)
Post0.254 ***0.0480 ***0.0285 ***0.0423 ***0.0490 ***0.0374 ***0.0484 ***
(0.00837)(0.00119)(0.00656)(0.00249)(0.00232)(0.00325)(0.00348)
Constant2.272 ***0.372 ***0.453 ***0.338 ***0.300 ***0.371 ***0.438 ***
(0.00329)(0.000401)(0.00247)(0.000916)(0.000779)(0.00120)(0.00129)
R-squared0.5300.6470.0570.3960.4270.2720.242
Robust standard errors in parentheses: *** p < 0.01, ** p < 0.05, * p < 0.1.
Publisher’s Note: MDPI stays neutral with regard to jurisdictional claims in published maps and institutional affiliations.

