1. Introduction
The 2015 Paris Agreement marked a new phase in global climate governance, proposing a concerted response to climate change in the form of autonomous national contributions [
1]. The agreement states that the ecological risks posed by climate change to the earth and the resulting existential crisis for human beings can only be reduced if the world achieves peak greenhouse gas emissions as soon as possible and net zero greenhouse gas emissions in the second half of this century [
2,
3]. In September 2020, General Secretary Xi Jinping proposed China’s future goals and vision in the general debate of the 75th session of the United Nations General Assembly: “Strive to peak carbon emissions by 2030 and strive to achieve carbon neutrality by 2060” [
4].
In the early 1990s, the United States, the United Kingdom, and the Netherlands pioneered research on climate change and carbon sinks [
5,
6,
7]. The Landscape Biodiversity Planning and Design System (LBPDS) was proposed by AECOM, a leading international design firm, in 2013, to enhance regional biodiversity and habitat benefits through the integration of planning and design, allowing designers to conduct detailed and comprehensive assessments of urban landscapes in a quantitative manner. It guides habitat conservation, restoration, urban form, and landscape improvement in urban environments [
8]. According to the habitat theory, scholars such as Jorgensen and Gobster et al. [
9,
10] have proposed that the aesthetic preferences of humans are derived from survival needs and can drive changes in the landscape, thus affecting the quality of the ecological environment. Therefore, it has been confirmed that analyzing human evaluations of the environment can have positive implications for ecological conservation. In terms of technology and methods, some scholars have applied virtual reality technology to ecological landscapes during the research process. Fabrika et al. [
11] carried out case studies and analyses on the ecological visualization of virtual reality technology. Chandler et al. [
12] conducted an empirical evaluation of virtual environments and proposed that VR provides a promising approach to facilitate practitioners and policymakers to understand the dynamics of ecological communities. HRV is a reliable reflection of the many physiological factors modulating the normal rhythm of the heart. It provides a powerful means of observing the interplay between the sympathetic and parasympathetic nervous systems [
13]. Nkurikiyeyezu and Haynes et al. [
14,
15] verified that comfort is a personal assessment of a person’s satisfaction with the surrounding environment. They proposed the use of human HRV as a proxy for thermal comfort to evaluate human satisfaction with the environment.
Urban green space plant communities mostly comprise artificial plant communities that support important ecological functions in cities [
16,
17,
18]. Zhang et al. [
19] studied the quantitative relationship between carbon sources and carbon sinks between plants during the landscape operation and maintenance phases, which directly reflects the positive ecological benefits of plants. They provided relevant measures to reduce carbon sources and to increase carbon sinks, providing strong evidence supporting the creation of low-carbon landscapes. The landsense ecology theory proposes that the physical perception experience and psychological cognitive experience of human beings be considered and that the theory of urban ecological space planning, construction, and management be explored through the creation of landscape space, which focuses more on the experience feeling from the human perspective and is an effective way to realize the sustainable development of the ecosystem service function [
20]. Therefore, on the basis of considering the carbon sequestration benefits of plants, it is also important to consider human perceptions of the environment. Based on this theory, Deng et al. [
21] combined plant communities with human visual evaluations and used photos and videos to analyze and obtain human visual preferences for plant landscapes. Technically, the application of virtual reality and visualization technology to landscapes is a need of the present form. To combine VR and landscape, some scholars [
22,
23] have proposed that design risks could be discovered through human–computer interaction in virtual scenes, reducing unnecessary time and money investments to a certain extent. Duan et al. [
24] compared video and photo approaches to assess the effects and differences in human physiological responses while viewing different forms of plant community landscapes. Gao et al. [
25] compared three viewing formats: live, photo, and VR, to measure landscape preferences and found that the participants preferred virtual environmental scenes. In terms of landscape evaluation methods, Deng et al. [
26] used human physiological and psychological indicators for the visual evaluation of plant landscapes and proved that the method of using human physiological and psychological indicators to rate plant landscapes is reliable. Zhu et al. [
27] quantitatively analyzed the visual characteristics of different plant community types in relation to human psychology by monitoring brain wave changes as an intrinsic scientific indicator of human emotional changes using field scene experiments.
A review of the literature reveals that no relevant policies propose specific paths for landscape design planning with the goal of carbon neutrality. There are relatively few studies combining the theory and practice in the areas related to plant community satisfaction. At present, a few scholars have conducted preliminary theoretical studies on landscape design from the perspective of carbon sinks, with existing research areas focusing on the analysis of the carbon sink capacity of different types of plants, the interrelationship between carbon sinks and biodiversity, and the layout of low-carbon landscapes. However, most of the existing studies focus on large-scale planning and strategies, with the planning-level approaches being macroscopic. No specific application methods are proposed for small-scale plant community design based on carbon sequestration and oxygen release. In terms of technology applications, virtual roaming landscapes are still in the exploration stage, although some scholars have carried out virtual roaming designs of the landscape from an ecological perspective, but the scope of such research is still relatively narrow. Such research focuses on analyzing human immersion and less on using it to guide landscape practice. At present, this type of research is related to verifying landscape plant community preferences and is mostly based on traditional photos, videos, and other methods. In terms of research methods, most scholars only use a single visual evaluation method that is psychophysical. These methods are more oriented toward subjective evaluation and lack a certain objective basis. To evaluate future plant landscapes, multiple evaluation methods can be used in combination for analysis from multiple subjective and objective perspectives.
In summary, based on the habitat theory and the landsense ecology theory, it is proposed that human environmental satisfaction can promote the conservation of the ecological environment. Therefore, it is hoped that studying human environmental satisfaction can create a win–win situation in which ecology and aesthetics can coexist. This study suggests that the construction and evaluation of virtual landscape roaming can combine the ecological benefits of plant communities with human preferences to better guide the applications of plant communities in the landscape. The innovative model of “visual interest + physiological comfort + subjective evaluation = comprehensive satisfaction” is proposed to obtain evaluations of environmental satisfaction by combining eye movement data and heart rate data at the physiological level with psychological questionnaires and to build a landscape scenario based on the carbon sequestration and oxygen release ability. Combined with the ErgoLAB platform (Kingfar International Inc, Beijing, China, 2014) to record data and complete the questionnaire at the end of the experiment determining mutual subjective and objective verification, we analyzed how the subjects evaluated their environmental satisfaction with different vegetation cover and different plant community configurations to provide reference ideas for the creation of human-centered ecological landscape design in the future and to create harmony between humans and nature.
2. Materials and Methods
2.1. Study Area
The Guanggu Science Island was selected as the study area (30°29′10.79“ N–114°35′7.23” E). This island is located at the southernmost point of the East Lake Science City in Wuhan, Hubei Province, and borders Ezhou City along the eastern municipal boundary of Wuhan to the east, the outer ring road of the city to the west, Leopard Creek Lake to the south, and Pear Mountain to the north (
Figure 1). It has a subtropical monsoon climate, with abundant rainfall, rain and high temperatures occurring in the same season, and four distinct seasons.
The Guanggu Science Island is a high-tech industrial development zone, and the area is currently under construction, with low vegetation coverage and scattered plant configurations within the site. Creating a good urban green space landscape and creating a beautiful, comfortable, and ecological working and living environment would improve the quality of life of the staff and enable them to relieve stress and enhance their creativity [
28]. Meanwhile, the role and status of urban green space with a carbon sink function have received more attention. Bertram et al. [
29] also suggested that urban plant communities not only play a role in beautifying the landscape, but they also play a role in cooling and humidifying the environment. Urban green spaces have a large impact on both the ecological environment and human activities, so the landscape design of plant communities functioning as green space in the study area needs to be given attention.
2.2. Data Collection
Based on the field investigation, topographical, vegetation, and architectural data of the study area were compiled and summarized using a DJI Inspire II UAV, rangefinder, and a TITAN360 panoramic camera. A Testo 480 multifunctional meter was fixed at 1.50 m above the ground (this height is the average height of the human head and was chosen to observe the surrounding environment), and the temperature data of the study area and the control area were measured from 7:00 am to 19:00 pm. The average value was obtained and was used as the basis to set the temperature in the subsequent experimental space.
Plant preferences were derived through communication interviews with local residents. The common tree species in and around the study area were identified by combining field surveys and literature research methods, and 15 common plants and their daily carbon sequestration and oxygen release effects within a unit leaf area/single plant were summarized (
Table 1) to provide a basis for the configuration of the plant community in the subsequent construction of the virtual scenario.
2.3. Scenario Setting
The configuration of the plant communities on the site was found to be mainly in the form of single-layer woodland (T), single-layer grassland (G), tree-grass composite woodland (T-G), and tree-shrub-grass composite woodland (T-S-G). Combined with the data collected in the previous stage, four plant communities were configured by selecting tree species with a strong carbon sequestration and oxygen release capacity (
Table 2). To ensure the consistent ecological benefits of each plant community configuration, the difference in the total daily carbon sequestration and total daily oxygen release between each community was controlled within 500 g·d
−1.
According to the designed plant community configuration, 3D Studio Max software was used to build a virtual landscape scene, which was imported into Unity 2019 for VR-plugin program settings, and then, box collider collisions and corresponding scripts were added, so that the eye tracker could detect the object and record eye tracking data. Second, the position of the Camera Rig helmet was adjusted, so that the height of the visual level was consistent with the height of the subject’s visual level. Finally, the exe procedure was exported to connect with the ErgoLAB platform. The participants had an immersive experience on the roaming platform.
2.4. Experimental Design
The leader of the experiment asked the subjects to visit the experimental site to familiarize themselves with the experimental environment, procedures, and instructional phases, etc., to ensure the accuracy and reliability of the experiment. The experiment was divided into two parts. For the first group of experiments, subjects were brought to the field in the study area and wore heart rate ear clips attached to their earlobes to monitor the changes in their heart rate variability. The experiment started after ensuring that the subjects’ heart rate fluctuations were normal, and during the experiment, the participants were observed for 3 min at rest. After completing the experiment, a subjective questionnaire was filled out to obtain an analysis of each subject’s evaluation of their satisfaction with the landscape scene before the renovation.
For the second group of experiments, the temperature was set to the under-tree temperature (Mean (M) = 26.8 °C, standard deviation (SD) = 1.2 °C) measured in areas with high vegetation cover by entering the simulated experimental scene, while the virtual eye movement and PPG experiments were conducted afterward. The experiment was divided into three phases (
Figure 2). In the pre-test phase, all of the subjects practiced the instructional phase repeatedly, and it was ensured that the subjects were wearing the helmet correctly and that the heart rate ear clips were linked to the subjects’ earlobes and that both were calibrated to the ErgoLAB platform to ensure that the error of the five sight points did not exceed 20 pixel points and that the frequency of heart rate fluctuations was normal; subjects were stationary for 1 min to obtain the LF/HF ratio of their pre-experimental HRV. In the experimental phase, the subject was instructed by the person in charge to perform a virtual immersive roam of the scene according to the instructional phase. The subjects stayed in each of the four different plant community configuration areas for 30 s according to the prescribed route, and there was a 20 s distance between each plant community used to calm the subjects’ heart rates. It took 3 min for the subjects to roam around the experimental scene. In the post-test stage, after completing the experiment, a subjective questionnaire was filled out to determine how the subjects evaluated their satisfaction with the landscape scene before the transformation. The SD method was used to quantify the users’ feelings about their satisfaction with the plant communities encountered during landscape roaming, and the satisfaction scores of the urban plant green space experience were obtained and evaluated.
The above steps were repeated until 88 randomly invited subjects completed the experiment (male: 41, female: 47). The experimental scenario data were monitored using a data monitoring platform (
Figure 3).
2.5. Measurements
2.5.1. Physiological Measurement
The physiological measurements comprised virtual eye movement data and LF/HF data to monitor the subjects’ visual interest and physiological comfort, respectively.
After a 3 min immersion experience in the digital roaming landscape scene, the experimental data collected from the subjects were exported through the ErgoLAB platform and normalized. The degree of interest indicates the weight of subjects’ interest in each type of plant community. The higher the weight value, the higher the intensity of subjects’ interest in a certain configuration form. This paper calculated the degree of interest according to the fixation time (S), fixation times (S/time), and pupil diameter (mm) of the participants who took part in the immersive experience [
37]:
In the formula, Ii is the ith degree of interest, tij is the time from the ith fixation point to the jth fixation point, cij is the number from the ith fixation point to the jth fixation point, pij is the pupil diameter from the ith fixation point to the jth fixation point, and n is the total number of fixation points.
Qin et al. (2007) [
38] pointed out that the physiological parameter heart rate variability was most strongly correlated with environmental satisfaction, and therefore, it was used as a physiological reference index to evaluate the subjects’ environmental satisfaction with the selected plants. HRV values change somewhat in different human environments, and in the data analysis, the LF/HF ratio of heart rate is used to reflect the differences in comfort level. When the body is uncomfortable, parasympathetic activity decreases or sympathetic activity increases, and the body sweats or vasoconstriction occurs, causing changes in skin temperature to adapt to the ambient temperature. High-frequency heart rate variability is mainly influenced by parasympathetic activity, while low-frequency heart rate variability is mainly influenced by sympathetic activity, and when combined, the LF/HF ratio can reflect the balance of the sympathetic and parasympathetic nerves [
39]. Yao et al. (2007) [
40] showed that the LF/HF ratio is close to 1.0 (=0.956) when the human body is more comfortable, and the higher the LF/HF ratio, the lower the satisfaction level with the environment. The lower the heart rate variability ratio, the more comfortable and relaxed a person is in the plant environment. The HRV data obtained at 0–30 s, 50–80 s, 100–130 s, and 150–180 s during the virtual roaming scene were intercepted and compared to the 60 s heart rate variability data obtained before starting the experiment to derive the change values to compare human comfort in the different plant communities.
2.5.2. Psychological Measurement
The semantic differential method (SD) is a psychometric method for the determination of psychological feelings through verbal scales that was proposed by Osgood in 1957 [
41]. This paper evaluates user feelings based on a combination of the semantic differential method and the positive affect and negative affect model (PANA model) proposed by Watson et al. [
42]. Ten groups of adjectives with opposite meanings were extracted as factors to evaluate people’s satisfaction with the environment: settled–worried, comfortable–uncomfortable, pleasant–sentimental, relaxed–tense, liked–disliked, happy–lonely, calm–irritable, satisfied–disgusted, excited–depressed, and eager–disappointed. The neutral factors corresponding to each group of adjectives were stability, comfort, pleasantness, relaxation, fondness, happiness, calmness, contentment, excitement, and longing. The intervals between the pairs of opposite adjectives chosen by the subjects were measured by recording and analyzing the feelings and preferences of the subjects. The questionnaire in this paper uses a five-point Likert scale, which is divided into five levels: not good, not very good, fair, better, and very good. They were assigned values of −2, −1, 0, 1, and 2, respectively [
43].
2.5.3. Statistical Analysis
The relationship between the visual interest level, physical comfort level, and subjective satisfaction was further investigated. The interest level data and LF/HF change values obtained from the physiological measurements, as well as evaluation scores obtained from the psychological questionnaire on four different plant communities, were analyzed for correlation. Correlation analysis was performed using spss26.0 and the Pearson formula [
44], which is as follows:
In the formula, Xi represents the data of the interest level when viewing the different plant communities, where i = 1, 2, 3,..., n; is the average value of the interest level; Yi is the value of LF/HF ratio reduction within the different plant communities, where i = 1, 2, 3,..., n; and is the average value of LF/HF ratio reduction.
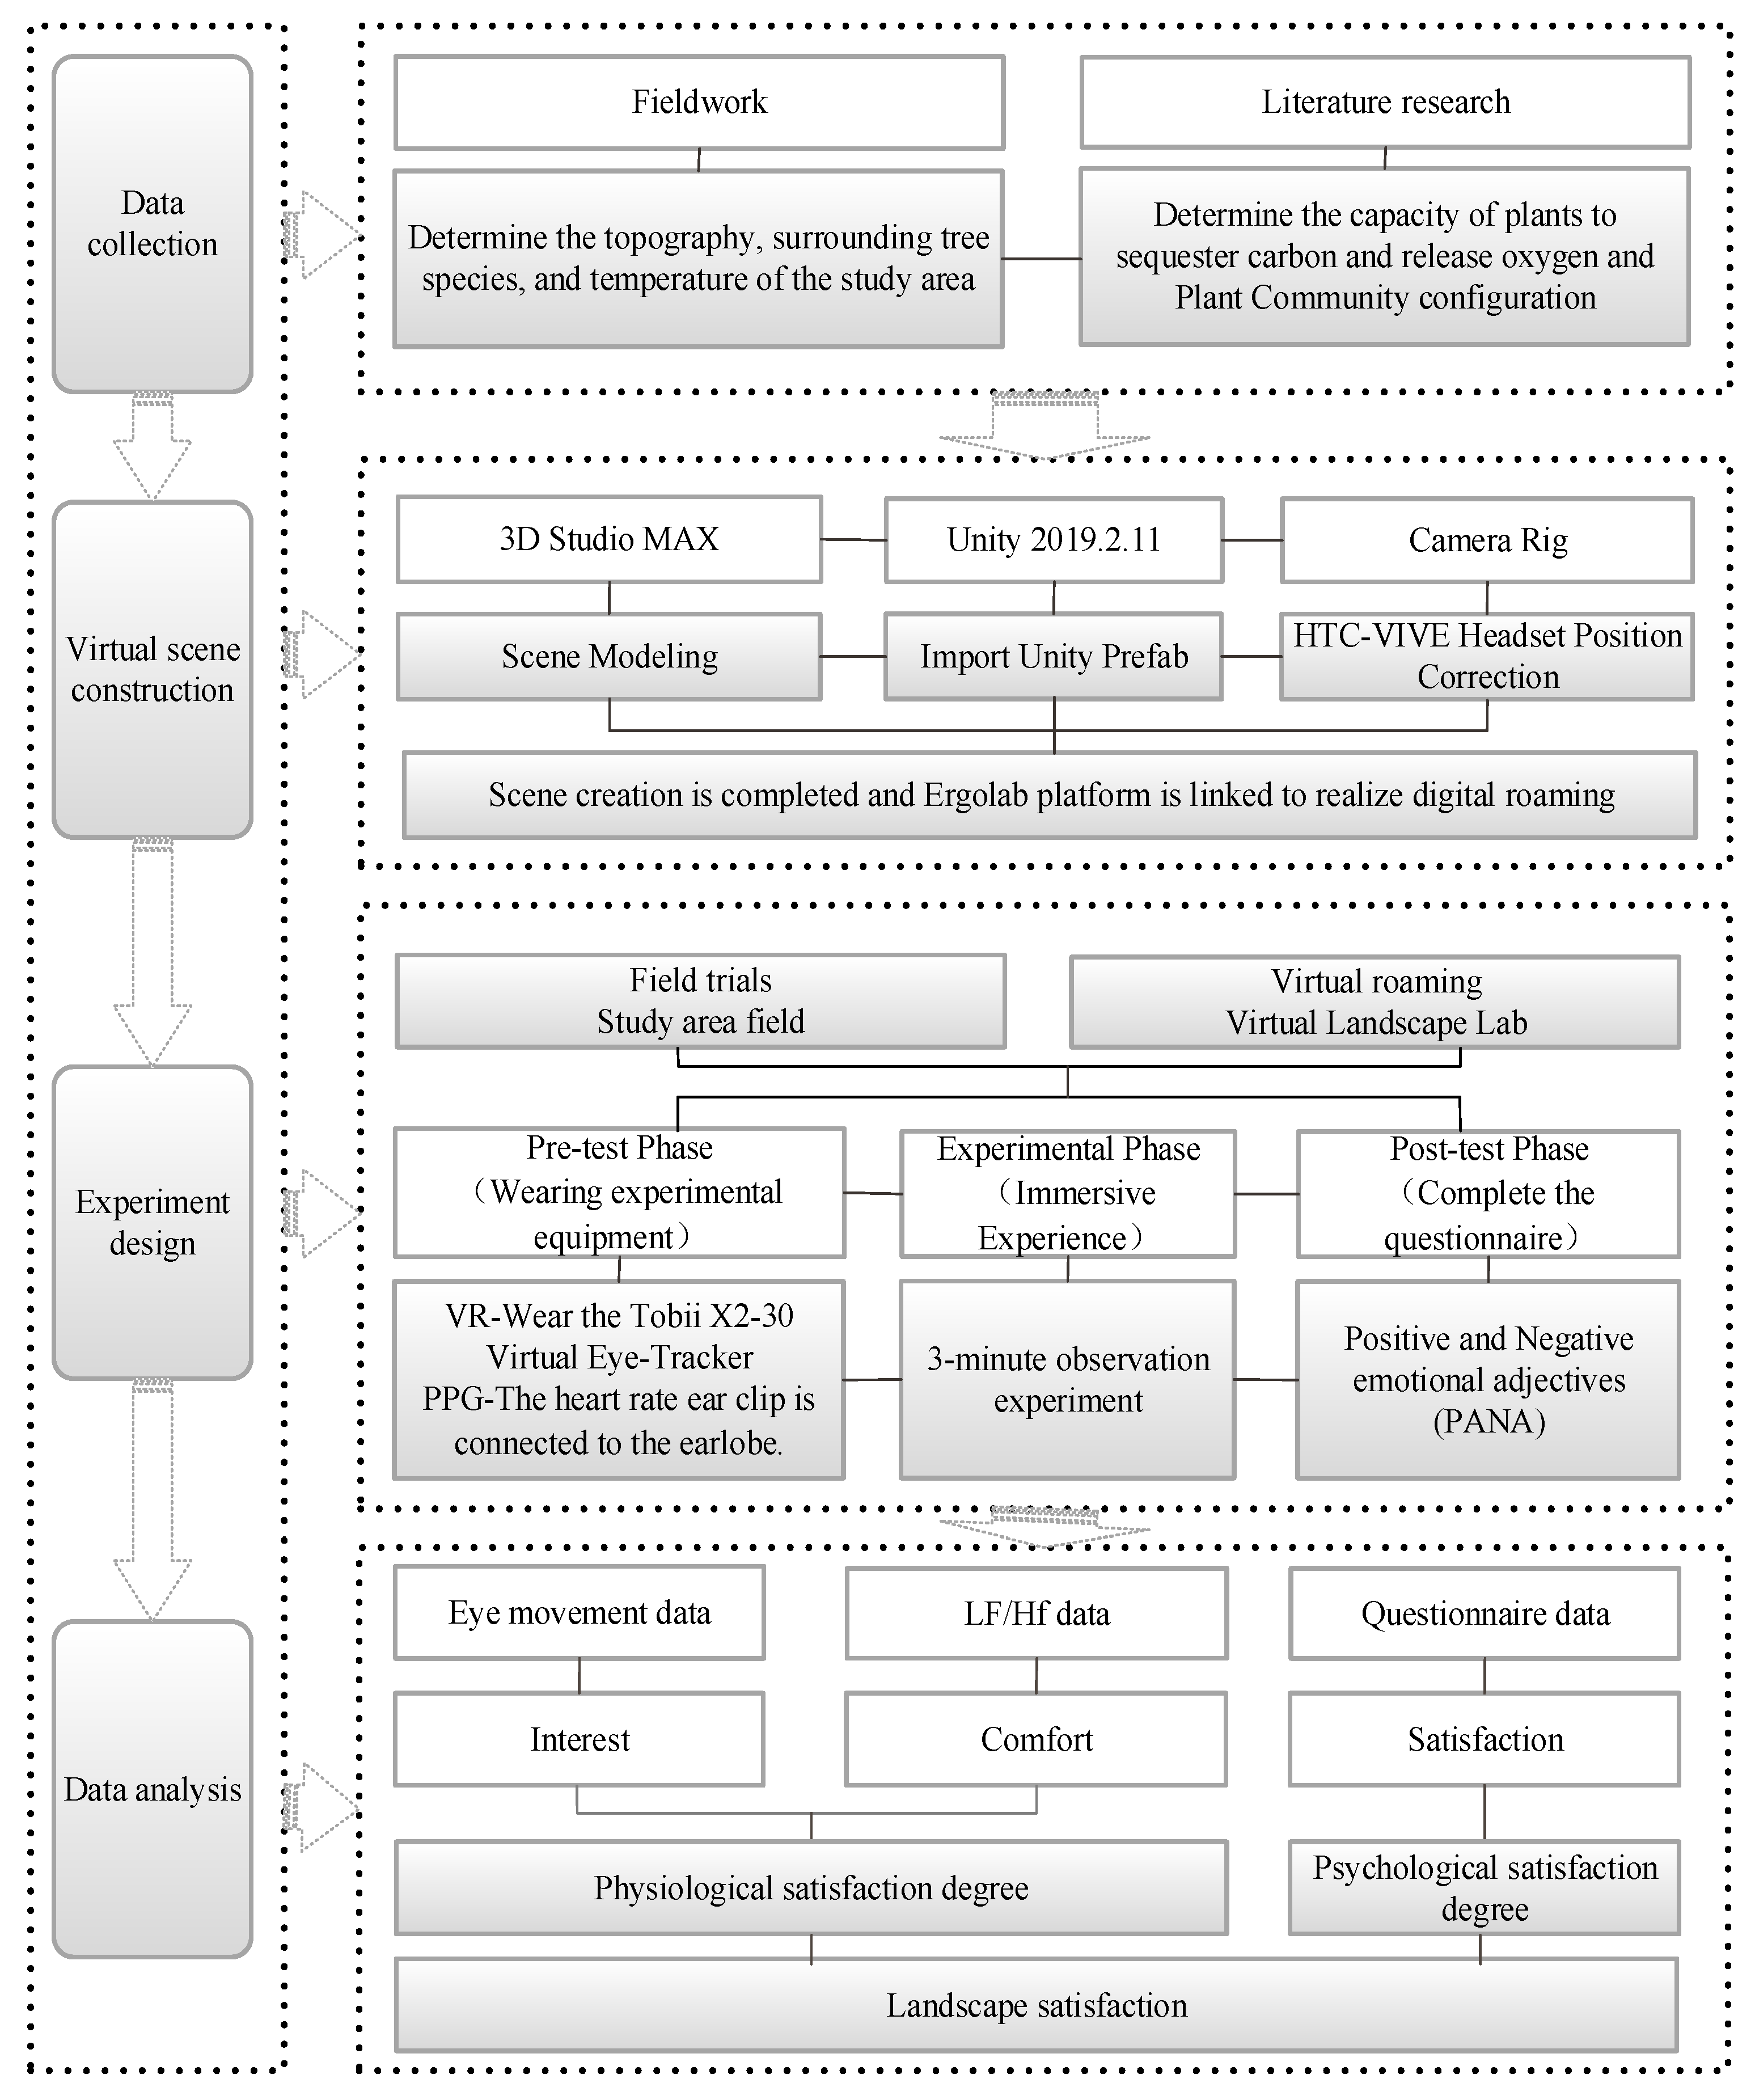
2.6. Methods and Logical Structures of Research
In order to scientifically and rationally determine the landscape of the urban green space plant community, the people’s satisfaction evaluation must be obtained. This research mainly included four stages: data collection, virtual scene construction, experimental design, and data analysis. The data collected in the early stage were used to design the landscapes of the different plant communities in the study area. VR equipment was used to conduct 3D landscape roaming, and the PPG device was clamped into the earlobe to obtain LF/HF data in HRV. Positive and negative emotion adjective scale was set up to obtain the subjective satisfaction score. Eye movement, heart rate, and questionnaires were used to explore the effects of different plant community landscapes on human physiology and psychology to determine people’s satisfaction with the different landscapes.
Figure 4 shows the evaluation framework of plant community satisfaction.
4. Discussion
According to the physiological data described in
Section 3.1, it was confirmed that the subjects had a high level of physiological satisfaction with the single-story lawn and arboreal plant communities. In the virtual landscape immersion experience, the subjects had a high level of interest in all of the modified plant community designs. The results showed that the subjects’ interest levels were, from highest to lowest: G > T-S-G > T-G > T. This is consistent with the findings of Franěk [
48]. The change in the LF/HF ratio confirms that people are more comfortable in landscape scenes with high vegetation cover than in those with low vegetation cover, which is consistent with the findings of Qin et al. (2013) [
49]. The results showed that in the modified immersion experience, the comfort level was the strongest in the tree-shrub-grass composite woodland, and the comfort levels of the four vegetation communities were, from highest to lowest: T-S-G > G > T-G >T. There are differences between the data on different communities, which indicates that the differences in visual effects and spatial scenes generated by different plant community configurations will affect people’s level of satisfaction with urban green spaces. The cleanness and tidiness, openness, and vastness were the favored characteristics of lawns. People’s increased interest in lawns may be due to the wide view of single-layer grassland communities, where people can observe diverse landscapes and relax. Moreover, lawns can be used to provide an open space for visitors to play or rest. People like the multilayer tree-shrub-grass configuration probably because of its stable structure, strong spatial hierarchy, and rich diversity of species. Furthermore, the tree-shrub-grass configuration provides a private space for communication and meditation. A combination of plant configuration and functional requirements can help generate higher interest and comfort in the surrounding environment and improve people’s satisfaction with the plant communities in urban green space. The plant species configurations assessed in this paper can be applied to the construction of urban green spaces in central China.
According to the results of the psychological evaluation in
Section 3.2, it was confirmed that landscapes with high vegetation cover resulted in better environmental satisfaction than landscapes with low vegetation cover. The subjects’ satisfaction evaluation scores were, from highest to lowest: T-S-G > G > T-G > T. In the evaluation of the different plant community configurations, the evaluation scores of comfort, relaxation, and pleasantness were higher in single-layer grassland communities; the evaluation scores representing people’s comfort, stability, and satisfaction were higher in the tree-shrub-grass composite woodland community. There is a high consistency between the psychological evaluation and physiological data. Through our experiments, it was confirmed that different plant community configurations will have different degrees of influence on people’s psychology. The tree-shrub-grass composite woodland has the greatest influence on people, which may be because this kind of landscape is closer to the natural landscape and may act as a stress reliever. The plant community as an integral part of urban green space not only plays an important role physically in adjusting the temperature and humidity, reducing noise, breaking wind, and improving the urban microclimate, but it is also increasingly recognized and verified for its psychological wellbeing benefit. In the post-epidemic era, urban green space is important for providing various environmental services as well as social and psychological benefits. Higher satisfaction with plant communities not only promotes a better ecological conservation of those spaces but also has a healing effect on human psychological health [
50].
According to the results of
Section 3.3, it was confirmed that there was a significant correlation between interest level and comfort level, thus confirming that, together, the visual interest level and physical comfort constitute satisfaction indicators at the physiological level (i.e., interest + comfort = physiological satisfaction). Moreover, there was also a correlation between each of the data, thus confirming that combining physiological interest and comfort data with subjective psychological evaluation scores is meaningful and constitutes an evaluation of landscape satisfaction (i.e., physiological satisfaction + psychological satisfaction = combined satisfaction). Therefore, the combination of physiological satisfaction and psychological satisfaction constitutes a landscape satisfaction evaluation, and the combination of the two can make the obtained evaluation more comprehensive. From the results of the evaluation of plant community satisfaction, it was confirmed that people’s satisfaction evaluations of plant communities can be reflected by eye movement data, heart rate data, and positive and negative emotion scales. This further confirms the “impact of natural scenery or plant landscape on human physiology and psychology” [
51,
52]. In the process of plant landscape evaluation in the future, by combining the single subjective evaluation and single objective evaluation methods that have previously been used by scholars, a subjective and objective evaluation model can be formed at the visual, physical, and psychological levels. This method of plant landscape evaluation can scientifically and reasonably configure plant communities’ landscape, improve the role of small-scale plant community in urban green spaces, and maximize the ecological benefits and aesthetic functions of the plant communities in order to provide a basis for building a livable environment.
5. Conclusions
In this paper, VR technology, PPG technology, and psychological questionnaires were used to evaluate satisfaction with urban green spaces with different vegetation cover and different plant configurations. The application of physiological feedback equipment and eye movement technology meant that participants’ satisfaction could be recorded more objectively during the short-term environmental experiences. The current findings confirmed that these new technologies can be used to analyze people’s landscape satisfaction of urban green spaces. Secondly, the study revealed that different plant community structures have different impacts on people’s satisfaction with urban green spaces. Finally, the results found that the study of people’s satisfaction with urban green spaces is conducive to the sustainable development of their design and can stimulate people’s awareness of environmental protection. Urban green spaces with high vegetation cover created higher environmental satisfaction, with single-layer grassland and tree-shrub-grass composite woodland community spaces resulting in people experiencing better physiological and psychological feelings, so in the subsequent landscape design, we should pay attention to improving vegetation cover in urban green spaces and creating more urban green space. The combination of plant community types can be flexibly matched according to the actual environment and scene. In different scenes or spaces, combinations and matches are determined according to the needs of designers or users, leading to the creation of a landscape environment, which is suitable for human activities. The results of this study can provide an objective basis for plant community configuration in future urban green spaces and can guide the design of future landscapes. On the basis of ensuring ecological benefits, the way people perceive different landscapes was considered in the present study, thus realizing the need for sustainable landscape design in the age of carbon neutrality and giving full play to the ecological benefits of the carbon sequestration and oxygen release abilities of plant communities while creating a satisfying living environment for people, with the natural environment also playing a healing role. The comprehensive satisfaction evaluation model, which combines interest, comfort, and subjective satisfaction, can also be used to evaluate other aspects of landscape satisfaction.
This paper also has some limitations. Only 88 randomly selected subjects were invited to participate in the experiment, and the effects of age differences and the differences in the professional level of the sample on the data were not considered. Therefore, future studies must be targeted to study the different responses of different nature and age variables. The experiment was conducted in early summer, and although a date with a suitable temperature was chosen for the experiment, the subjects’ preferences may still be affected by weather changes, especially if considered through the lens of the field experiment method. Further research and exploration of the effects of different seasonal plant community landscapes on human landscape satisfaction should be conducted. Temperature and humidity can only be controlled in an indoor simulation scenario, which lacks the ability to simulate natural wind speed, solar radiation, and other factors, and the technology for simulating field scenarios needs to be strengthened. Only common tree species with a high carbon sink capacity were selected for the plant species configuration, and the influence of different plant species, forms, and colors on the subjects’ experience was not fully considered. In the future, more specific aspects should be studied in detail.


