Article

Potential Land-Use Conflicts in the Urban Center of Chongqing Based on the “Production–Living–Ecological Space” Perspective

1
College of Public Management, Chongqing Finance and Economics College, Chongqing 401320, China
2
Institute of Green Development, Chongqing Finance and Economics College, Chongqing 401320, China
3
College of Economics, Chongqing Finance and Economics College, Chongqing 401320, China
4
Chongqing United Equity Exchange Group Co., Ltd., Chongqing 401121, China
5
College of Economics, Yunnan University, Kunming 650091, China
*
Author to whom correspondence should be addressed.
Land 2022, 11(9), 1415; https://doi.org/10.3390/land11091415
Submission received: 26 July 2022 / Revised: 22 August 2022 / Accepted: 26 August 2022 / Published: 28 August 2022
(This article belongs to the Special Issue Rethinking the Man-Land Relations in China)

Abstract

:
With the rapid population growth and accelerating urbanization process, people compete for the scarce land resources to pursue their incompatible interests. Thus, a series of land-use conflicts (LUCs) problems are caused. Scientifically identifying the intensity of LUCs is the basis for coordinating the man-land relations. We selected the urban center of Chongqing (UCC) as the study area and chose the landscape ecological risk assessment to estimate the level of LUCs by using the hot-spot analysis and neighborhood analysis to analyze the spatiotemporal evolution characteristics and potential risk of LUCs in the UCC over the past 20 years. The results show that the conversion between the living–production space (LPS) and other spaces was most frequent. The assessment model based on the theoretical framework of landscape ecological risk assessment could effectively measure LUCs. The average conflict level of UCC has increased from 0.62 to 0.69. The area of the out-of-control zone has increased, forming hot spots in the concentrated areas of social and economic activities. In contrast, the area of the controllable zone has decreased, forming cold spots in the high-altitude forest areas. The entire area faces the potential risk of the LUCs, but not seriously. The area of the high and extreme potential conflict zones has increased and is concentrated in the northern region of the study area. Targeted management strategies and policy recommendations for regional development should be adopted for different LUCs zones in UCC at international and national levels. Our research can be extended to other areas under rapid urbanization to assess and better manage their land resources for sustainable use, and further to promote the harmonious development of regional man-land relations.

1. Introduction

The land is an indispensable and scarce resource to meet human production and life. Land-use conflicts (LUCs) describe the incoordination of land-use structure when meeting the diverse human demands under the deterioration of the natural environment, which is a sensitive indicator of human–environment interaction [1]. Its essence is the process of game and competition between the human system and natural system in time and space in the same area [2]. It is a manifestation of the uncoordinated development of the human–environment system, which will have many negative effects. LUCs are common in different regions of the world. Due to the rapid population growth and accelerating urbanization process, the demand for different land-use types is increasing [3]. The kinds of LUCs are also more and more diverse. Similar to the conflict between construction land expansion and essential farmland protection, there is a conflict between ecological land protection and production land expansion. The conflict between the increase in land demand and the degradation of land quality is becoming more and more prominent [4]. The drastic spatial change in land use is one of the most critical manifestations of LUCs. The disorderly spatial pattern of PLES in the same region will place tremendous pressure on limited land resources and cause waste of spatial resources [5]. The LUCs pose severe challenges to the sustainability of the land system and regional coordinated development, which raises excellent concerns about LUCs.
It is widely believed that the multifunctional of land-use, land resource scarcity, and diversity of human needs are the fundamental causes of LUCs [1,6,7,8,9]. It occurs when different land users pursue their incompatible interests, they will compete for the scarce land resources. With the competition of spatial resources by humans, a series of LUC problems are caused, such as the land spatial pressure increasing, the landscape ecological stability weakening, spatial interference strengthening, etc. [10]. These problems were widespread in the world, especially in the rapid urbanization area. Therefore, how to identify the spatial–temporal evolution characteristics and the potential risk of LUCs scientifically is the essential work and the core focus of LUCs research [11]. It was of great significant to alleviate the negative influence of conflict on land sustainability, promote the optimal allocation of regional land resources, and coordinate man-land relations [12].
“Production–living–ecological space” (PLES) is a theory proposed by the Chinese government in the strategy of ecological civilization construction, aiming at realizing sustainable utilization and focusing on the perspective of land multifunctional utilization [13]. The report of the 18th National Congress of the Communist Party of China (CPC) and the 14th 5–Year Plan of the CPC Central Committee on National Economic and Social Development both proposed the goal of developing the nation’s PLES. According to the muti-functional attributes of the land, the urban center of Chongqing (UCC)’s land was divided into ecological–production space (EPS), production–ecological space (PES), living–production space (LPS), and ecological space (ES). The EPS is the space with ecological and production function, and the main function is ecological. The PES is the space that is used primarily for agricultural production function and has an ecological function at the same time. The LPS is the space that meets the needs of human life and entertainment, and contains the highest economic value. The ES is the space that has ecological functions such as regulating the atmosphere, conserving water source, water and soil conservation, etc., but does not have a production function. Therefore, understanding LUCs and their evolution characteristics can provide a scientific guide for the optimization of the PLES. Although the importance and necessity are acknowledged, there is still a lack of effective analysis of LUCs for UCC.
Compared with existing studies that focus on regional land use, and land-cover change, analyzing regional land-use conflicts can better reflect the interaction and relations between human and land resources [14]. As early as the 1970s, the study of LUCs began to attract wide attention over the world. It mainly studies the contradiction between human needs and economic development [15]. “Land management, land-use relations and conflicts” was one of the five main topics of the Urban Fringe Symposium organized by the English Countryside Association in 1977 [16]. With the ongoing concern for ecological civilization construction, the study of LUCs has gradually became the focus of scholars [17,18,19]. The number of studies on LUCs from different perspectives is gradually increasing [20,21]. The recent decade of research on LUCs has reached a new height. The research topics of LUCs are mainly as follows: (1) the LUCs patterns [22,23]; (2) the LUCs identification and intensity diagnosis [24,25]; and (3) the LUCs evolution and driving mechanism [1,26]. Based on the existing research, the LUCs identification methods mainly include game theory [27], participatory mapping [28], stress state response (PSR) model, multiobjective comprehensive assessment [2,29,30], and landscape ecological risk (LER) assessment [21,31]. These studies have provided many references for the identification of LUCs in this study, but there are few related studies on the central city area and from the PLES perspective.
Chongqing plays a vital role in the construction of ecological civilization in China. It plays a supporting position in the development of the western region in the new era, an exemplary role in the green development of the Yangtze River Economic Belt, and a key role in driving the development of the Belt and Road. Furthermore, Chongqing is also the youngest municipality with rapid urbanization in China. Due to the intensification of urbanization and rapid economic development, the dramatic changes in land-use structure have caused an imbalance of production, living, and ecological spaces [1]. The degree of LUCs in the UCC has further deteriorated. The man-land relations are becoming increasingly tense. Therefore, we selected the urban center of Chongqing (UCC) as a study area, because this area is the economic and cultural center of the whole of Chongqing. We analyzed the spatial evolution characteristics of LUCs and potential risk in the past 20 years in the UCC from the perspective of the PLES. Our study expanded the research perspective of LUCs identification, and provided a reference for those regions in the world whose development orientation is “ecological priority and green development”, so that urban managers and policymakers may be better informed when developing pertinent land-use policies and strategies at different levels. It is helpful to relieve the level of LUCs in the rapid urbanization area, promote optimized land spatial patterns, the rational use of land resources, and the coordinated development of man-land relations in the world [11]. Our aim includes the following three objectives.
(1) Based on the LER assessment method, to construct the evaluation model of LUCs from the PLES perspective;
(2) To identify the LUCs zones and diagnosis the conflict intensity;
(3) To construct a land-use conflicts risk index to explore the potential LUCs.

2. Materials and Methods
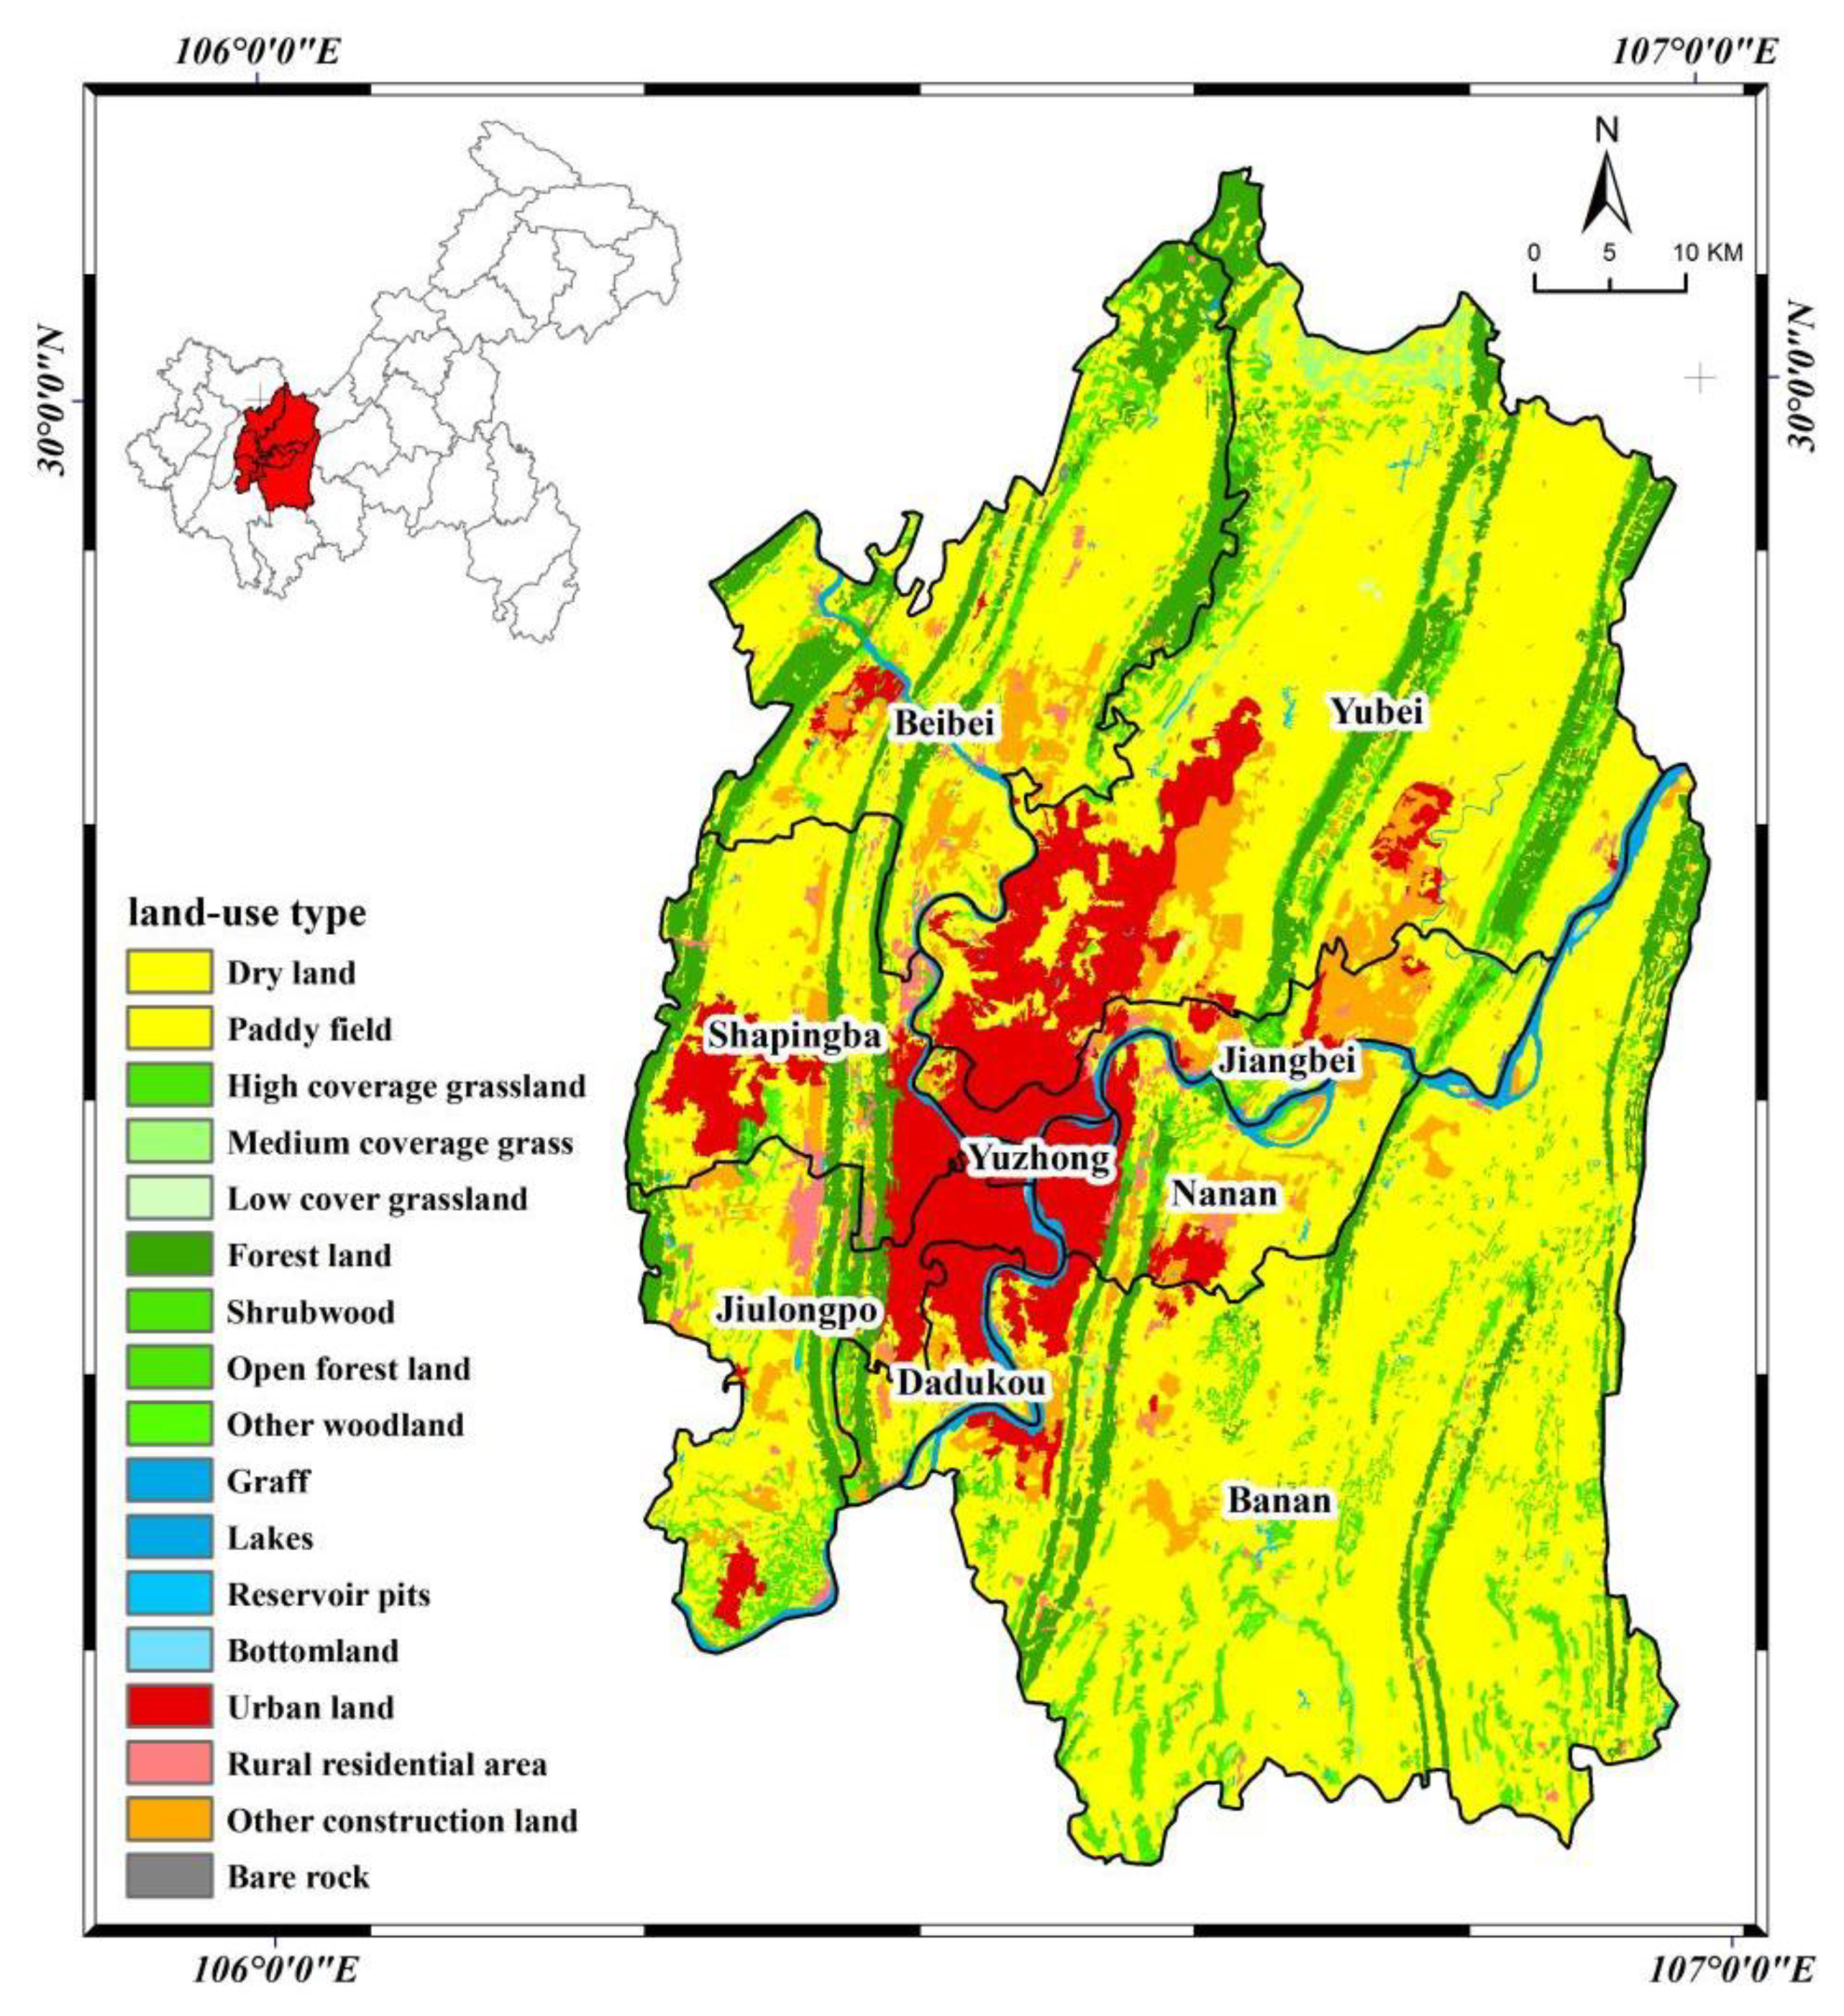
2.1. The Study Area

Chongqing is the youngest municipality in China and is located inland in the southwest of China. Chongqing is an essential strategic fulcrum of China’s western development. It is geographically located at the connection point of the “Belt and Road Initiative” and the Yangtze River Economic Belt. It has a unique and vital development navigation orientation in the pattern of national regional economic development, and opening to the outside world. The UCC is the political, economic, and cultural center of Chongqing, and this area is essential for the development of the city and surrounding areas. The UCC includes nine districts: Yuzhong District, Shapingba District, Beibei District, Yubei District, Jiangbei District, Nan’an District, Banan District, Dadukou District, and Jiulongpo District, with a total area of 5466 km2 (Figure 1). The topography of the study area is complex and diverse, with hills and low mountains as the main ones and few flat dams. The principal rivers are mainly the Yangtze River and the Jialing River. According to the Seventh National Population census, Chongqing has a population of 32.0542 million, with a GDP of CNY 2500.279 billion. The UCC has a considerable population and a solid economic foundation. Its population and GDP accounted for 32.27% and 39.5% of the total urban population, respectively [32]. With the rapid growth of the economy and people, the LUCs of the PLES and the tension of man-land relations in the UCC are evident, and need to be paid more attention.

2.2. Data

The data of administrative districts of the study area were derived from the Remote Sensing Monitoring Institute of Chongqing Planning and Natural Resources Survey and Monitoring Institute. The land-use data used for three phases from 2000 to 2020 were obtained from the Data Center for Resources and Environment Science and Data Center, Chinese Academy of Sciences (http://www.resdc.cn/ (accessed on 9 July 2022)). The resolution of the land-use data is 30 m × 30 m. The types of land-use include six types of the first order: cultivated land, woodland, grassland, water area, residential land, and unused land, and 25 types of the second order. The social–economic data mainly come from the Chongqing Statistical Yearbook (2021).

2.3. Methods

2.3.1. Construction of the PLES Classification System

The PLES has the characteristics of complex spatial functions, differences in spatial scales, and the heterogeneity of spatial land use [33]. Its classification is exceptionally complicated. Land resources are the lifeblood of promoting economic development, the source of all productive activities, and the interrelated and unified complex of the PLES. Land-use type has multiple functions, e.g., the construction land has two functions of production and living, and the cultivated land has two functions of ecological and production. Combined with the theory of the PLES and the previous research results [34,35,36], each land-use category was linked with the leading function of the PLES. Referring to relevant studies [37,38], the PLES classification system was constructed according to the study area’s actual situation, as shown in Table 1.

2.3.2. Dynamic of Land–Use Change

The conversion between land-use types is mainly realized by the land-use transfer matrix, and the dynamic change process of land-use types is mainly expressed by single land-use dynamic and bidirectional land-use dynamic [38].
The single land-use dynamic ( L C D I i ) refers to the ratio of the area change of land-use types in the region to the study period, which mainly reflect the rate of change of a single land-use type in a certain period. The bidirectional land-use dynamic ( B L C D I i ) is a further supplement to L C D I i [38]. It can better describe the change process and the direction of a certain kind of land use, which mainly reflects the transfer intensity between land-use types. The formulas are below:
L C D I i = ( S i b S i a )   S i a × 1 T × 100 %
B L C D I i = ( S i j + S j i )   S i × 1 T × 100 %
where L C D I i is the single land-use dynamic of i–th PLES type; S i a is the area of i–th PLES type at the beginning; S i b is the area of i–th PLES type at the end; T is the study time interval; B L C D I i is the bidirectional land-use dynamic of i–th PLES type; S i j is the sum of the area of i–th PLES type changing into other PLES types; S j i is the sum of the area of other PLES types changing into i–th PLES type; S i is the area of i–th PLES type at the beginning.

2.3.3. Construction of LUCs Assessment Model

Land-use systems are dynamic, fragile, and complex [39]. To avoid the fragmentation of regional spatial units, we consider the research scope, scale, spatial resolution, spatial patch status, and data types. The maximum horizontal distance of the study area between east and west is about 74 km, and the maximum vertical distance between north and south is about 112 km. To ensure that there are multiple spatial types in an assessment unit, this paper choose a 4 km × 4 km grid as the evaluation unit. The study area was divided into a total of 397 assessment units. We chose the method of the LER assessment to measure the intensity of LUCs because we consider that the LUCs and landscape ecological risk assessment are highly related (Figure 2).
The spatial complexity index (CI), spatial vulnerability index (FI), and spatial stability index (SI) were chosen to construct the LUCs assessment model to measure the conflict level of spatial units in a region from the ecological point of view. Referring to previous studies [37,40,41], the LUCs assessment model can be expressed as:
SCCI = CI + FISI
where SCCI is the LUCs level; CI is the landscape complexity index; FI is the landscape vulnerability index; SI is the landscape stability index.
(1) Landscape complexity index (CI)
CI is mainly due to the low efficiency of land use caused by rapid urbanization, which leads to the negative effects of system fragmentation and complexity [40]. AWMPFD index is called the area–weighted average patch fractal dimension in landscape ecology. The higher its value, the greater the degree of human disturbance, and vice versa. In this paper, the AWMPFD index is used to express CI. The formula is below:
A W M P F D = i = 1 m j = 1 n [ 2 l n ( 0.25 P i j ) l n ( a i j ) ( a i j A ) ]
where Pij is the perimeter of the patch; aij is the area of the patch; A is the total area of spatial units in the landscape; m is the total number of evaluation units in the study area; n is the number of three spatial types.
(2) Landscape vulnerability index (FI)
FI is mainly due to the vulnerability of a land-use system under the interference of external pressure, which will cause significant damage to the system. With time and space changes in land use, there are significant differences in maintaining ecosystem stability, protecting biodiversity, and improving system functions; that is to say, the various landscape elements have different responses to spatial conflicts, which are related to the stages in the natural succession process. In different locations, the ability of land-use types to resist external disturbance is other. FI is used to express it. The formula is below:
F I = i = 1 n F i × a i S ( n = 4 )
where FI is the landscape vulnerability index; ai is the area of various landscapes in the unit; S is the total area of units. Referring to the existing research [42], the order of landscape fragility of FI from strong to weak is LPS = 4; PES = 3; EPS = 2; ES = 1.
(3) Landscape stability index (SI)
SI refers to the phenomenon that landscape patches are fragmented under the interference of external pressure. The more fragmented the spatial form of the land-use unit, the stronger the dynamic, the worse the stability, and the stronger the conflict effect. The formula is below:
P D = n i A ,   S I = 1 P D
where ni represents the number of i–th PLES in the spatial unit; A is the space unit area; PD is the density of plaque. The larger the PD value, the higher the fragmentation degree, the worse the stability, and the worse the anti-interference ability of the unit. For the convenience of calculation, the numerical values in Formulas (3)–(6) are linearly standardized to (0, 1) by using Formula (7) to calculate the conflict in the later period. The standardized formula is below:
S = X X min X max X min
where X is the value in (3), (4), (5), and (6), Xmin is the minimum value, and Xmax is the maximum value according to the existing research [43], based on the inverted “U” model. The LUCs of the study area were divided into four stages [9,23,44]: the stable control stage [0.0, 0.35), the basic control stage [0.35, 0.7), the basic out-of-control stage [0.7, 0.9), and the serious out-of-control stage [0.9, 1). In the stable control stage, the conflict has not yet formed or is in the potential stage, and will have no negative impact on the regional land use. In the basic control stage, conflict begins to form and gradually emerge, but is mostly constructive rather than destructive [45,46]. Appropriate measures should be taken to regulate and avoid or minimize the negative effects of conflict. In the basic out-of-control stage, the conflict broke out gradually, and the direction of land-use transformation gradually lost control. Effective measures must be taken to curb the conflict. Otherwise, the regional land use will gradually be unbalanced. In the serious out-of-control stage, the conflict completely breaks out, which requires the intervention of various administrative, economic, and legal measures. Otherwise, it may evolve from LUCs to a conflict of a social nature [47].

2.3.4. Spatial Relationship of LUCs

The land-use patches are often significantly affected by the land-use patterns around them, which is manifested in two aspects, including spatial agglomeration and spatial adjacency. On one side, the cold spots and hot spots are statistically significant spatial clusters of high values and low values, respectively [48], reflecting the spatial agglomeration relationship and the active degree of the LUCs zones. On another, if there is a more significant conflict difference between adjacent units, the interference of land-use patterns in its adjacent units will be stronger, and the possibility of causing LUCs will be higher [23]. Thus, the methods of cold- and hot-spot analysis and neighborhood analysis were used to reflect the spatial agglomeration relationship and potential risk of LUCs in the UCC. Taking the “3 × 3” rectangular component as the range, the standard deviation of the central element can be obtained through the neighborhood analysis function, to judge the influence degree of the surrounding units on the main unit [23,47]. The potential land-use conflicts risk index (PLUCRI) was constructed to analyze the potential LUCs. The specific formula is below:
L i = | G n b r i j G s c r i | N n b r i
where L i is the PLUCRI of the i-th evaluation unit, and the larger the value is, the greater the possibility of conflict in the evaluation unit would be. G s c r i denotes the conflict intensity of the i-th evaluation unit, and it is represented by eight LUCs zones (for quantitative calculation, I–VIII is represented by 1, 2,…8, respectively). G n b r i j is the conflict intensity of the j-th neighborhood unit’s i-th evaluation unit. N n b r i is the number of neighborhood units of the i-th evaluation unit [23].

3. Results

3.1. Spatiotemporal Evolution Characteristic of the PLES

According to the classification system of the PLES, the land-use types in the UCC were divided into four spatial types. Spatiotemporal evolution characteristic of the PLES in the study area is shown in Figure 3. The spatial distribution of PES was the most extensive. ES was mainly distributed in the areas where the Yangtze River and Jialing River flow through. EPS was strip-shaped from north to south. The concentration of LPS was the highest in Yuzhong District and its vicinity.
As Table 2 shows, from 2000 to 2020, the LPS expanded significantly by 673.68 km2 (+254.22%), while the PES was compressed by LPS and reduced by 671.35 km2 (−17.12%). Due to the ecological protection policy, the proportion of ES increased sustainably in the past 20 years. It shows that rapid urbanization mainly eroded the PES and EPS in the UCC.
To analyze the transformation of the PLES, the land transfer matrix was used. From 2000 to 2010, the LPS in the UCC increased by 268.15 km2, while the PES decreased by 268.66 km2. The percentage difference between the transfer-in and transfer–out ratio of PES was −6.82%, the LPS was 49.76%, the ES was −1.86%, and the EPS was −2.47%. The LCDIi of the LPS was the largest. It showed that the rate of change in the LPS was the greatest in this decade. In the process of rapid urbanization, it mainly aimed to meet the regional expansion of LPS. The BLCDIi of the LPS was 10.33%, and was the largest during this period. It showed that the transformation between LPS and other spaces was the strongest. The conversion of PES to LPS was the primary source of the increase in the LPS area. It showed that urban expansion was mainly based on the interconversion of LPS, ES, and PES, and the transfer area of LPS was more significant than the other two (Table 3, Figure 4).
In the transfer of the PLES in the UCC from 2010 to 2020, the area of the LPS and the ES still increased, while the area of the PES and the EPS still decreased. The percentage difference between the transfer-in and transfer-out ratio of PES was −10.84%, the LPS was 42.08%, the ES was 0.81%, and the EPS was −0.38%. The LCDI of the LPS was the largest, which showed that the growth of construction land was the primary trend in the process of urbanization in this period. The BLCDIi of the LPS was 8.12% and the largest during this period. It showed that the conversion between LPS and other spaces was the strongest and most frequent, although the LCDIi of the EPS is −0.04%, the LCDIi of the ES is 0.09%, the BLCDIi of the EPS is 1.12%, and the BLCDIi of the ES is 0.99%. It shows that although the rate of change of the ES is faster than the rate of change of the EPS over these ten years; however, between the EPS and other spaces is stronger than the transfer intensity between the ES and other spaces (Table 4, Figure 4).

3.2. Spatiotemporal Distribution Characteristics of the LUCs

According to Formulas (3)–(7), the LUCs in the UCC were calculated and visually expressed (Figure 5). We derived spatial patterns of the UCC’s land-use conflicts from 2000 to 2020. The distribution pattern was “high in the south and low in the north” in 2000. The LUCs was higher on the southern side of the UCC, especially in the center area of the UCC and the northeastern of Banan District. The relatively high LUCs in the south of regions were dominated by the basic out-of-control zone and the serious out-of-control zone. From 2000 to 2010, the basic out-of-control zone had spread around. It is worth noting that by 2010, the level of the LUCs in the Yuzhong District changed from the basic out-of-control to the basic control. From 2010 to 2020, the basic out-of-control zone was widely distributed in the UCC gradually. The serious out-of-control zone was distributed on the northern side of the UCC, especially in the Yubei District and Beibei District. Therefore, the spatial distribution pattern was “high in the north and low in the south” in 2020. The relatively high LUCs in the northern regions were also dominated by the serious out-of-control zone, and the basic out-of-control zone. The main gathering areas of the basic out-of-control zone and the serious out-of-control zone gradually expanded from Dadukou District, Jiulongpo District, and Yuzhong District to Shapingba District, Beibei District, Yubei District, Nan’an District, and Banan District. From 2000 to 2020, Chongqing’s economy developed rapidly, the urban traffic network changed from simple to complex, the medical facilities changed from few to many, and the construction land changed from scattered to concentrated. The rapid urbanization process caused serious conflict between the PLES. The area of controllable decreased, while the area of out-of-control increased in the UCC from 2000 to 2020.
According to the result presented in Table 5, the average conflict level in Chongqing urban center from 2000 to 2020 increased from 0.62 to 0.69. In the process of rapid urbanization, the characteristics of “two decreases and two increases” appeared. The characteristic of “two decreases” means the area of the stable control zone and area of the basic control zone declined. The characteristic of “two increases” means the area of the basic out-of-control zone and the area of the serious out-of-control zone increased. From 2000 to 2020, the area of stable control zone was maintained at 6–7%. The area of basic control zone was reduced by 18.48%, while the area of out-of-control zone increased by 19.24%. The area of basic and serious out-of-control zone occupied almost 56% of the study area. It posed a serious threat to the ecological environment of Chongqing. Compared with the conflict change over the three periods, it showed that the out-of-control level was mainly clustered in the LPS and PES area. It is due to the conflicting living–ecological, production–ecological functions. The area far away from the LPS and PES was mainly the controllable level, and this type of area was dominated by ecological function land.
The spatial distribution characteristics of the PLES in the LUCs zones in the UCC (Figure 6) and the corresponding area ratio changes (Table 6) were analyzed by spatial superposition analysis.
In the stable controllable zone, EPS occupied the absolute number, accounting for 50.99% in 2020. The land-use type of EPS was mainly forest, which has strong ecological functions. From 2000 to 2020, due to the decrease of PES and the increase of LPS, the range of the basic controllable areas was also shrinking.
From 2000 to 2020, in the basic out-of-control zone and the serious out-of-control zone, LPS increased by 27.93% in total, while the other three types decreased. Among them, PES decreased by 17.24%, EPS decreased by 10.48%, and ES decreased by 0.21%. The out-of-control zone was mainly distributed in the core and peripheral areas of urban economic development, which were the critical area of Chongqing’s future production and living development.
In the past 20 years, Chongqing has been in rapid development of the economy and society. With the level of industrialization and urbanization further improved, the demand for the land for production and living increased. In the continuous improvement of transportation facilities and growing construction land, the ecological land and agriculture land were eroded heavily by urban land. The ES, EPS, and PES were gradually fragmented. The proportion of the out-of-control level in the study area was becoming heavier and heavier. The mutual occupation between the production, living, and ecological land made the LUCs more intense. It resulted in more prominent contradictions between humans and land. The man-land relations were becoming increasingly tense in the UCC.

3.3. Spatial Agglomeration Relationship of LUCs Zones

The spatial agglomeration relationships of LUCs zones were analyzed by using the methods of cold- and hot-spot analysis [49,50,51]. The location of high value and low value of LUCs clustering was obtained by cold- and hot-spot analysis. The results showed that the hot and cold spots of LUCs in the UCC showed an agglomerate spatial distribution pattern. The distribution pattern of hot spots, between 2000 and 2010, was mainly concentrated in Yuzhong and Dadukou, eastern Jiulongpo, southeastern Shapingba, southern Yubei, western Jiangbei, and eastern Banan. By 2020, it especially gathered at the intersection between Yubei and Beibei and the east part of Banan. Complex social and economic activities and convenient transportation facilities diversified the land-use function in these areas. This may be the main reason for the high-value aggregation of LUCs. The confrontation between various land-use functions was particularly fierce, and the conflicts became more and more frequent from 2000 to 2020. The cold spots represent stable and controllable. From the distribution pattern, they were mainly distributed in the boundary edge areas of the urban areas of Chongqing in the past 20 years, such as the south of Banan and the northeast of Yubei. These areas have higher elevations, and the land-use type is dominated by forests. Typical hilly and mountain cover characteristics and the remote geographical location may be the main reasons for the low-value aggregation of LUCs (Figure 7).

3.4. Potential Risk of LUCs

The potential land-use conflicts risk index (PLUCRI) was accessed by using the method of neighborhood analysis [23]. The results showed that the entire area faced the risk of the LUCs, but not seriously. In Figure 8, the areas of the low and general potential conflict area decreased in the last 20 years, while the areas of high and extreme potential conflict increased and concentrated in the north of the study area, especially in the north of Yubei District and Beibei District, and the junction of Shapingba District and Beibei District. The zones of low potential conflict, general potential conflict, high potential conflict, and extreme potential conflict account for 43.43%, 32.27%, 17.37%, and 6.93% in 2000, and 41.5%, 33.2%, 16.22%, and 9.08% in 2020. The cold- and hot-spot analysis of the PLUCRI showed that the hot spots of PLUCRI were also concentrated in the north of Yubei District and the junction of Shapingba District and Beibei District in Figure 9. These areas are not only land-use out-of-control areas, but also areas with the higher potential risk of LUCs, indicating that strict spatial boundary control measures need to be implemented in these areas as soon as possible. Therefore, the future regional land use needs to strictly implement the border control of spatial planning to reduce the influence of neighborhood units so that the intensification of conflict will not arise [47].

4. Discussion

4.1. Contributions and Limitations

Compared with previous studies, our paper has the following advantages. First, the theoretical basis is sufficient. In our study, we found that the multifunctional land use, land resource scarcity, and diversity of human needs are the fundamental causes of LUCs in the process of rapid urbanization. Rapid urbanization and unreasonable land use will also lead to the complexity and fragmentation of the spatial landscape and damage the stability of the system. Therefore, we believe that LUCs are highly correlated with LER. Based on this, we constructed a conceptual framework for LUCs assessment. Second, the LUCs evaluation framework we constructed can identify the intensity of LUCs at grid scale and regional scale. We find that the conflict zones are gathered in concentrated areas of social and economic activities, which is consistent with the previous findings [29]. This provides more accurate location information for land-use decisions and land management. Third, the identification of potential hotbeds of LUCs is easily overlooked in previous studies. In our study, we try to use domain analysis method to explore the potential LUCs areas. We find that the rural-urban border areas are particularly vulnerable to the potential risk of LUCs, because of high population movements and lack of government supervision. This is an interesting finding and is different from previous studies [47].
In this paper, the complexity, fragility, and stability of spatial patterns were taken as the basis for calculating conflict. However, it should be pointed out that methods and ideas of this study need to be improved:
(1) The method of LUCs we used was based on the LER assessment, so that the factor chosen in the calculation of conflict relied too much on the present situation of land-use function. However, the manifestation, formation mechanism, and influencing factors of spatial conflict are highly complex, involving resources, environment, society, and economy.
(2) The LUCs in our study are caused by the disorderly spatial pattern of PLES, which only reflects the incoordination of the land-use structure, but as per the discussions in the literature [52,53,54,55,56,57], the types of LUCs are various, such as regional conflicts, socioenvironmental conflicts, structure and function conflicts of an urban system, land system conflicts, and cultural conflicts. We will explore these types in the future.
(3) Our research carried the foundation analysis of the evolution and the potential risk of LUCs in the UCC from the view of the PLES. We did not simulate and predict the future development trend of land-use conflicts in the study area, so it is difficult to analyze and solve the conflict problem comprehensively. Therefore, this will be our future direction for further research.

4.2. Policy Recommendations of LUCs Optimization

The LUCs reflect the competition of stakeholders for scarce land resources and the land-use contradiction produced for the realization of their respective interests [58]. The ultimate goal of land-use conflict research is for contradiction reconciliation and relieving man-land relations. These are intended to develop reasonable reconciliation programs to promote sustainable development in the study area [59]. The key is to identify the distribution, manifestation, and degrees of conflicts, and take them as a basis to set up targeted governance strategies. In our paper, we hope to have provided targeted management strategies for different LUCs zones by combining different governance strategies for LUCs at international and national levels, to promote the harmonious development of regional man-land relations. In particular:
(1) In the stable controllable zone
The stable controllable zone in the UCC is mainly concentrated on the edge of Chongqing, where the economy is relatively backward, and the land-use type is dominated by forest. The degree and potential risk of LUCs are weak. These areas should be designated as ecological nature reserves, and production and construction activities should be strictly prohibited. The government should increase ecological subsidies and encourage inefficient farmland to restore forest in these areas. Thus, the self-evolution and regulatory function of regional ecosystem can be enhanced. In addition, the rural residential land in these areas should be gradually moved out according to the policy of increasing and decreasing balance, so as to reduce the interference of human activities to the environment.
(2) In the basic controllable zone
The area of basic controllable zone was reduced heavily by 18.48% in the last 20 years due to the decrease in PES and the increase in LPS. This zone is located in the transition area between human production–life and ecological protection, and does not pose a threat to the regional sustainable land use, but has the potential risk and possibility of LUCs. Therefore, in these regions, the government should adopt a slightly stronger management strategy and more diversified management means. On the premise of not destroying the regional natural ecosystem and farmland ecosystem, land should be properly utilized under the support and drive of policies to maximize the function of land. For example, the government can increase agricultural input, promote the planting and reprocessing of ecological agricultural products, and improve the development level of the primary industry. In addition, the government can also plan and build nature protection resorts to stimulate the living and production functions of land, and develop the tertiary industry while protecting the regional ecological environment.
(3) Basic out-of-control zone
The area of the basic out-of-control zone increased by nearly 13% from 2000 to 2020, occupying almost 47% of the study area in 2020. It posed a serious threat to the ecological environment of Chongqing. This zone was mainly distributed in the core and the peripheral regions of urban economic development, which were human production and living intensive activity areas. The LUCs between production, living, and ecological were very intense and basic out-of-control, and were the focus of governance areas. The government must take into account the fact that Chongqing is an ecologically fragile area. It is urgent to give priority to its ecological protection function and formulate a strong ecological protection policy. Therefore, the basic farmland protection line, ecological protection line, and urban expansion boundary line should be delimited from the macro level. The city scale should be reasonably controlled, and the construction land extraction mechanism should be formulated. There is also a need to strengthen the construction of ecological civilization in this area and enhance the awareness of ecological culture of local people to avoid further deterioration of the ecological environment and to prevent the reform area from further evolving into a serious out of control area.
(4) Serious out-of-control zone
The proportion of this region in 2020 is 8.54%, a 6.27% increase from 2000. Compared with the basic out-of-control zone, the LUCs in this zone reached a stage that is challenging to recover from human intervention. This is a very dangerous area that is constantly threatening the ecological stability and balance of the whole region. In these regions, the production, living, and ecological functions of land have been extensively developed and utilized, resulting in particularly intense land-use conflicts. In the process of governance, the definition of the status of PLES function is followed, in which the production function is the basis, the living function is the purpose, and the ecological function is the guarantee [46]. The strictest control policies and the most powerful protective measures must be adopted to reshape the regional ecological protection barrier and curb its impact on the surrounding land. Occupation and destruction of the ecological environment and illegal occupation of basic farmland are strictly prohibited. No new construction land is allowed within the ecological protection red line. On the premise of ensuring ecological security, the government will rationally arrange ecological communities and green enterprises according to the territorial space planning.

5. Conclusions

This paper selected the UCC as a new study area from the view of the PLES, based on the leading function of land use and the situation of the study area. The PLESs were divided into four types: EPS, PES, LPS, and ES. Based on the LER assessment method, we established the LUCs model to analyze the spatial relationship and potential risk of LUCs in the past 20 years. The LUCs in the study area were divided into four degrees: stable controllable, basic controllable, basic out-of-control, and serious out-of-control. The conclusions are as follows:
(1) The land-use types in the UCC were divided into four spatial types. From 2000 to 2020, the PES was in the dominant position in the study area, followed by EPS, LPS, and ES. The rate and transfer intensity of LPS was highest among the spaces. It showed that during the process of rapid urbanization, the LPS mainly eroded the PES and EPS.
(2) The average conflict level of the UCC increased over the past 20 years. It poses a serious threat to the ecological environment of Chongqing. In the process of rapid urbanization, the area of basic and serious out-of-control zones increased and occupied almost 56%, while the area of stable and basic controllable decreased. The mutual occupation between the production, living, and ecological land made the LUCs and the man-land relations become increasingly tense.
(3) LUCs typically occur in specific areas. The population agglomeration and regional economic development positioning will cause conflicts to become out of control. The out-of-control conflict zones are gathered in concentrated areas of social and economic activities, due to the complex social and economic activities and convenient transportation facilities. The controllable conflict zones were gathered in high-altitude forest areas. These areas were typically hilly and mountains with remote geographical location, and the economy was relatively backward.
(4) The UCC faced the potential risk of the LUCs, but not seriously. The zones of low potential conflict, general potential conflict, high potential conflict, and extreme potential conflict account for 43.43%, 32.27%, 17.37%, and 6.93% in 2000, and 41.5%, 33.2%, 16.22%, and 9.08% in 2020. The areas of high and extreme potential conflicts were increased. The hot spots for LUCs’ potential distribution were concentrated in the western and northern areas of the study area, especially in the north of Yubei District and the junction of Shapingba District and Beibei District.

Author Contributions

The co-authors together contributed to the completion of this article. Specifically, their individual contributions are as follows: conceptualization, T.L. and P.D.; software, P.D., Y.S. and F.Y.; methodology, T.L., P.D. and Y.S.; validation, T.L. and F.Y.; formal analysis, T.L. and P.D.; resources, T.L.; data curation, P.D. and Y.S.; writing—original draft preparation, T.L., P.D. and Y.S.; writing—review and editing, T.L., F.Y., Y.L. and Y.W.; visualization, T.L., F.Y. and P.D.; supervision, T.L., F.Y., Y.L. and C.W. All authors have read and agreed to the published version of the manuscript.

Funding

This research was funded by the Key Program of the National Social Science Foundation of China (Grant No. 20&ZD095), the Science and Technology Research project of Chongqing Education Commission (Grant No. KJQN202102103), the Humanities and Social Sciences Research Project of Chongqing Education Commission (Grant No. 21SKGH308), the Chongqing Social Science Planning Social Organization Project (Grant No. 2021SZ26), and the National Social Science Youth Foundation of China (Grant No. 18CJL031).

Institutional Review Board Statement

Not applicable.

Informed Consent Statement

Not applicable.

Data Availability Statement

The data presented in this study are available on request from the author.

Conflicts of Interest

The authors declare no conflict of interest.

References

  1. Song, J.; Meng, J.; Zhu, L.; Cheng, H. Spatial-temporal pattern of land use conflict in China and its multilevel driving mechanisms. Sci. Total Environ. 2021, 801, 149697. [Google Scholar]
  2. Zou, L.; Liu, Y.; Wang, J.; Yang, Y.; Wang, Y. Land use conflict identification and sustainable development scenario simulation on China’s southern cost. J. Clean. Prod. 2019, 238, 117899. [Google Scholar] [CrossRef]
  3. Zhen, Y.; Jian, C.; Ting, W.; Tao, S. Promoting industrialization development by urbanization-reflection and analysis of urban industrialization road based on Shunde. Adv. Geogr. Sci. 2013, 32, 1814–1824. [Google Scholar]
  4. Hui, E.C.M.; Bao, H. The logic behind conflicts in land acquisitions in contemporary China: A framework based upon game theory. Land Use Policy 2013, 30, 373–380. [Google Scholar] [CrossRef]
  5. Hui, T.; Jia, L.; Kui, L.; He, Z. Study on Spatial Division of Tourism Urbanization Area Based on the Concept of PLE space—A Case Study of Mayangxi Eco-tourism Area. Humanist. R. 2016, 31, 153–160. [Google Scholar]
  6. Song, J.; Meng, J.; Zhu, L. Spatial and temporal analyses of potential land use conflict under the constraints of water resources in the middle reaches of the Heihe River. Land Use Policy 2020, 97, 104773. [Google Scholar]
  7. Zong, S.; Hu, Y.; Zhang, Y.; Wang, W. Identification of land use conflicts in China’s coastal zones: From the perspective of ecological security. Ocean Coast. Manag. 2021, 213, 105841. [Google Scholar]
  8. Li, S.; Zhu, C.; Lin, Y.; Dong, B.; Chen, B.; Si, B.; Li, Y.; Deng, X.; Gan, M.; Zhang, J.; et al. Conflicts between agricultural and ecological functions and their driving mechanisms in agroforestry ecotone areas from the perspective of land use functions. J. Clean. Prod. 2021, 317, 128453. [Google Scholar]
  9. Zou, L.; Liu, Y.; Wang, Y. Research progress and prospect of land-use conflicts in China. Prog. Geogr. 2020, 39, 298–309. [Google Scholar] [CrossRef]
  10. Zhu, C.; Xiang, F.; Zhi, H.; Bin, M.; Yi, L. Study on spatial conflict risk assessment and zoning optimization of land use in Nanchang city. World Geogr. Res. 2021, 30, 533–545. [Google Scholar]
  11. Dong, G.; Ge, Y.; Jia, H.; Sun, C.; Pan, S. Land Use Multi-Suitability, Land Resource Scarcity and Diversity of Human Needs: A New Framework for Land Use Conflict Identification. Land 2021, 10, 1003. [Google Scholar]
  12. Vonderdunk, A.; Gretregamey, A.; Dalang, T.; Hersperger, A.M. Defining a typology of peri-urban land-use conflicts: A case study from Switzerland. Landsc. Urban Plan. 2011, 101, 149–156. [Google Scholar] [CrossRef]
  13. Liu, D.; Ma, X.; Gong, J.; Li, H. Functional identification and spatio-temporal pattern analysis of production-living-ecological space in watershed scale: A case study of Bailongjiang Watershed in Gansu. Chin. J. Ecol. 2018, 37, 1490–1497. [Google Scholar]
  14. Mannarini, T.; Roccato, M.; Russo, S. The false consensus effect: A trigger of radicalization in locally unwanted land uses conflicts? J. Environ. Psychol. 2015, 42, 76–81. [Google Scholar]
  15. Zhao, X.; Tang, F.; Zhang, P.T.; Hu, B.Y.; Xu, L. Dynamic simulation and characteristics analysis of county production-life-ecological space conflict based on CLUE-S model. Acta Ecol. Sin. 2019, 39, 5897–5908. [Google Scholar]
  16. Wang, J.; Yu, D.; Lu, Y.; Zhang, T.; Zheng, Y. Recognition and analysis of land use conflicts at county level based on “Production-Living-Ecological” suitability. J. Nat. Resour. 2021, 36, 1238–1251. [Google Scholar]
  17. Bao, W.; Yang, Y.; Zou, L. How to reconcile land use conflicts in mega urban agglomeration? A scene-based study in the Beijing-Tianjin-Hebei region, China. J. Environ. Manag. 2021, 296, 113168. [Google Scholar]
  18. Reyes-Garcia, V.; Orta-Martinez, M.; Gueze, M.; Luz, A.C.; Paneque-Galvez, J.; Macia, M.J.; Pino, J.; Taps, B.S.T. Does participatory mapping increase conflicts? A random evaluation in the Bolivian Amazon. Appl. Geogr. 2012, 34, 650–658. [Google Scholar]
  19. Lin, G.; Jiang, D.; Fu, J. Spatial conflict of production-living-ecological space and sustainable-development scenario simulation in Yangtze River Delta agglomerations. Sustainability 2020, 12, 2175. [Google Scholar]
  20. Ma, X.; Tang, J. A review of the research on land use conflict in coastal zones based on CiteSpace atlas analysis. Urban Plan. Des. 2017, 11, 42–50. [Google Scholar]
  21. Zhou, D.; Lin, Z.; Lim, S.H. Spatial characters and risk factor identification for land use spatial conflicts in a rapid urbanization region in China. Environ. Monit. Assess. 2019, 191, 677. [Google Scholar] [PubMed]
  22. Calvert, K.; Mabee, W. More solar farms or more bioenergy crops? Mapping and assessing potential land-use conflicts among renewable energy technologies in eastern Ontario, Canada. Appl. Geogr. 2015, 56, 209–221. [Google Scholar]
  23. Brown, G.; Raymond, C.M. Methods for identifying land use conflict potential using participatory mapping. Landsc. Urban Plan. 2014, 122, 196–208. [Google Scholar]
  24. De Groot, R. Function-analysis and evaluation as a tool to assess land use conflicts in planning for sustainable, multi-functional landscapes. Landsc. Urban Plan. 2006, 75, 175–186. [Google Scholar]
  25. Torre, A.; Melot, R.; Magsi, H.; Bossuet, L.; Cadoret, A.; Caron, A.; Darly, S.; Jeanneaux, P.; Kirat, T.; Pham, H.V.; et al. Identifying and measuring land-use and proximity conflicts: Methods and identification. SpringerPlus 2014, 3, 85. [Google Scholar]
  26. Adam, Y.O.; Pretzsch, J.; Darr, D. Land use conflicts in central Sudan: Perception and local coping mechanisms. Land Use Policy 2015, 42, 1–6. [Google Scholar] [CrossRef]
  27. Reuveny, R.; Maxwell, J.W.; Davis, J. On conflict over natural resources. Ecol. Econ. 2011, 70, 698–712. [Google Scholar]
  28. Karimi, A.; Brown, G. Assessing multiple approaches for modelling land-use conflict potential from participatory mapping data. Land Use Policy 2017, 67, 253–267. [Google Scholar]
  29. Zou, L.; Liu, Y.; Wang, J.; Yang, Y. An analysis of land use conflict potents based on ecological-production-living function in the southern coastal area of China. Ecol. Indic. 2021, 122, 107297. [Google Scholar]
  30. Lin, G.; Fu, J.; Jiang, D. Production–Living–Ecological Conflict Identification Using a Multiscale Integration Model Based on Spatial Suitability Analysis and Sustainable Development Evaluation: A Case Study of Ningbo, China. Land 2021, 10, 383. [Google Scholar]
  31. Gao, Y.; Wang, J.; Zhang, M.; Li, S. Measurement and prediction of land use conflict in an opencast mining area. Resour. Policy 2021, 71, 101999. [Google Scholar]
  32. Li, Y.; Liu, C.; Li, Y. Identification of Urban Functional Areas and Their Mixing Degree Using Point of Interest Analyses. Land 2022, 11, 996. [Google Scholar]
  33. Yan, H.; Cheng, T.; Guo, Z.; Sheng, H.; Yong, Q.; Liang, S.; Hao, Z. Spatial Conflict Measurement in Rapid Urbanization Areas Based on Geographical Perspective—A Case Study of Changsha-Zhuzhou-Xiangtan Urban Agglomeration. Nat. J. Resour. 2014, 29, 1660–1674. [Google Scholar]
  34. Li, X.W.; Fang, C.L.; Huang, J.C.; Mao, H.Y. The urban land use transformations and associated effects on eco-environment in northwest China arid region: A case study in Hexi Region, Gansu Province. Quat. Sci. 2003, 23, 280–290. [Google Scholar]
  35. Cui, J.; Zang, S.Y. Regional disparities of land use changes and their eco-environmental effects in Harbin-Daqing-Qiqihar Industrial Corridor. Geogr. Res. 2013, 32, 848–856. [Google Scholar]
  36. Yang, Q.K.; Duan, X.J.; Wang, L.; Jin, J.Y. Land Use Transformation Based on Ecological-production-living Spaces and Associated Eco-environment Effects:A Case Study in the Yangtze River Delta. Sci. Geogr. Sin. 2018, 38, 97–106. [Google Scholar]
  37. Li, L.; Wen, D.; Juan, C.; Juan, C.; Wan, H.; Fang, J.; Qiu, H. Analysis of spatial conflict of “production-life-ecological” in the process of rapid urbanization in Pingtan island. Sci. Resour. 2017, 39, 1823–1833. [Google Scholar]
  38. Hong, Z.; Erqi, X.; Hui, Z. Classification and spatial pattern of ““production-life-ecological” land use” in China. J. Resour. Sci. 2015, 37, 1332–1338. [Google Scholar]
  39. Zhu, C.; Xiang, F.; Xiao, W. Analysis of landscape pattern changes around expressways in Wuhan based on LUCC. Soil Bull. 2019, 50, 35–44. [Google Scholar]
  40. Jia, P.; Guo, Z.; Cheng, T.; Yan, H. Spatial Conflict Measurement in Rapid Urbanization Areas Based on Ecological Security—A Case Study of Changsha-Zhuzhou-Xiangtan Urban Agglomeration. Nat. J. Resour. 2012, 27, 1507–1519. [Google Scholar]
  41. Xiao, C.; Xiao, L.; Peng, W.; Fu, K. Study on Ecological Risk of Spatial Conflict of Ecological Migrants in Arid Area—A Case Study of Hongsibu District, Ningxia. Hum. Geogr. 2018, 33, 106–113. [Google Scholar]
  42. Lovell, S.T.; DeSantis, S.; Nathan, C.A.; Olson, M.B.; Me’ndez, V.E.; Kominami, H.C.; Erickson, D.L.; Morris, K.S.; William, B. Morris Integrating agroecological and landscape multifunctionality in Vermont: An evolving framework to evaluate the design of agroecosystems. Agric. Syst. 2010, 103, 327–341. [Google Scholar]
  43. Qiu, G.; Wang, Y.; Guo, S.; Niu, Q.; Qin, L.; Zhu, D.; Gong, Y. Assessment and Spatial-Temporal Evolution Analysis of Land Use Conflict with Urban Spatial Zone: Case of the Su-Xi-Chang Region. Sustainability 2022, 14, 2286. [Google Scholar] [CrossRef]
  44. Jing, W.; Yu, K.; Wu, L.; Luo, P. Potential Land Use Conflict Identification Based on Improved Multi-Objective Suitability Evaluation. Remote Sens. 2021, 13, 2416. [Google Scholar]
  45. Adams, W.M.; Brockington, D.; Dyson, J.; Vira, B. Managing tragedies: Understanding conflict over common pool resources. Science 2003, 302, 1915–1916. [Google Scholar] [PubMed]
  46. Zhou, D.; Xu, J.; Lin, Z. Conflict or coordination? Assessing land use multi-functionalization using production-living-ecology analysis. Sci. Total Environ. 2017, 577, 136–147. [Google Scholar] [PubMed]
  47. Cheng, Z.; Zhang, Y.; Wang, L.; Wei, L.; Wu, X. An Analysis of Land-Use Conflict Potential Based on the Perspective of Production–Living–Ecological Function. Sustainability 2022, 14, 5936. [Google Scholar]
  48. Li, G.; Fang, C.; Wang, S. Exploring spatiotemporal changes in ecosystem-service values and hotspots in China. Sci. Total Environ. 2016, 545–546, 609–620. [Google Scholar]
  49. Getis, A.; Ord, K. The Analysis of Spatial Association by Use of Distance Statistics. Geogr. Anal. 1992, 24, 189–206. [Google Scholar]
  50. Moran, P.A.P. Notes on continuous stochastic phenomena. Biometrika 1950, 37, 17–23. [Google Scholar] [CrossRef]
  51. Ord, J.K.; Getis, A. Local Spatial Autocorrelation Statistics: Distributed Issues and an Application. Geogr. Anal. 1995, 27, 286–306. [Google Scholar] [CrossRef]
  52. Ho, P. The ‘credibility thesis’ and its application to property rights: (in) secure land tenure, conflict and social welfare in China. Land Use Policy 2014, 40, 13–27. [Google Scholar]
  53. Yu, A.T.W.; Wu, Y.Z.; Shen, J.H.; Zhang, X.L.; Shen, L.Y.; Shan, L.P. The key causes of urban–rural conflict in China. Habitat Int. 2015, 49, 65–73. [Google Scholar]
  54. Ide, T.; Frohlich, C. Socio-environmental cooperation and conflict? A discursive understanding and its application to the case of Israel and Palestine. Earth Syst. Dyn. 2015, 6, 659–671. [Google Scholar]
  55. Zhou, X.; Lu, X.; Lian, H.; Chen, Y.; Wu, Y. Construction of a spatial planning system at city-level: Case study of “integration of multi-planning” in Yulin City, China. Habitat Int. 2017, 65, 32–48. [Google Scholar]
  56. Scherwitz, E. The EU’s approach towards Asia: Regional cooperation and regional conflicts in the past and today. Asia Eur. J. 2016, 14, 367–382. [Google Scholar]
  57. Shen, H.J.; Li, X.; Luo, J.M.; Chau, K.Y. One country, two strata: Implications of social and cultural conflicts of Chinese outbound tourism to Hong Kong. J. Destin. Mark. Manag. 2017, 6, 166–169. [Google Scholar] [CrossRef]
  58. Yu, B.; Lv, C.H. The progress and prospect of land use conflicts. Prog. Geogr. 2006, 25, 106–115. [Google Scholar]
  59. Wang, J.Y.; Zou, L.L.; Li, M.G. Identification and governance of potential land use conflicts in tourist resorts based on “Production–Living–Ecological” suitability. Trans. CSAE 2019, 35, 279–288. [Google Scholar]
Figure 1. Location of the study area.
Land 11 01415 g001
Figure 2. Conceptual framework of coupled LUCs and LER assessment.
Land 11 01415 g002
Figure 3. Spatial-temporal evolution of the PLES from 2000 to 2020.
Land 11 01415 g003
Figure 4. Sangji map of the PLES transfer from 2000 to 2020.
Land 11 01415 g004
Figure 5. Spatial-temporal distribution characteristics of the LUCs from 2000 to 2020.
Land 11 01415 g005
Figure 6. The evolution characteristics of the PLES in the LUCs zone from 2000 to 2020.
Land 11 01415 g006
Figure 7. The cold- and hot-spot analysis of LUCs in the study area.
Land 11 01415 g007
Figure 8. The potential risk of LUCs in the study area.
Land 11 01415 g008
Figure 9. The cold- and hot-spot analysis of PLUCRI in the study area.
Land 11 01415 g009
Table 1. The PLES classification system.
The PLES TypesMeaningLand-Use TypeClassification Basis
Living–production space
(LPS)
Meets the needs of human life and entertainment, and contains the highest economic value.Urban,
other construction lands, rural residential land.
Mainly refers to cities and towns and other places where human beings live, which are important places to live and rest.
Production–ecological space
(PES)
It is mainly used for agricultural production functions and has ecological functions at the same time.Cultivated land, orchard.Other gardens and orchards are important garden land with ecological functions. Drylands and paddy fields are important agricultural lands, both of which have dual functions of ecological and production.
Ecological–production space
(EPS)
Has ecological and production functions, and the main function is ecological.Forest,
shrub forest,
sparse woodland,
other woodlands, reservoir pond.
Shrub forest, other forest land, and forested land play an essential role in regulating climate and environment, their ecological functions are beyond doubt, and they can also provide wood. Reservoir pits and ponds have the function of maintaining water source, and also have production functions such as aquaculture.
Ecological space
(ES)
Most of them have ecological functions such as regulating the atmosphere, conserving water source, water and soil conservation, etc., but do not have a production function.High–coverage grassland, medium–coverage grassland,
low–coverage grassland, river, lakes, bare land,
bottomland.
Grasslands with low, medium, and high coverage have ecological values such as regulating climate, conserving water and soil, and conserving water resources. Rivers, lakes, beaches, and swamps have the functions of water conservation and climate regulation, and belong to the ecological land. Bare land has high vegetation coverage and ecological landscape effect, which belongs to ecological function.
Table 2. The area ratio of the PLES in the UCC from 2000 to 2020.
YearPESEPSLPSES
Area
(km2)
RatioArea
(km2)
RatioArea
(km2)
RatioArea
(km2)
Ratio
20003921.6371.77%1091.7219.98%265.004.85%186.073.41%
20103653.0766.85%1089.2619.93%533.169.76%189.103.46%
20203250.2859.48%1084.9119.85%938.6817.18%190.713.49%
Table 3. Spatial transfer matrix of the PLES in the study area from 2000 to 2010 (unit: km2).
2000–2010PESLPSESEPSTransfer-OutVariation
PES0.00253.708.8224.927.33%−268.66
LPS2.020.000.370.411.06%268.15
ES1.040.340.005.563.73%3.02
EPS15.7216.910.770.003.06%−2.51
Transfer-in0.51%50.82%1.87%2.84%
LCDIi−0.68%10.12%0.16%−0.02%
BLCDIi0.78%10.33%0.91%0.59%
Table 4. Spatial transfer matrix of the PLES in the study area from 2010 to 2020 (unit: km2).
2010–2020PESLPSESEPSTransfer-OutVariation
PES0.00396.375.3355.2512.51%−402.78
LPS9.760.001.802.222.58%405.51
ES4.842.480.001.234.52%1.62
EPS39.5720.443.040.005.79%−4.35
Transfer-in1.67%44.67%5.33%5.41%
LCDIi−1.10%7.61%0.09%−0.04%
BLCDIi1.40%8.12%0.99%1.12%
Table 5. Land-use conflicts level in the study area from 2000 to 2020.
Conflict LevelConflict ValueNumber of Spatial UnitsPercentage of Space Units (%)
200020102020200020102020
Stable control0.0–0.352724246.806.056.03
Basic control0.35–0.722620315256.9351.1338.44
Basic out-of-control0.7–0.913515918734.0140.0546.98
Serious out-of-control0.9–1.0911342.272.778.54
The average conflict value0.620.640.69——————
Table 6. The area ratio statistics of LUCs zones from 2000 to 2020.
Conflict ZoneArea Ratio (%)PLESArea Ratio (%)Variation
200020102020200020102020
Stable
controllable Zone
1.230.970.89EPS47.5548.2250.993.44
ES4.675.976.481.81
LPS0.751.872.621.87
PES47.0343.9339.90−7.13
Basic
controllable Zone
57.5450.1735.85EPS16.7916.6416.900.11
ES3.223.764.521.3
LPS1.346.0812.0910.75
PES78.6573.5166.49−12.16
Basic out-of-control zone38.6145.6553.31EPS23.4523.3621.85−1.6
ES3.783.233.04−0.74
LPS9.9912.6919.029.03
PES62.7860.7156.09−6.69
Serious out-of-control zone2.623.229.95EPS26.1214.4917.24−8.88
ES1.341.251.870.53
LPS7.8827.5426.788.90
PES64.6656.7254.11−10.55
Publisher’s Note: MDPI stays neutral with regard to jurisdictional claims in published maps and institutional affiliations.

