Abstract
Urban construction land has an increasing impact on ecological carbon storage capacity and carbon emissions. Based on the theoretical analysis framework and the panel data of 278 prefecture-level cities in China from 2000 to 2019, this paper analyzes the impact of changes in urban construction land on carbon dioxide emissions. Our results suggest that the increase in urban construction land significantly promotes carbon dioxide emissions, and this conclusion still holds after selecting geographic and historical data as instrumental variables and conducting a series of robustness tests. Importantly, the newly added construction land and industrial land are important sources of increased carbon dioxide emissions, and there exist heterogenous impacts of the urban construction land on carbon emissions across different geographical distributions and different urban sizes. In addition, the results of the quantile regression show that, as the quantile level increases, the impact of changes in urban construction land on urban carbon emissions shows an inverted U-shaped trend that first increases and then decreases. Thus, our results provide evidence for promoting the coordinated development of land transaction marketization and low-carbon urban construction.
1. Introduction
With the continuous advancement in urbanization, a large amount of cultivated land, forest land and wetlands are converted into construction land, which has a significant impact on ecological variables and climate change while reducing the carbon storage capacity of the ecosystem. Obviously, changes in types of land use are the main cause of changes in carbon storage in terrestrial ecosystems [1,2,3,4]. Studies pointed out that interactions between climate and land use explained, on average, 54% of the variation in species richness, species composition and ecosystem functions, whereas only 30% of the variation was related to single drivers, indicating that changes in land use have a huge impact on ecological outcomes. However, humans change land types and land uses frequently. Compared with the process and mechanism of carbon emissions from natural ecosystems, the inherent mechanism of land use leading to greenhouse gas emissions is more complex, with more uncertain factors and more diverse spatial characteristics [5,6]. Therefore, based on comprehensively accounting for the carbon emissions generated by land use and in-depth analysis of its internal mechanism, carrying out low-carbon goal-oriented land use optimization and regulation has become a major strategic demand for countries around the world to implement a low-carbon economy and achieve sustainable development in the context of global climate change.
A large number of studies have shown that the factors affecting urban carbon dioxide emissions are diverse. First, there is no doubt about the impact of economic factors on carbon emissions, which include economic growth [7,8], energy consumption [9], population agglomeration [10], industrial adjustment [11], import and export [12], technological innovation [13] and digital economy [14]. Second, financial factors can also cause carbon emissions, including green finance [15,16,17], digital finance [18], land finance [19] and carbon finance [20]. Third, the regulatory tools against carbon emissions and environmental pollution have been proven to be effective in curbing carbon emissions. These regulatory tools include environmental regulatory tools [21], low-carbon pilot policies [22] and carbon taxes [23]. Although the existing research has focused on many factors affecting carbon emissions, there are few studies discussing the impact of changes in land use on carbon emissions. In particular, the change in urban construction land is difficult to reflect the evolution of its internal structure from the urban area, and it is not easy to identify the impact of changes in urban construction land on carbon emissions. However, these studies provide the basis for the introduction of many control variables for the empirical evidence of our study.
Carbon emissions related to land use change include direct carbon emissions caused by land use change processes and indirect carbon emissions caused by human activities. Among them, direct carbon emissions refer to carbon emissions caused by changes in land use and land management forms, and indirect carbon emissions include carbon emissions from energy consumption for production activities in industrial and mining lands, emissions from transportation vehicles and emissions from heating in residential areas. However, Barnett et al. [24] pointed out that, during the past 20 years, about a quarter of anthropogenic CO2 emissions were caused by changes in types of land use (especially deforestation), and the rest is mainly caused by the burning of fossil fuels. On the one hand, studies on the direct relationship between land use and carbon emissions show that plant biomass and vegetation carbon storage are affected by activities such as forest harvesting and afforestation, and the major land-use conversion types, such as urban land expansion and internal conversion of agricultural land, generate carbon emissions that are the focus of attention [25,26,27]. In addition, the carbon emissions from changes in land management mainly refer to the carbon emissions driven by changes in specific types of land use (focusing on agricultural land) [28,29,30,31]. Since different land use types undertake their own corresponding management activities, the internal mechanisms of carbon emissions are quite different. On the other hand, studies on the indirect relationship between land use and carbon emissions show that, with the expansion of the city scale, the industry and population scale it carries also significantly increase. Due to the high proportion of secondary industry in China’s current industrial structure, there is still much room for improvement in energy utilization efficiency, resulting in huge carbon emissions from energy consumption, industrial production and waste disposal [32,33,34,35]. Although existing studies describe the relationship between land change and carbon emissions, they still fail to identify the relationship between changes in urban construction land and carbon emissions. In particular, the heterogenous impact of different types of construction land on carbon emissions still needs to be assessed by in-depth analysis.
In our study, combined with the unique attributes of urban construction land, a theoretical analysis framework for studying the impact of changes in urban construction land on carbon dioxide emissions is constructed. On this basis, more than 2.5 million land transfer data in the China land market from 2000 to 2019 were integrated to measure the changes in construction land in prefecture-level cities in China and matched with urban carbon emission data and control variables. Therefore, based on the panel data of 278 prefecture-level cities in China from 2000 to 2019, a variety of econometrics methods are used to empirically test the impact of changes in urban construction land on carbon dioxide emissions. In addition, the differences in the impact of urban construction land changes on urban carbon emissions across different land sources and types of land use are analyzed. We also analyze the heterogenous impact of changes in urban construction land on carbon dioxide emissions from three aspects, which are the heterogeneity of geographical distribution, the heterogeneity of low-carbon pilot cities and the heterogeneity of urban sizes.
The contribution of this study lies in the following three aspects. First, we conduct a more comprehensive measurement of changes in construction land and carbon dioxide emissions at the city level, which enables us to discuss the relationship between the two from a more microscopic perspective. Second, based on the theoretical framework, this paper deeply analyzes how changes in urban construction land affect the path of carbon dioxide emissions from the perspectives of land sources and types of land use, which provides first-hand evidence for improving the quality of urban land, reducing carbon emissions and realizing low-carbon transition of cities. Third, this paper uses the panel data of 278 prefecture-level cities in China from 2000 to 2019, which are obtained by cleaning, matching and integrating the GoeTiff data of 1 km × 1 km resolution provided on the Center for Global Environmental Research website and a total of 2,502,287 land transactions data extracted from the China Land Market website. Compared with previous studies, using the integrated data can more accurately measure the regional differences of construction land changes and reduce the estimation bias caused by the small changes in traditional regional spatial indicators.
The rest of this paper is organized as follows. Section 2 presents a theoretical analysis and the hypotheses proposed. Section 3 focuses on the model specification and data sources. Section 4 interprets and discusses the empirical results of the benchmark model estimation of the effect of changes in urban construction land on carbon emissions. Section 5 further conducts the mechanism test regarding heterogeneous effects and the marginal effect test. Section 6 presents the conclusions.
2. Theoretical Analysis and Hypothesis Formulation
Changes in land use caused by human activities are the core driving force behind changes in carbon storage in terrestrial ecosystems [36,37,38]. In general, there are large differences in carbon emissions across types of land use. The types of land whose carbon emissions are less than carbon absorption mainly include wetlands, forest and undeveloped land, while the types of land whose carbon emissions are larger than carbon absorption mainly include cultivated land, grassland and construction land. Among them, the conversion of agricultural land, such as cultivated land, into other types of land use, such as construction land, has a huge impact on carbon emissions. First, this conversion can alter vegetation cover and thus directly affect vegetation biomass. For instance, a change from forest land to other land types, especially to construction land, would greatly reduce vegetation biomass and release carbon into the atmosphere [26,39]. Second, changes in land use would also have a huge impact on soil organic carbon [27]. Third, changes in land use indirectly generate economic activities and increase carbon emissions. In the context of traditional decentralization and regional competition, local governments may prefer to transfer industrial land by agreement, but their industrial land supply behavior has exacerbated industrial pollution emissions [34]. With advancement in urbanization, more and more cultivated land, forest and grassland are converted into construction land, and a large amount of carbon is released into the atmosphere, which leads to the conversion of land area from carbon sink to carbon source. Therefore, we propose the following hypothesis.
Hypothesis 1.
Urban construction land has a positive impact on carbon dioxide emissions.
In the initial construction stage of a small city, the land was extensively used mainly by converting agricultural land into land for secondary industry. The land use structure under this land use configuration model leads to extensive industrial development, which brings adverse consequences to the ecological environment system, including high energy consumption, low energy use efficiency and emissions of waste gas and wastewater [40]. At this stage, the reconfiguration of the urban land use structure forms the primary industry structure, as well as the energy consumption structure with high energy consumption, low energy efficiency and heavy pollution [41,42]. At the same time, the output per unit of land is not high at this stage, economic development is at the expense of excessive resource consumption, energy utilization efficiency is also low and a large amount of waste gas and wastewater would be released during industrial production [43]. The high energy consumption and low energy utilization efficiency of the production process would lead to an increase in carbon emissions per unit of land. However, when the scale of cities continues to expand and economic development has transitioned to the stage of high-quality land use, a large amount of agricultural land is mainly converted into tertiary industry land or high-tech industrial land, and even industrial land is converted into green land. The land use structure has changed from a low-efficiency use form to a high-efficiency use form [44]. The optimization of the land use structure can promote the advanced industrial structure and the clean energy consumption structure [45]. Advanced industrial structure and clean energy consumption structure can also reduce the negative impact of the production process and land use on carbon emissions [42,46]. This negative impact is reflected in two aspects: first, the optimization of the land use structure affects carbon emissions through structural effects; that is, the optimization of the land use structure forces a reduction in industries with high energy consumption and heavy pollution, and the degree of interference of human activities on carbon emissions is reduced. Second, the optimization of the land use structure affects carbon emissions through technological spillover effects. The development of high-end industries promotes technological progress, which leads to improving energy efficiency [41,47]. Therefore, we propose the following hypothesis.
Hypothesis 2.
There exists a heterogeneous impact of changes in urban construction land on carbon emissions across different city sizes.
When analyzing the impact of land use on carbon emissions, the existing literature often ignores the important mechanism that land use regulatory policies can effectively control and guide human activities to promote carbon emissions reductions [3,30]. It is self-evident that urban construction can optimize the realization of carbon emissions reduction and low-carbon development by improving the quality of land use [31]. Specifically, urban construction has a high demand for overall planning, and policy systems, such as land property rights, land allocation and land resource management, affect the types of land use and land supply. Therefore, the optimization of land use structure can usually maintain a high-efficiency allocation, which requires the support of a high-level urban economic foundation, and urban construction land would have a greater impact on the growth of carbon dioxide. Similarly, cities that are constantly adjusting their land use need to promote the optimization of land use through continuous rational planning. Combined with relevant policies for environmental protection and industrial upgrading, improvements in land use structure, land use intensity and efficiency would affect carbon emissions. Therefore, we propose the following hypothesis.
Hypothesis 3.
There is a nonlinear change in the impact of changes in urban construction land on carbon dioxide emissions. As the maturity of the land market improves, the effect shows the tendency to increase at the beginning and decline late.
3. Methodology and Data
3.1. Model Specification
Based on Carlino and Kerr [48], we constructed the following model to analyze the effect of changes in urban construction land on carbon emissions.
where subscripts c and t represent the city and year, respectively; and represents the CO2 emission level of city c in year t. represents the change level of urban construction land in city c in year t. A set of city level control variables () are introduced into Equation (1), which are the GDP per capita (), the proportion of non-agricultural population to total urban population (), the proportion of the added value of the secondary industry to GDP (), the sum of green invention patents and green utility model patents () and the intensity of environmental regulation (), whose calculation can be found in Section 3.2.3. and are city fixed-effect and year fixed-effect, respectively. The standard errors of the estimated regression coefficients are clustered at the city level. represents the random error term, and is the main parameters to be estimated.
3.2. Variables and Measurement
3.2.1. Measurement of Urban Carbon Dioxide Emissions
Subject to the availability of data and the simplicity and effectiveness of the carbon emission factor method, only the carbon emission data at the provincial level can be obtained accurately and comprehensively. Therefore, the acquisition of carbon emission data at the city level, county level and even township level cannot be calculated by using the carbon emission factor method. Some scholars have tried to use nighttime light data for inverse modeling of the carbon footprint of municipalities or below [49]. However, this method relies too much on light data and their correlation with carbon dioxide emissions, and the inherent defects of light data themselves (oversaturation, background noise and discontinuity, etc.) prevent this method from being widely used. Nonetheless, this provides an efficient method for spatially disaggregating carbon emissions data.
According to the practice of Oda et al. [50], based on the 1 km × 1 km-resolution GoeTiff data provided on the Center for Global Environmental Research website from January 2000 to December 2019, ArcGIS was used to crop, synthesize and extract the data and, finally, summarize the annual panel data of carbon emissions at the city level in China. The unit is tons per square kilometer. In addition, the panel data of carbon dioxide emissions in various counties (districts) in China can also be obtained through regional and county aggregation, which provides a data basis for further micro-empirical testing. After taking the natural logarithm, the core explanatory variable (lnCO2) is obtained.
3.2.2. Measurement of Changes in Urban Construction Land
Existing studies believe that, due to the slow development of indicators, such as urban topography and landform indicators and spatial structure indicators, the variation in variables over time may be small [51]. Traditional indicators representing urban land are limited in their ability to reflect the internal changes in urban construction; Harari [52] also faced a similar situation when studying urban landform.
In this regard, this paper summarizes the land transfer data in China from 2000 to 2019. By crawling a total of 2,502,287 land transactions, the data cover all the fields of the land transfer announcement details pages, where the main information includes the county (district) where the land is located, the project name, the land area, the transaction price and the agreed floor area ratio. The data cover 75 kinds of land uses, accounting for 99% of the total annual land transactions in China, and can generally reflect the objective situation of land. According to the Law of Land Administration of the P. R. China, the urban construction land can be divided into eight categories, namely residential land, land for administration and public service, land for commercial and business facilities, industrial land, land for logistics and warehouse, land for street and transportation, land for municipal utilities and green space.
Considering the problems of uneven raw data and abnormal individual values, this paper also carried out the following treatments. First, according to the 2020 National Statistical Division Code and Urban–Rural Division Code in China, the code of each city is confirmed. The city is jointly matched by using the first four digits of the electronic supervision number of each land transfer transaction, the name of the transaction location and the location of the project. Second, the date of signing the contract was used to determine the time when the land transaction occurred, and data that agreed to deliver the land earlier than the date of the contract were excluded. Third, we aggregated the micro-land data to the city level to obtain the indicator of changes in urban construction land. In addition, according to land sources and land usages, construction land indicators are disaggregated for mechanism testing. After taking the natural logarithm, the explained variable (lnland) is obtained.
3.2.3. Measurement of Control Variables
We avoided omitted variable bias to identify the impact of urban land use on carbon dioxide emissions. This paper controls the relevant influencing factors as much as possible at the city level. (1) The GDP per capita () at the city level is used to reflect the level of urban economic development. (2) The proportion of non-agricultural population to total urban population () is used to reflect the degree of urbanization. (3) The proportion of added value of the secondary industry to GDP () is used to reflect the level of urban industrial structure. (4) The sum of green invention patents and green utility model patents () is used to measure the level of urban green technology innovation and is added to 1 and then logarithmically processed. (5) The frequency of “environment” in the work report of the prefecture-level government is used to measure the intensity of environmental regulation (), which has been added by 1 and taken as a natural logarithm.
3.3. Data Sources
This paper uses the panel data of 278 prefecture-level cities in China from 2000 to 2019. The data are mainly from the China City Statistical Yearbook, China Urban Construction Statistical Yearbook and the statistical yearbooks of prefecture-level cities from 2000 to 2019. Due to the lack of data in specific cities and specific years, the study uses interpolation to supplement accordingly. The raster data for measuring carbon emissions come from the Center for Global Environmental Research website. The micro-data to measure the change in urban land use come from the China Land Market Network. The number of urban green patents granted comes from the Patent Search Database of the State Intellectual Property Office of China. The work report of the prefecture-level city government comes from a local government platform website. After data cleaning and matching over time, we obtain the panel dataset of 278 prefecture-level cities in China, which contains 4739 observations from 2000 to 2019. Descriptive statistics are summarized in Table 1.

Table 1.
Descriptive statistics.
Based on Table 1, the mean of urban carbon dioxide emissions (lnCO2) is 15.381, and the standard deviation of lnCO2 is 0.875, indicating that the urban carbon dioxide emission is relatively stable, and the sample shows that there are no abnormal values. Values of urban construction land (lnland) are from 0.02 to 10.943, which also indicates that there are large differences in urban construction land across cities. Due to the large differences in the level of urban construction land, it can avoid the inadequacy of empirical analysis caused by small changes in variables when using urban topography and landform indicators and spatial structure indicators.
4. Empirical Results
4.1. The Impact of Changes in Urban Construction Land on Urban Carbon Emissions
4.1.1. Estimation Results of The Baseline Model
The estimation results of the baseline model are reported in Table 2. Evidently, changes in urban construction land have a positive impact on carbon emissions. In column (1), only the city fixed-effect and the year fixed-effect are controlled in the baseline model without controlling for any other factors, and the coefficient of changes in construction land (lnland) is statistically significant and positive at the 1% level. We introduced a series of control variables to the baseline model to further confirm whether this positive relation is relatively robust. In column (2), the city-level characteristic variables are further controlled. Although the value of the coefficient of lnland is decreasing, the coefficient of lnland is still statistically significant and positive at the 1% level. Robust clustering, bootstrap sampling and GMM methods are used to further test the robustness of parameter estimation to avoid the problem of biased estimation caused by model selection. The results are shown in columns (3) to (5). The results showed that the significance of the parameter estimates was not found to change, and the conclusions remained the same as before.
Table 2.
The estimation results of the baseline models.
Considering the regression results in column (2), for every 1% increase in urban construction land area, carbon dioxide emissions would increase by 6.7%. The absolute value of the estimated coefficient of lnland is not large because the explained variable selected in this study is the carbon dioxide emissions monitored by urban satellites, and this indicator includes the carbon emissions of all activities in the region. However, the estimated coefficient is the average effect of urban construction land, so the absolute value of the estimated coefficient of lnland may be small. In general, the results of the benchmark regression estimation are consistent with Hypothesis 1. The more land there is for urban construction, the more the growth of the urban scale generates continuous enrichment of urban economic activities while reducing carbon storage. The diversity of urban industries has also been strengthened, which has a certain promotion effect on urban carbon dioxide emissions.
4.1.2. Regression Results of Instrumental Variable Analysis
We further alleviate the potential endogeneity problem by introducing instrumental variables. This paper uses two instrumental variables.
First, based on Ivus and Boland [53], the urban relief level (relief) is used as an instrumental variable for the scale of land transactions. Generally speaking, the greater the terrain relief, the greater the cost and difficulty of land construction, which reduces the transaction volume of urban construction land. Therefore, the terrain relief meets the correlation condition as an instrumental variable. At the same time, as a natural factor, terrain relief is not directly related to other economic variables, nor does it directly affect carbon dioxide emissions, so it satisfies the exogenous condition as an instrumental variable.
Second, based on Li and Du [54], the total number of telephones in each city in 1984 is used as an instrumental variable for land transactions. On the one hand, as the continuation of traditional communication technology, the telephone infrastructure in the local history would affect the application of network technology in the subsequent stages by influencing the technical level and usage habits, which is beneficial to the transactions of urban construction land. On the other hand, the impact of traditional telecommunication tools, such as landline telephones, on economic activities gradually diminishes as the frequency of use decreases. Therefore, the relationship between the number of telephones (1984) and carbon emissions satisfies exclusivity.
The regression results of the instrumental variable tests are shown in Table 3. Columns (1) and (3) report the estimation results of the first stage of the two-stage least squares method (2SLS). The coefficient of relief is statistically significant and negative at the 10% level, and the coefficient of number of telephones (1984) is statistically significant and positive at the 1% level. The F statistics of the first stage regression are 3.16 and 36.17, respectively, implying that these two instruments are highly correlated with endogenous explanatory variables. The estimation results of the second stage of 2SLS are reported in columns (2) and (4). The endogeneity test results show that the null hypothesis that the instrumental variables are not related to the random disturbance term of the model cannot be rejected. Statistically, the exclusivity of instrumental variables is satisfied. To sum up, even after considering the endogeneity, the positive relationship between changes in urban construction land and carbon dioxide emissions is still statistically significant.
Table 3.
The results of instrumental variable analysis.
4.2. Robustness Tests
4.2.1. The Lag Effect of Changes in Urban Construction Land
The adjustment of urban construction land is not an instantaneous activity. For the land obtained from the transaction, it would take some time for the progress of urban construction and the development of the functional level. In this paper, changes in urban construction land reflect long-term urban development, and carbon emissions reflect short-term behavior. When performing direct regression of changes in urban construction land on carbon emissions, there may still exist estimation bias. In order to further verify this point, the core explanatory variable has been lagged, and we analyzed the impact of the lagged changes in urban construction land on carbon emissions. According to column (1) of Table 4, the coefficient of L.lnland is statistically significant and positive at the 1% level, and there is no significant difference between the estimated coefficient and the estimated coefficient of lnland of the baseline model. The effect detected by estimation results of the baseline model may be closer to the effect caused by the difference between cities.
4.2.2. Replacing Explained Variable
The explained variable used in this paper is the urban carbon dioxide emissions calculated based on high spatial resolution grid data in China and other social and economic data. In reality, part of urban carbon dioxide emissions is generated by residents’ living activities, and the carbon emissions we are concerned about are generated during the consumption of fossil fuels. In this regard, the identification strategy of this paper may lead to a certain bias; that is, a large part of the urban carbon dioxide emissions measured in this paper may come from urban population expansion (natural expansion of land area). This challenges the hypothesis that changes in urban construction land lead to increased carbon emissions. Therefore, this paper attempts to start with the air pollution directly related to fossil fuels. Based on van Donkelaar [55], the Global/Regional Estimates (V5.GL.02) is used to calculate domestic urban PM2.5 to reflect the undesired output of energy use. Then, we re-estimate the baseline model, and the results are reported in column (2) of Table 4. The coefficient of lnland is still statistically significant and positive at the 1% level, which supports the basic conclusion that changes in urban construction land contribute to the increase in carbon dioxide emissions.
4.2.3. Excluding the Sub-Provincial Cities from the Sample
Considering that China’s sub-provincial cities expanded rapidly during the sample period, they were also taken care of by the government’s special urbanization policies, and these cities have a strong vertical trend, which may lead to identification bias. Such samples need to be excluded to ensure the accuracy of identifying the effects of urban construction land changes on carbon dioxide emissions. Therefore, this paper excludes all of these sub-provincial cities and re-estimates the baseline model. Column (3) of Table 4 reports the estimation results after excluding the sample of sub-provincial cities. The results show that the coefficient of lnland is statistically significant and positive at the 1% level, and the absolute value of the estimated coefficient has no significant change compared with estimation results of the baseline model, indicating that the exclusion of sub-provincial cities does not cause changes in the overall impact effect, and our main empirical results remain robust.
4.2.4. Considering Changes in the Economic Environment
Before the financial crisis in 2008, China’s economy was in a stage of rapid development, with a high degree of dependence on energy use and a high level of carbon dioxide emissions. At that time, the development of China’s real estate market was relatively stable, and the circulation of urban construction land was relatively slow. Since 2009, the adjustment of urban construction land has entered a stage of rapid development. In the estimation of the baseline model, considering the principle of sample completeness, we retain the samples before 2009. However, the structural adjustment of urban construction land may lead to underestimation of the effect of urban construction land changes on carbon dioxide emissions. Therefore, the samples before 2009 are excluded for the robustness test to alleviate the problem of estimation bias. According to column (4) of Table 4, the coefficient of lnland is still statistically significant and positive at the 1% level, but the absolute value of the estimated coefficient of lnland has become larger compared with the estimation results of the baseline model. This is due to the exclusion of samples before 2009, which reduces the dilution of the effects of the core explanatory variables in this paper. In general, the results further confirm the baseline regression results.
Table 4.
The results of robustness tests (1).
Table 4.
The results of robustness tests (1).
| Variables | (1) | (2) | (3) | (4) |
|---|---|---|---|---|
| Testing Lag Effect | Replacing Explained Variable | Excluding the Sub-Provincial Cities | Sample Period: 2009–2019 | |
| lnCO2 | lnPM2.5 | lnCO2 | lnCO2 | |
| L.lnland | 0.067 *** | - | - | - |
| (0.007) | ||||
| lnland | - | 0.100 *** | 0.066 *** | 0.147 *** |
| (0.007) | (0.007) | (0.013) | ||
| Constant | 12.452 *** | 16.241 *** | 12.852 *** | 12.249 *** |
| (0.200) | (0.209) | (0.202) | (0.253) | |
| Control variables | Yes | Yes | Yes | Yes |
| City FE | Yes | Yes | Yes | Yes |
| Year FE | Yes | Yes | Yes | Yes |
| Observations | 4406 | 4739 | 4445 | 3047 |
| R-square | 0.731 | 0.601 | 0.709 | 0.741 |
Note: (1) standard errors are in parentheses; (2) *** p < 0.01.
4.2.5. Re-Examination Based on County (District)-Level Data
In order to ensure the robustness of the estimation results of the baseline model, we re-examined the baseline model based on county (district)-level data. We integrated China’s land market data by county (district) and matched it with county (district)-level carbon emissions data while retaining urban characteristic variables, resulting in a sample of 22,060 county (district)-year observations. The estimation results are indicated in Table 5. According to column (1), the coefficient of lnland is statistically significant and positive at the 1% level, which is consistent with the conclusion drawn with industry-level data in the benchmark regression. When estimating column (2), we clustered at the county level, relaxing the assumption that the random error terms are independent and identically distributed. The coefficient of lnland is still statistically significant and positive at the 1% level, further confirming that our main empirical results remain robust.
Table 5.
The results of robustness tests (2).
5. Further Analysis
5.1. Mechanism Test
This section directly examines the difference in the impact of urban construction land changes on urban carbon emissions across different land sources and land uses.
First, it is tested whether changes in urban construction land from different sources would increase urban carbon emissions. According to the land sources of the land market, urban construction land is divided into newly added construction land (lnland1) and existing construction land (lnland2). The two variables are introduced into the baseline model simultaneously as explanatory variables for estimation. As shown in column (1) of Table 6, both changes in the newly added construction land and the existing construction land have significant positive impacts on urban carbon dioxide emissions, which further shows that the increase in urban construction land leads to the increase in carbon dioxide emissions. In comparison, the positive impact of changes in newly added construction land on carbon dioxide emissions is greater than that of changes in existing construction land on carbon dioxide emissions. This means that more urban carbon dioxide emissions come from the incremental part of urban expansion, and the impact of the original urban redevelopment is relatively small.
Table 6.
The results of mechanism test.
Second, whether changes in urban construction land from different usages would increase urban carbon emissions is analyzed. According to the construction purpose of the land market, urban construction land is divided into industrial land (lnlandi), residential land (lnlandr), green land (lnlandg), public land (lnlandp) (including roads, squares and other public infrastructure land) and other land (lnlando). The five variables are introduced into the baseline model simultaneously as explanatory variables for estimation, and the results are reported in column (2) of Table 5. Except for the green land, the changes in the other four kinds of urban construction land usages all lead to a significant increase in carbon dioxide emissions. Among them, the changes in urban construction land used for industrial construction have the greatest impact on increased carbon dioxide emissions, which means that more urban carbon dioxide emissions come from industrial activities. The changes in urban construction land used for housing, public construction and other fields have smaller impacts on carbon dioxide emissions. In addition, the changes in urban construction land used for greening construction can have a certain inhibitory effect on urban carbon dioxide emissions. However, perhaps due to the small green area, the carbon reduction effect of green land has not yet formed a certain scale, which also suggests that green construction should be strengthened in the process of urban construction. The proportion of urban construction land should be increased to enhance the carbon storage function of land.
5.2. Heterogeneity Analysis
In this section, we focus on the heterogenous impact of changes in urban construction land on carbon dioxide emissions from three aspects. First, taking into account that differences in the level of economic development of various cities may have different effects on urban carbon emissions, we test the heterogeneity of geographical distribution. Second, considering that low-carbon policies targeting at some cities may affect the impact of changes in urban construction land on carbon emissions, the heterogeneity of low-carbon pilot cities is analyzed. Third, since there may be heterogeneous effects of urban construction land on carbon emissions across different levels of urban sizes, we examine the heterogeneity of urban sizes. The estimation results are reported in Table 7.
Table 7.
The results of heterogeneity test.
From the perspective of the heterogeneity of geographical distribution, compared with the more developed cities in the eastern region, urban construction land in the central and western regions leads to more carbon dioxide emissions. Especially in the central region, the urban construction land has a greater effect on the growth of carbon dioxide emissions. The results are shown in columns (1) to (3) of panel A in Table 6. The development of central cities is highly dependent on land, and their government financial expenditures also rely more on land transactions. At the same time, it would also increase the area of industrial land for attracting enterprises, thereby promoting carbon dioxide emissions to a greater extent. Conversely, due to the higher land use efficiency of cities in the economically developed eastern region, the effect of their construction land on carbon dioxide emissions is also lower.
From the perspective of the heterogeneity of low-carbon pilot cities, for non-low-carbon pilot cities, changes in construction land have a greater effect of increasing carbon dioxide emissions. The results are shown in columns (4) and (5) of panel A in Table 6. This indicates that areas with greater government intervention are more reasonable in planning for construction land and intervene to a greater extent to adjust the use of urban construction land in order to optimize land use and reduce carbon emissions.
From the perspective of the heterogeneity of city size, there exists a heterogeneous impact of changes in urban construction land on carbon emissions across different city sizes, further confirming Hypothesis 2. With the increase in city size, the urban land use efficiency has gradually improved. Specifically, for super-large cities, the adverse effects of increased carbon emissions brought by urban construction land would be weakened, and even urban construction land would have a positive inhibitory effect on carbon emissions. The coefficients of lnland are insignificantly negative in medium, super-large and extra-large cities, showing that the urban scale effect is beneficial to regional energy conservation and emission reduction to a certain extent. It reflects the complexity and periodicity of the impact of urbanization level on carbon emissions in cities of different scales. Specifically, in large cities that are in urgent need of rapid economic development and rapidly expanding urban area, there is a significant positive relationship between urban construction land and carbon dioxide emissions, which confirms the hypothesis of environmental Kuznets curve to a certain extent. The results are shown in panel B in Table 6. The heterogenous impact of changes in urban construction land on carbon emissions in cities of different scales may be due to the reasonable agglomeration of labor, capital, technology and other input elements in mega-cities to promote low-carbon development in the region. In other words, the development of large cities generates greater carbon dioxide emissions, which are the cities that need to be focused on in the process of achieving carbon peaking.
5.3. Marginal Effect Test
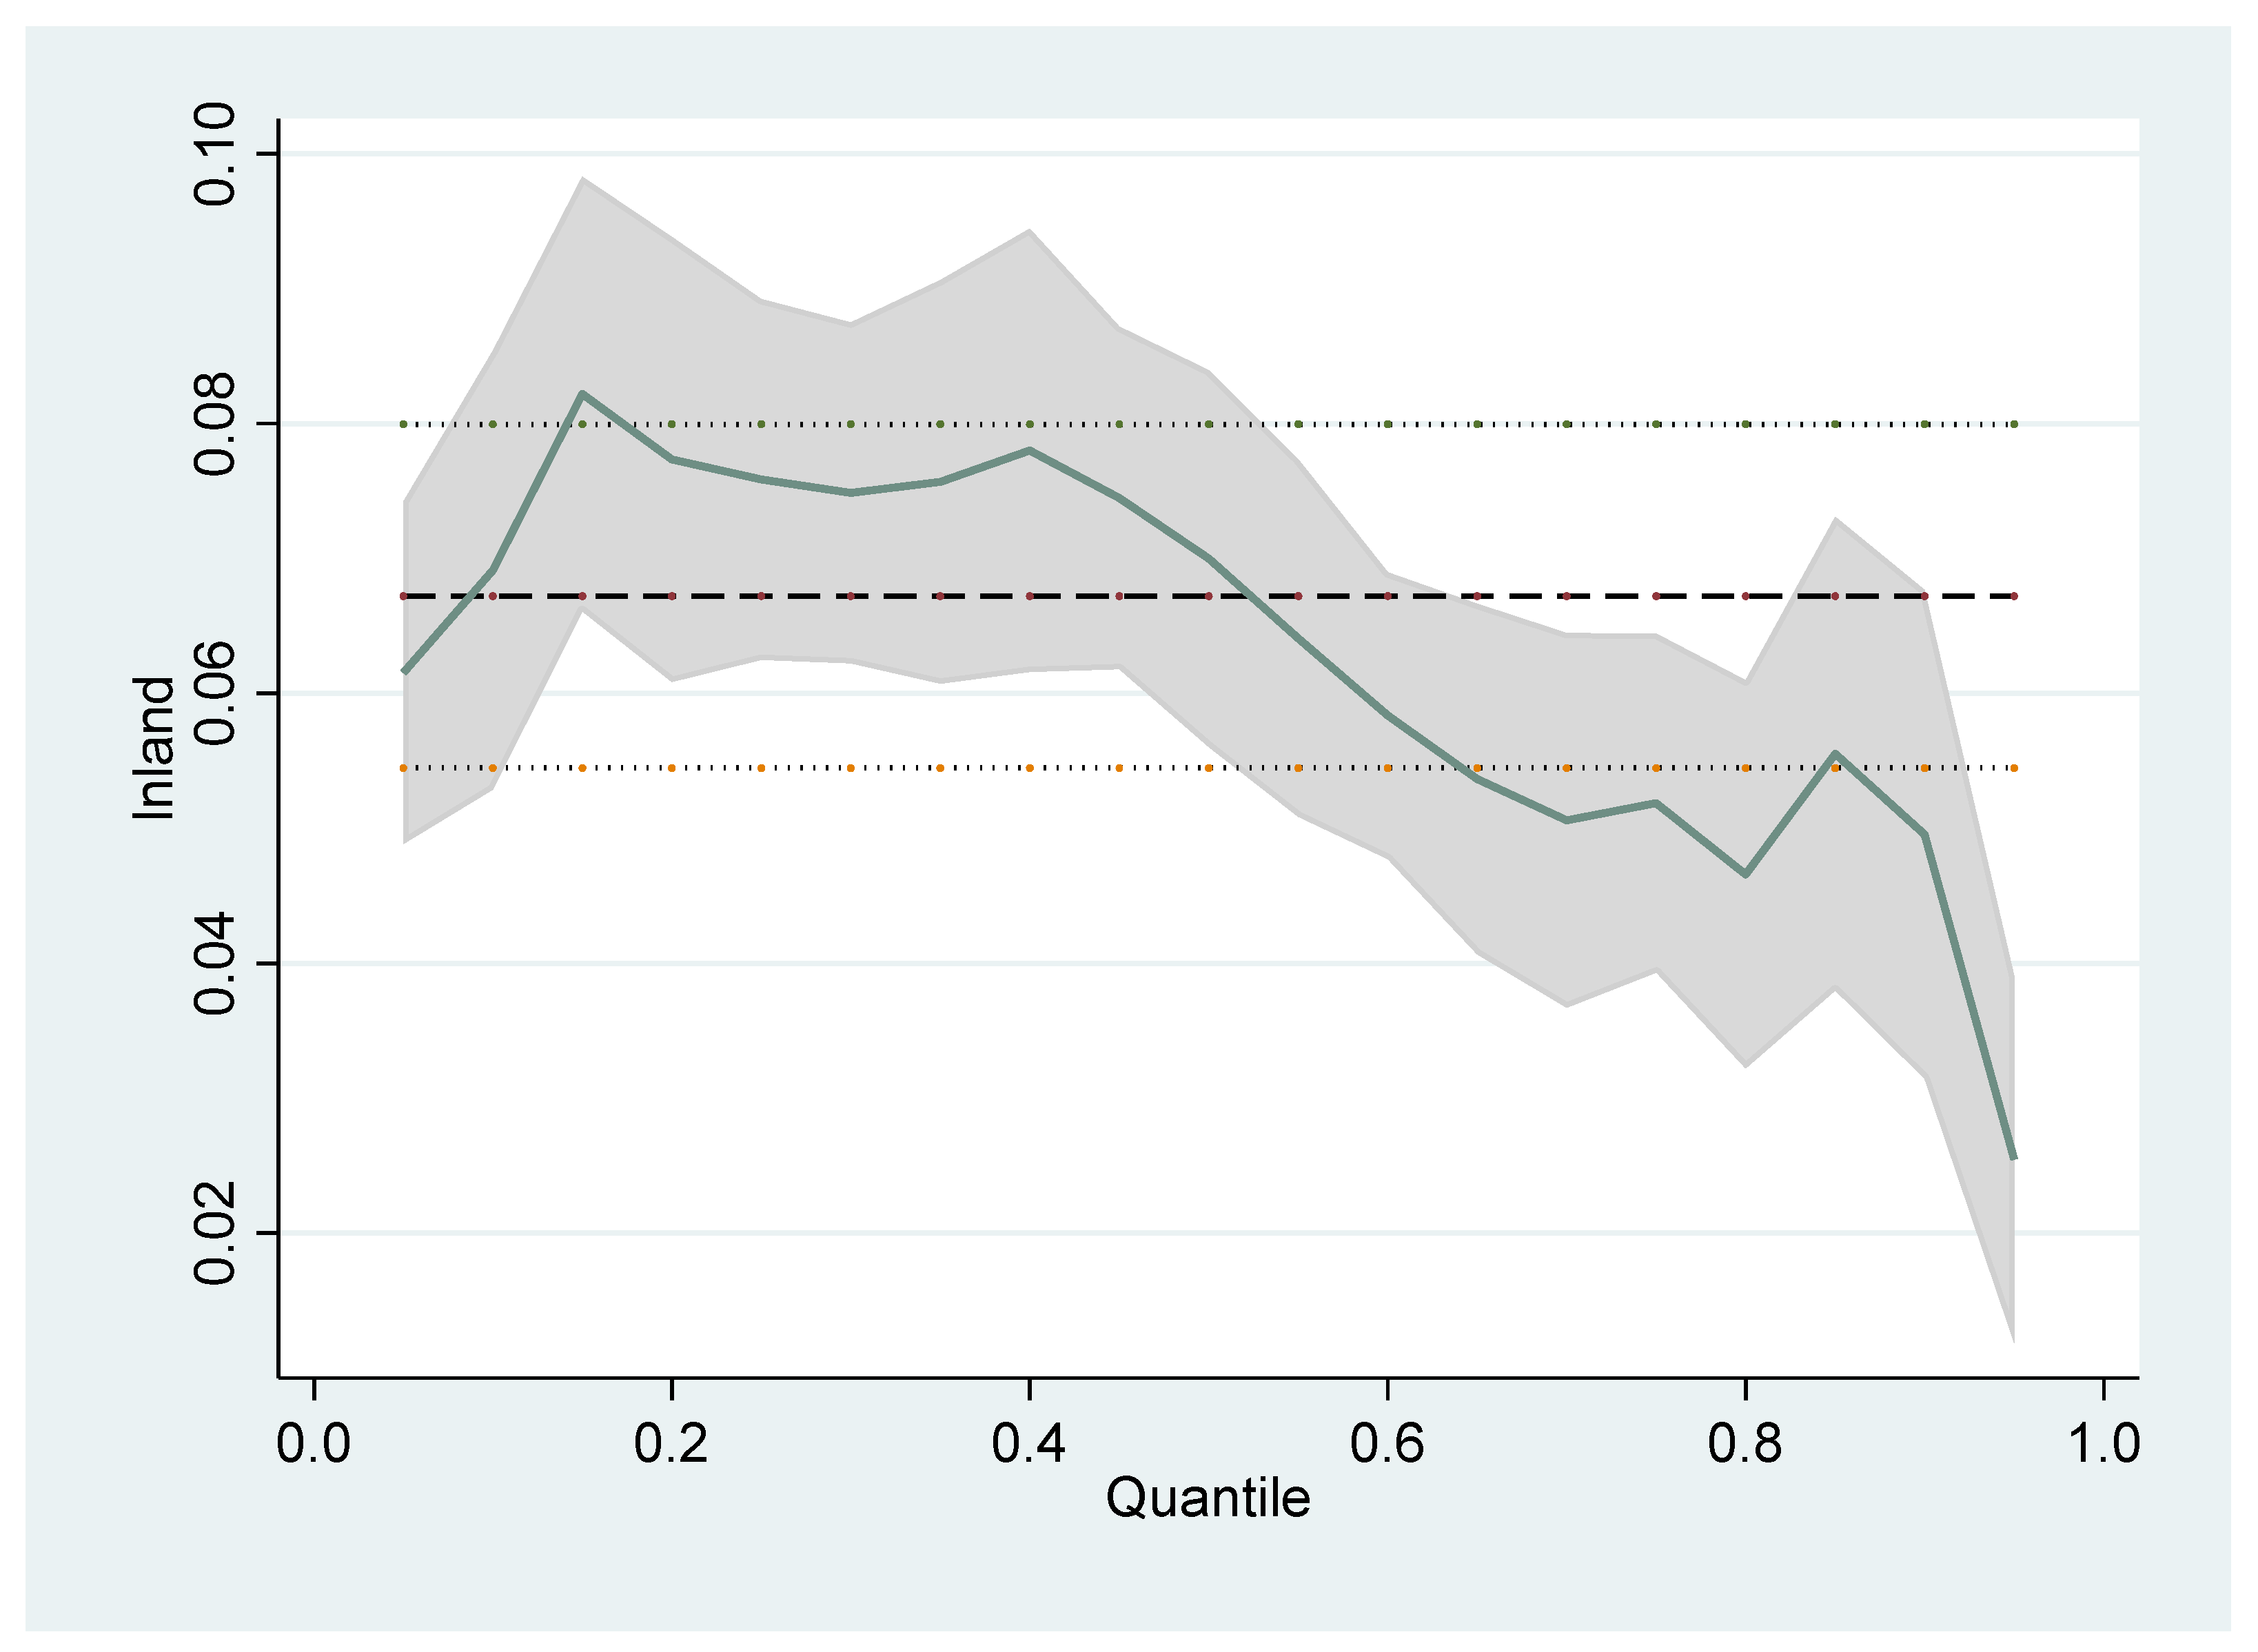
The linear regression model estimates a conditional mean and does not take into account the overall distribution characteristics of the explained variable. When it is necessary to understand the information on the position (quantile) of the explained variable, linear regression shows insufficiency. At the same time, considering that there may be outliers in the sample, the parameter estimates obtained by estimating the linear regression model can also be biased. For the heterogeneous characteristics of sample data, the common practice is to perform group regression according to the data characteristics, but this method would lead to the loss of sample data. To this end, based on the quantile regression method proposed by Koenker and Bassett [56], the quantile regression model can comprehensively describe the marginal effect of changes in urban construction land on carbon dioxide emissions by setting different quantiles. Figure 1 shows the confidence intervals for coefficients of lnland at different quantile levels, with quantiles varying equally from 0.01 to 0.99.
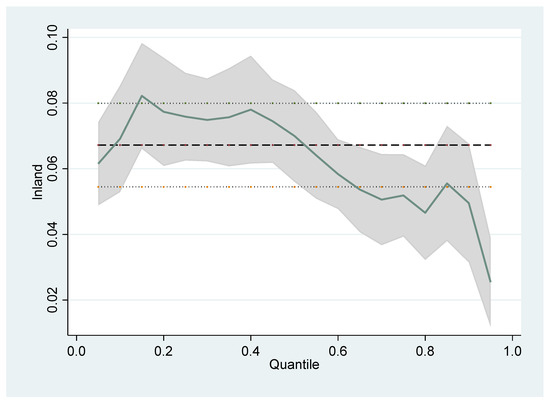
Figure 1.
Marginal effects at different quantile levels. Note: (1) the green curve represents the estimated coefficients of lnland at different quantile levels, and the gray area represents the 95% confidence interval for the coefficient of lnland; (2) the black dashed line represents the estimated coefficient of lnland in the baseline model, and the area enclosed by the two light-colored dashed lines is the 95% confidence interval for the coefficient of lnland in the baseline model.
According to Figure 1, as the quantile increases, the width of the 95% confidence interval of the coefficient of changes in urban construction land does not change significantly, indicating that the standard error of the coefficient estimate does not change, and the volatility of the coefficient estimate is robust. Judging from the trend of the coefficient estimates at different quantiles, the impact of changes in urban construction land on urban carbon emissions shows an inverted U-shaped trend that first increased and then decreased, confirming Hypothesis 3. It is explained that, when the urban construction land is in a certain scale, the impact of changes in urban construction on carbon emissions is the greatest. In addition, at the lower quantile, the estimated coefficient of lnland is basically within the 95% confidence interval for the coefficient of lnland in the baseline model. However, when the quantile is greater than 0.65, the estimated coefficient of lnland is basically not within the 95% confidence interval for the coefficient of lnland in the baseline model. This further shows that estimation of the linear regression model cannot explain the marginal effect of urban construction land on carbon emissions when the scale of urban construction land is large to a certain extent, while the quantile regression method can effectively make up for this.
5.4. Time-Varying Effect Test
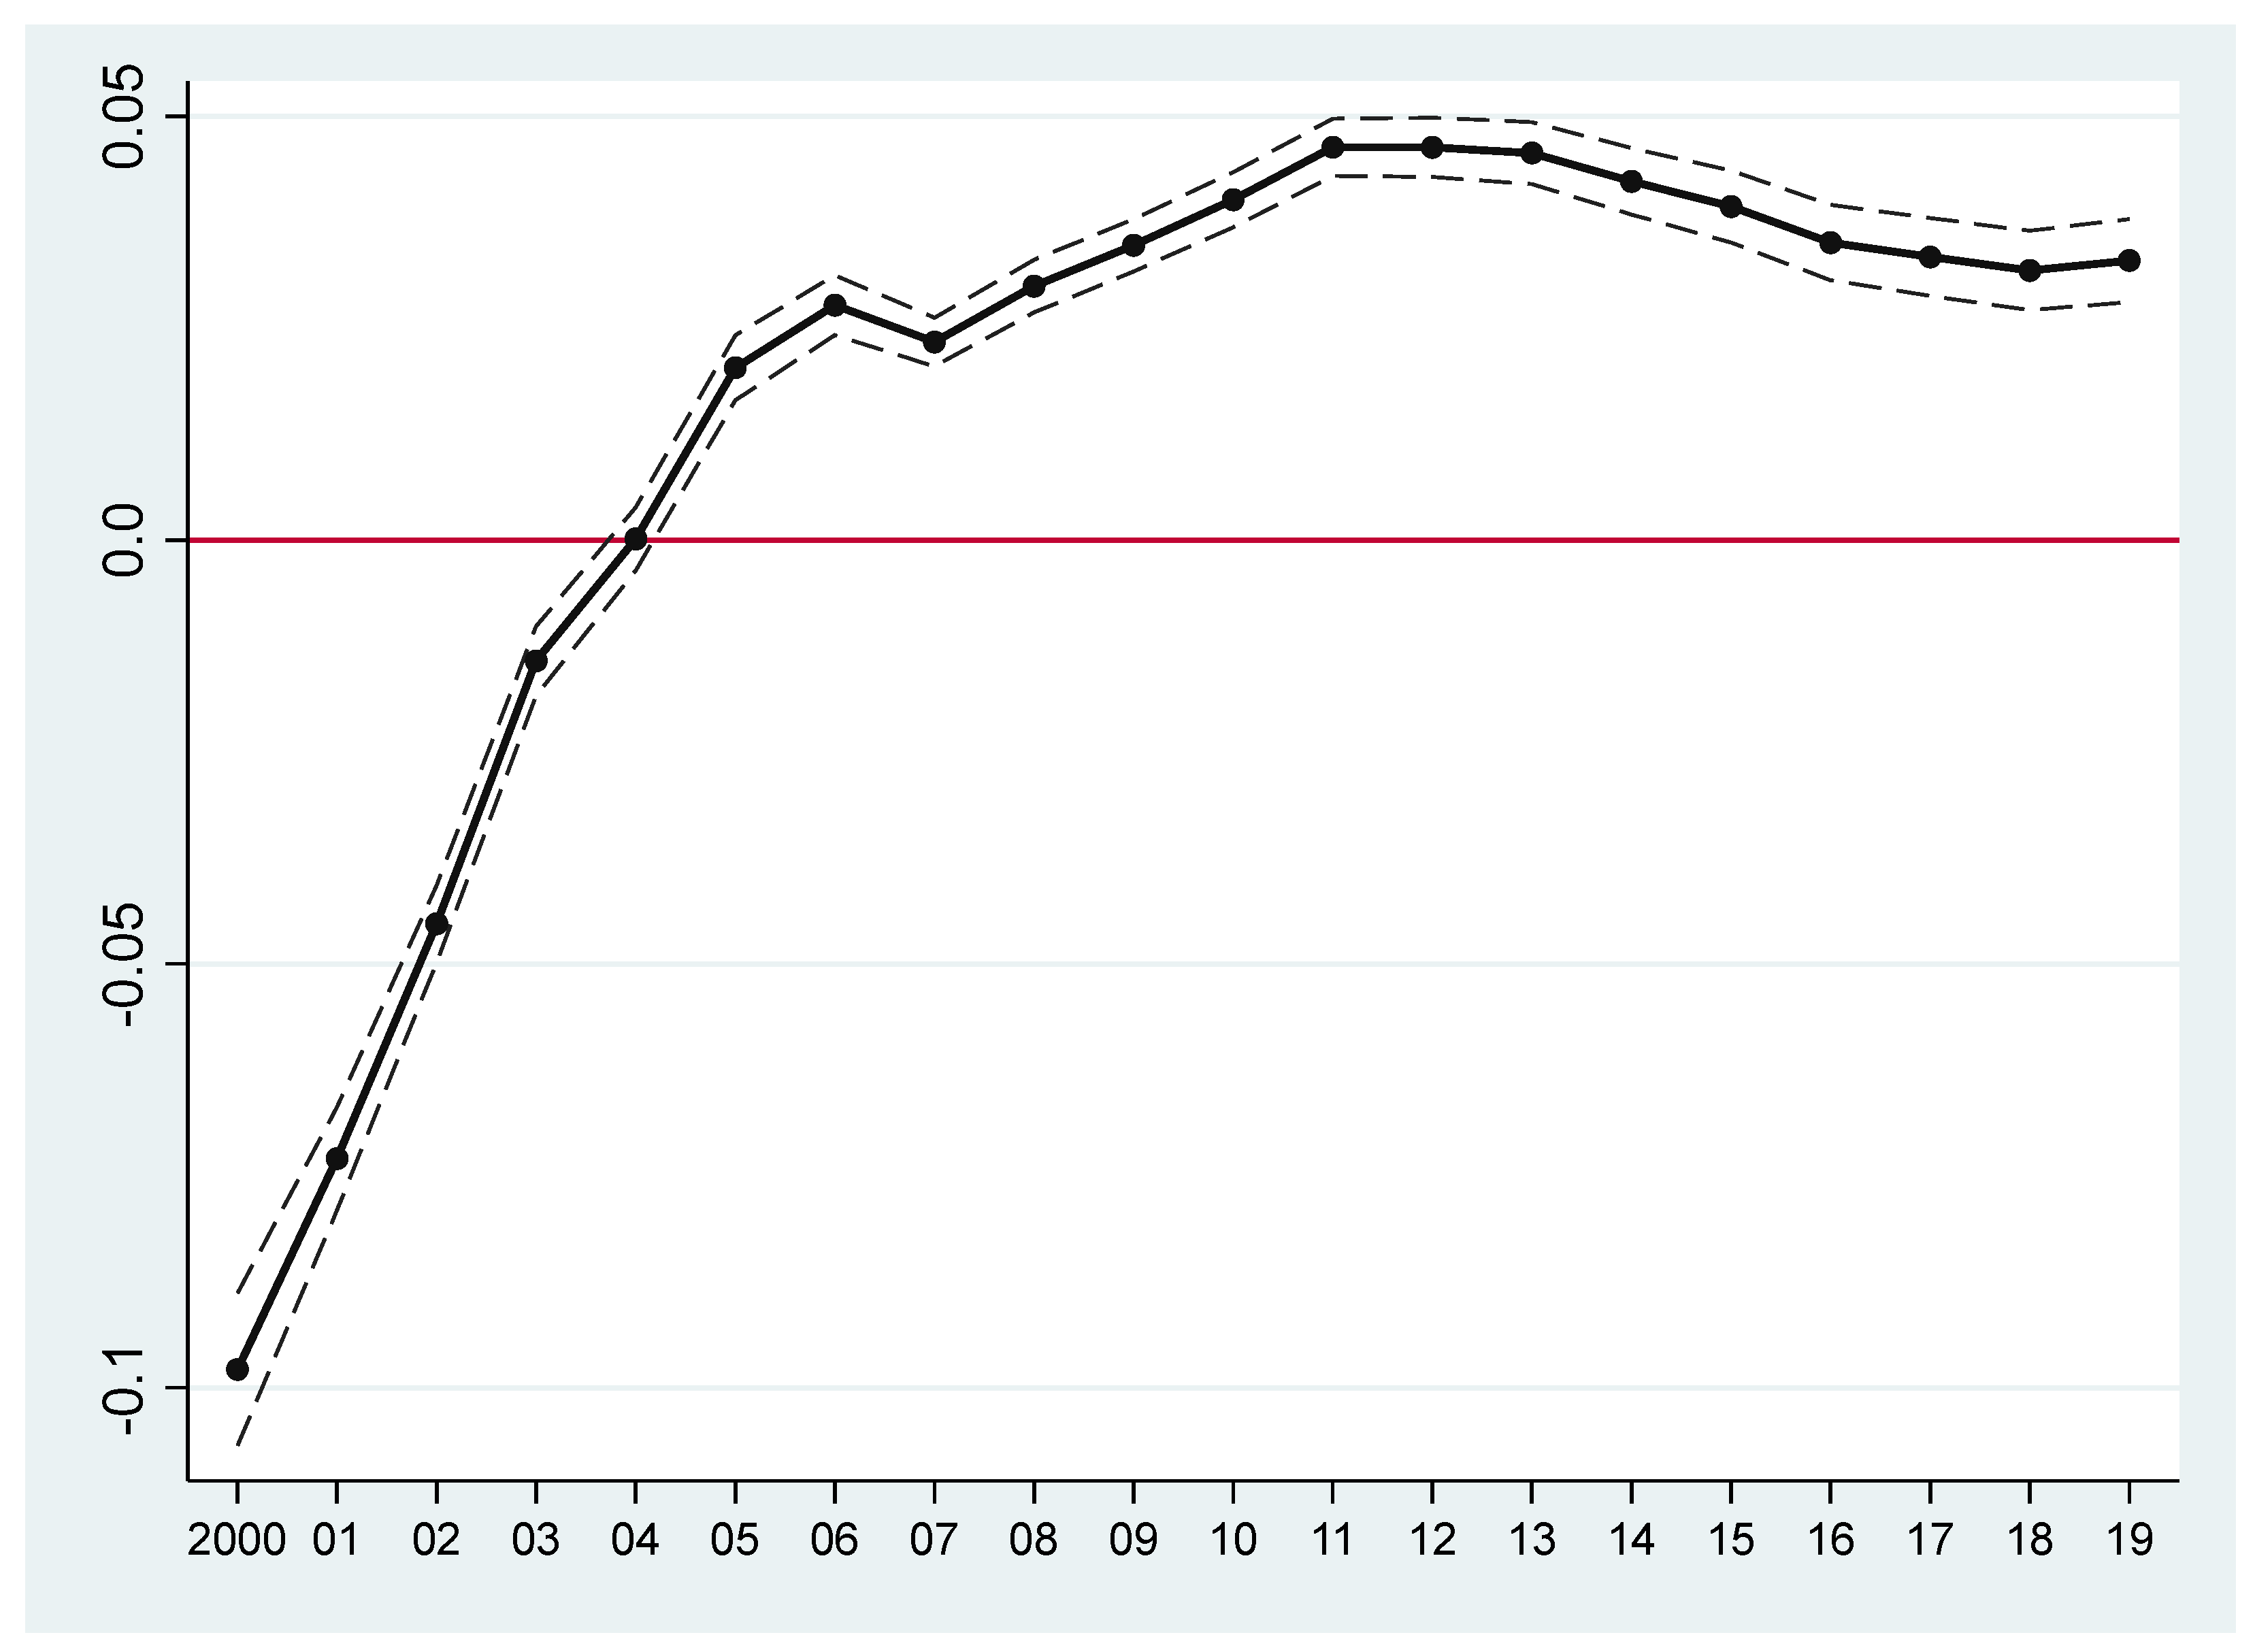
In this section, the time-varying effect test is carried out by estimating the fixed-effects model with varying coefficients. Based on Figure 2, the impact of urban construction land changes on carbon emissions presents time-varying characteristics. Before 2004, urban construction land had a negative impact on carbon emissions, but it showed a positive impact after that. After 2004, the impact of urban construction land on carbon emissions showed a trend of increasing first and then decreasing, and tended to stabilize after 2015, with the degree of impact remaining around 0.033.
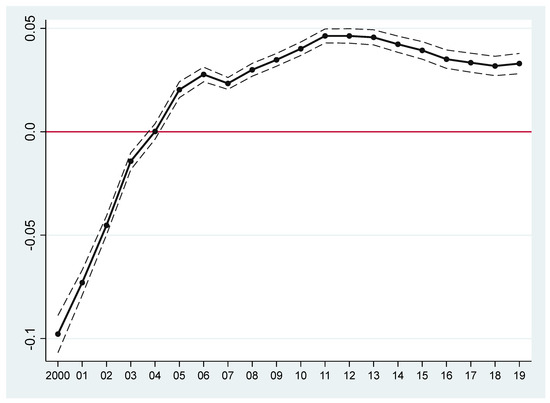
Figure 2.
Time-varying effects of urban construction land use on carbon emissions. Note: the black solid line represents the estimated time-varying coefficients of lnland by estimating the fixed-effects model with varying coefficients, and the area enclosed by the two black dashed lines is the 95% confidence interval for the coefficient of lnland.
6. Conclusions
In China, the construction of low-carbon cities is an important measure to achieve carbon neutrality and is of great significance to sustainable development. In the process of urbanization in China, while focusing on promoting urban growth, it is also necessary to pay attention to climate change and improve carbon emission reduction capabilities. In this regard, based on the panel data of 278 prefecture-level cities in China from 2000 to 2019, we analyzed the impact of changes in urban construction land on carbon dioxide emissions, where geographic and historical factors were used as instrumental variables to empirically identify the causal effects of changes in urban construction land on carbon emission activities. This paper draws the following conclusions.
First, the increase in urban construction land significantly promotes carbon dioxide emissions. After selecting geographic and historical data as instrumental variables and conducting a series of robustness tests, our main empirical results remain robust. Second, the difference in the impact of urban construction land changes on urban carbon emissions across different land sources and types of land use has been confirmed. The increase in the newly added urban construction land would weaken the carbon storage capacity of the land, leading to an increase in carbon emissions. Moreover, the increase in urban industrial land would enhance regional economic activities and energy consumption, thereby significantly increasing urban carbon emissions. Third, we analyzed the heterogenous impact of changes in urban construction land on carbon dioxide emissions from three aspects; the results show that, compared with the more developed cities in the eastern region, urban construction land in the central and western regions leads to more carbon dioxide emissions; for non-low-carbon pilot cities, changes in construction land have a greater effect of increasing carbon dioxide emissions, and there is no significant relationship between changes in urban construction land and urban carbon dioxide emissions in extra-large, super-large, medium and small cities. Fourth, the emission promotion effect of urban construction land has been alleviated due to the continuous increase in the scale of land use. Improving the land transaction market and deepening the reform of the land system may be a positive route for low-carbon urban development.
Our study provides first-hand evidence for promoting low carbon economy and land-use optimization. First of all, to promote the construction of green and low-carbon cities, the impact of proposed changes in urban construction land on urban carbon emissions should be paid close attention. Even if there are differences in the land sources and types of land use of cities, it is necessary to improve the structure of urban land use and reduce urban carbon emissions to promote long-term sustainable economic development. Additionally, the spatial structure of land use should be appropriately adjusted for super-large and extra-large cities and then actively guide the development trend of ecological livability, which would help to make green and low-carbon construction more reasonable. Considering the strong spatial heterogeneity of the impact of changes in urban construction land on carbon emissions, the carbon emission reduction cooperation mechanism among different cities and regions should be strengthened in the future. Finally, improving the land market can help to optimize land use, promoting the efficiency of land resource allocation. In this way, an intensive and efficient development mode for resource use can be formed to facilitate the construction of green and low-carbon cities.
Author Contributions
Conceptualization, J.P. and Y.Z.; methodology, J.P., Y.Z. and C.L.; software, Y.Z.; validation, J.P.; formal analysis, J.P., C.L. and Y.Z.; writing—original draft preparation, J.P.; writing—review and editing, J.P. and C.L. All authors have read and agreed to the published version of the manuscript.
Funding
This research was funded by the Hunan Provincial Natural Science Foundation of China (2022JJ40192), the National Social Science Foundation of China (21CTJ006) and the Scientific Research Project of Hunan Provincial Education Department (19B090).
Institutional Review Board Statement
Not applicable.
Informed Consent Statement
Not applicable.
Data Availability Statement
The data used in this study are available publicly; please refer to the corresponding author for further details.
Acknowledgments
The authors are grateful to the reviewers and editors for helpful comments and suggestions.
Conflicts of Interest
The authors declare no conflict of interest.
References
- Houghton, R.A.; House, J.I.; Pongratz, J.; Van Der Werf, G.R.; Defries, R.S.; Hansen, M.C.; Ramankutty, N. Carbon emissions from land use and land-cover change. Biogeosciences 2012, 9, 5125–5142. [Google Scholar] [CrossRef]
- Chuai, X.; Huang, X.; Lai, L.; Wang, W.; Peng, J.; Zhao, R. Land use structure optimization based on carbon storage in several regional terrestrial ecosystems across China. Environ. Sci. Policy 2013, 25, 50–61. [Google Scholar] [CrossRef]
- Peters, M.K.; Hemp, A.; Appelhans, T.; Becker, J.N.; Behler, C.; Classen, A.; Steffan-Dewenter, I. Climate–land-use interactions shape tropical mountain biodiversity and ecosystem functions. Nature 2019, 568, 88–92. [Google Scholar] [CrossRef]
- Thapa, P. The Relationship between Land Use and Climate Change: A Case Study of Nepal. In The Nature, Causes, Effects and Mitigation of Climate Change on the Environment; IntechOpen: London, UK, 2021. [Google Scholar] [CrossRef]
- Dale, V.H. The relationship between land-use change and climate change. Ecol. Appl. 1997, 7, 753–769. [Google Scholar] [CrossRef]
- Doelman, J.C.; Stehfest, E.; Tabeau, A.; van Meijl, H.; Lassaletta, L.; Gernaat, D.E.; van Vuuren, D.P. Exploring SSP land-use dynamics using the IMAGE model: Regional and gridded scenarios of land-use change and land-based climate change mitigation. Global Environ. Chang. 2018, 48, 119–135. [Google Scholar] [CrossRef]
- Narayan, P.K.; Saboori, B.; Soleymani, A. Economic growth and carbon emissions. Econ. Model. 2016, 53, 388–397. [Google Scholar] [CrossRef]
- Schröder, E.; Storm, S. Economic growth and carbon emissions: The road to “hothouse earth” is paved with good intentions. Int. J. Polit. Econ. 2020, 49, 153–173. [Google Scholar] [CrossRef]
- Sharif, A.; Raza, S.A.; Ozturk, I.; Afshan, S. The dynamic relationship of renewable and nonrenewable energy consumption with carbon emission: A global study with the application of heterogeneous panel estimations. Renew. Energ. 2019, 133, 685–691. [Google Scholar] [CrossRef]
- Yi, Y.; Qi, J.; Chen, D. Impact of population agglomeration in big cities on carbon emissions. Environ. Sci. Pollut. R. 2022. [Google Scholar] [CrossRef]
- Dong, B.; Ma, X.; Zhang, Z.; Zhang, H.; Chen, R.; Song, Y.; Xiang, R. Carbon emissions, the industrial structure and economic growth: Evidence from heterogeneous industries in China. Environ. Pollut. 2020, 262, 114322. [Google Scholar] [CrossRef]
- Salman, M.; Long, X.; Dauda, L.; Mensah, C.N.; Muhammad, S. Different impacts of export and import on carbon emissions across 7 ASEAN countries: A panel quantile regression approach. Sci. Total Environ. 2019, 686, 1019–1029. [Google Scholar] [CrossRef] [PubMed]
- Wang, Z.; Gao, L.; Wei, Z.; Majeed, A.; Alam, I. How FDI and technology innovation mitigate CO2 emissions in high-tech industries: Evidence from province-level data of China. Environ. Sci. Pollut. R 2022, 29, 4641–4653. [Google Scholar] [CrossRef] [PubMed]
- Li, Z.; Wang, J. The Dynamic Impact of Digital Economy on Carbon Emission Reduction: Evidence City-level Empirical Data in China. J. Clean. Prod. 2022, 351, 131570. [Google Scholar] [CrossRef]
- Gilchrist, D.; Yu, J.; Zhong, R. The limits of green finance: A survey of literature in the context of green bonds and green loans. Sustainability 2021, 13, 478. [Google Scholar] [CrossRef]
- Chen, X.; Chen, Z. Can green finance development reduce carbon emissions? Empirical evidence from 30 Chinese provinces. Sustainability 2021, 13, 12137. [Google Scholar] [CrossRef]
- Kim, H.; Choi, H.; Hong, T.; Ji, C.; Lee, J. Evolutionary Game Analysis of Green Loans Program to Achieve the National Carbon Emissions Reduction Target in South Korea. J. Manag. Eng. 2022, 38, 04022018. [Google Scholar] [CrossRef]
- Zhao, H.; Yang, Y.; Li, N.; Liu, D.; Li, H. How does digital finance affect carbon emissions? Evidence from an emerging market. Sustainability 2021, 13, 12303. [Google Scholar] [CrossRef]
- Zhang, W.; Xu, H. Effects of land urbanization and land finance on carbon emissions: A panel data analysis for Chinese provinces. Land Use Policy 2017, 63, 493–500. [Google Scholar] [CrossRef]
- Duan, B.; Ji, X. Can Carbon Finance Optimize Land Use Efficiency? The Example of China’s Carbon Emissions Trading Policy. Land 2021, 10, 953. [Google Scholar] [CrossRef]
- Ulucak, R.; Khan, S.U.D.; Baloch, M.A.; Li, N. Mitigation pathways toward sustainable development: Is there any trade-off between environmental regulation and carbon emissions reduction? Sustain. Dev. 2020, 28, 813–822. [Google Scholar] [CrossRef]
- Huo, W.; Qi, J.; Yang, T.; Liu, J.; Liu, M.; Zhou, Z. Effects of China’s pilot low-carbon city policy on carbon emission reduction: A quasi-natural experiment based on satellite data. Technol. Forecast. Soc. 2022, 175, 121422. [Google Scholar] [CrossRef]
- Elliott, J.; Fullerton, D. Can a unilateral carbon tax reduce emissions elsewhere? Resour. Energy Econ. 2014, 36, 6–21. [Google Scholar] [CrossRef]
- Barnett, T.P.; Adam, J.C.; Lettenmaier, D.P. Potential impacts of a warming climate on water availability in snow-dominated regions. Nature 2005, 438, 303–309. [Google Scholar] [CrossRef]
- Hutyra, L.R.; Yoon, B.; Alberti, M. Terrestrial carbon stocks across a gradient of urbanization: A study of the Seattle, WA region. Global Change Biol. 2011, 17, 783–797. [Google Scholar] [CrossRef]
- Bailis, R.O.B.; McCarthy, H. Carbon impacts of direct land use change in semiarid woodlands converted to biofuel plantations in India and Brazil. GCB Bioenergy 2011, 3, 449–460. [Google Scholar] [CrossRef]
- Jaiarree, S.; Chidthaisong, A.; Tangtham, N.; Polprasert, C.; Sarobol, E.; Tyler, S.C. Soil organic carbon loss and turnover resulting from forest conversion to maize fields in Eastern Thailand. Pedosphere 2011, 21, 581–590. [Google Scholar] [CrossRef]
- Paustian, K.; Six, J.; Elliott, E.T.; Hunt, H.W. Management options for reducing CO2 emissions from agricultural soils. Biogeochemistry 2000, 48, 147–163. [Google Scholar] [CrossRef]
- Morugán-Coronado, A.; García-Orenes, F.; Mataix-Solera, J.; Arcenegui, C.; Mataix-Beneyto, J. Short-term effects of treated wastewater irrigation on Mediterranean calcareous soil. Soil Till. Res. 2011, 112, 18–26. [Google Scholar] [CrossRef]
- Lai, L.; Huang, X.; Yang, H.; Chuai, X.; Zhang, M.; Zhong, T.; Thompson, J.R. Carbon emissions from land-use change and management in China between 1990 and 2010. Sci. Adv. 2016, 2, e1601063. [Google Scholar] [CrossRef] [Green Version]
- Xiao, X.; Xie, C. Rational planning and urban governance based on smart cities and big data. Environ. Technol. Innov. 2021, 21, 101381. [Google Scholar] [CrossRef]
- Ou, J.P.; Liu, X.P.; Li, X.; Chen, Y.M. Quantifying the relationship between urban forms and carbon emissions using panel data analysis. Landscape Ecol. 2013, 28, 1889–1907. [Google Scholar] [CrossRef]
- Chen, Y.M.; Li, X.; Zheng, Y.; Guan, Y.Y.; Liu, X.P. Estimating the relationship between urban forms and energy consumption: A case study in the Pearl River Delta, 2005–2008. Landsc. Urban Plan. 2011, 102, 33–42. [Google Scholar] [CrossRef]
- Zhao, Y.; Ma, S.; Fan, J.; Cai, Y. Examining the effects of land use on carbon emissions: Evidence from Pearl River Delta. Int. J. Environ. Res. Public Health 2021, 18, 3623. [Google Scholar] [CrossRef]
- Dominguez, A.; Sierra, H.E.; Cuervo Ballesteros, N. Regional Spatial Structure and Land Use: Evidence from Bogotá and 17 Municipalities. Land 2021, 10, 908. [Google Scholar] [CrossRef]
- Yang, H.; Huang, J.; Liu, D. Linking climate change and socioeconomic development to urban land use simulation: Analysis of their concurrent effects on carbon storage. Appl. Geogr. 2020, 115, 102135. [Google Scholar] [CrossRef]
- Su, X.B.; Xiong, Y.M.; Zhu, J.Y.; Ye, Y.C.; Mai, Y.E. Soil organic carbon content and distribution in a small landscape of Dongguan, South China. Pedosphere 2006, 16, 10–17. [Google Scholar] [CrossRef]
- Jiao, J.G.; Yang, L.Z.; Wu, J.X.; Wang, H.Q.; Li, H.X.; Ellis, E.C. Land use and soil organic carbon in China’s village landscapes. Pedosphere 2010, 20, 1–14. [Google Scholar] [CrossRef]
- Houghton, R.A. Revised estimates of the annual net flux of carbon to the atmosphere from changes in land use and land management 1850–2000. Tellus B Chem. Phys. Meteorol. 2003, 55, 378–390. [Google Scholar] [CrossRef]
- Chen, Y.; Zhao, L. Exploring the relation between the industrial structure and the eco-environment based on an integrated approach: A case study of Beijing, China. Ecol. Indic. 2019, 103, 83–93. [Google Scholar] [CrossRef]
- Liu, Y.; Song, Y.; Arp, H.P. Examination of the relationship between urban form and urban eco-efficiency in China. Habitat Int. 2012, 36, 171–177. [Google Scholar] [CrossRef]
- Huang, Y.; Li, L.; Yu, Y. Does urban cluster promote the increase of urban eco-efficiency? Evidence from Chinese cities. J. Clean. Prod. 2018, 197, 957–971. [Google Scholar] [CrossRef]
- Li, S.; Zhou, C.; Wang, S.; Hu, J. Dose urban landscape pattern affect CO2 emission efficiency? Empirical evidence from megacities in China. J. Clean. Prod. 2018, 203, 164–178. [Google Scholar] [CrossRef]
- Yang, Y.; Jiang, G.; Qiuyue, Z.; Zhou, D.; Yuling, L. Does the land use structure change conform to the evolution law of industrial structure? An empirical study of Anhui Province, China. Land Use Policy 2019, 81, 657–667. [Google Scholar] [CrossRef]
- Proque, A.L.; dos Santos, G.F.; Junior, A.A.B.; Larson, W.D. Effects of land use and transportation policies on the spatial distribution of urban energy consumption in Brazil. Energy Econ. 2020, 90, 104864. [Google Scholar] [CrossRef]
- Zhou, Y.; Kong, Y.; Sha, J.; Wang, H. The role of industrial structure upgrades in eco-efficiency evolution: Spatial correlation and spillover effects. Sci. Total Environ. 2019, 687, 1327–1336. [Google Scholar] [CrossRef]
- Zhou, X.Y.; Lei, K.; Meng, W.; Khu, S.T. Industrial structural upgrading and spatial optimization based on water environment carrying capacity. J. Clean. Prod. 2017, 165, 1462–1472. [Google Scholar] [CrossRef]
- Carlino, G.; Kerr, W.R. Agglomeration and innovation. Handb. Reg. Urban Econ. 2015, 5, 349–404. [Google Scholar] [CrossRef]
- Chen, J.; Gao, M.; Cheng, S.; Hou, W.; Song, M.; Liu, X.; Shan, Y. County-level CO2 emissions and sequestration in China during 1997–2017. Sci. Data 2020, 7, 391. [Google Scholar] [CrossRef]
- Oda, T.; Maksyutov, S.; Andres, R.J. The Open-source Data Inventory for Anthropogenic CO2, version 2016 (ODIAC2016): A global monthly fossil fuel CO2 gridded emissions data product for tracer transport simulations and surface flux inversions. Earth Syst. Sci. Data 2018, 10, 87–107. [Google Scholar] [CrossRef] [Green Version]
- Duranton, G.; Puga, D. The economics of urban density. J. Econ. Perspect. 2020, 34, 3–26. [Google Scholar] [CrossRef]
- Harari, M. Cities in bad shape: Urban geometry in India. Am. Econ. Rev. 2020, 110, 2377–2421. [Google Scholar] [CrossRef]
- Ivus, O.; Boland, M. The employment and wage impact of broadband deployment in Canada. Can. J. Agr. Econ. 2015, 48, 1803–1830. [Google Scholar] [CrossRef]
- Li, M.; Du, W. Can Internet development improve the energy efficiency of firms: Empirical evidence from China. Energy 2021, 237, 121590. [Google Scholar] [CrossRef]
- van Donkelaar, A.; Hammer, M.S.; Bindle, L.; Brauer, M.; Brook, J.R.; Garay, M.J.; Martin, R.V. Monthly global estimates of fine particulate matter and their uncertainty. Environ. Sci. Technol. 2021, 55, 15287–15300. [Google Scholar] [CrossRef]
- Koenker, R.; Bassett, G. Regression Quantiles. Econometrica 1978, 46, 33–50. [Google Scholar] [CrossRef]
Publisher’s Note: MDPI stays neutral with regard to jurisdictional claims in published maps and institutional affiliations. |
© 2022 by the authors. Licensee MDPI, Basel, Switzerland. This article is an open access article distributed under the terms and conditions of the Creative Commons Attribution (CC BY) license (https://creativecommons.org/licenses/by/4.0/).