
Measuring City-Level Transit Accessibility Based on the Weight of Residential Land Area: A Case of Nanning City, China

Abstract
:1. Introduction
2. Literature Review
2.1. Definition of Transit Accessibility
2.2. Population with Access to Transit Stops
3. Methodology
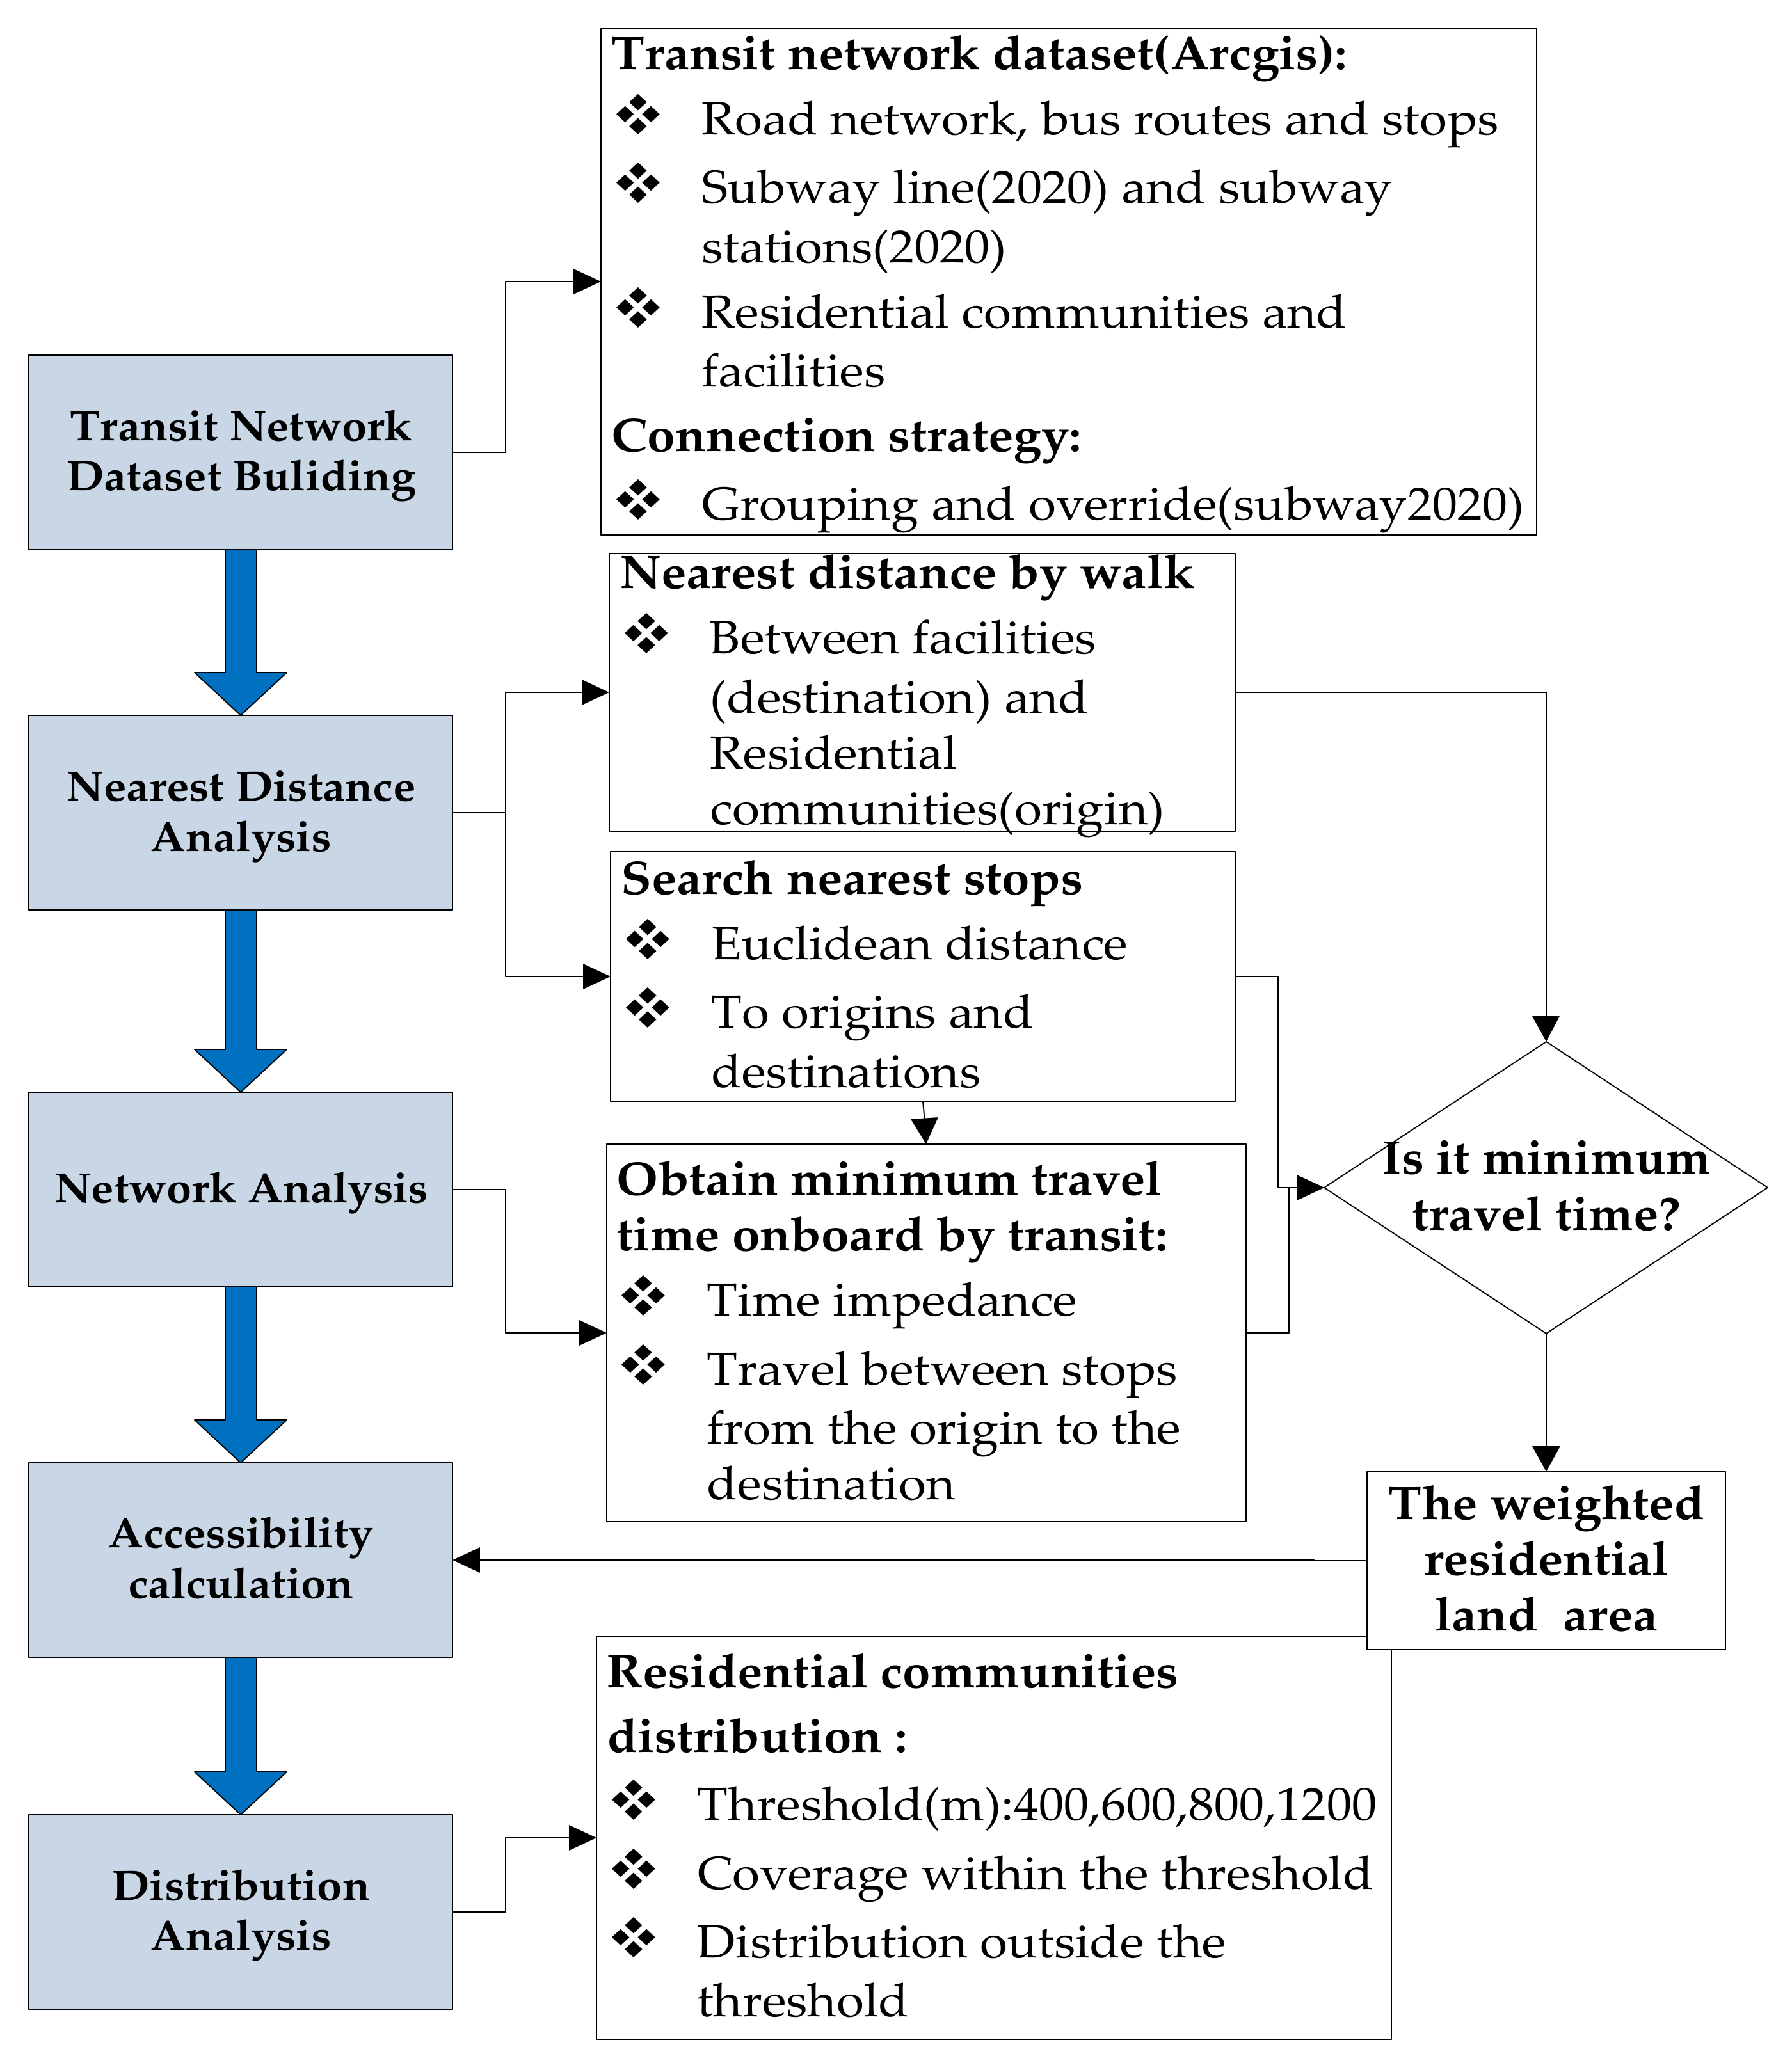
3.1. Research Steps
3.2. Research Area
3.3. Resource of Data
4. Results of Data Analysis
4.1. Statistical Analysis of Result
4.2. Transit Accessibility Based on the Weight of Residential Land Area
4.3. Coverage of the Transit Stops Incorporating Residential Land Area
5. Discussion
5.1. Advantages of the Residential Land Area Weights Index of Transit Accessibility
5.2. Interaction between Accessibility, Quantity of Facilities and Sustainable Urban Structure
5.3. Limitation
6. Conclusions
Author Contributions
Funding
Institutional Review Board Statement
Informed Consent Statement
Data Availability Statement
Conflicts of Interest
References
- Geertman, S.C.; Ritsema Van Eck, J.R. GIS and models of accessibility potential: An application in planning. Int. J. Geogr. Inf. Syst. 1995, 9, 67–80. [Google Scholar] [CrossRef]
- Iacono, M.; Krizek, K.J.; El-Geneidy, A. Measuring nonmotorized accessibility: Issues, alternatives, and execution. J. Transp. Geogr. 2010, 18, 133–140. [Google Scholar] [CrossRef]
- Curtis, C.; Scheurer, J. Planning for sustainable accessibility: Developing tools to aid discussion and decision-making. Prog. Plan. 2010, 74, 53–106. [Google Scholar] [CrossRef]
- Gan, Z.; Feng, T.; Wu, Y.; Yang, M.; Timmermans, H. Station-based average travel distance and its relationship with urban form and land use: An analysis of smart card data in Nanjing City, China. Transp. Policy 2019, 79, 137–154. [Google Scholar] [CrossRef]
- Vale, D. Effective accessibility: Using effective speed to measure accessibility by cost. Transp. Res. Part D Transp. Environ. 2020, 80, 102263. [Google Scholar] [CrossRef]
- Liu, M.; Jiang, Y. Measuring accessibility of urban scales: A trip-based interaction potential model. Adv. Eng. Inform. 2021, 48, 101293. [Google Scholar] [CrossRef]
- Lee, S.G.; Hickman, M.; Tong, D. Development of a temporal and spatial linkage between transit demand and land-use patterns. J. Transp. Land Use 2013, 6, 33. [Google Scholar] [CrossRef]
- Li, R.; Tong, D. Incorporating activity space and trip chaining intofacility siting for accessibility maximization. Socio-Econ. Plan. Sci. 2017, 60, 1–14. [Google Scholar] [CrossRef]
- Hillman, R.; Pool, G. GIS-based innovations for modelling public transport accessibility. Traffic Eng. Control 1997, 38, 554–559. [Google Scholar]
- Lei, T.L.; Church, R.L. Mapping transit-based access: Integrating GIS, routes and schedules. Int. J. Geogr. Inf. Sci. 2010, 24, 283–304. [Google Scholar] [CrossRef]
- Tribby, C.P.; Zandbergen, P.A. High-resolution spatio-temporal modeling of public transit accessibility. Appl. Geogr. 2012, 34, 345–355. [Google Scholar] [CrossRef]
- Mavoa, S.; Witten, K.; McCreanor, T.; O’Sullivan, D. GIS based destination accessibility via public transit and walking in Auckland, New Zealand. J. Transp. Geogr. 2012, 20, 15–22. [Google Scholar] [CrossRef]
- Yigitcanlar, T.; Sipe, N.; Evans, R.; Pitot, M. A GIS-based land use and public transport accessibility indexing model. Aust. Plan. 2007, 44, 30–37. [Google Scholar] [CrossRef]
- Malekzadeh, A.; Chung, E. A review of transit accessibility models: Challenges in developing transit accessibility models. Int. J. Sustain. Transp. 2019, 14, 733–748. [Google Scholar] [CrossRef]
- Zuo, T.; Wei, H.; Chen, N. Promote transit via hardening first-and-last-mile accessibility: Learned from modeling commuters’ transit use. Transp. Res. Part D Transp. Environ. 2020, 86, 102446. [Google Scholar] [CrossRef]
- Kimpel, T.J.; Duecker, K.J.; El-Geneidy, A.M. Using GIS to measure the effects of service area and frequency on passenger boardings at bus stops. J. Urban Reg. Inf. Syst. Assoc. 2007, 19, 5–11. [Google Scholar]
- Biba, S.; Curtin, K.M.; Manca, G. A new method for determining the population with walking access to transit. Int. J. Geogr. Inf. Sci. 2010, 24, 347–364. [Google Scholar] [CrossRef]
- Azad, M.; Abdelqader, D.; Taboada, L.M.; Cherry, C.R. Walk-to-transit demand estimation methods applied at the parcel level to improve pedestrian infrastructure investment. J. Transp. Geogr. 2021, 92, 103019. [Google Scholar] [CrossRef]
- Horner, M.W.; Murray, A.T. Spatial representation and scale impacts in transit service assessment. Environ. Plan. B Plan. Des. 2004, 31, 785–797. [Google Scholar] [CrossRef]
- Nasri, A.; Zhang, L. The analysis of transit-oriented development (TOD) in Washington, D.C. and Baltimore metropolitan areas. Transp. Policy 2014, 32, 172–179. [Google Scholar] [CrossRef]
- Lee, J.; Kurisu, K.; An, K.; Hanaki, K. Development of the compact city index and its application to Japanese cities. Urban Stud. 2015, 52, 1054–1070. [Google Scholar] [CrossRef]
- Hu, N.; Legara, E.F.; Lee, K.K.; Hung, G.G.; Monterola, C. Impacts of land use and amenities on public transport use, urban planning and design. Land Use Policy 2016, 57, 356–367. [Google Scholar] [CrossRef]
- Bree, S.; Fuller, D.; Diab, E. Access to transit Validating local transit accessibility measures using transit ridership. Transp. Res. Part A Policy Pract. 2020, 141, 430–442. [Google Scholar] [CrossRef]
- Vale, D.S. Transit-oriented development, integration of land use and transport, and pedestrian accessibility: Combining node-place model with pedestrian shed ratio to evaluate and classify station areas in Lisbon. J. Transp. Geogr. 2015, 45, 70–80. [Google Scholar] [CrossRef]
- Cox, L.; Bassi, A.; Kolling, J.; Procter, A.; Flanders, N.; Tanners, N.; Araujo, R. Exploring synergies between transit investment and dense redevelopment: A scenario analysis in a rapidly urbanizing landscape. Landsc. Urban Plan. 2017, 167, 429–440. [Google Scholar] [CrossRef]
- Handy, S.; Niemeier, D.A. Measuring accessibility: An exploration of issues and alternatives. Environ. Plan. A 1997, 29, 1175–1194. [Google Scholar] [CrossRef]
- Church, R.L.; Marston, J.R. Measuring accessibility for people with a disability. Geogr. Anal. 2003, 35, 83–96. [Google Scholar] [CrossRef]
- Murray, A.T.; Davis, R.; Stimson, R.J.; Ferreira, L. Public Transportation Access. Transp. Res. Part D Transp. Environ. 1998, 3, 319–328. [Google Scholar] [CrossRef]
- O’Sullivan, D.; Morrison, A.; Shearer, J. Using desktop GIS for the investigation of accessibility by public transport: An isochrone approach. Int. J. Geogr. Inf. Sci. 2000, 14, 85–104. [Google Scholar] [CrossRef]
- Dalvi, M.Q.; Martin, K. The measurement of accessibility:Some preliminary results. Transportation 1976, 5, 17–42. [Google Scholar] [CrossRef]
- Kwan, M.P.; Murray, A.T.; O’Kelly, M.E.; Tiefelsdorf, M. Recent advances in accessibility research: Representation, methodology and applications. J. Geogr. Syst. 2003, 5, 129–138. [Google Scholar] [CrossRef]
- Miller, H.J. Measuring space-time accessibility benefits within transportation networks: Basic theory and computational procedures. Geogr. Anal. 1999, 31, 187–212. [Google Scholar] [CrossRef]
- Næss, P.; Peters, S.; Stefansdottir, H.; Strand, A. Causality, not just correlation: Residential location, transport rationales and travel behavior across metropolitan contexts. J. Transp. Geogr. 2018, 69, 181–195. [Google Scholar] [CrossRef]
- Zuo, T.; Wei, H.; Rohne, A. Determining transit service coverage by non-motorized accessibility to transit: Case study of applying GPS data in Cincinnati metropolitan area. J. Transp. Geogr. 2018, 67, 53–60. [Google Scholar] [CrossRef]
- Peng, Z.; Dueker, K.J. Spatial data integration in route-level transit demand modeling. J. Urban Reg. Inf. Syst. Assoc. 1995, 7, 26–37. [Google Scholar]
- Murray, A.T. A Coverage Model for Improving Public Transit System. Ann. Oper. Res. 2003, 123, 143–156. [Google Scholar] [CrossRef]
- Currie, G. Quantifying spatial gaps in public transport supply based on social needs. J. Transp. Geogr. 2010, 18, 31–41. [Google Scholar] [CrossRef]
- O’Neill, W.A.; Ramsey, R.D.; Chou, J. Analysis of transit service areas using geographic information systems. Transp. Res. Rec. 1992, 1364, 131–138. [Google Scholar]
- Furth, P.G.; Mekuria, M.C.; SanClemente, J.L. Parcel-level modeling to analyze transit stop location changes. J. Public Transp. 2007, 10, 73–92. [Google Scholar] [CrossRef]
- Williams, P.A. The Influence of Residential Accessibility on household trip-making. Socio-Econ. Plan. Sci. 1989, 23, 373–385. [Google Scholar] [CrossRef]
- Shen, G. Measuring Accessibility of Housing to Public–community Facilities Using Geographical Information Systems. Rev. Urban Reg. Dev. Stud. 2002, 14, 235–255. [Google Scholar] [CrossRef]
- Dou, Y.; Luo, X.; Dong, L.; Wu, C.; Liang, H.; Ren, J. An empirical study on transit-oriented low-carbon urban land use planning: Exploratory Spatial Data Analysis (ESDA) on Shanghai, China. Habitat Int. 2016, 53, 379–389. [Google Scholar] [CrossRef]
- Foda, M.; Osman, A. Using GIS for measuring transit stop accessibility considering actual pedestrian road network. J. Public Transp. 2010, 13, 23–40. [Google Scholar] [CrossRef]
- Sultana, S.; Weber, J. The Nature of Urban Growth and the Commuting Transition: Endless Sprawl or a Growth Wave? Urban Stud. 2014, 51, 544–576. [Google Scholar] [CrossRef] [Green Version]
- Maat, K.; Timmermans, H.J. A causal model relating urban form with daily travel distance through activity/travel decisions. Transp. Plan. Technol. 2009, 32, 115–134. [Google Scholar] [CrossRef]
- Ding, C.; Mishra, S.; Lu, G.; Yang, J.; Liu, C. Influences of built environment characteristics and individual factors on commuting distance: A multilevel mixture hazard modeling approach. Transp. Res. Part D Transp. Environ. 2017, 51, 314–325. [Google Scholar] [CrossRef]
- Su, X.; Qian, Z. Neoliberal financial governance and its transformation under real estate boom and bust: The case of Ordos City, China. Land Use Policy 2022, 112, 104728. [Google Scholar] [CrossRef]
- Galster, G.; Hanson, R.; Ratcliffe, M.R.; Wolman, H.; Coleman, S.; Freihage, J. Wrestling sprawl to the ground: Defining and measuring an elusive concept. Hous. Policy Debate 2001, 12, 681–717. [Google Scholar] [CrossRef]
- Boussauw, K.; Neutens, T.; Witlox, F. Relationship between Spatial Proximity and Travel-to-Work Distance: The Effect of the Compact City. Reg. Stud. 2012, 46, 687–706. [Google Scholar] [CrossRef]
- Jeffrey, D.; Boulangé, C.; Giles-Corti, B.; Washington, S.; Gunn, L. Using walkability measures to identify train stations with the potential to become transit oriented developments located in walkable neighbourhoods. J. Transp. Geogr. 2019, 76, 221–231. [Google Scholar] [CrossRef]


| Domains | Types | Count | Source | ||
|---|---|---|---|---|---|
| 2000 | 2020 | 2000 | 2020 | ||
| Residential community | Origin | 1336 | 2531 | Google image2002 and Map of Nanning 2000 | OSM vector map2020 and Amap2020 |
| Bus route | Transit facilities | 30 | 189 | Map of Nanning 2000 and Google image2002 | OSM vector map2020 and Amap2020 |
| Subway line | Transit facilities | 4 | OSM vector map2020 | ||
| City center | Occupation | 1 | 2 | Google image2002 | OSM vector map2020 |
| Shopping | Department store and shopping center | 10 | 41 | Map of Nanning 2000 | Amap2020 |
| Health | Hospital(2A) | 18 | 31 | Map of Nanning 2000 | Amap2020 |
| Park | Park and amusement park at district-level and above | 15 | 49 | Map of Nanning 2000 | Amap2020 |
| culture | Library, museum of science, technology and cultural | 10 | 13 | Map of Nanning 2000 | Amap2020 |
| Index | Unit | 2000 | 2020 | ||||||
|---|---|---|---|---|---|---|---|---|---|
| Min | MAX | Mean | Std. | Min | MAX | Mean | Std. | ||
| dis | M | 18.06 | 2032.32 | 327.45 | 271.98 | 25.59 | 1426.49 | 215.64 | 135.44 |
| Di | M | 2364.82 | 50,965.53 | 16,236.31 | 8705.04 | 5928.22 | 71,742.41 | 20,633.19 | 9917.53 |
| Ti | Min | 17.78 | 262.41 | 84.72 | 42.22 | 27.03 | 272.04 | 78.31 | 32.75 |
| Di0 | M | 329.32 | 11,877.73 | 4506.93 | 2360.90 | 259.04 | 21,229.14 | 6417.42 | 4158.20 |
| Ti0 | Min | 3.57 | 59.47 | 21.92 | 10.81 | 3.11 | 74.35 | 20.43 | 10.51 |
| Di1 | M | 175.75 | 11,350.10 | 3648.29 | 2392.55 | 182.99 | 13,842.91 | 2686.59 | 1909.44 |
| Ti1 | Min | 1.96 | 58.72 | 18.60 | 10.85 | 2.20 | 42.86 | 11.98 | 6.37 |
| Di2 | M | 172.22 | 8891.72 | 2073.17 | 1336.62 | 192.94 | 12,941.68 | 2713.47 | 1927.56 |
| Ti2 | Min | 2.07 | 45.69 | 12.60 | 6.83 | 2.32 | 41.71 | 12.06 | 6.02 |
| Di3 | M | 192.71 | 11,562.04 | 3011.83 | 2291.05 | 91.23 | 14,253.85 | 3085.10 | 1882.29 |
| Ti3 | Min | 2.29 | 57.23 | 16.29 | 10.05 | 1.09 | 50.69 | 14.85 | 7.51 |
| Di4 | M | 0.00 | 10,464.48 | 2950.54 | 1989.45 | 139.50 | 22,540.60 | 5730.61 | 3812.03 |
| Ti4 | Min | 0.00 | 51.79 | 15.23 | 8.81 | 1.67 | 80.71 | 18.99 | 10.45 |
| HFD (km) | HFT (min) | |||||||||||
|---|---|---|---|---|---|---|---|---|---|---|---|---|
| HFD | HFD0 | HFD1 | HFD2 | HFD3 | HFD4 | HFT | HFT0 | HFT1 | HFT2 | HFT3 | HFT4 | |
| 2000 | 18.99 | 5.22 | 4.46 | 2.30 | 3.58 | 3.39 | 99.36 | 25.50 | 22.43 | 14.28 | 19.21 | 17.69 |
| 2020 without subway | 21.17 | 6.82 | 2.86 | 2.88 | 3.06 | 5.55 | 103 | 30.32 | 14.64 | 14.79 | 17.22 | 26.02 |
| 2020 with subway | 24.41 | 7.82 | 3.11 | 3.24 | 3.42 | 6.83 | 91.71 | 24.15 | 13.88 | 14.05 | 16.96 | 22.67 |
| Threshold | 2000 | 2020 | ||||
|---|---|---|---|---|---|---|
| RLA (m2) | Coverage Rate of RLA (%) | Number of Residential | RLA (m2) | Coverage Rate of RLA (%) | Number of Residential | |
| Dis ≤ 400 m | 14,065,295.37 | 65.70 | 1006 | 59,540,425.1 | 87.88 | 2329 |
| Dis ≤ 600 m | 17,619,242.4 | 82.30 | 1184 | 65,671,390 | 96.93 | 2473 |
| Dis ≤ 800 m | 19,051,584.8 | 88.99 | 1253 | 67,212,790 | 99.21 | 2513 |
| Dis ≤ 1200 m | 20,265,924.9 | 94.66 | 1311 | 67,703,188 | 99.93 | 2530 |
| Sum | 21,409,262.7 | 1336 | 67,749,441 | 2531 | ||
Publisher’s Note: MDPI stays neutral with regard to jurisdictional claims in published maps and institutional affiliations. |
© 2022 by the authors. Licensee MDPI, Basel, Switzerland. This article is an open access article distributed under the terms and conditions of the Creative Commons Attribution (CC BY) license (https://creativecommons.org/licenses/by/4.0/).
Share and Cite
Le, J.; Ye, K. Measuring City-Level Transit Accessibility Based on the Weight of Residential Land Area: A Case of Nanning City, China. Land 2022, 11, 1468. https://doi.org/10.3390/land11091468
Le J, Ye K. Measuring City-Level Transit Accessibility Based on the Weight of Residential Land Area: A Case of Nanning City, China. Land. 2022; 11(9):1468. https://doi.org/10.3390/land11091468
Chicago/Turabian StyleLe, Jianming, and Kunhui Ye. 2022. "Measuring City-Level Transit Accessibility Based on the Weight of Residential Land Area: A Case of Nanning City, China" Land 11, no. 9: 1468. https://doi.org/10.3390/land11091468