Article

Geospatial Analysis and Land Suitability for “FloodWise” Practices: Nature-Based Solutions for Flood Mitigation in Eastern, Rural North Carolina

1
Coastal Dynamics Design Lab, Department of Landscape Architecture and Environmental Planning, North Carolina State University, Raleigh, NC 27695, USA
2
Department of Forestry and Environmental Resources, North Carolina State University, Raleigh, NC 27695, USA
*
Author to whom correspondence should be addressed.
Land 2022, 11(9), 1504; https://doi.org/10.3390/land11091504
Submission received: 7 July 2022 / Revised: 30 August 2022 / Accepted: 1 September 2022 / Published: 7 September 2022

Abstract

:
As the global climate continues to change, extreme weather events such as hurricanes and heavy rainfall are becoming more frequent. Subsequently, flooding and standing water disrupt and negatively impact many communities. The use of nature-based solutions (NBS) is an innovative and sustainable approach to flood mitigation. Geospatial research and applications have developed rapidly to identify and map broad regions in the world, as well as specific locations for NBS. We conducted a geospatial analysis in ArcGIS Pro to identify areas where NBS, referred to as “FloodWise” practices in this study, could be sited in the North Carolina Coastal Plain to strategically reduce flooding and provide water quality and habitat improvement. The study provides a spatially explicit application of integrated remote sensing, scientific and professional knowledge, and extant databases to screen diverse variables and identify potential specific NBS opportunities and sites. The practices modeled in this study are wetland restoration, afforestation, agroforestry, “water farming” (which uses a combination of dry dams and berms), and stream restoration. Maps of specific areas and tracts in the county for the NBS practices in Robeson County, North Carolina were developed based on the land ownership size, biophysical characteristics, current land uses, and water management opportunities. Land suitability locations revealed in these maps can be used in future resilience planning initiatives to reduce floodwaters on North Carolina’s rural landscapes. The geospatial analysis methodologies employed in this study can be followed to model NBS locations for flood reduction and water storage opportunities in other counties in Eastern North Carolina or other regions with similar topographies and land-type characteristics.

1. Introduction

Earth’s temperatures are increasing mainly due to anthropogenic activities and emissions. In turn, global climatic events are rapidly changing, and are causing intense hazards such as hurricanes and extreme storms [1,2,3]. Such frequent, unforeseen, and intense hurricanes and rain events extensive flooding, economic and infrastructure losses, and the displacement of residents [4]. Flooding is one of the most dangerous and common natural hazards worldwide as it has been the cause of human deaths and injuries, destruction of infrastructure, the spread of infectious diseases, and many other prolonged consequences to human societies and ecosystems [5,6,7,8].
The International Union for Conservation of Nature (IUCN) defines NBS as “actions to protect, sustainably manage, and restore natural or modified ecosystems that address societal challenges effectively and adaptively, simultaneously providing human well-being and biodiversity benefits” [9]. Many studies across the globe have found that NBS are widely beneficial for stormwater management and flood mitigation efforts by altering or restoring landscape features [10,11,12], and have especially demonstrated reduced stormwater impacts on rural, agricultural land [13]. NBS support sustainable flood management (as opposed to “gray” infrastructure) by decreasing stormwater runoff amounts and velocity, increasing groundwater infiltration, and enhancing water quality [14].
Nature-based solutions (NBS) work with natural landscapes for various ecosystem services other than flood reduction, such as climate regulation (i.e., regulating services), clean water resources (i.e., provisioning service), and nutrient cycling and soil formation (i.e., supporting service) [15]. Furthermore, they are cited as “an essential component of the overall global effort to achieve the goals of the Paris Agreement of Climate Change” and aid in creating climate-resilient communities [16].

1.1. Prior Geospatial Research

Geospatial research and applications from the global to a local scale have developed rapidly to identify and map broad regions in the world as well as specific locations for NBS. For example, Chausson et al., 2020 [17] mapped the effectiveness of nature-based solutions for climate change adaptation at the global scale and reviewed most of the existing literature on locations and practices for NBS. NBS methods usually offered more synergies than drawbacks in reducing adverse climate impacts and were as effective as traditional built solutions. More practices have been implemented in the Global North than in the Global South, despite more vulnerability in the South.
Solheim et al., 2021 [18] summarized the use of 13 NBS practices such as flood control, erosion, rockfalls, and avalanches in rural landscapes in Norway, Italy, Spain, France, and Germany that were funded by the new EU PHUSICOS project. These EU pilot studies involve an extended process of applications and review for funding. Project evaluation criteria notably include risk reduction, technical feasibility, co-benefits, effectiveness, efficiency, negative impacts, participatory process, and EU policy compliance.
Pristeri et al., 2021 [19] performed an applied analysis of mapping and classifying public green spaces in Padua, Italy, for spatial planning policies, using GIS and a normalized difference vegetation index (NDVI), a topographic database, UGS map of four sample areas, and a cadastral database. Pittman et al., 2022 [20] provided a method for rapid site selection to prioritize coastal seascapes for nature-based solutions to mitigate climate change and biodiversity and provide socio-economic benefits. They developed a spatially explicit, integrative, and culturally relevant ecosystem-based site selection n process for NBS consideration in the United Arab Emirates.
Several other recent studies have examined the application of remote sensing, mapping, and land suitability for NBS solutions for flood control. These identify likely flooding areas [13], land use planning applications [21], cropland flooding impacts [22], and ecosystem services [23]. Mubeen et al., 2021 [24] develop a relevant methodology of suitability mapping for NBS to reduce flooding and provide multiple benefits in the Tamnavia river basin, Serbia. They used ESRI ArcMap software to map suitability for four NBS interventions of floodplain restoration, detention basins, retention ponds, and river widening. This brief review of the global situation provides context for our research and the development of methods to identify suitable locations for NBS practices in rural North Carolina.
North Carolina’s Coastal Plain, also referred to as Eastern North Carolina, has a long history of devastating hurricanes, including, most recently, Hurricane Matthew (2016), Hurricane Florence (2018), and Hurricane Dorian (2019). Most of the North Carolina Coastal Plain consists of flat, rural, and agricultural lands (Figure 1), and riverine flooding impacts have caused billions of dollars in crop and livestock losses [4,25,26]. Additionally, industrial and agricultural facilities inundated with flood water can release contaminants into the local water systems, creating concern for long-term health effects on local ecosystems [10].

1.2. Research Context and Region
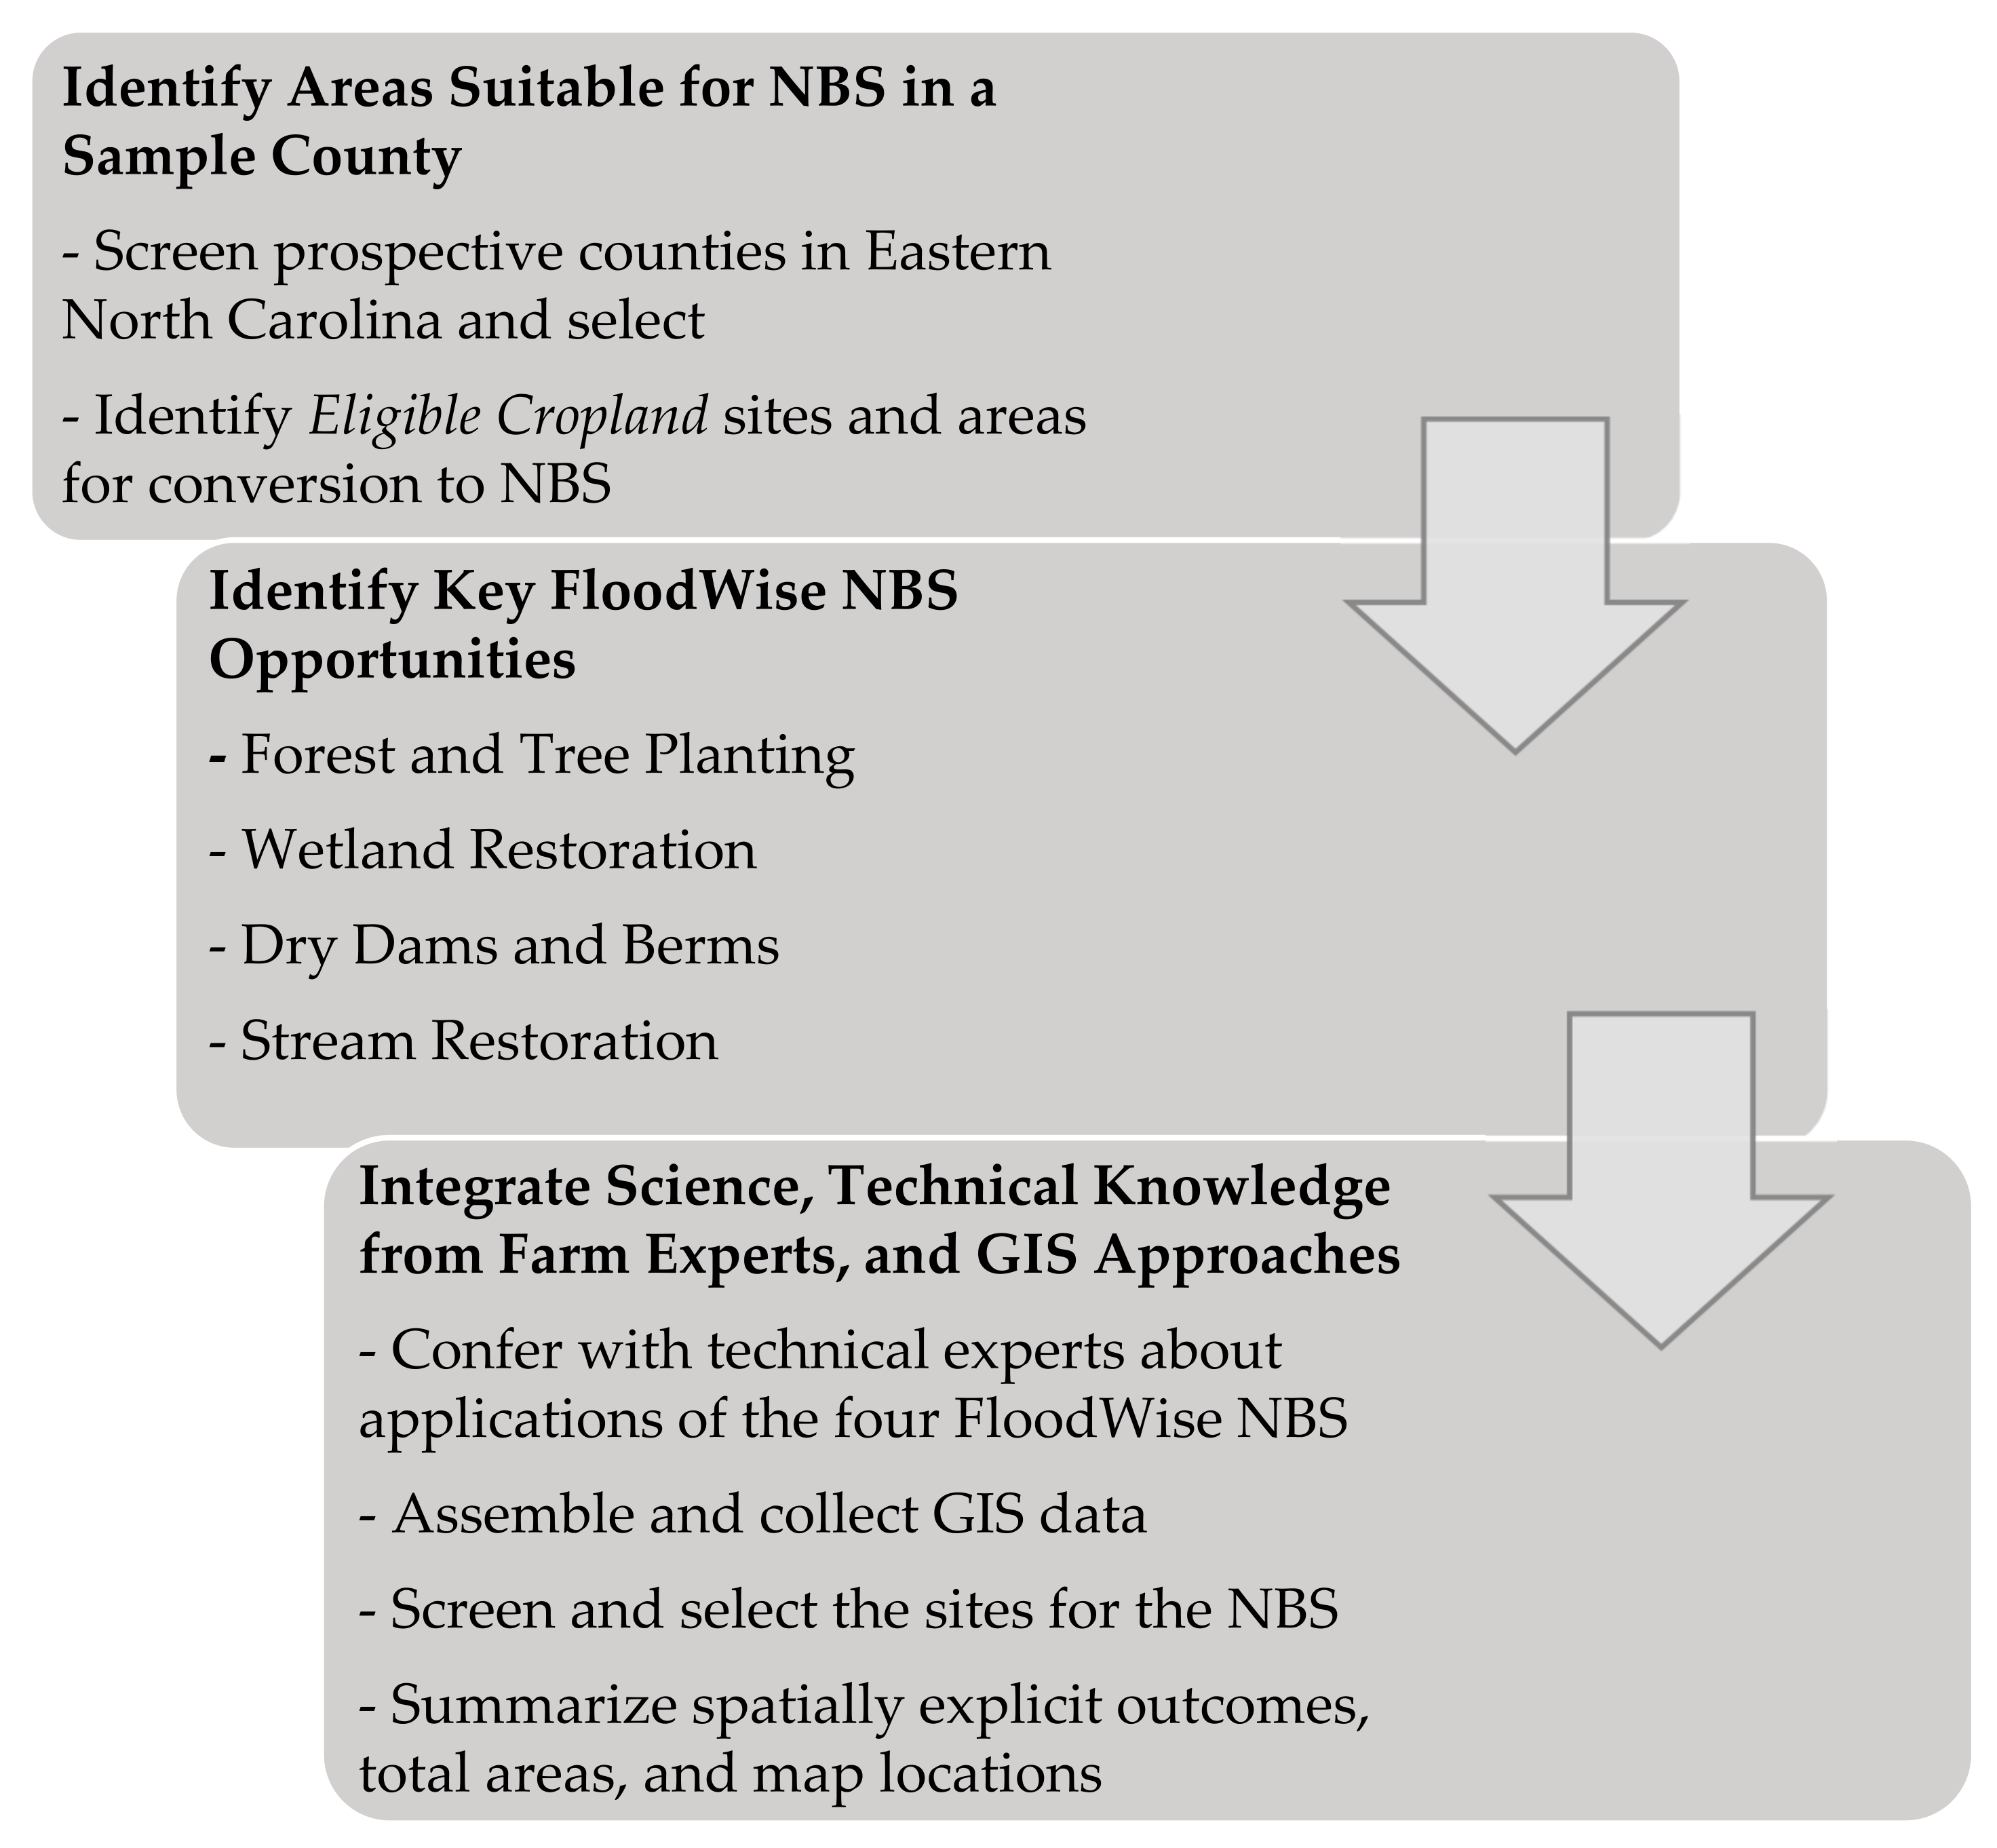
Our research team has pioneered a pilot program in Eastern North Carolina called “FloodWise.” The FloodWise program would provide incentives for local landowners to adopt certain NBS on their properties to improve flood mitigation, water quality, and other landowner market and non-market benefits [27,28]. The proposed program would offer financial payments and technical assistance to adopt NBS on private agricultural and forested properties in Eastern North Carolina. The program personnel would collaborate closely with local community members, groups, elected officials, and landowners in Eastern North Carolina to understand flood mitigation needs and opportunities and their opinions about implementing NBS, as well as understand the costs of implementing and managing the practices [27].
In previous FloodWise research, we identified the ten most effective NBS practices for flood mitigation and reduction in rural, Eastern North Carolina [28]. These ten NBS included agricultural practices of (1) cover cropping/no-till farming, (2) hardpan breakup, (3) pine or (4) hardwood afforestation, and (5) agroforestry; wetland and stream practices of (6) grass and sedge wetlands and earthen flood control structures in water retention basins, (7) forest wetland banks, and (8) stream channel restoration; and structural solutions of (9) water farming with dry dams and berms and (10) land drainage and water retention with tiling.
An essential requirement for implementing NBS is identifying suitable locations to implement the different practices. Geospatial land suitability analysis allows us to consider many landscape characteristics, overlay the various spatial data layers, and define possible scenarios to aid land-use planning decision-making [21]. Similar studies used Geospatial Information Systems (GIS) to support the location and implementation of NBS (e.g., [13,21,22,23]).
Drawing from the preceding approaches and our expertise in synthesizing complex spatial data and existing databases, we developed a similar methodology as conducted in these studies, as well as similar geospatial criteria, such as slope, soil type, and land use to identify sites where NBS could be employed. This paper outlines the approaches and processes we used to identify areas in Eastern North Carolina that could be used to develop NBS practices to reduce flooding on farms and downstream communities. The methods and results presented here can provide a prototype for similar efforts to identify and install NBS in the U.S. South Coastal Plain or other locations to help reduce climate change’s adverse impacts.
This paper augments some of the preceding research and focuses on the methods and applications for the integration of remote sensing, Geographic Information (GIS) Systems, and expert and professional knowledge and inputs in order to develop spatially explicit maps to identify and select tracts that can be used for NBS practices in rural North Carolina. The objective of this effort was to outline the methods that can be used to select NBS locations in the state, so the development of the methods, as well as our summary of their results, are commensurate outputs from this research. Accordingly, both are covered in detail here.
Robeson County, NC is located along the South Carolina border and has a total land area of 949 square miles (607,000 acres (ac) or 246,000 hectares (ha)), with predominantly flat to rolling topography and extensive riverine wetlands typical of the Coastal Plain [29] (Figure 2). With a 2020 population of approximately 116,000, Robeson is considered one of North Carolina’s 78 rural counties [30,31].
For decades, the County has been adversely affected by the harsh impacts of chronic storms. More recently, the County and its residents have been affected by Hurricane Matthew (2016), Hurricane Florence (2018), and Hurricane Dorian (2019), which caused excessive riverine flooding of the Lumber River. Communities in the County have dramatically suffered from substantial revenue losses from crops and livestock yields [32].
The United States Department of Agriculture (USDA) National Agricultural Statistics Service (NASS) 2017 publication reported that approximately 43% of Robeson’s total land area was used for agriculture, with 722 total farms averaging 365 acres each [34]. Livestock and poultry products comprise approximately 73% of farm sales, with sales from crop production accounting for 27% [34]. To further break down crop sales, grains, oilseeds, tobacco, and cotton are the top-selling agricultural commodities, making up over 86% of Robeson’s annual crop sales [34]. Forests comprise about 277,000 ac (112,000 ha) of the county or about 46% of the land cover [35].

2. Methods

The overall goal of this study was to identify suitable areas where NBS, which we also refer to as “FloodWise” practices, can be implemented in Eastern North Carolina at a spatial resolution high enough to identify individual parcels and farms for further site-level analysis. To achieve this, we drew from prior FloodWise research efforts that identified the best NBS practices for Eastern North Carolina [28]; conferred with scientists and farm technical service providers; and used ArcGIS Pro software to assess several primary landscape characteristics, including flood-prone location and history of flooding, soil characteristics, and low slopes. We identified a region for study and the agricultural landforms that could be used for NBS; identified the best NBS practices for the region; integrated knowledge of farms and science with geospatial data and software; and selected the best sites for the chosen NBS practices (Figure 3). Parcel size, ownership information, existing infrastructure, and crop production history were also incorporated into the analysis to better assess farmland suitability for FloodWise practices. As noted, specific FloodWise practices that were mapped included (a) wetland restoration, (b) tree and forest planting/agroforestry, (c) “water farming” (installation of dry dams and earthen berms), and (d) stream restoration (Table 1).
Other FloodWise practices identified as effective solutions for flood management in Eastern North Carolina are no-till, cover crops, hardpan breakup, and drainage control structures [28] (Table 1).

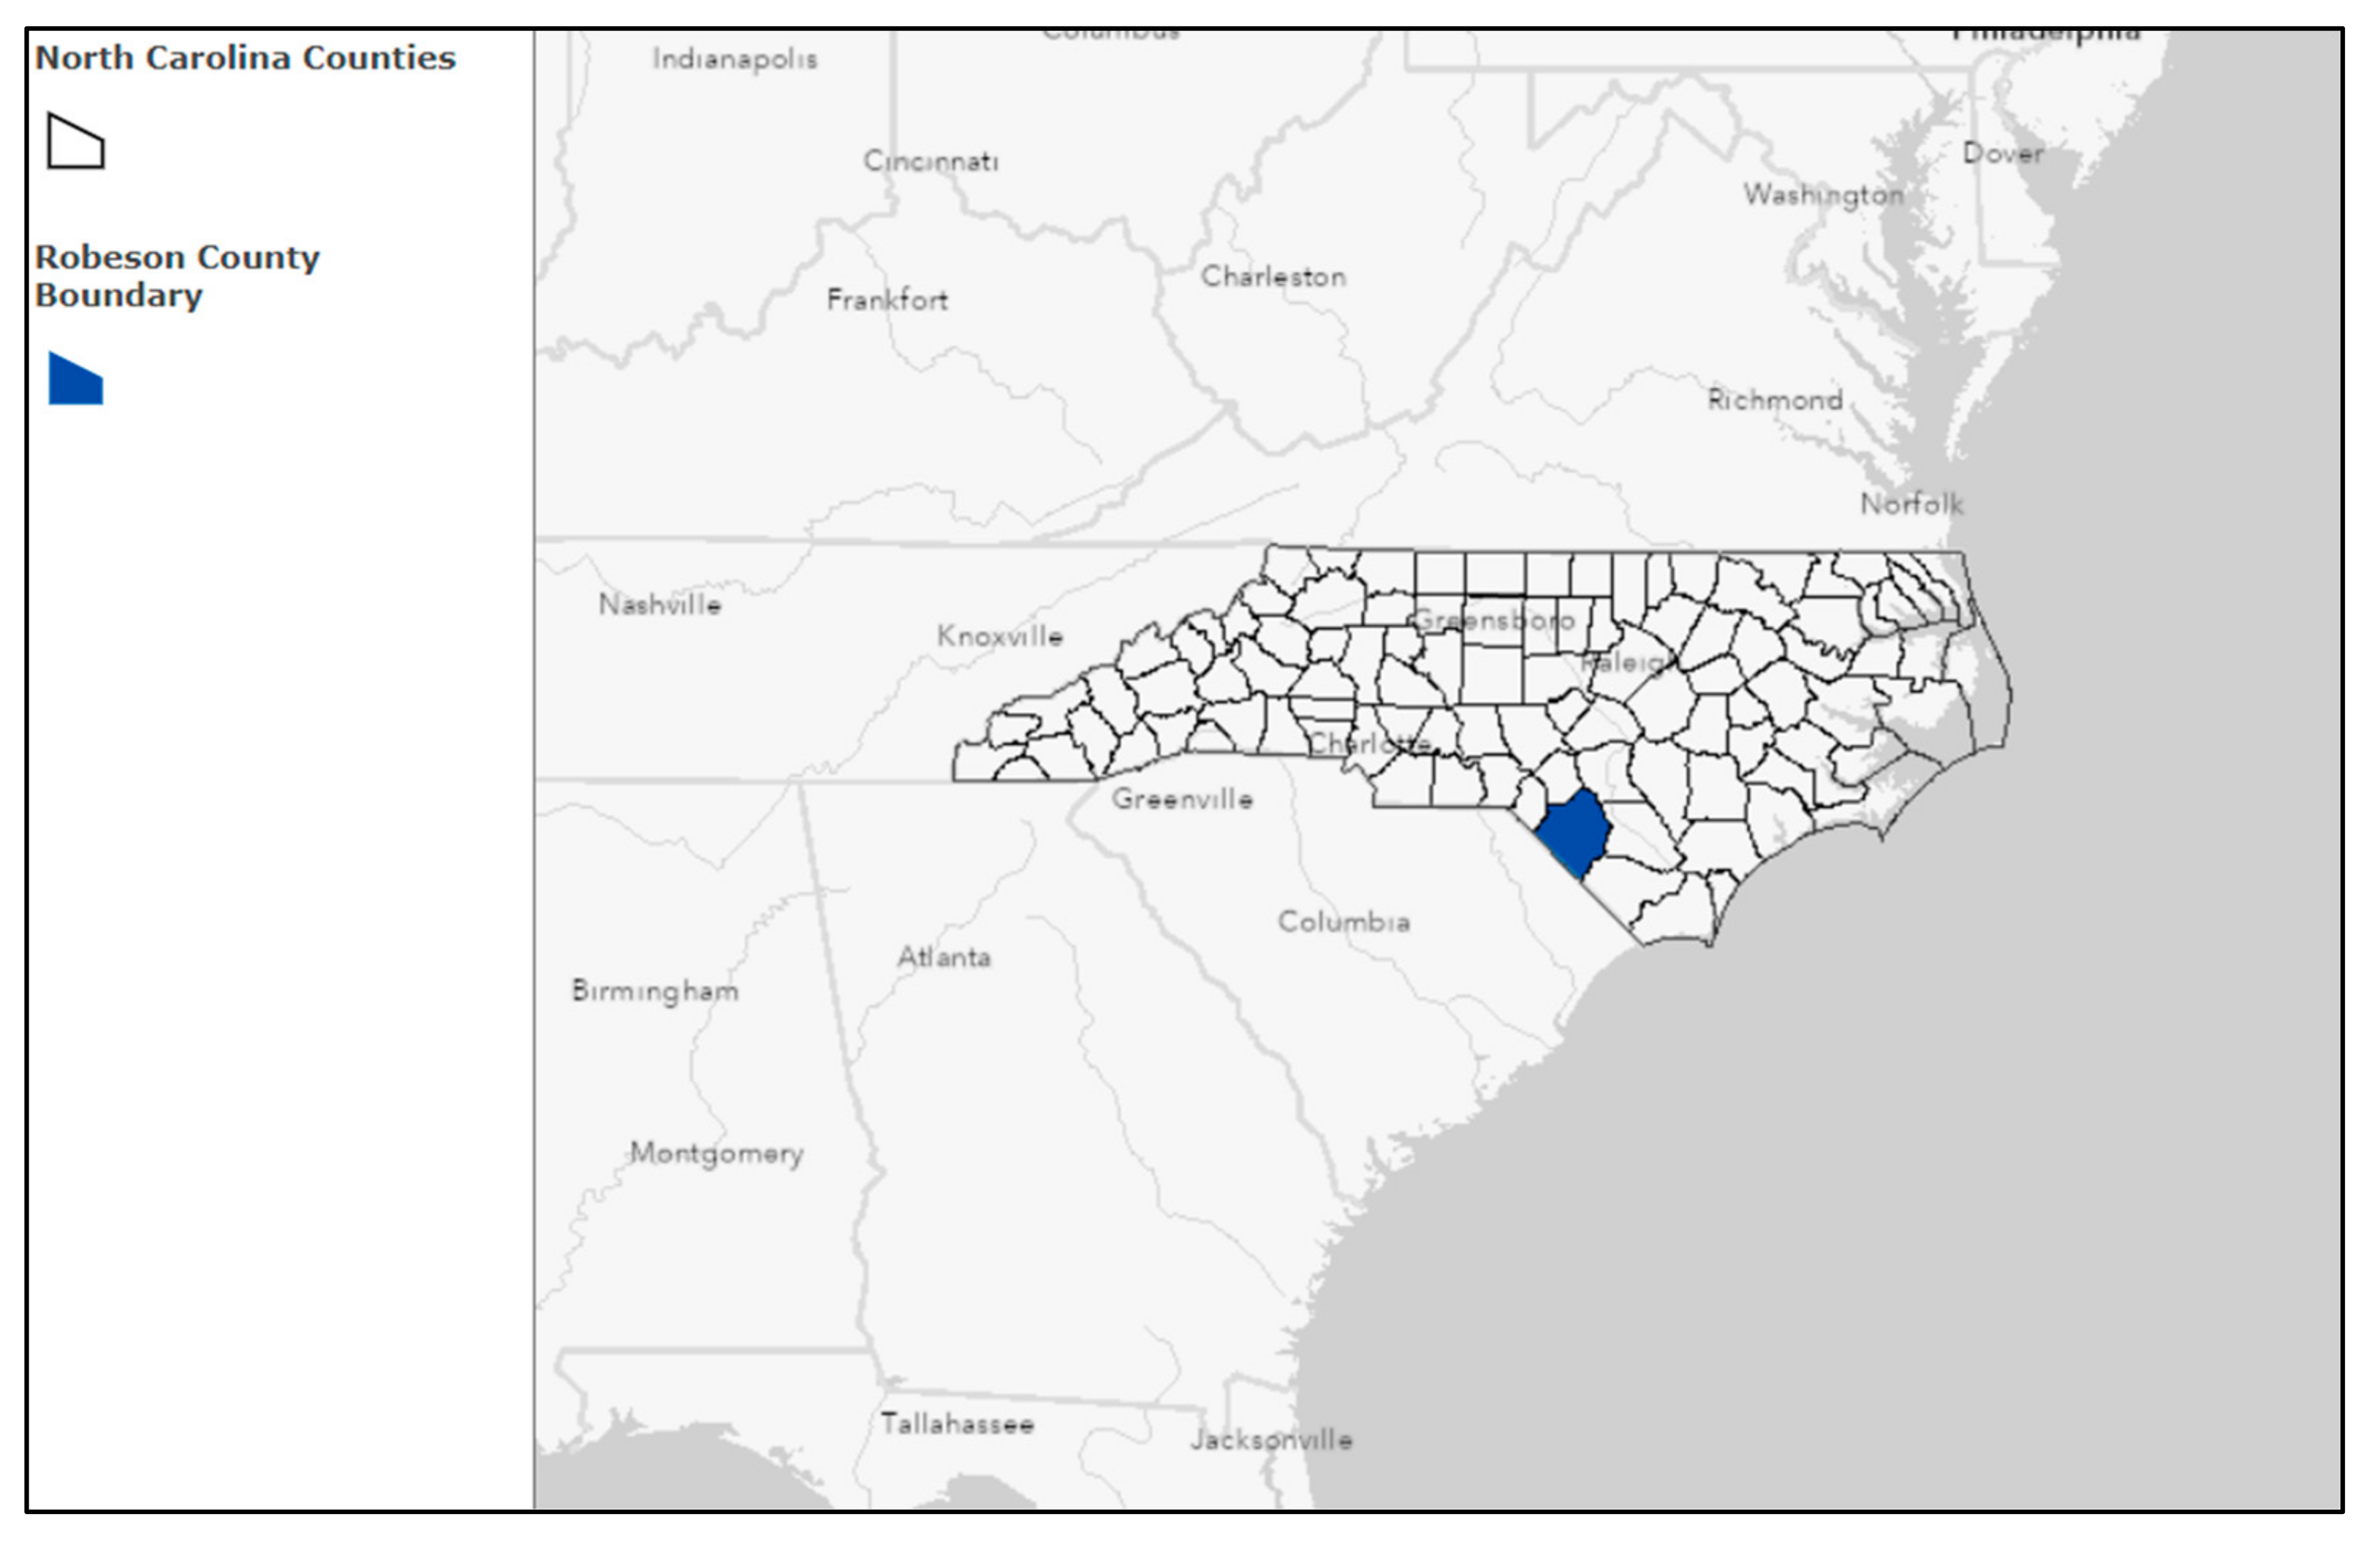
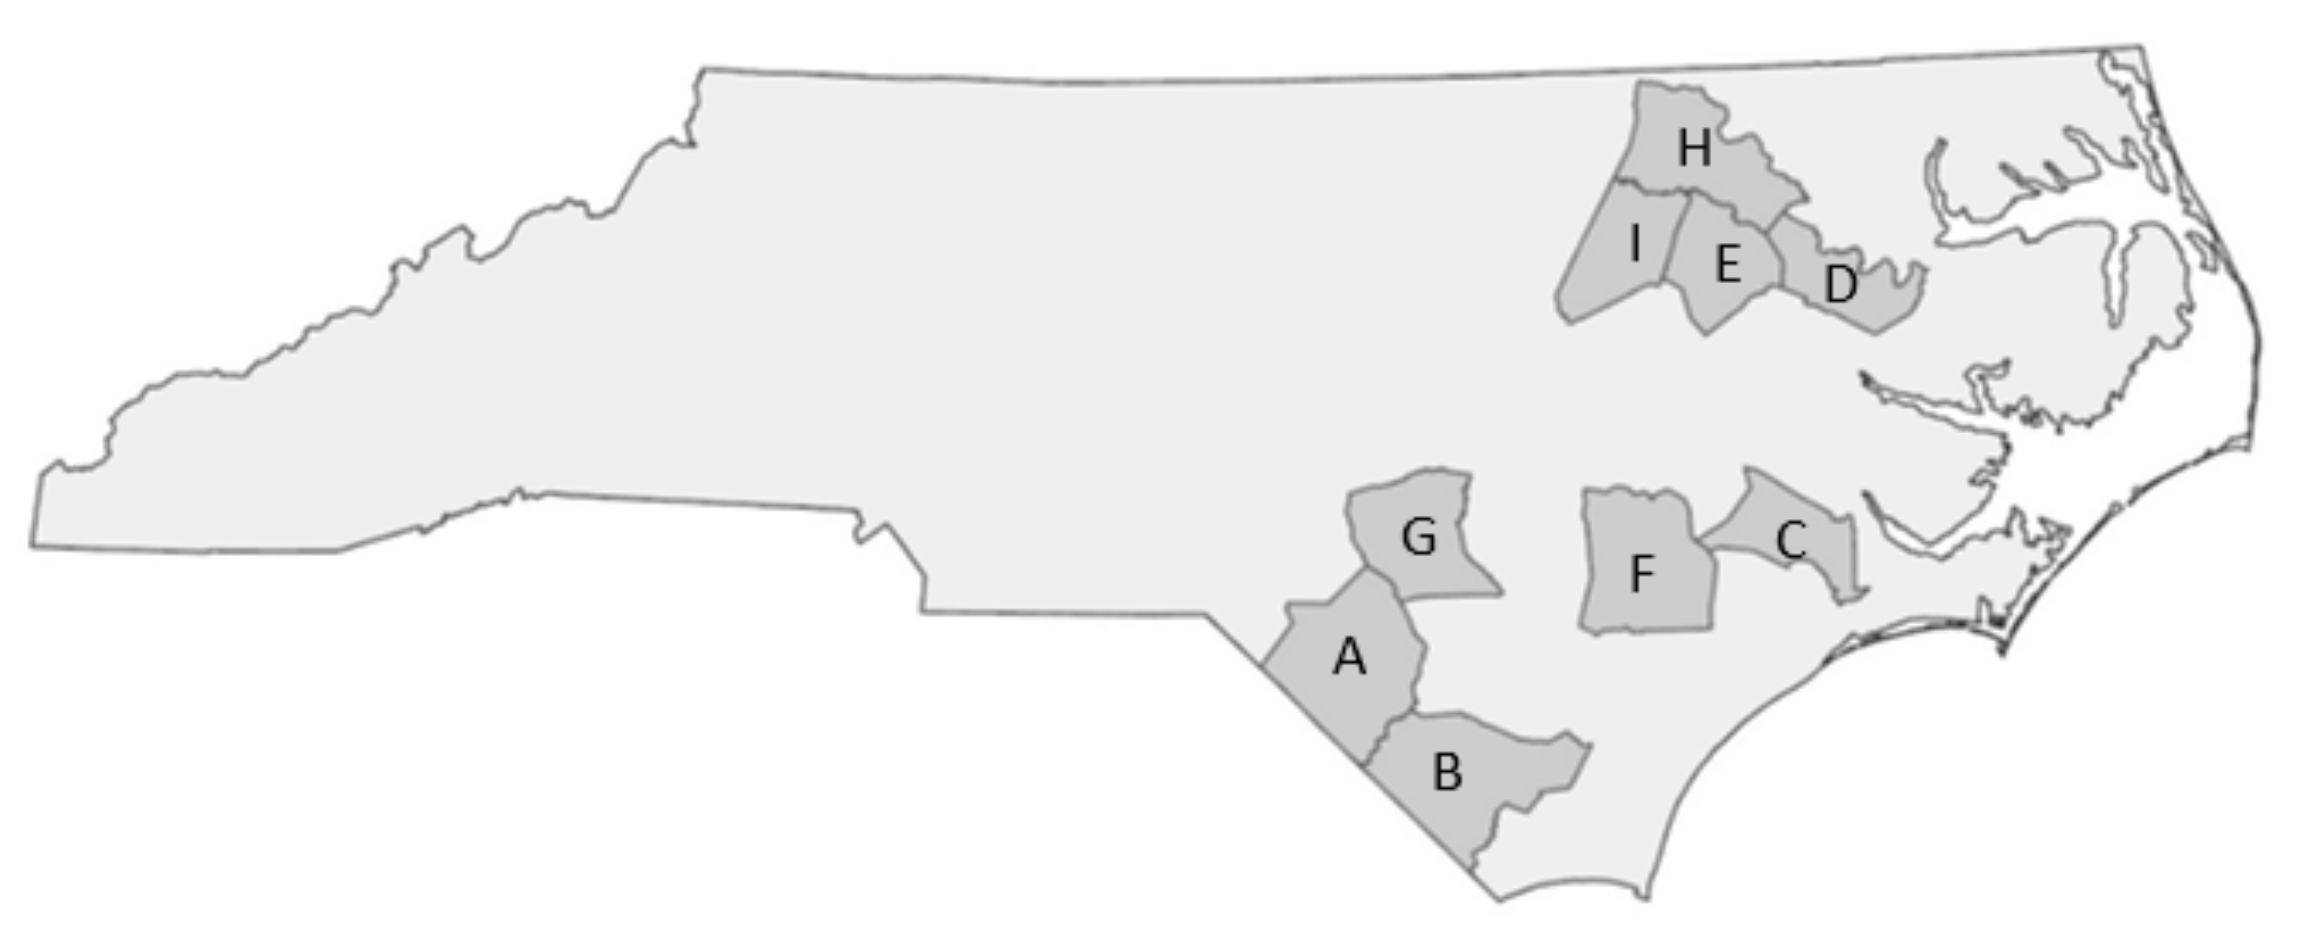
2.1. County Screening in Eastern North Carolina

During the project’s initial phase, we used geospatial analysis to narrow down a study area to one of nine possible counties in Eastern North Carolina as a case study site: Columbus, Cumberland, Duplin, Edgecombe, Halifax, Jones, Martin, Nash, and Robeson. These counties were considered based on their location in Eastern North Carolina, history of flooding, predominantly agricultural economy, and outreach history with study team members (Figure 4).
Six environmental criteria were mapped, and the associated acreage of each criterion was summarized by county: (1) slopes less than 2%; (2) total cropland; (3) cropland with low slopes; (4) cropland with low-productivity soils; (5) cropland that was inundated by recent hurricanes; and (6) managed (planted) timber areas (Table 2). All data sources and database descriptions used in this study are shown in Appendix A.
Robeson, Jones, and Edgecombe Counties had consistently high results for each mapped environmental factor, indicating that these areas likely presented greater opportunities to develop FloodWise NBS for flood mitigation. Robeson County was selected as the focus area for further phases of the FloodWise study based on existing working relationships and alignments with the study team, local staff capacity for delivering related engagement activities, and an existing interest and familiarity with NBS among the agricultural community.

2.2. Geospatial Criteria and Mapping for FloodWise Practices in Robeson County, NC

The crux of this research was to identify areas where NBS could be applied in Robeson County, North Carolina. This essentially required detailed identification and mapping of sites with eligible cropland that could be converted to NBS. These selection and mapping methods are reported here to document replicable methods for other NBS research and development efforts.

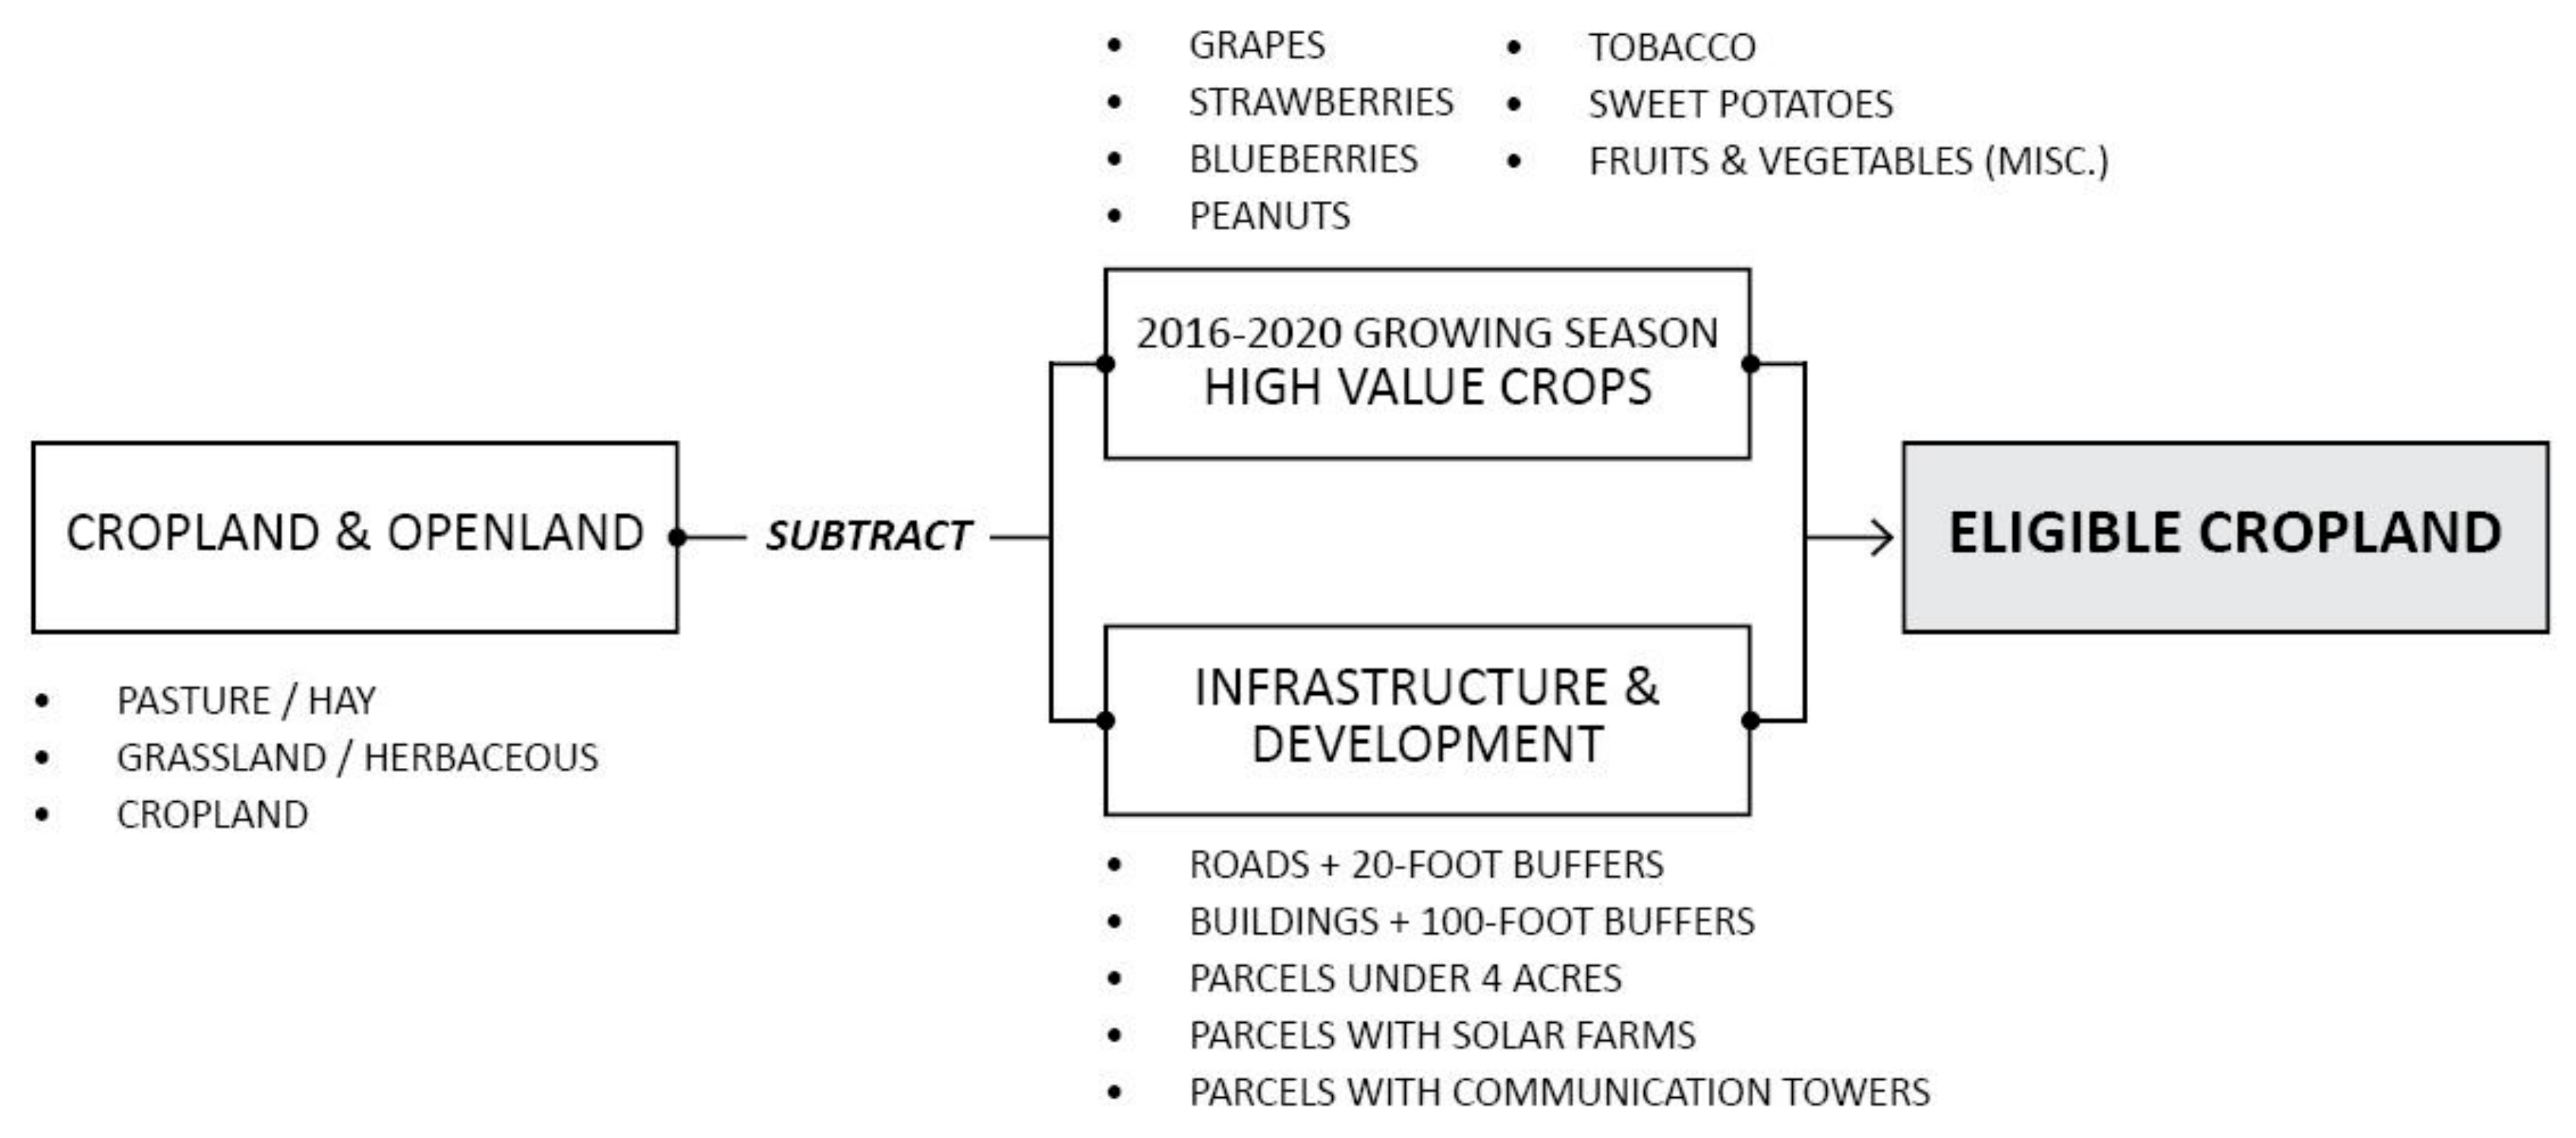
2.2.1. Eligible Cropland

While site suitability for each of the various FloodWise Practices requires a unique set of landscape characteristics, we identified a common set of initial criteria required for a farm to be considered an eligible site for NBS (hereafter referred to as Eligible Cropland). Through a geospatial overlay analysis process using ArcGIS Pro, Eligible Cropland was identified by excluding high-value crops and existing infrastructure from all existing cropland and open land in Robeson County. Prior to analysis, all datasets were projected to the WGS 1984 UTM Zone 17N coordinate system and clipped to the Robeson County boundary.
Cropland and Open Land: Open land suitable for most FloodWise practices include National Land Cover Database (NLCD) land classes of Grassland/Herbaceous, Pasture/Hay, or Cultivated Crops. Based on the Anderson Land Cover Classification System (1976), the classification system used by the NLCD defines Grassland/Herbaceous as areas dominated (greater than 80% of total vegetation) by graminoid or herbaceous vegetation [36]. These areas are not subject to intensive management such as tilling but can be utilized for grazing. Pasture/Hay areas contain grass, legumes, or a mixture planted on a perennial cycle for grazing or producing seed or hay crops. Cultivated Crops areas contain annual and perennial crops where crop vegetation accounts for more than 20% of total vegetation, with all land being actively tilled [36].
High-Value Crops: Various fruits and vegetables, including peanuts, tobacco, sweet potatoes, grapes, strawberries, and blueberries, were identified as crops with higher profitability potential in Robeson County. The project team assumed that farmers growing crops with potential higher profitability would be less willing to participate in a payment program for establishing flood mitigation practices than those farmers that do not make as high profitability; therefore, areas identified as producing high-value crops between 2016 and 2020 were excluded from further consideration. High-value crop production areas were identified using the Cropland Data Layer, a nationwide dataset published annually by NASS that uses satellite imagery to estimate the acreage of major commodity crops [37]. High-value crop areas were extracted from each cropland dataset for 2016–2020 and merged into a single layer.
Existing Infrastructure: To minimize conflicts with existing infrastructure, areas within a 20-foot buffer of existing roads [38], areas within a 100-foot buffer of existing structures [39], all parcels used for solar energy generation [40], and all parcels containing communication towers [41] were excluded from further analysis (Appendix A). Additionally, areas with rural-residential land-use patterns were identified as posing a high potential for infrastructure conflicts. As a proxy for rural-residential land-use patterns, all parcels under four acres (1.6 ha) were excluded from further analysis. To create a new set of infrastructure layers to exclude through the overlay analysis process, all Robeson County roads [38] were buffered by 20 feet (6.1 m), then exported and converted to a raster dataset, and all Robeson County structures [39] were buffered by 100 feet (30.5 m), then exported and converted to a raster dataset. Parcels containing solar infrastructure and communication towers and parcels smaller than four acres were identified, then exported and converted to raster datasets.
Using the Raster Calculator, the raster layers representing the high-value crops, infrastructure buffers, parcels with solar or communications infrastructure, and parcels less than four acres were subtracted from the reclassified cropland and open land raster. In the resulting layer, areas where cropland and open land intersected with the conflicting layers were excluded from further consideration, and the remaining areas were determined to meet the criteria for Eligible Cropland. The Eligible Cropland layer was cleaned by reclassifying the values where pixels equaling ‘1′ represented Eligible Cropland, and pixels equaling ‘0′ represented all other land areas not included in further analysis (Figure 5). Areas identified through this preliminary analysis phase were used as the initial inputs for more refined, practice-specific spatial analysis.

2.2.2. Forest and Tree Planting (Afforestation)

Afforestation involves transitioning agricultural land from row crop or pasture production to forest lands, either actively managed for forest products or as a restoration activity. Agroforestry practices also fall into this category and integrate tree production with traditional row crop agricultural operations and livestock husbandry. Agroforestry practices may increase income for farmers, particularly on sites with poor soil [42]. Suitable sites for forest and tree planting were determined to have low-productivity soils, owned by a single entity, and consisted of at least five acres (2 ha) in area (Figure 6).
Low-Productivity Soils: Low-productivity soils were selected as a mapping criterion based on the assumption that farmers experiencing crop productivity issues due to poor soil conditions may be more willing to adopt this practice and may see farm revenue increases by transitioning from row crop production to forestry [43]. Soil data were derived from the USDA’s gSSURGO Gridded Soil Survey [44]. One of the attributes associated with the Soil Survey is the National Commodity Crop Productivity Index (NCCPI), a rating system of the estimated inherent capability of soils to produce crops without irrigation [44]. The NCCPI, which ranges from ‘0′ to ‘1′, was used as a proxy for soil productivity, and, for this study, low-productivity soils were defined as areas with an NCCPI value of less than ‘0.33′. A new raster layer representing low-productivity soils was created by reclassifying all soil areas with an NCCPI value below ‘0.33′.
Potential opportunities for afforestation were identified by overlaying low-productivity soils with the Eligible Cropland layer. Notably, one limitation of the USDA Soil Survey dataset is that the data are designed to describe patterns and trends at the landscape scale and are more useful for large-scale planning exercises than site-level analysis and decision-making. Therefore, the soil productivity rankings associated with the NCCPI may be appropriate to identify trends and relationships in soil productivity at a large scale but may lack the accuracy required to define boundaries separating low-productivity soils and higher-productivity soils. To mitigate this limitation, if any area of Eligible Cropland overlapped any area with low soil productivity, the entire Eligible Cropland area was determined to fulfill both requirements. Therefore, it could be further analyzed to assess suitability as an opportunity area. To not limit results to discrete areas of full intersection expected from a raster overlay analysis, after creating the low-productivity soils layer, we converted it from a raster dataset to a polygon dataset. The Eligible Cropland layer was also converted from a raster to a polygon dataset, and a spatial selection was run to identify and export all Eligible Cropland areas that intersected any portion of a low-productivity soil area.
Single Entity Ownership: Suitable land owned by one consistent owner or ownership group affords more opportunities to establish FloodWise practices than suitable land split across multiple parcels, each with a different owner or ownership group. Limiting opportunity areas to contiguous land with consistent ownership reduces the number of stakeholders and decision-makers, increasing the feasibility of FloodWise practice adoption. This means suitable land located on more than one distinct parcel can still meet the criteria for opportunity area identification if the parcels have a shared boundary and common ownership. To identify single-entity ownership, the parcels dataset was dissolved using the ‘owner name’ field to limit potential opportunity areas to single-entity ownership. In the resulting dataset, separate parcels with a shared boundary but common ownership were merged into one larger contiguous parcel, while the rest of the dataset remained unchanged. Using the Intersect tool, we merged the dissolved parcel dataset to combine parcel boundaries and associated attributes with the areas meeting the initial criteria.
5-acre Minimum: We determined that a five-acre (2 ha) minimum area was required for all FloodWise practices to be cost-effective to adopt and provide measurable flood reduction benefits. After calculating acreage, all five-acre or greater areas were selected and exported to a new dataset, representing opportunity areas for forest and tree planting.
Lowland vs. Upland Conditions: Appropriate forest species differ depending on lowland or upland planting locations, although the differences in elevation in low-lying Robson County are small. Pine species require adequate drainage, so they are better suited for slightly more upland areas. They also have better financial returns, so they are preferred when possible. Bottomland hardwoods are more suited for wetter, lowland areas, although some hardwoods will grow in most locations in the county. The FEMA 100-year and 500-year floodplains were used to approximate the locations of lowland areas. This criterion was not exclusionary in identifying opportunity areas but was used as an additional layer of information to enhance understanding of existing conditions and tree species suitability. The FEMA 100-year and 500-year floodplain layers were merged and intersected with the opportunity areas to identify lowland areas that would be more suitable for bottomland hardwood forest species. Other sites that could support forests well on slightly higher ground were designated as pine areas.

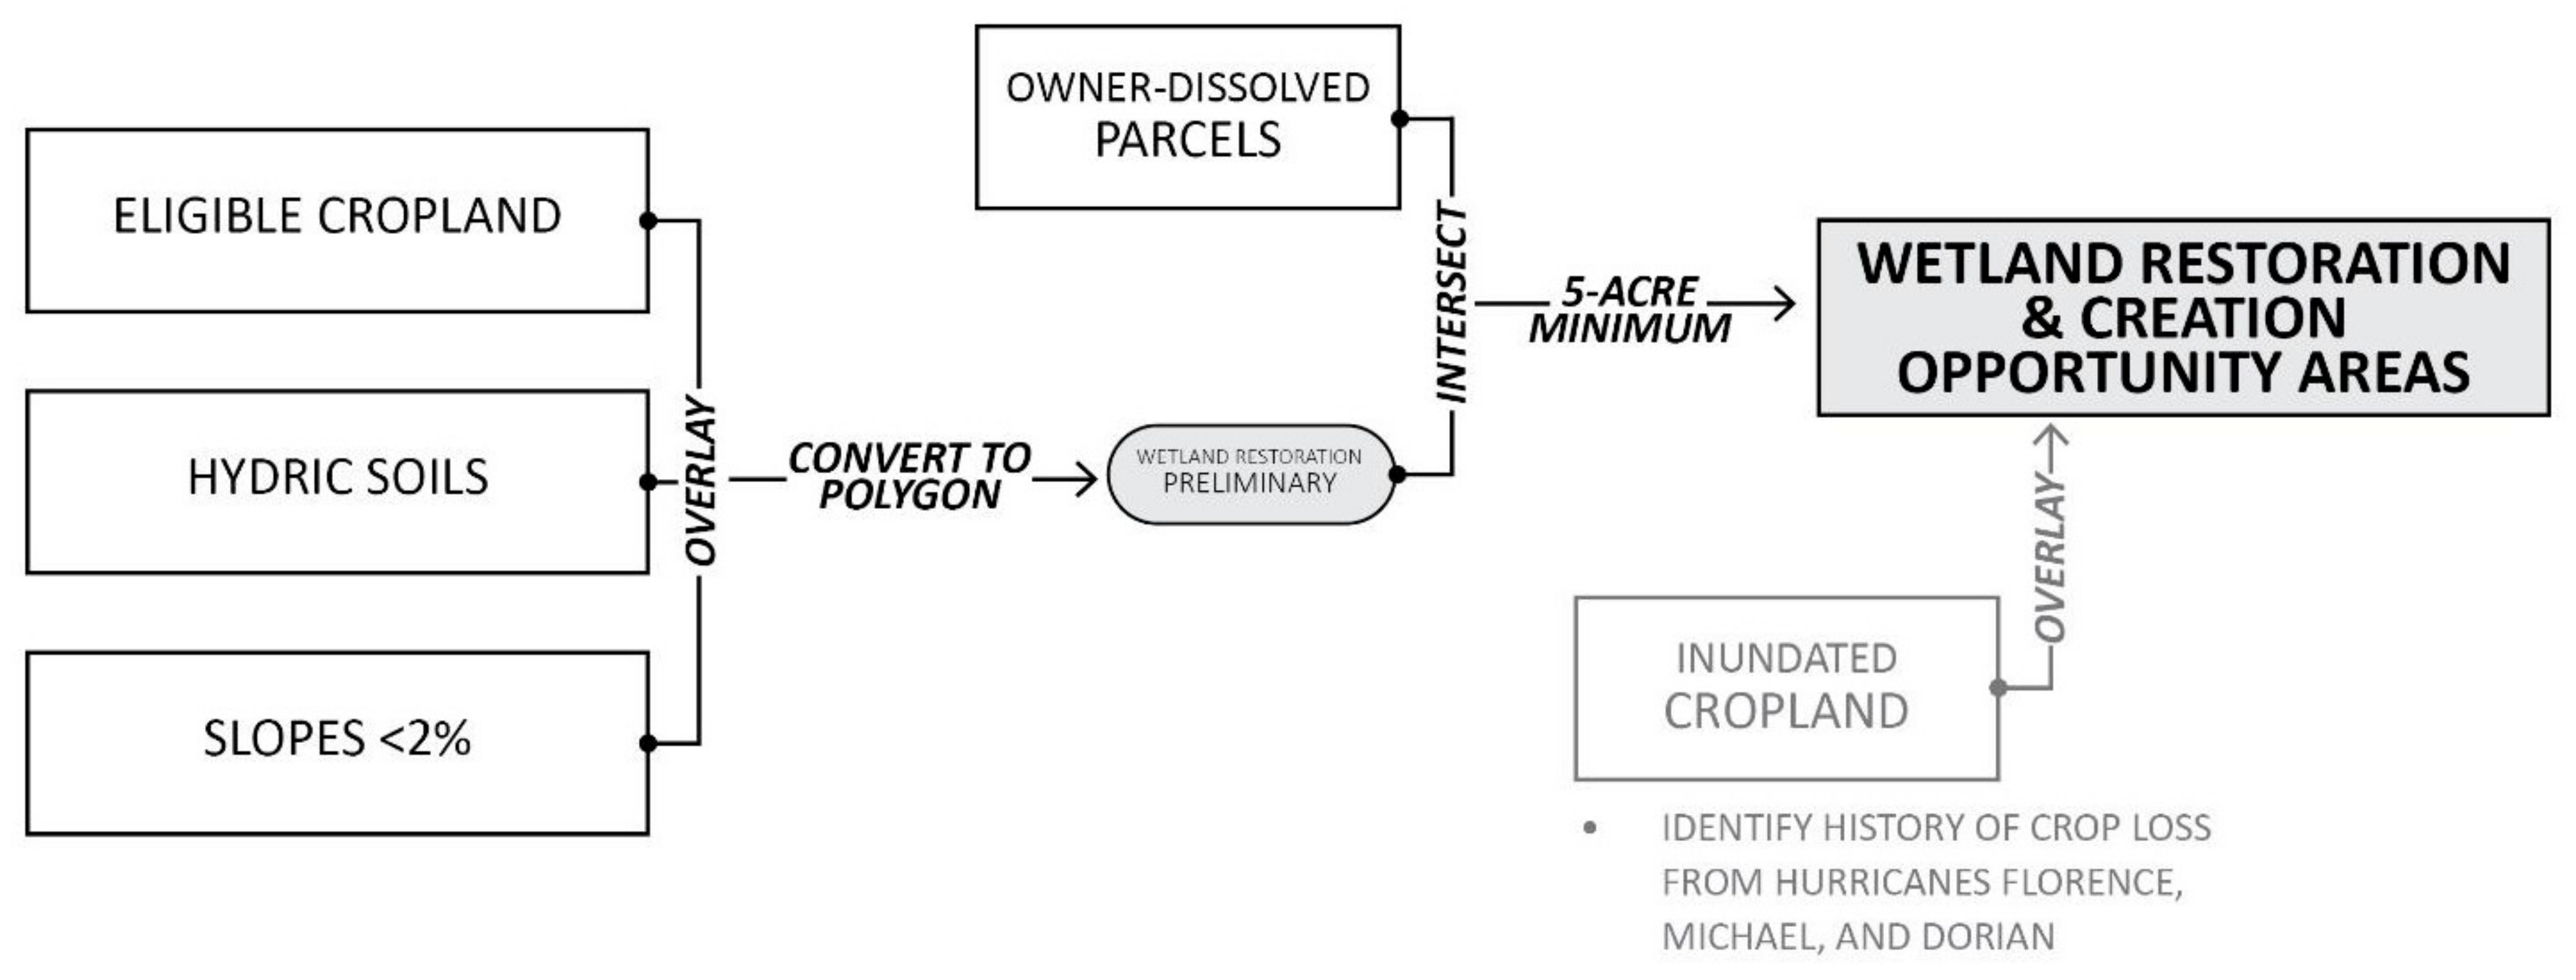
2.2.3. Wetland Restoration and Creation

Wetland restoration and creation involves re-establishing a wetland to its former state or creating a new wetland area designed to mimic the ecological functions of a natural wetland. Wetland restoration and creation scenarios involve permanently transitioning an agricultural area or open land to a more natural state and forfeiting all non-recreational land uses. For this analysis, we determined that sites suitable for wetland restoration or creation must have hydric soils, slopes below 2%, and single-entity ownership with a five-acre minimum. Because adoption of this practice may result in permanent farm revenue loss, we hypothesized that farmers’ willingness to participate would likely relate to their personal experience with crop loss from flooding [43,45,46,47]. Therefore, cropland inundation data from past major storm events was also included for review but not used as an exclusionary criterion.
Hydric Soils: The USDA defines hydric soils as soils that formed under conditions of saturation, flooding, or ponding long enough during the growing season to develop anaerobic conditions in the upper part [48], indicating that the soil developed in wetland conditions. Along with other environmental and hydrologic factors, a soil’s hydric rating is sometimes used to help define wetlands but is not sufficient on its own to identify wetland areas [49]. Furthermore, the presence of hydric soils may indicate a former wetland in areas where natural hydrology has been altered, such as inland areas drained for agriculture. Using soil data from the gridded Soil Survey Geographic Database (gSSURGO), a new layer was created by selecting and exporting soil polygons with a positive hydric rating, then converted to a raster.
Slopes below 2%: Water generally flows at slopes greater than 2% and pools at slopes less than 2%. Water storage is a critical function of wetlands which provides water quantity and quality benefits, including reducing soil loss and erosion, nutrient and sediment filtration, groundwater recharge, and floodwater storage. Areas with lower slopes are naturally better suited to store water, and likely will not require extensive structural alterations or interventions to facilitate water storage. A slope raster for Robeson County was generated from the clipped Statewide 20-foot Digital Elevation Model (DEM) produced by the North Carolina Flood Mapping Program [50]. The clipped dataset was reclassified to include only areas with slopes less than or equal to 2%.
To identify areas potentially suitable for wetland restoration and creation, we conducted an overlay analysis using the previously created Eligible Cropland layer, the hydric soils layer, and slopes less than or equal to 2% as the three main criteria. The resulting layer was converted to a polygon, intersected with the previously dissolved parcels dataset, and all areas five acres or greater were selected using the same methodology described in the previous section.
Cropland Inundation from Hurricanes: This criterion was not a factor in identifying opportunity areas but was used as an additional layer of information to enhance understanding of existing conditions and agricultural areas with verified flood inundation from hurricanes. Given the assumption that farmers would be more willing to adopt a practice such as wetland restoration if they have experienced losses from flooding, overlaying this information may help identify areas where engagement with landowners may be beneficial. Spatial data identifying cropland inundated from hurricanes and other disasters are produced through satellite remote sensing and published by the USDA’s National Agricultural Statistics Survey (NASS). For Robeson County, cropland inundation data was available as raster datasets for Hurricane Dorian (2019), Hurricane Michael (2018), and Hurricane Florence (2018). A combined dataset was created using the Raster Calculator, then converted to a polygon dataset and overlaid with the wetland restoration and creation opportunity areas (Figure 7).

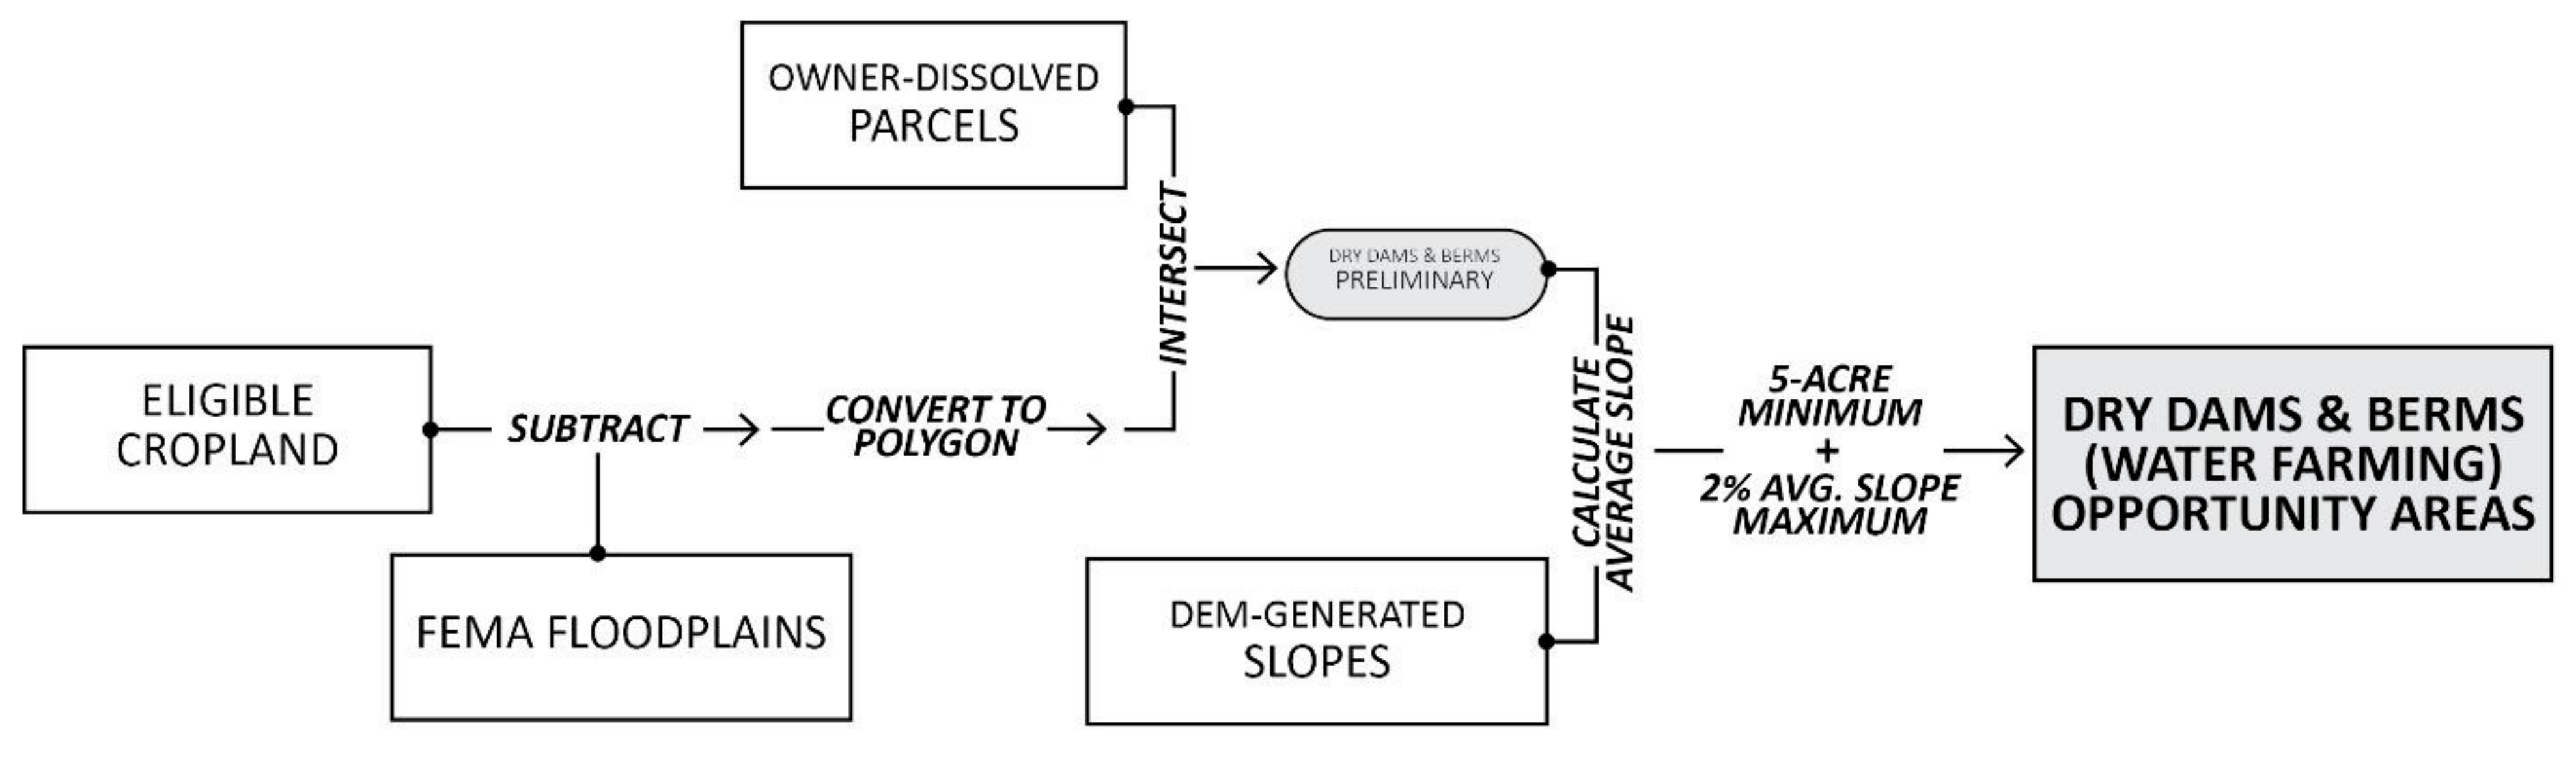
2.2.4. Dry Dams and Berms

Installing dry dams and berms creates a catchment area for the storage and controlled release of floodwaters, a practice also called water farming. Unlike wetland restoration as a flood reduction practice, crop production within the constructed catchment area is not impacted during dry times. Farm operations can continue on the land, but crops grown in the catchment area are completely inundated during flood events. Sites suitable for water farming were located outside of the floodplain with mean slopes below 2%, owned by a single entity, and at least five acres in area.
Location Outside Floodplain: This practice involves infrastructure construction that would not be appropriate in the floodplain due to the potential for negative hydrologic impacts and potential damage to the control structures by floodwaters. Additionally, floodplains already store floodwaters, so water farming practices in these locations are not expected to result in a net increase in water storage.
We conducted an overlay analysis to identify optimal areas for water farming using two initial criteria: the previously created Eligible Cropland layer and FEMA floodplains. To exclude floodplain areas from further consideration, the FEMA floodplains were merged, converted to a raster dataset, then subtracted from the initial Eligible Cropland layer. The resulting layer was converted to a polygon, intersected with the previously dissolved parcels dataset, and all areas five acres or greater were selected using the same methodology described in the previous sections.
Mean Slopes Below 2%: To successfully capture water in areas with steeper slopes, higher and more heavily engineered berms are required, limiting feasibility and cost-effectiveness. With the goal of high-volume water storage, farmland with lower slopes is more suitable for this practice as they require less infrastructure to construct the catchment areas. The slope criterion for dry dams and berms was updated from the wetland restoration and creation slope criterion to include areas with a mean slope below 2%. This adjustment will allow for an entire farm field to be identified as a potential opportunity area, even if a portion of that field exceeds the 2% slope requirement—whereas adhering to the absolute 2% slope requirement may identify that same farm field as having multiple distinct zones that would each be suitable for water farming but would be identified as requiring separate water retention infrastructure.
The mean slope was calculated for each of the initially suitable areas for the final analysis step using the previously created slope raster as an input for the Zonal Statistics as Table geoprocessing tool. The resulting table was joined back to the initial opportunity layer, and polygons with a mean slope of less than or equal to 2% were selected and exported as a new layer (Figure 8).

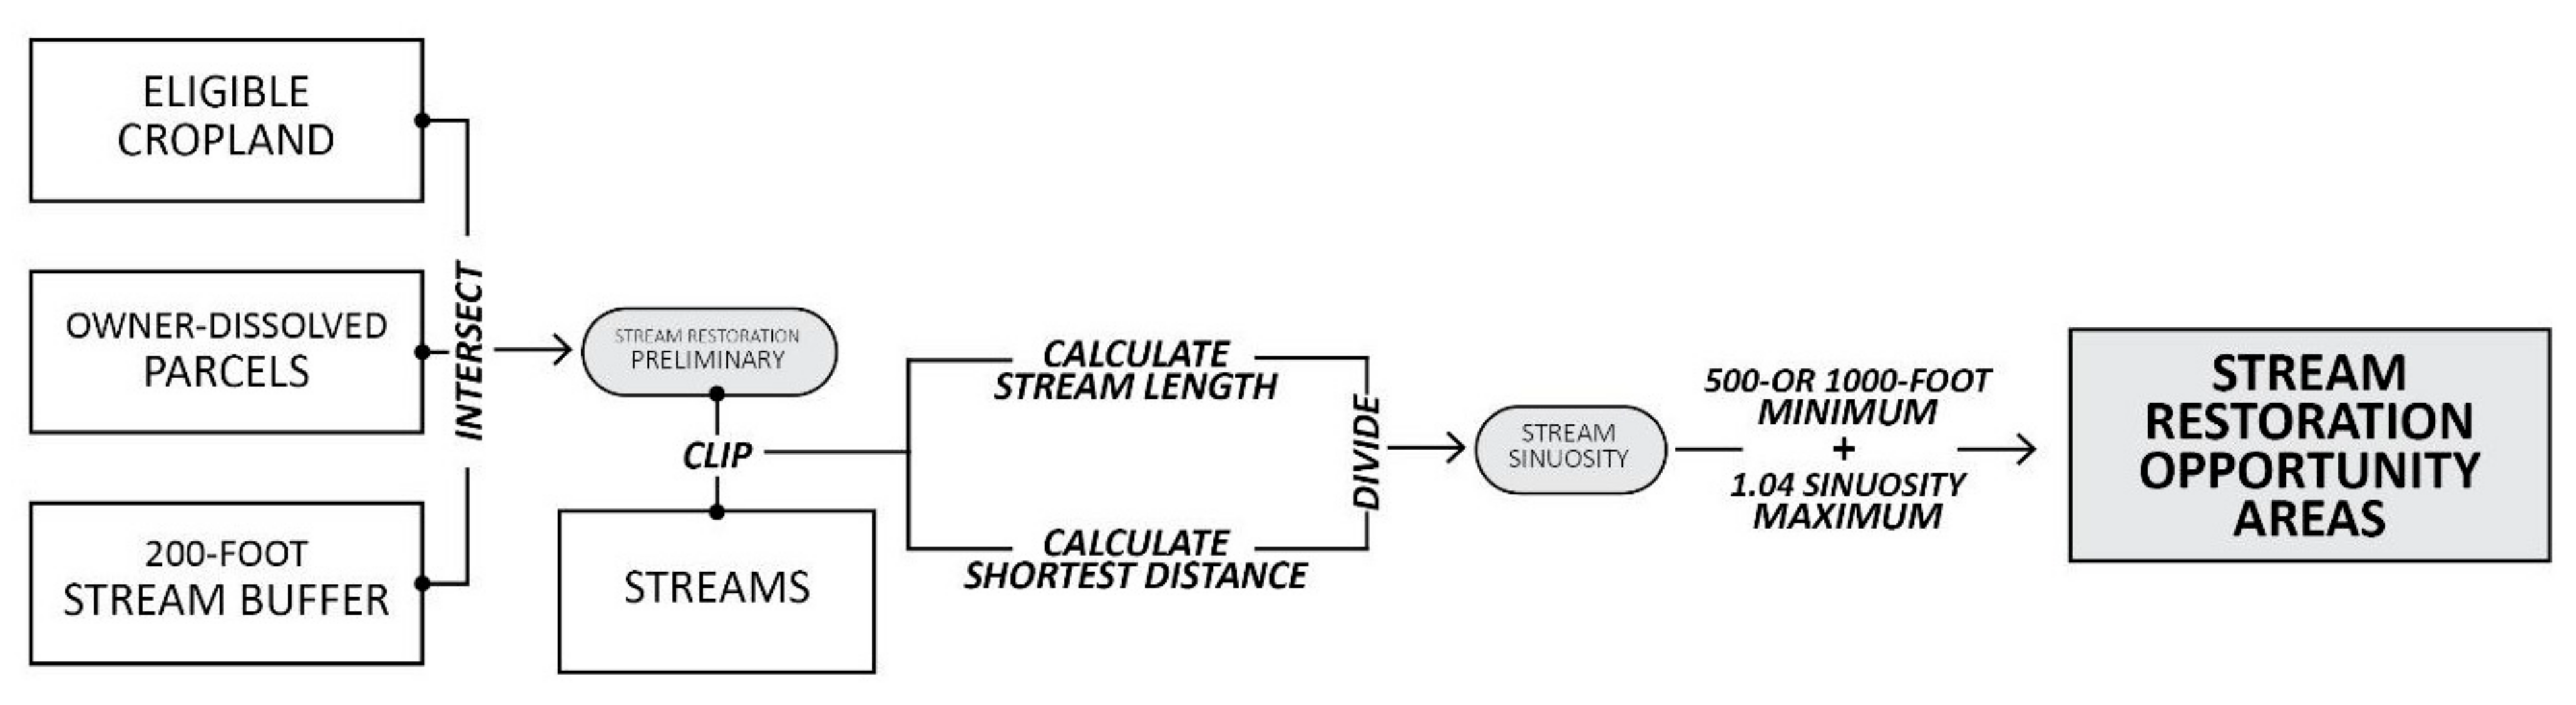
2.2.5. Stream Restoration

Stream restoration involves returning previously altered stream channels to a more natural state by re-establishing sinuous channel patterns along physically straightened sections. Streams are typically straightened to move water downstream more efficiently, either to prevent local flooding or to create drier conditions for human-centric land uses such as agriculture or residential development. In agricultural areas, straightened streams are part of a connected network of water control systems and techniques such as tile drainage systems and ditches, designed to move water more efficiently off farm fields and decrease soil saturation, creating more productive growing conditions. Straightened streams also facilitate more efficient land use patterns for crop production and often conform to rectilinear property boundaries. However, because stream channels that lack natural meander patterns transport greater volumes of water at much higher flow velocities than streams in a natural state, some of the compounded effects of extensive stream manipulation are increasing downstream flood risk and sedimentation from stream bank erosion. In addition to the restoration of stream channel geometry, another component of stream restoration is reestablishing riparian vegetation, which provides additional benefits such as filtration of sediments, nutrients, and pollutants, increasing infiltration rates, which decreases runoff velocities, and positively impacts biodiversity through habitat creation. Stream sinuosity, stream length, and stream buffer vegetation were criteria used to identify stream segments that presented potential opportunities for stream restoration in Robeson County.
Low Sinuosity: Stream sinuosity refers to the ratio between the total length of any given stream segment and the shortest distance between that segment’s start and end points. To calculate this value, the total stream length is divided by the shortest distance, and the resulting value represents sinuosity. The straighter the stream, the more similar the values for stream length and shortest distance, which results in stream sinuosity values closer to ‘1′.
When assessing stream sinuosity values, two key factors are local geomorphological conditions and data resolution. Stream geomorphology is impacted by various environmental factors—soil type, geology, land cover, landform, and many other conditions that can affect how naturally sinuous a stream is. Data resolution will also impact computed sinuosity values. High-resolution datasets will more accurately capture subtleties of stream meander patterns reflected in longer stream segment lengths (and higher sinuosity values) than lower-resolution data with approximated stream geometries. Because variation can exist between datasets and across diverse landscape conditions, the determination of a threshold value for identifying low sinuosity in streams must be comparatively assessed on a case-by-case basis instead of relying on a standard value. For example, this analysis initially used a sinuosity threshold value of 1.2 to identify low-sinuosity streams, a value that was based on the stream restoration criteria used by the NC Department of Transportation for the identification of mitigation project sites [51], but when applied as the threshold value for this analysis, over 96% of the assessed streams were identified as having low sinuosity. Therefore, the mean sinuosity value (1.04) for the analyzed dataset was adopted as the new threshold for determining low-sinuosity streams.
Minimum Length: Prioritizing longer stream segments for channel restoration will have a greater impact on flood control and water quality. Recommendations for an appropriate minimum length for stream restoration vary, so two minimum stream lengths were evaluated for this analysis: 500 feet (152 m) and 1000 feet (304 m). The extent of work for any proposed restoration projects would not necessarily need to meet these length minimums. However, identifying more extended stream reaches where restoration would be beneficial allows for greater flexibility for site-level analysis, design, and scoping of restoration projects. NCDOT uses the 1000-foot minimum stream length criteria for identifying restoration projects [51]. This threshold was used as the foundation for the Robeson County analysis but produced somewhat limited results, so the analysis was rerun to lower the minimum stream length threshold to 500 feet.
Sparsely Vegetated Stream Buffer: Since stream channel restoration typically involves significant earthwork and excavation to reestablish meandering channel geometry, the extensive tree removal required for restoring streams with forested riparian buffers limits the appropriateness and feasibility for forested streams. This analysis targeted streams with unforested areas within a 200-foot stream buffer.
Analysis began by editing and updating the Streams data from the National Hydrography Dataset to ensure that the geometry was in a usable format. Some streams in this dataset are split into multiple individual line segments within one connected section of the stream, so the Dissolve tool was used to connect smaller segments. We created a 200-foot riparian buffer around all streamlines, clipped the initial Eligible Cropland layer within the buffer, then intersected it with the parcel layer dissolved by owner name. Next, the Streams layer was clipped into the buffer with the Clip tool, which identified stream segments with predominantly open buffer vegetation and excluded stream segments with forested buffers. This also split the streams into separate segments whenever they crossed a property boundary.
The Feature Vertices to Points tool was used to create vertices at the start and end of each stream segment, and values for their geographic coordinate points were calculated. The XY to Line tool created a new layer, which connected each stream’s start and end vertex with a straight line representing the shortest distance between the two points. The length was calculated for each of the new lines, and these values were joined back to the Stream Segments layer. Stream sinuosity was calculated by dividing the total stream segment length by the shortest distance between stream segment vertices.
Finally, to identify streams as potential restoration opportunity areas, the Select by Attributes tool was used to select and export all stream segments with lengths greater than or equal to 1000 feet and stream sinuosity values less than or equal to 1.04. The Eligible Cropland buffer areas for each identified stream were also selected and exported using the Select by Location tool. A second selection was run using the same process but reducing the minimum stream segment length to 500 feet (Figure 9).

3. Results

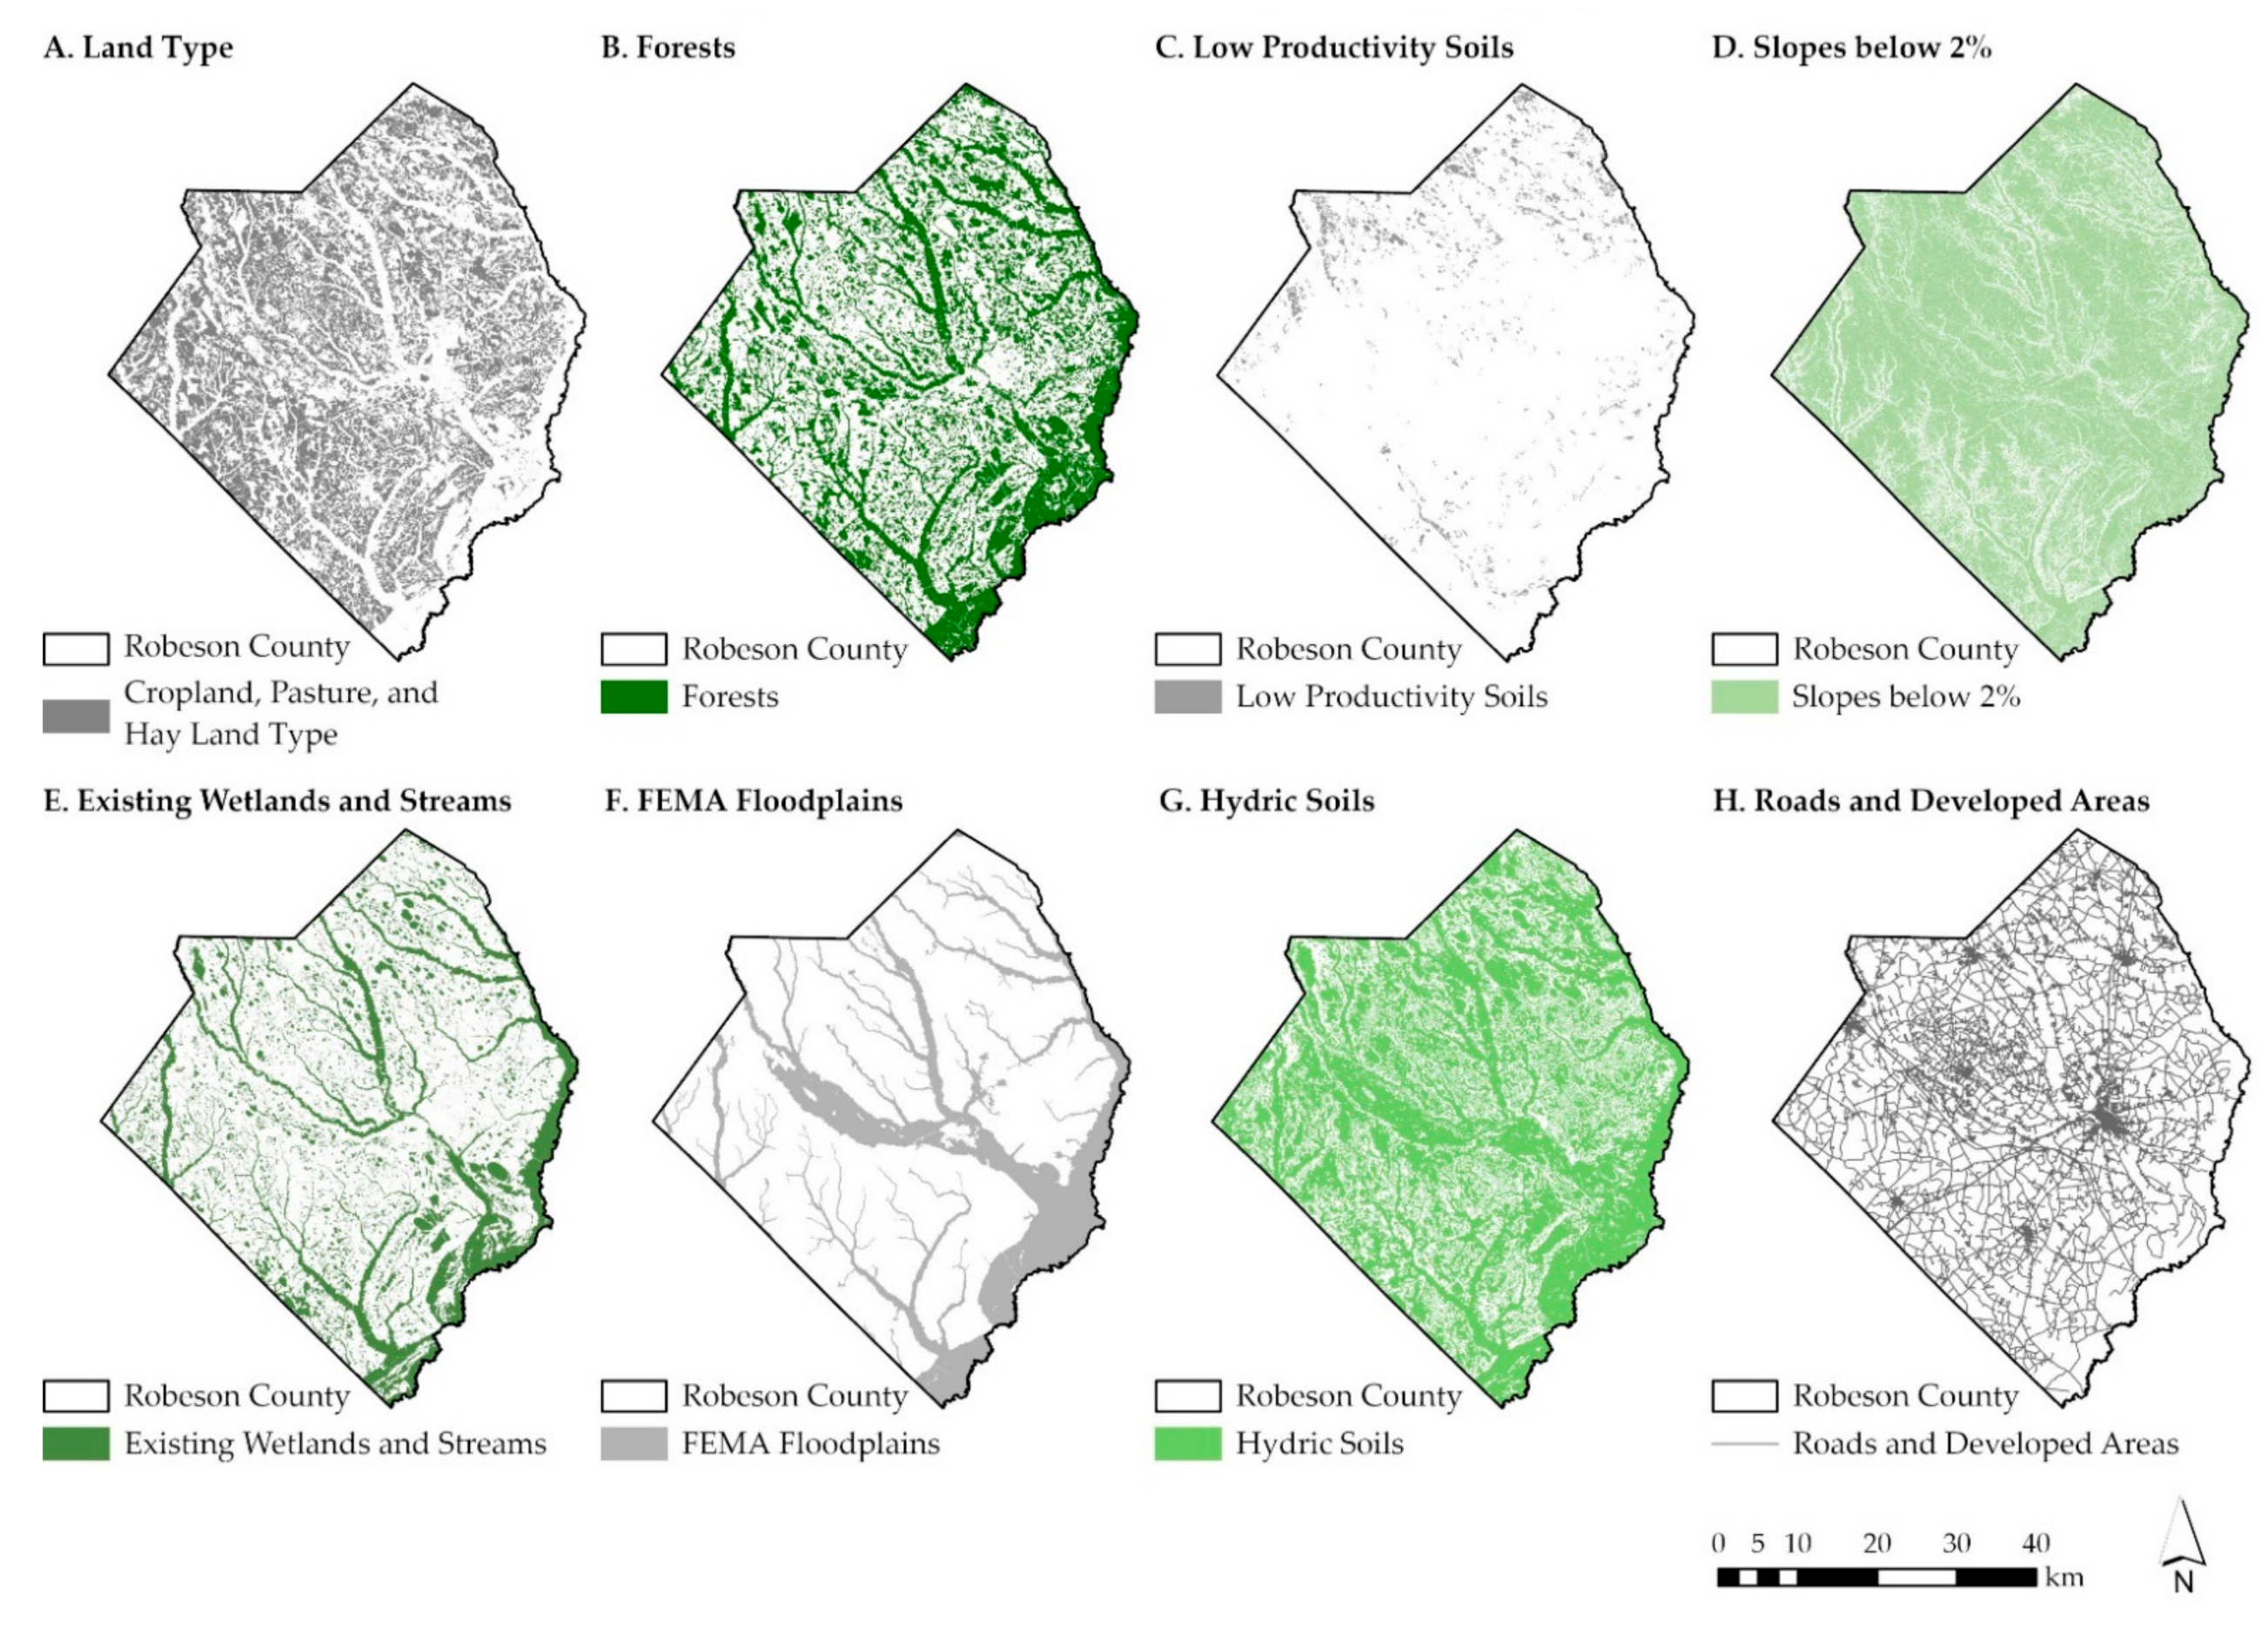
3.1. County Inventory Mapping

More detailed environmental inventory mapping was performed for Robeson County to help the project team develop a better understanding of the possible opportunity areas within the county. The following environmental criteria were mapped: cropland and open land; cropland with low-productivity soils; cropland and open land within the floodplain; cropland inundated by recent hurricanes, cropland with low slopes; and high-value crops (Figure 10).

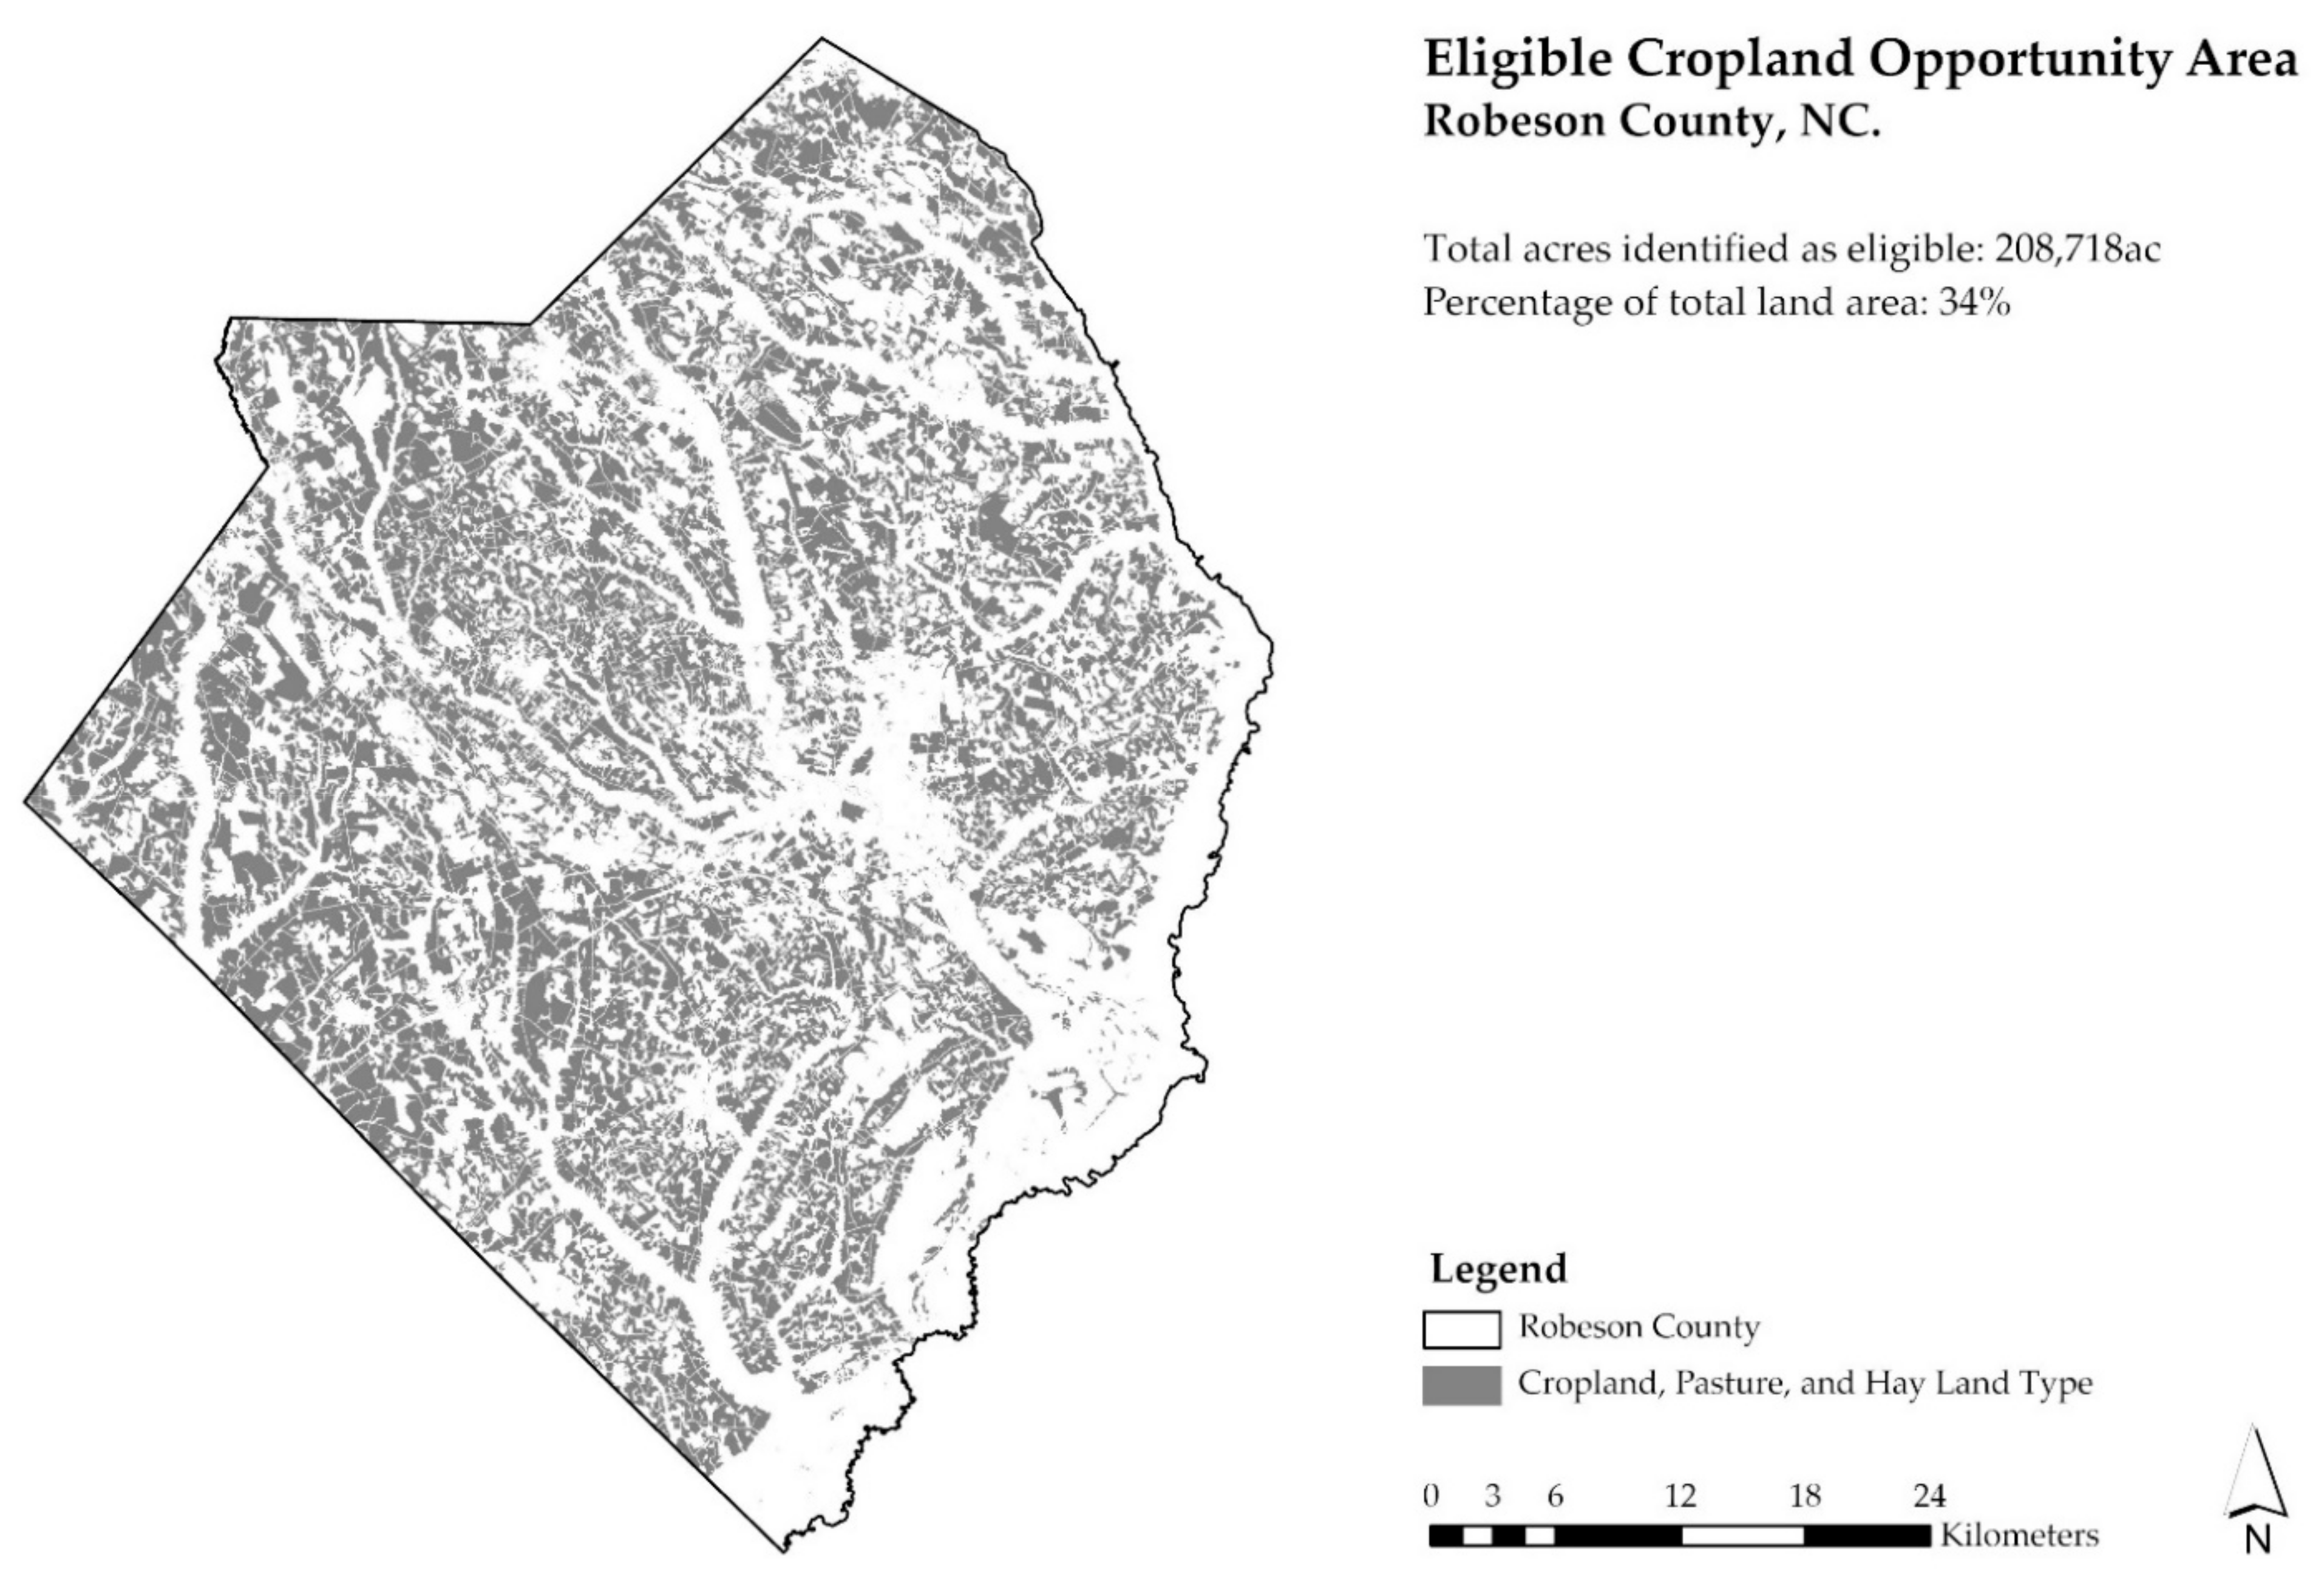
3.2. Eligible Cropland Identification

Eligible Cropland identified through the process outlined above represents Robeson County farms without land-use conflicts related to existing infrastructure or crop profitability. These initial results provide a starting point for additional analysis to identify specific environmental conditions linked to the suitability of various FloodWise practices. The area of Eligible Cropland totaled approximately 208,718 acres (84,282 ha), representing about 34% of Robeson County’s total land area (Figure 11). The identified subsets of NBS practices that could be established in this area of eligible cropland are predominantly located in the southwestern part of the County; however, some Eligible Cropland is also located in the northeast of the County. These areas do not overlap; they were selected as the best choice for each NBS based on the criteria and process described in the methods.

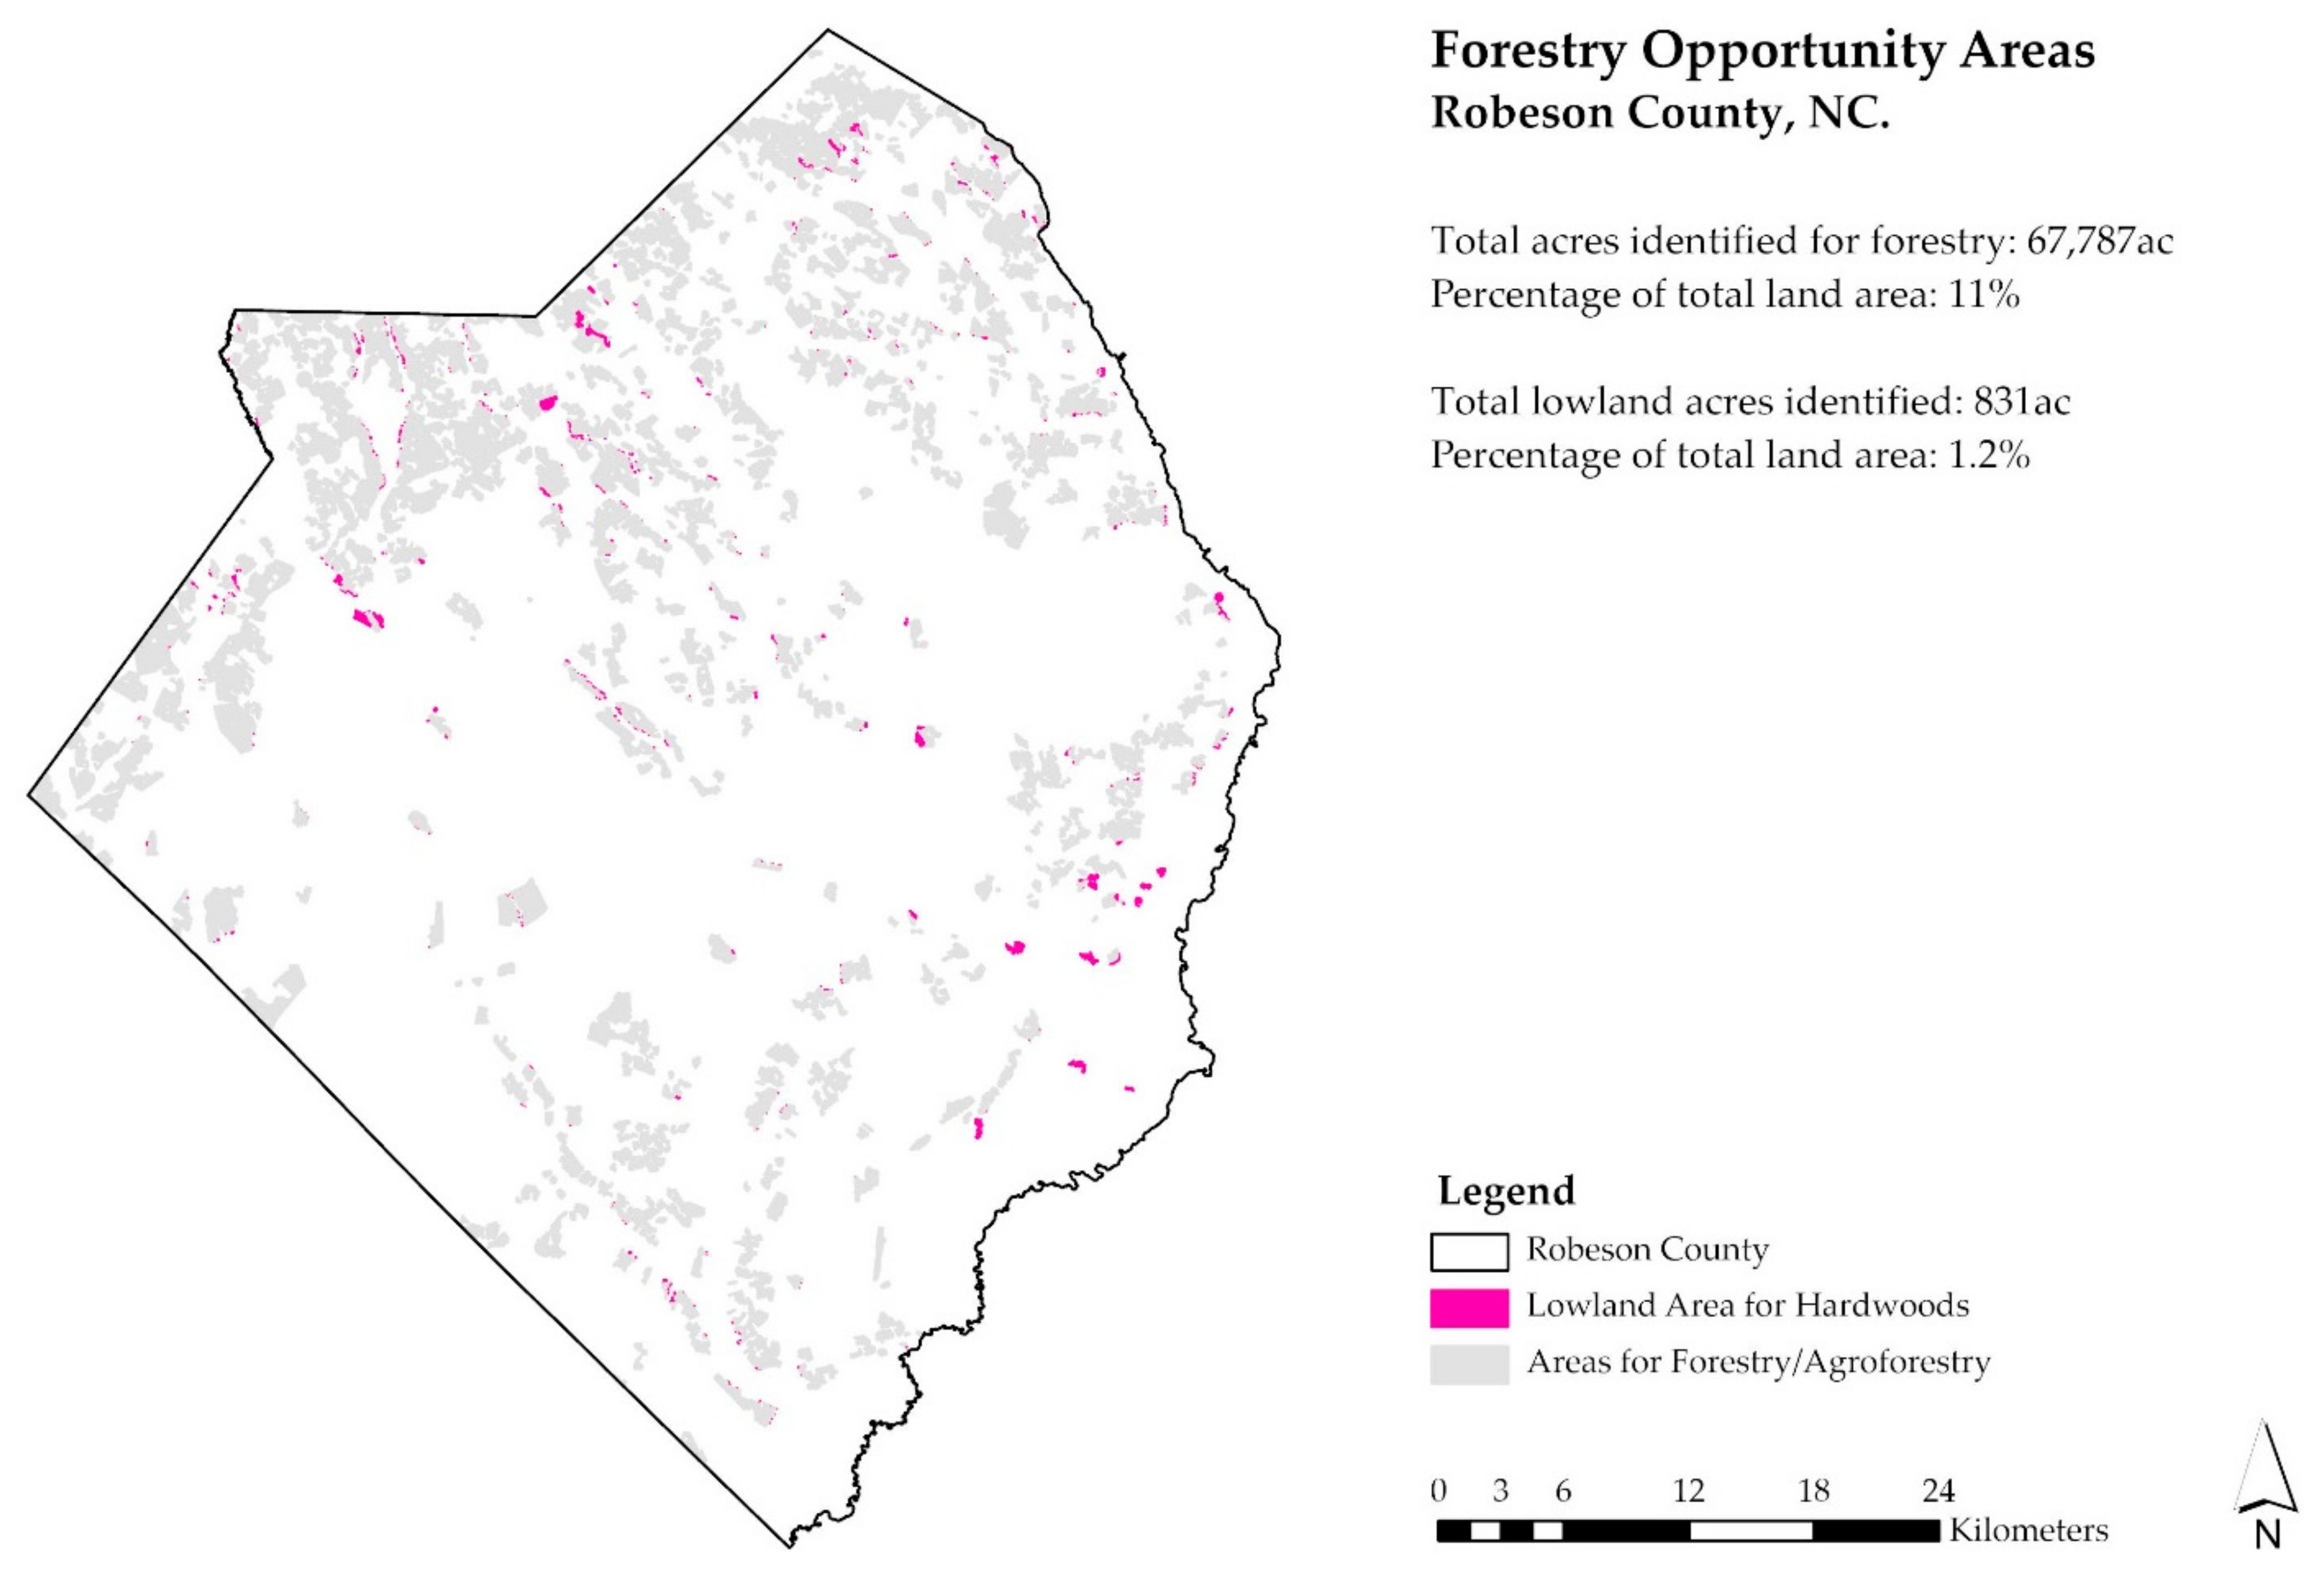
3.3. Forest and Tree Planting Opportunities

While forest planting and agroforestry practices could realistically be adopted on any existing agricultural or open land, including low soil productivity areas in this analysis resulted in the identification of opportunity areas where a transition from row crop production to forestry or agroforestry practices may increase farm profitability in addition to any potential flood reduction benefits. Sites identified as opportunity areas totaled about 67,787 acres (27,444 ha), approximately 11% of total Robeson County land and 32% of initial Eligible Cropland (Figure 12). Lowland areas identified as more suitable for hardwood forest species totaled 831 acres (336 ha; approximately 1.2% of total forest and tree planting opportunity areas), and upland areas identified as more suitable for pine planting totaled 66,956 acres (27,107 ha; approximately 98.8% of total forest and tree planting opportunity areas).

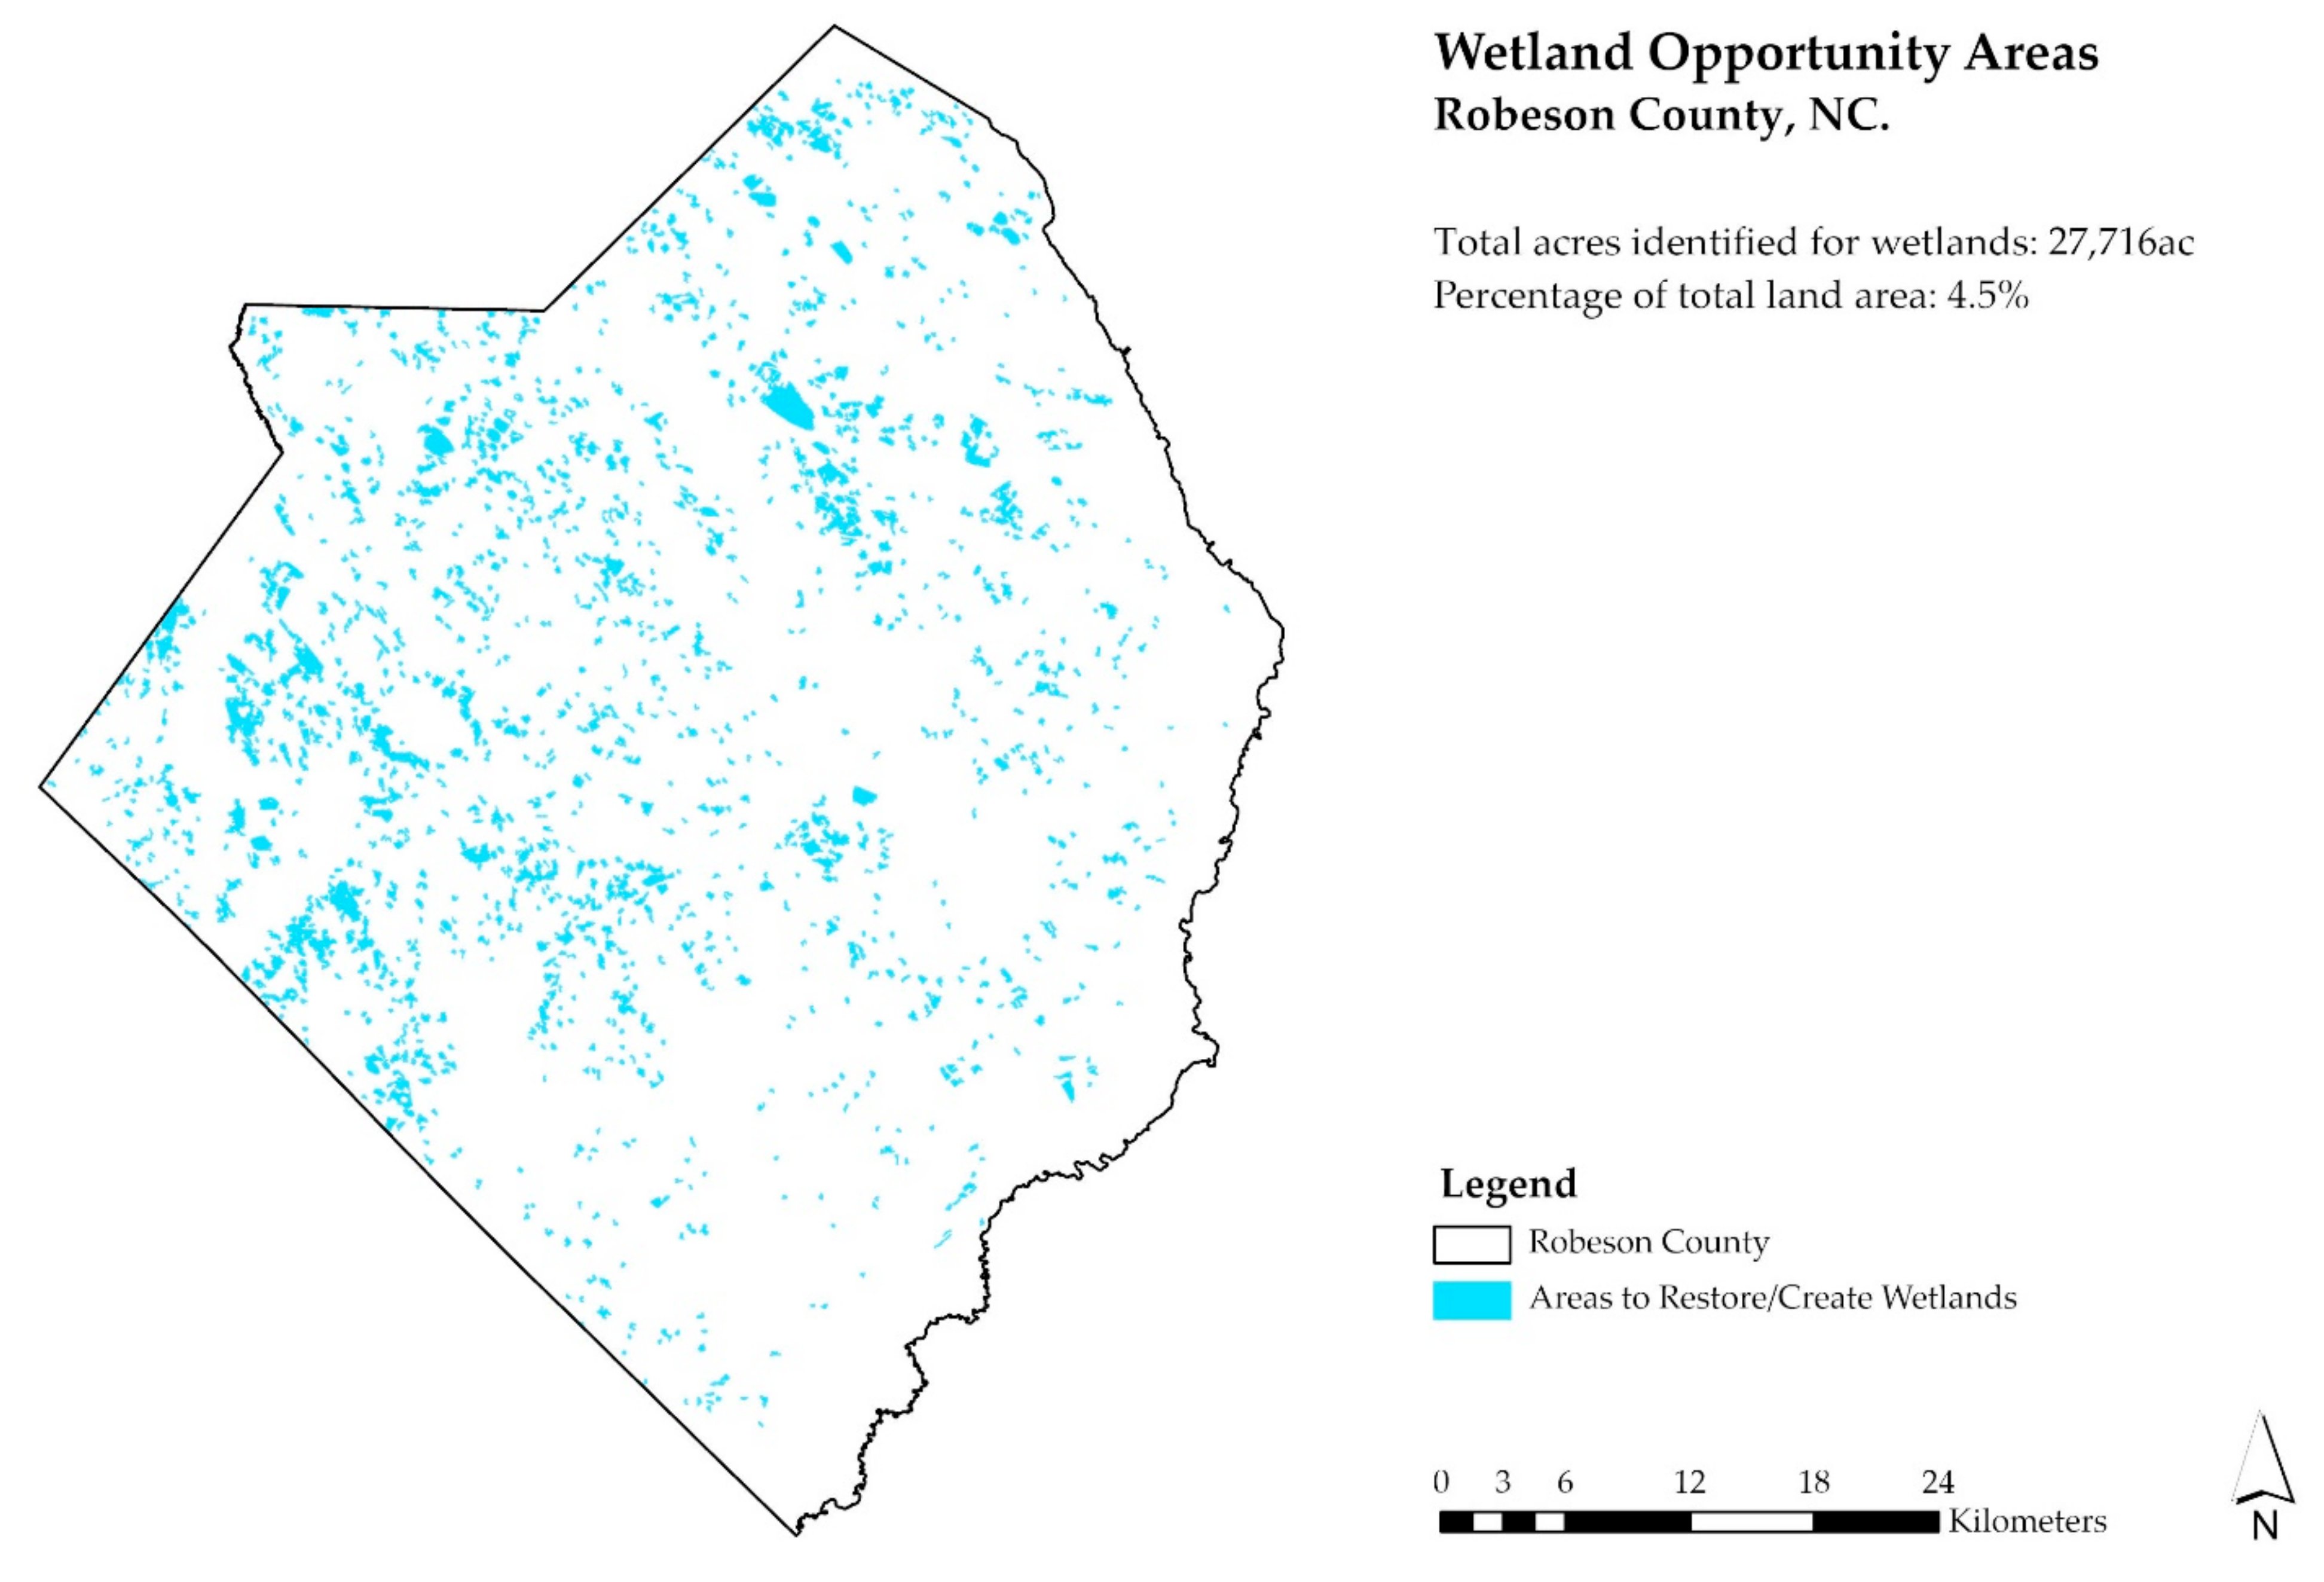
3.4. Wetland Restoration and Creation Opportunities

Sites identified as opportunity areas totaled about 27,716 acres (11,221 ha), representing approximately 4.5% of Robeson County’s total land area and approximately 13% of the initial Eligible Cropland area (Figure 13). Wetland opportunity areas that experienced inundation during Hurricanes Florence (2018), Michael (2018), and Dorian (2019) totaled 2615 (1059 ha) acres, approximately 9% of total wetland restoration and creation opportunity areas. Overall, the majority of the opportunity areas for wetland restoration and creation exist in the west and northwest part of the county, which some acreage located in the northeast.

3.5. Water Farming Opportunities

This analysis identified 199 individual opportunity areas for storing floodwaters with dry dams and berms totaling 3932 total acres (1592 ha), representing approximately 0.6% of the total Robeson County land area and about 1.8% of the initial Eligible Cropland areas. The largest identified opportunity area was 718 acres (291 ha), and the mean opportunity area size was 19.8 acres (8 ha). Land suitable for water farming opportunities resides in the northern part of the County (Figure 14).

3.6. Stream Restoration Opportunities

The total length of streams identified for stream restoration using the initial 1000-foot minimum length requirement was 347,037 linear feet (65.7 stream miles) (105 km), representing around 2.6% of Robeson County’s delineated streams (Figure 15). Reducing the minimum length requirement to 500 feet identified 511,339 linear feet (98.8 stream miles; 158 km) of streams as potential restoration opportunity areas, representing about 3.8% of delineated streams in Robeson County (Table 3). The areas most suitable for stream restoration practices were found in the western part of the County, and some acreage was available in the eastern part of the County.
Because the streamlined geometry used in this analysis was derived from the National Hydrography Dataset, this layer’s detail and spatial accuracy level are not as high as a hydrologic dataset produced through modeling with high-resolution DEMs for a smaller study area. The coarse data resolution resulted in a rough approximation of stream delineations, with fewer meanders than actual conditions on the ground. Comparing delineated streams to aerial imagery where actual stream courses were visible confirmed that delineated streams were significantly less detailed in some areas. Less detailed stream geometry would result in more stream segments with low sinuosity and may identify stream restoration opportunities for stream segments in a relatively natural condition. Despite this limitation, using stream geometry from the National Hydrography Dataset provided a convenient way to identify restoration opportunities at a scale where developing a more detailed hydrologic dataset may not be feasible. If higher-resolution data are needed for a smaller study area or sub-watershed, detailed hydrologic data can be substituted following the same geospatial methodology.

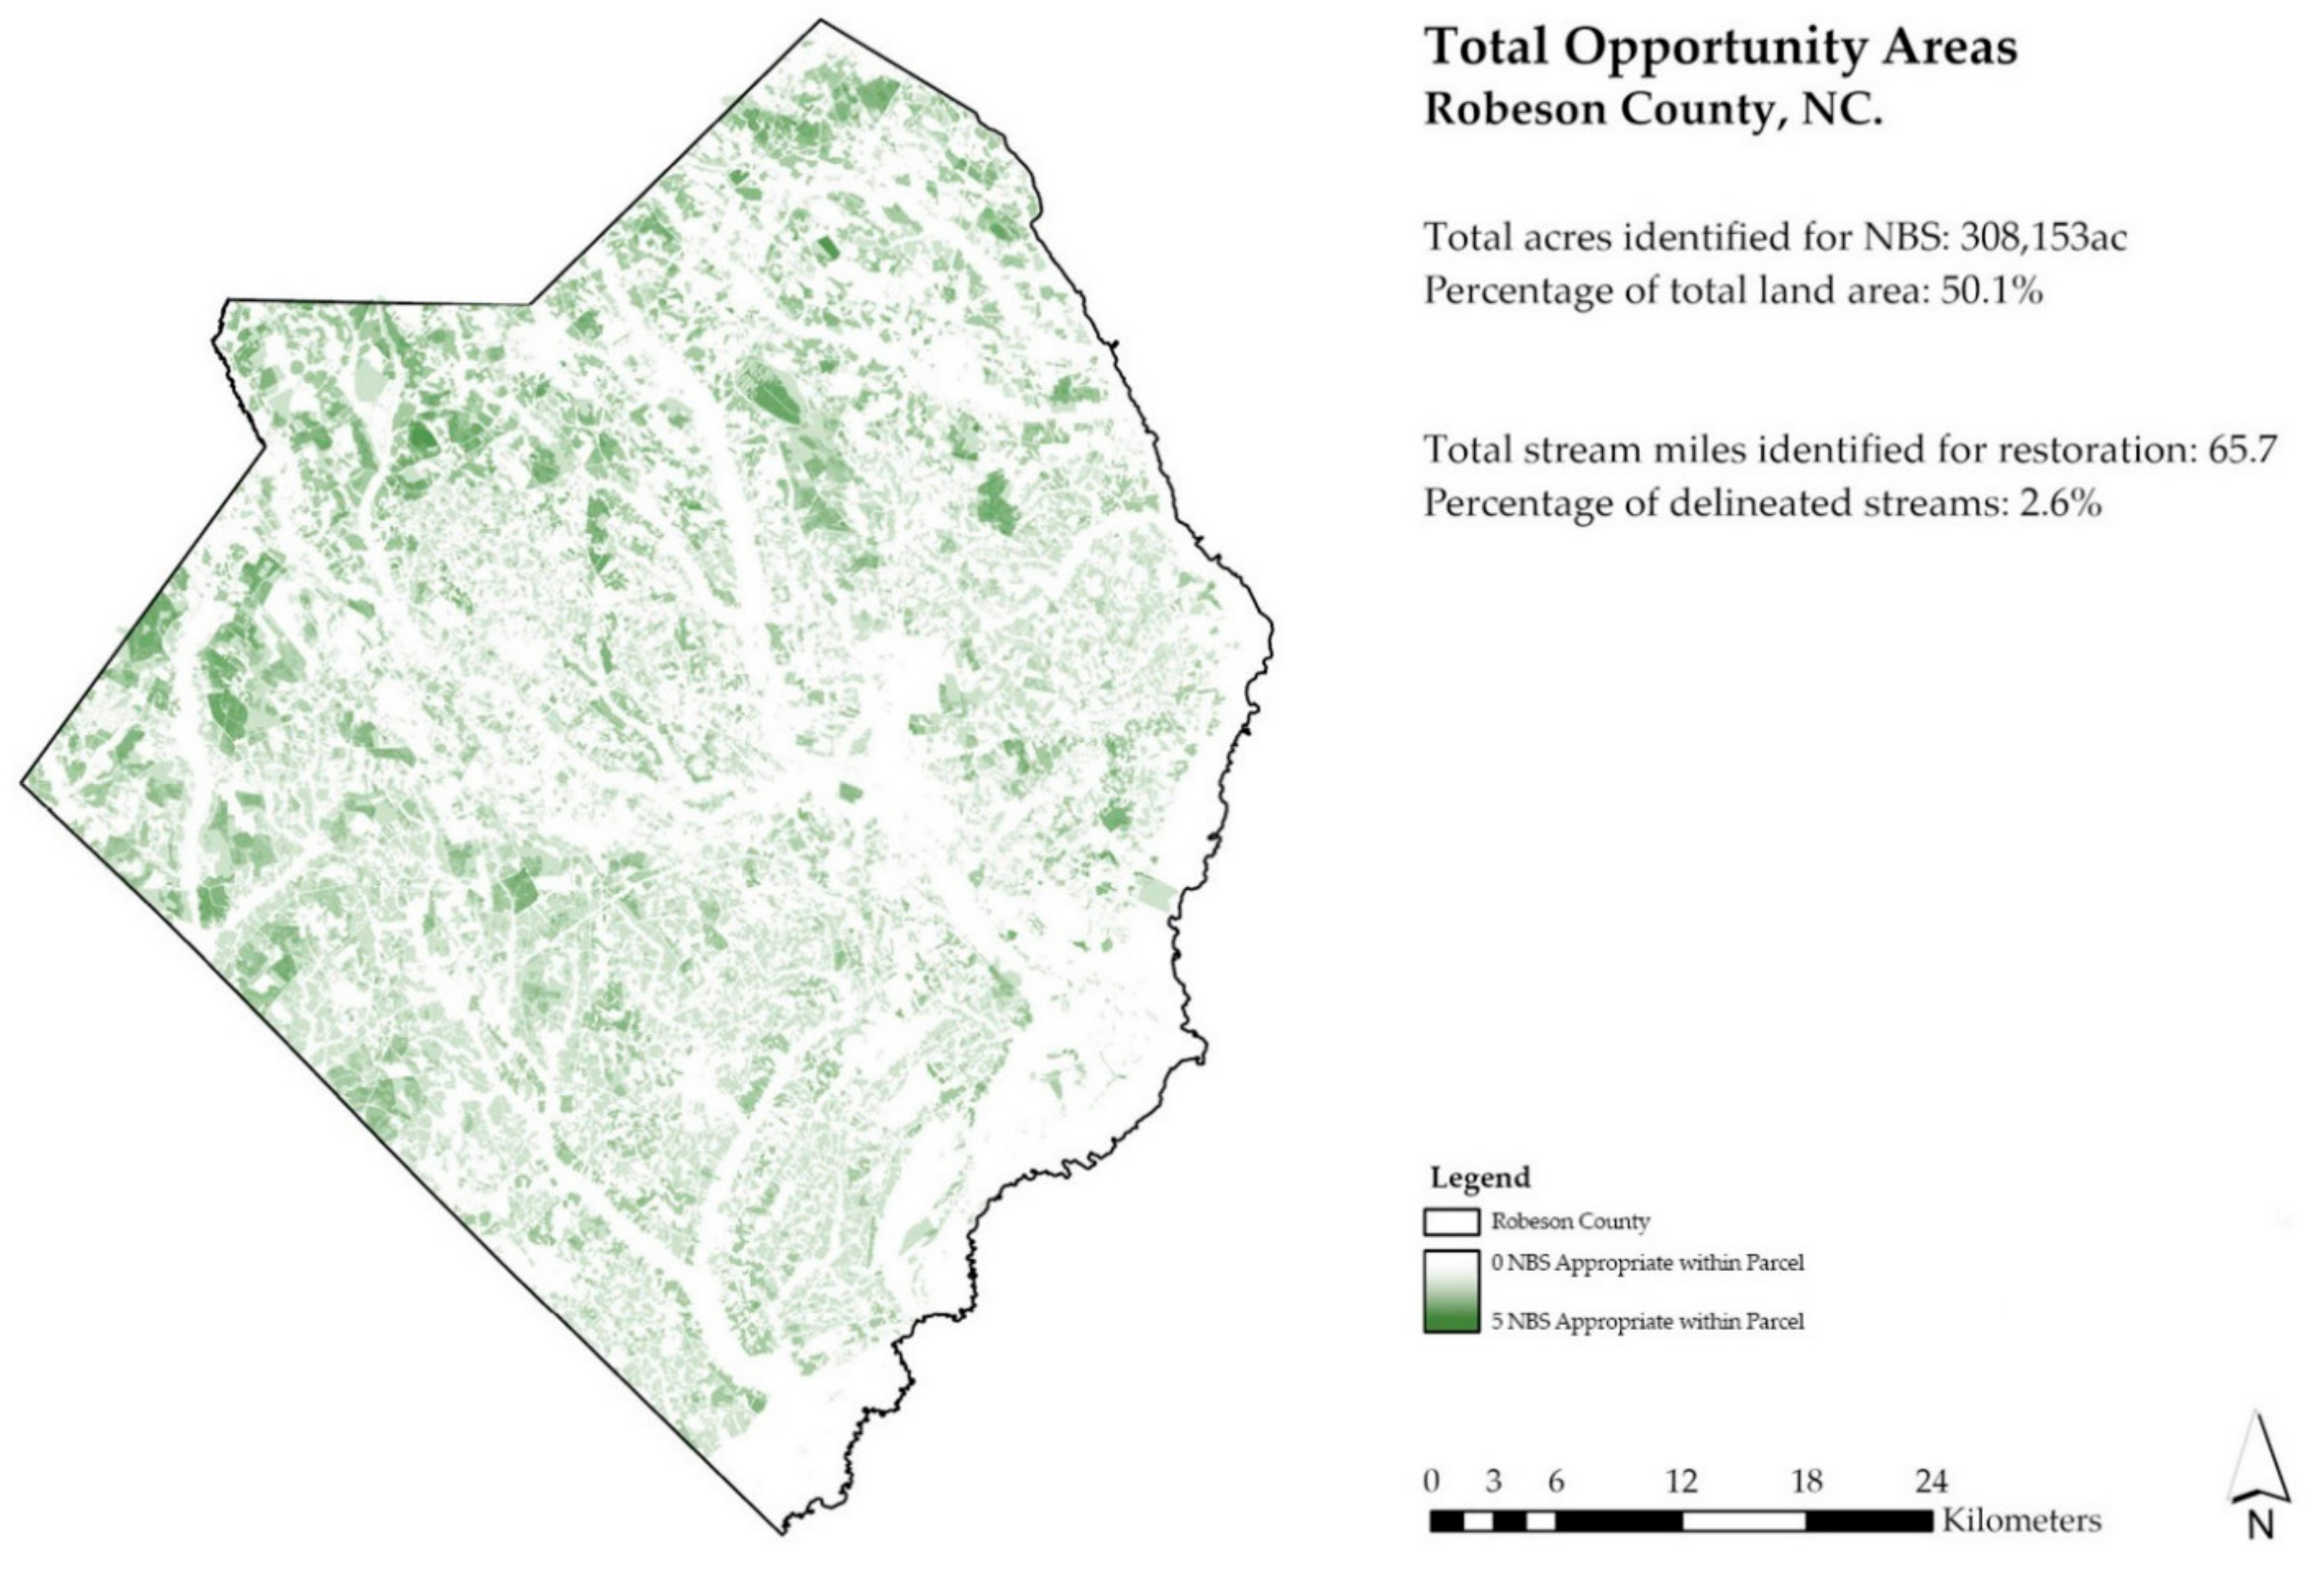
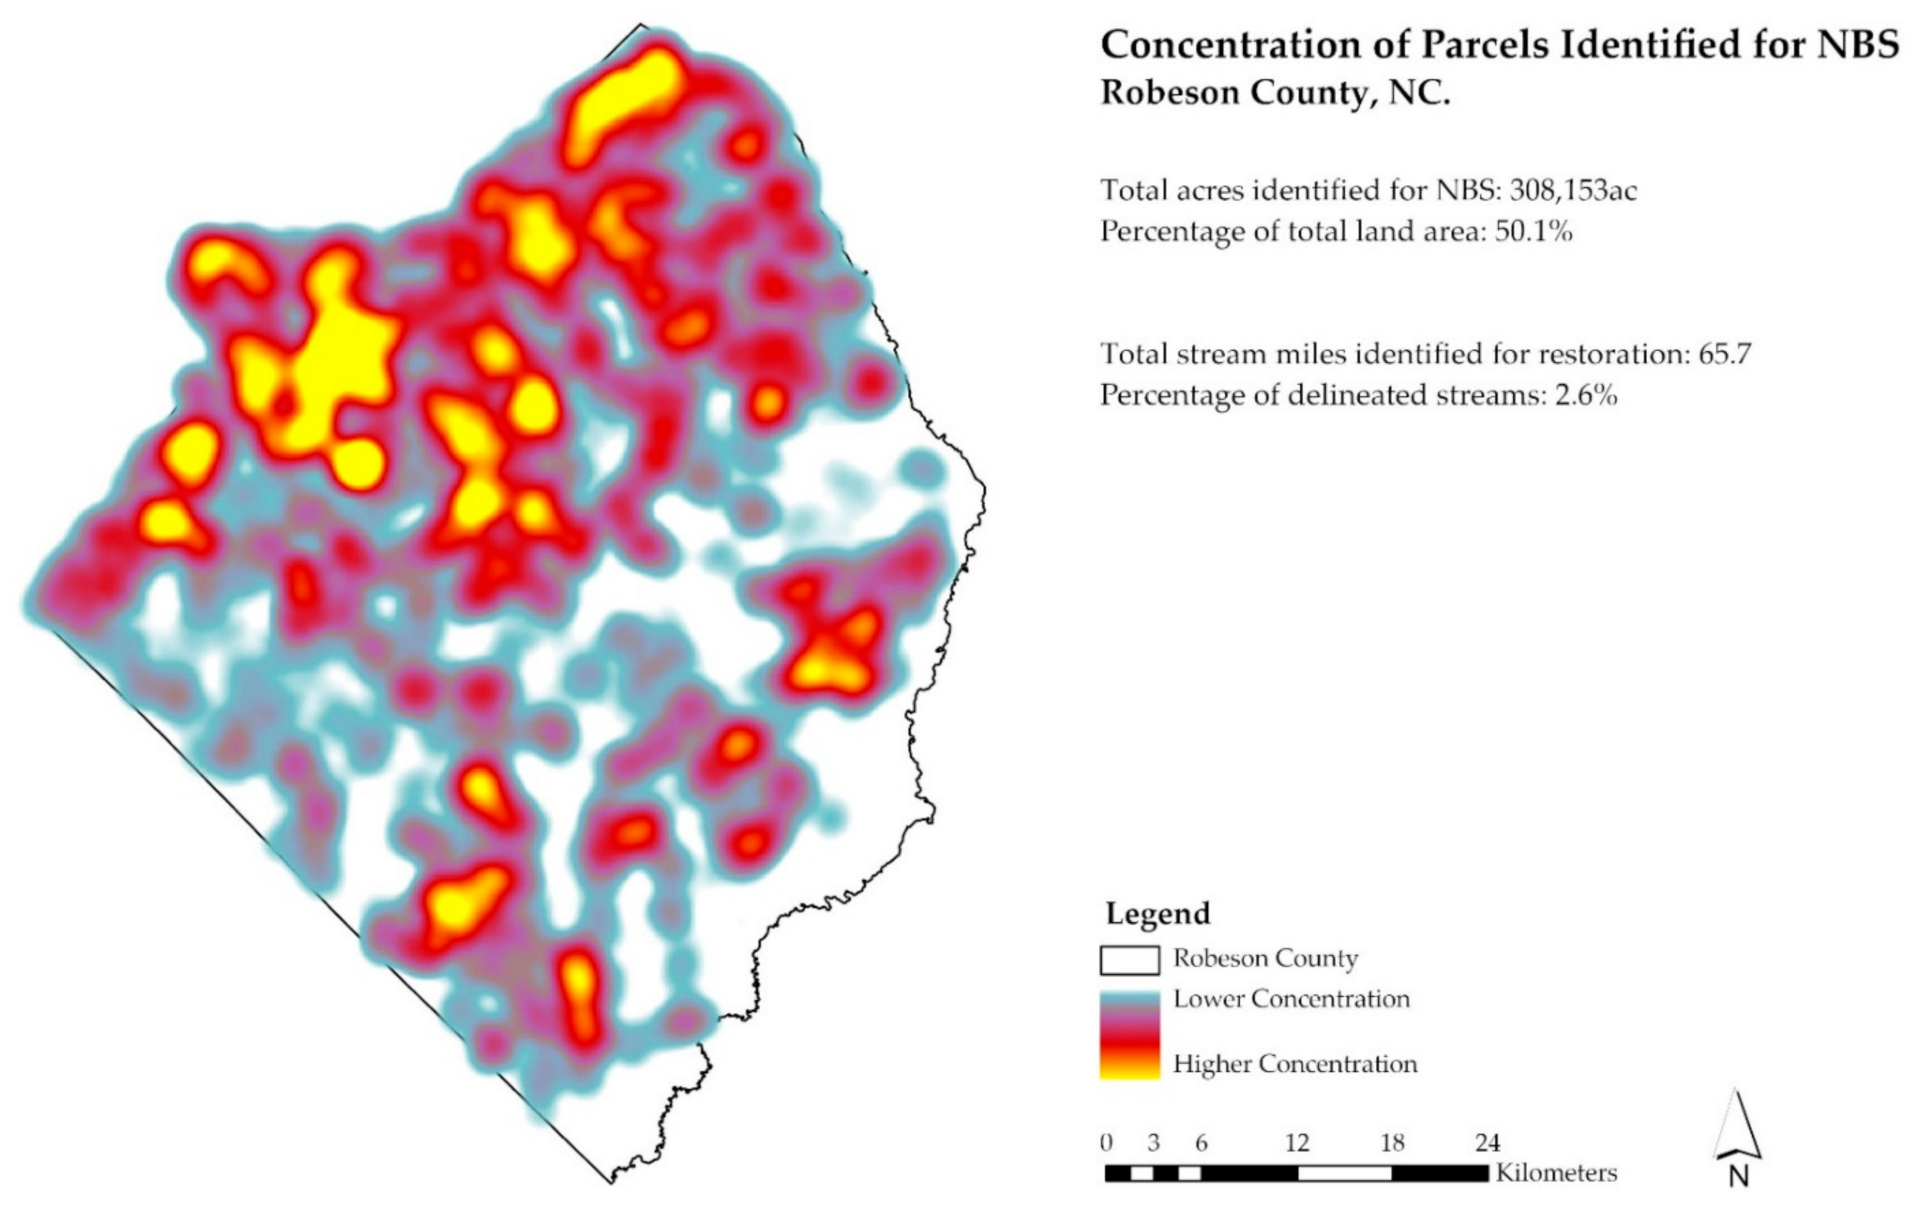
3.7. Overall FloodWise NBS Opportunities

Overlaying results from each analysis reveal areas where favorable environmental conditions for supporting various FloodWise practices are concentrated. Table 3 displays the available area in acres and the percentage of the total area in the County where FloodWise practices are suitable for establishment. Overlaying the results will also help target a sub-watershed or community for refined analysis, modeling potential flood reduction impacts from FloodWise practices, and landowner outreach for identifying potential demonstration project sites. Several opportunity hotspots identified as areas with higher concentrations of opportunity areas or higher concentrations of parcels with overlapping suitability are in the northwestern part of the county, specifically in the agricultural areas surrounding the communities of Red Springs, Maxton, and St. Paul’s (Figure 16 and Figure 17). The sub-watersheds containing the highest concentrations of opportunity area occurrences include Gallberry Swamp, Raft Swamp, and Gum Swamp.
The land in Robeson County suitable for all FloodWise practices exists mainly in the northwest. However, there are still areas throughout the entire County where NBS would suitable. These best areas in the region can be used in outreach and extension efforts to locate and establish FloodWise NBS in Robeson County. For example, if landowners express interest during future focus groups or workshops, they can reference the maps from this study to see if their land was identified as a potential opportunity area for FloodWise practices. Conversely, if agencies and organizations are seeking to implement NBS practices, they can reference areas identified through this study and contact landowners in targeted outreach efforts.

4. Discussion

Nature-based solutions (NBS) are integral to mitigating flood risk by working with natural processes rather than traditional infrastructure, which can sometimes exacerbate issues [23]. Clearly identifying potential areas for NBS is key to resilience planning at the landscape scale and is a necessary first step to assessing and modeling flood reduction and water quality impacts, as well as other potential ecosystem services benefits.
Recent literature on NBS for flood control and many co-benefits has expanded rapidly in the past few years. This research has examined the global status of NBS for climate change [17]; new EU rural NBS applications [18]; urban mapping [19], and seascape site selection [20]. Geospatial, GIS, and mapping efforts for NBS have identified likely flooding areas [13], land use planning applications [16,21], cropland flooding impacts [22], provision of ecosystem services [23], and flood NBS in Serbia [24].
Our study outlines in detail how this process of geospatial analysis can occur in Robeson County, North Carolina, but it is also transferrable to similar environmental contexts across the broader U.S. Southern Coastal Plain with typical U.S. geospatial approaches and data sources. This article summarizes the methods in detail, which stem from the extensive public databases available for GIS systems; knowledge of NBS systems appropriate for our target locations in eastern North Carolina; the input provided by our study team of scientists, and farm technical service and policy experts; and geospatial analysis with ArcGIS Pro. These methods can provide a template for similar geospatial analyses, mapping, and identification of specific desirable tracts for NBS.
For the application in Robeson County, North Carolina, our results indicated that there was a total of 208,718 acres (84,500 ha) of Eligible Crop land, which consisted of 34% of the total Robeson County area. The Eligible Crop included farmland in the County without existing infrastructure or having poor crop profitability. Thus, these acres represent the land desirable for planting cover crops, which can help slow down stormwater runoff from heavy rainfall. We found 67,787 (27,44 ha) acres of eligible land for afforestation efforts, which makes up approximately 11% of the total County area and 32% of the Eligible Crop. We identified 27,716 acres (11,221 ha) of land suitability for wetland restoration efforts, making up approximately 4.5% of the total County land and 13% of the Eligible Crop. Finally, we discovered approximately 66 miles (106 km) for 1000-ft minimum stream restoration and approximately 99 miles (158 km) for 500-ft minimum stream restoration. The areas identified with higher concentrations of land suitability for the identified NBS include the Gallberry Swamp, Raft Swamp, and Gum Swamp sub-watersheds. As with any large-scale analysis incorporating remotely sensed data, the results of this mapping effort represent an approximation of on-the-ground conditions [13].
Further on-site research should be performed to confirm that site conditions match those indicated by the spatial data. Resolution and age of the data have a potential impact on accuracy as they represent the environmental conditions for a snapshot in time in a landscape with the potential for rapid and significant land-use changes, including impacts from more frequent and extreme precipitation events and loss of forestlands due to expansion of farmland, housing, and commercial development. At the county scale, results are useful at illustrating trends and patterns in the landscape related to FloodWise practice suitability, which supports overall project goals of identifying communities and sub-watersheds to prioritize for outreach and engagement efforts.
In addition, further refinement of the geospatial analysis methodology is needed to increase accuracy and appropriateness for modeling flood reduction scenarios or water quality impacts based on the acreage of identified opportunity areas. Ground-truthing visits to specific properties and assessing their suitability for supporting FloodWise practices is critical in gauging the accuracy of initial results and refining inputs and parameters.
Finally, a detailed site-level analysis is also imperative before a final suitability determination is made for any nature-based solution on any specific property. This includes analysis of high-resolution elevation data (LiDAR or field survey) and refined hydrologic modeling and assessment of existing vegetation, existing wetlands, soil types, and stream conditions.

5. Conclusions

As climate change and its associated increased disastrous storms and floods occur, new responses such as Nature-Based Solutions (NBS) are needed to prevent excessive damages and to replace reliance on the insufficient and expensive grey infrastructure of hardened concrete and permanent extensive inundation of productive farm and forest lands in low lying lands such as North Carolina, U.S., and global. The temporary storage of flood waters from more frequent storms across a broad landscape is an attractive alternative to attenuate rapid flood stormwater runoff and reduce flooding that may damage individual farms and downstream communities.
Achieving this promise of NBS will require complex biophysical, technical, and institutional factors to identify, map, pinpoint specific good sites; build, fund, provide technical assistance for; and develop governance mechanisms to implement NBS. This, of course, sounds complex but could be less effort and expense than recovering from and paying for massive flood damages. Our proposed FloodWise program is one new contribution that outlines how such NBS could be implemented in rural eastern North Carolina. In that context, the identification and mapping of suitable sites for NBS practices are crucial.
Prior research throughout the world has begun to assess the merits of and map NBS for flood reduction and stormwater [17,19,20,21,22,23], and a program in the EU fund specific projects for NBS [18]. However, very little literature in the United States has addressed this concept, and almost none has laid out the pathway of how such a program could be operationalized at a local or state scale. Our efforts have followed this line of research and development for several years, and this technical mapping and GIS process described here can provide a template that North Carolina and other states could follow, using existing landscapes coupled with data available from public sources.
Our team identified ten key NBS practice opportunities and costs in prior research [27,28] and built on those efforts to identify where these practices could be applied with these GIS efforts. The GIS application found that the potential landforms for seven major practices could be mapped specifically with public data and GIS skills. All of these would be located on current eligible crops and pastureland. Some would require permanent conversion of that open land to other land uses (afforestation and wetland restoration); some would allow farm uses and incur periodic short-term water retention (agroforestry and dry dams and berms); and some would require modest losses of land with stream channel restoration.
Three other practices of cover crops, no-till, hardpan breakup, and tile drainage and storage could not be mapped per se but might occur on most farmlands. It would require the installation of these practices at a major scale across the landscape for water attenuation to reduce flooding. This seems prohibitive but is largely just restoring the landscape closer to its natural functions and values that existed before massive modern farming and is a compromise between huge and increasing storm losses and continued safe farming.
As noted, the results from our study indicated that about one-third (34%) of Robeson County had open crops and pastureland that met the criteria for landforms suitable for NBS practices, and about 16% could be converted to the best NBS practices. The land suitability and geospatial methods and results described here complement the burgeoning literature on NBS as one of the promising new methods to adapt to climate change and reduce the impacts of flooding. The approaches described offer a detailed, rigorous, and reproducible set of methods that can help select NBS practices as a practical applied tool. They rely on publicly available data and can be adapted for use in other U.S. locations.
The maps and data layers established can be the first step in identifying good sites for FloodWise NBS practices and then used to select or confirm farms that could participate in pilot or operational scale programs in our future work. Field visits and land surveys can then assess and plan for specific practice installations. Eventually, the willingness of farmers to adopt such practices; the capacity and technical assistance required to fund and implement NBS practices; and the funds to implement such programs (instead of paying for stormwater and flood damages) must be authorized, appropriated, and disbursed by existing or new agencies and NGOs. This is, of course, a lifetime of work but climate change is occurring and major adaptative prevention or recovery from massive damages will occur.
We have identified a few farms for pilot layouts and installations in future research and outreach program efforts. This pioneering research provides an innovative and thorough model of how NBS can be identified spatially and eventually implemented to help regions throughout the world ameliorate the adverse effects of climate change. The methods provided in this study can be replicated for any geographic location to reveal land suitable for NBS, which can help inform future resilience planning and decision-making.

Author Contributions

M.B. prepared the initial draft of the document and led the formal geospatial methodology and analysis. M.B., A.F. and T.K. contributed to the geospatial analysis, validation, and visualization. M.H. (Meredith Hovis), M.H. (Megan Hester), L.J. and F.C. contributed to writing, reviewing, and editing the final draft. M.H. (Meredith Hovis), F.C. and T.S. provided information on the overall FloodWise pilot project and specific NBS practices. A.F., F.C. and T.S. contributed to overall project supervision, project administration, and funding acquisition. All authors have read and agreed to the published version of the manuscript.

Funding

This research was funded by a North Carolina Department of Justice Environmental Enhancement Grant, grant number NCSU 019-PRE.

Data Availability Statement

The data presented in this study are available in Appendix A.

Conflicts of Interest

The authors declare no conflict of interest.

Appendix A. Various Geospatial Datasets Used in Land Suitability for FloodWise Practices

DatasetDescription of UseResourcesResolution (meter)/Vector Dataset
Statewide 20-foot Digital Elevation Model (NC One Map)The Statewide Digital Elevation Model (DEM) was used to calculate slope, a critical factor in determining site suitability for the FloodWise practices.North Carolina Floodplain Mapping Program and North Carolina Department of Transportation. Digital Elevation Model (20’ Grid Cells). Raleigh, NC: NC One Map, 2017. Available online at: https://www.nconemap.gov (accessed on 2 September 2022)6-m
gSSURGO Gridded Soil Survey Geographic Database (USDA)Attributes associated with the USDA soil survey database were used to identify hydric soils and low-productivity cropland.Soil Survey Staff. (2008). Gridded Soil Survey Geographic (gSSURGO) Database for North Carolina. United States Department of Agriculture, Natural Resources Conservation Service. Available online at: https://www.nrcs.usda.gov/wps/portal/nrcs/detail/soils/survey/geo/?cid=nrcs142p2_053628 (accessed on 2 September 2022)30-m
Parcels (NC One Map)Robeson County parcel boundaries with associated tax record attributes were used to incorporate property ownership information in the NBS suitability assessment.NC One Map. North Carolina Parcels. Raleigh, NC: NC One Map, 2016. Available online at: https://www.nconemap.gov (accessed on 2 September 2022)Vector dataset.
5-m resolution when converted to raster for analysis
Structures (NCEM and NC Flood Mapping Program)This dataset containing all building footprints in North Carolina was analyzed to minimize any potential conflicts between the proposed FloodWise practices and existing infrastructure.North Carolina Floodplain Mapping Program. North Carolina Building Footprints. Raleigh, NC: North Carolina Emergency Management, 2019. Available online at: https://www.nconemap.gov (accessed on 2 September 2022)Vector dataset.
5-m resolution when converted to raster for analysis
Roads (NCDOT):Location of roads was also analyzed to minimize any potential infrastructure conflicts.North Carolina Department of Transportation (NC DOT). North Carolina Route Arcs. Raleigh, NC: NCDOT, 2021. Available online at: https://connect.ncdot.gov/resources/gis/ (accessed on 2 September 2022)Vector dataset.
5-m resolution when converted to raster for analysis
National Landcover Database (Multi-Resolution Land Characteristics Consortium)Identification of cropland and open land was based on the land cover classes included in this 2019 remotely sensed dataset.Multi-Resolution Land Characteristics Consortium (MRLC). National Land Cover Database (NLDC). Available online at: https://www.mrlc.gov/data (accessed on 2 September 2022)30-m
Floodplain (FEMA)Depending on the proposed nature-based solution, location within the FEMA 100-year and 500-year floodplains could either limit or enhance suitability.Federal Emergency Management Agency (FEMA). (2020). FIMA NFIP Redacted Claims—V1. Washington DC, FEMA, 2020. Available online at: https://www.fema.gov/openfema-data-page/fima-nfip-redacted-claims-v1 (accessed on 2 September 2022)
Federal Emergency Management Agency (FEMA). National Flood Hazard Layer. Washington DC, FEMA, 2021. Available online at: Available online at: https://www.fema.gov/flood-maps/national-flood-hazard-layer (accessed on 2 September 2022)
Vector dataset.
5-m resolution when converted to raster for analysis
HUC-12 Sub-watersheds (NC One Map)For each proposed FloodWise practice, opportunity area results were summarized within each HUC-12 sub-watershedNorth Carolina Department of Environmental Quality. 12-Digit HUC Watersheds.Derived from The United States Watershed Boundary Dataset, United States Geological Survey. Raleigh, NC: NCDEQ, 2013. Available online at: https://data-ncdenr.opendata.arcgis.com/datasets/12-digit-huc-subwatersheds/explore (accessed on 2 September 2022)Vector dataset.
National Hydrography Dataset (USGS)This dataset includes streamline geometry and classifications.United States Geological Survey. National Hydrography Dataset. 2019. Available online at: https://www.usgs.gov/national-hydrography/national-hydrography-dataset (accessed on 2 September 2022)Vector dataset
Crop Production (NASS)The National Agricultural Statistics Survey (NASS) publishes a yearly dataset that refines the landcover classifications from the National Landcover Database to include spatial details about the types of crops grown. This dataset was used to identify high-value crops.United States Department of Agriculture (USDA). Cropland Data Layer. Washington DC, National Agricultural Statistics Survey 2016–2020. Available online at: https://nassgeodata.gmu.edu/CropScape/ (accessed on 14 June 2022).30-m
Inundated Cropland (NASS)NASS also publishes remotely sensed data delineated floodwater inundation on cropland from high-impact hurricanes. For Robeson County, cropland inundation data was available from Hurricanes Florence, Michael, and Dorian.United States Department of Agriculture (USDA). Cropland Data Layer. Washington DC, National Agricultural Statistics Survey 2016–2020. Available online at: https://nassgeodata.gmu.edu/CropScape/ (accessed on 14 June 2022).
National Agricultural Statistics Service (NASS). (2017). County Profile: Robeson County, North Carolina. 2017 Census of Agriculture. Available online: https://www.nass.usda.gov/Publications/AgCensus/2017/Online_Resources/County_Profiles/North_Carolina/cp37155.pdf (accessed on 2 September 2022)
United States Department of Agriculture. Disaster Analysis Data. Washington DC, National Agricultural Statistics Survey, 2019. Available online at: https://www.nass.usda.gov/Research_and_Science/Disaster-Analysis/2019/index.php (accessed on 2 September 2022)
30-m
Solar Panels (US Energy Information Administration)This point dataset describing locations of solar energy plants is derived from a larger dataset identifying locations of all energy generating infrastructure in the United States. Solar farming is common in the North Carolina Coastal Plain and may represent a land use incompatible with FloodWise practices.United States Energy Information Administration. Power Plants. Washington DC, 2020. Available online at: https://www.eia.gov/opendata/ (accessed on 2 September 2022)V dataset
Communications Towers (Department of Homeland Security Homeland Infrastructure Data)Locations of communication towers were included in mapping activities to ensure any proposed floodwater storage strategies would not interfere with access to infrastructure.Department of Homeland Security. Cellular Towers. Washington DC, Homeland Infrastructure Foundation-Level Data, 2021. Available online at: https://hifld-geoplatform.opendata.arcgis.com/ (accessed on 2 September 2022)Vector dataset

References

  1. International Panel on Climate Change (IPCC). AR6 Climate Change 2021: The Physical Science Basis. 2021. Available online: https://www.ipcc.ch/report/ar6/wg1/#SPM (accessed on 22 January 2022).
  2. Scholz, M.; Yang, Q. Guidance on variables characterizing water bodies including sustainable flood retention basins. Landsc. Urban Plan. 2010, 98, 190–199. [Google Scholar] [CrossRef]
  3. U.S. Environmental Protection Agency (EPA). Climate Change Indicators in the United States, 4th ed.; United States Environmental Protection Agency: Washington, DC, USA, 2016.
  4. Biesecker, M. Hurricane Florence Could Cost Carolina Farms Billions in Damage. PBS News. 21 September 2018. Available online: https://www.pbs.org/newshour/economy/hurricane-florence-could-cost-carolina-farms-billions-in-damage (accessed on 15 August 2021).
  5. Center for Disease Control and Prevention (CDC). Public Health Consequences of a Flood Disaster. MMWR Weekly, 3 September 1993. Available online: https://www.cdc.gov/mmwr/preview/mmwrhtml/00021451.htm (accessed on 27 July 2022).
  6. Collentine, D.; Futter, M.N. Realizing the potential of natural water measures in catchment flood management: Trade-offs and matching interests. J. Flood Risk Manag. 2018, 11, 76–84. [Google Scholar] [CrossRef]
  7. Dadson, S.J.; Hall, J.W.; Murgatroyd, A.; Acreman, M.; Bates, P.; Beven, K.; Wilby, R. A restatement of the natural science evidence concerning catchment-based ‘natural’ flood management in the U.K. Proc. R. Soc. Math. Phys. Eng. Sci. 2017, 473, 20160706. [Google Scholar]
  8. Jha, A.K.; Bloch, R.; Lamond, J. Cities and Flooding: A Guide to Integrated Urban Flood Risk Management for the 21st Century; World Bank Publications: Washington, DC, USA, 2012. [Google Scholar]
  9. International Union for Conservation of Nature (IUCN). WCC-2016-Res-069-EN: Defining Nature-based Solutions. 2016. Available online: https://portals.iucn.org/library/sites/library/files/resrecfiles/WCC_2016_RES_069_EN.pdf (accessed on 27 April 2022).
  10. Nicholson, A.; O’Donnell, G.; Wilkinson, M. The potential of runoff attenuation features as a Natural Flood Management Approach. J. Flood Risk Manag. 2019, 13, e12565. [Google Scholar] [CrossRef]
  11. Aly, N.A.; Casillas, G.; Luo, Y.S.; McDonald, T.J.; Wade, T.L.; Zhu, R.; Newman, G.; Lloyd, D.; Wright, F.A.; Chiu, W.A. Environmental impacts of Hurricane Florence flooding in eastern North Carolina: Temporal analysis of contaminant distribution and potential human health risks. J. Expo. Sci. Environ. Epidemiol. 2021, 31, 810–822. [Google Scholar] [CrossRef] [PubMed]
  12. Raymond, C.M.; Berry, P.; Breil, M.; Nita, M.R.; Kabisch, N.; de Bel, M.; Enzi, V.; Frantzeskaki, N.; Geneletti, D.; Cardinaletti, M.; et al. An Impact Evaluation Framework to Support Planning and Evaluation of Nature-Based Solutions Projects. Report Prepared by the EKLIPSE Expert Working Group on Nature-Based Solutions to Promote Climate Resilience in Urban Areas; Centre for Ecology & Hydrology: Wallingford, UK, 2017. [Google Scholar]
  13. South Florida Water Management District (SFWMD). Water Farming Pilot Projects Final Report: An Evaluation of Water Farming as a Means for Providing Water Storage/Retention and Improving Water Quality in the Indian River Lagoon/Saint Lucie River Watershed. 2018. Available online: https://www.sfwmd.gov/document/water-farming-pilot-projects-final-report-august-2018 (accessed on 2 September 2022).
  14. Prybutok, S.; Newman, G.; Atoba, K.; Sansom, G.; Tao, Z. Combining Costing Nature and Suitability Modeling to Identify High Flood Risk Areas in Need of Nature-Based Services. Land 2021, 10, 853. [Google Scholar] [CrossRef] [PubMed]
  15. Federal Emergency Management Agency (FEMA). Building Community Resilience with Nature-Based Solutions; U.S. Federal Emergency Management Agency: Washington, DC, USA, June 2021. Available online: https://www.fema.gov/sites/default/files/documents/fema_riskmap-nature-based-solutions-guide_2021.pdf (accessed on 17 June 2022).
  16. Nature-Based Solutions Coalition. The Nature-Based Solutions for Climate Manifesto—Developed for the UN Climate Action Summit 2019, Nature-Based Solutions, 14 August 2019. Available online: https://wedocs.unep.org/xmlui/bitstream/handle/20.500.11822/29705/190825NBSManifesto.pdf?sequence=1 (accessed on 17 June 2022).
  17. Chausson, A.; Turner, B.; Seddon, D.; Chabaneix, N.; Girardin, C.; Kapos, V.; Key, I.; Roe, D.; Smith, A.; Woroniecki, S.; et al. Mapping the effectiveness of Nature-based Solutions for climate change adaptation. Glob. Chang. Biol. 2021, 26, 6134–6155. [Google Scholar] [CrossRef] [PubMed]
  18. Solheim, A.; Capobianco, V.; Oen, A.; Kalsnes, B.; Wullf-Knutsen, T.; Olsen, M.; Del Seppia, N.; Arauzo, I.; Garcia Balaguer, E.; Strout, J.M. Implementing Nature-Based Solutions in Rural Landscapes: Barriers Experienced in the PHUSICOS Project. Sustainability 2021, 13, 1461. [Google Scholar] [CrossRef]
  19. Pristeri, G.; Peroni, F.; Pappalardo, S.E.; Codato, D.; Masi, A.; De Marchi, M. Whose Urban Green? Mapping and Classifying Public and Private Green Spaces in Padua for Spatial Planning Policies. ISPRS Int. J. Geo-Inf. 2021, 10, 538. [Google Scholar] [CrossRef]
  20. Pittman, S.J.; Stamoulis, K.A.; Antonopoulou, M.; Das, M.S.; Shahid, M.; Delevaux, J.M.S.; Wedding, L.M.; Mateos-Molina, D. Rapid Site Selection to Prioritize Coastal Seascapes for Nature-Based Solutions with Multiple Benefits. Front. Mar. Sci. 2022, 9, 832480. [Google Scholar] [CrossRef]
  21. Senes, G.; Ferrario, P.S.; Cirone, G.; Fumagalli, N.; Frattini, P.; Sacchi, G.; Valè, G. Nature-Based Solutions for StormWater Management—Creation of a Green Infrastructure Suitability Map as a Tool for Land-Use Planning at the Municipal Level in the Province of Monza-Brianza (Italy). Sustainability 2021, 13, 6124. [Google Scholar] [CrossRef]
  22. Dela Torre, D.M.; dela Cruz, P.K.; Jose, R.P.; Gatdula, N.B.; Blanco, A.C. Geospatial Assessment of Vulnerabilities of Croplands to Flooding Risks: A Case Study of Philippine River Basins. Int. Arch. Photogramm. Remote Sens. Spat. Inf. Sci. 2019, XLII-4/W19, 173–180. [Google Scholar] [CrossRef]
  23. Guerrero, P.; Haase, D.; Albert, C. Identifying Spatial Patterns and Ecosystem Service Delivery of Nature-Based Solutions. Environ. Manag. 2022, 69, 735–751. [Google Scholar] [CrossRef] [PubMed]
  24. Mubeen, A.; Ruangpan, L.; Vojinovic, Z.; Torrez, A.S.; Plavšić, J. Planning and Suitability Assessment of Large-scale Nature-based Solutions for Flood-risk Reduction. Water Resour. Manag. 2021, 35, 3063–3081. Available online: https://doi-org.prox.lib.ncsu.edu/10.1007/s11269-021-02848-w (accessed on 2 September 2022). [CrossRef]
  25. Jacobs, K.J. Costly and Deadly Hurricanes Made History in NC. Wcnc.com. 30 August 2021. Available online: https://www.wcnc.com/article/weather/costliest-and-deadliest-hurricanes-for-north-carolina/275-6618aa82-ef96-4289-94f4-3f2e22af9675 (accessed on 17 June 2022).
  26. Ready, N.C. Hurricanes. Available online: https://www.readync.gov/stay-informed/north-carolina-hazards/hurricanes#history (accessed on 17 June 2022).
  27. Hovis, M.; Cubbage, F.; Hollinger, J.C.; Shear, T.; Doll, B.; Kurki-Fox, J.; Line, D.; Lovejoy, M.; Evans, B.; Potter, T. Determining the costs, revenues, and cost-share payments for the “FloodWise” program: Nature-based solutions to mitigate flooding in eastern, rural North Carolina. Nat.-Based Solut. 2022, 2, 100016. [Google Scholar] [CrossRef]
  28. Hovis, M.; Hollinger, J.C.; Cubbage, F.; Shear, T.; Doll, B.; Kurki-Fox, J.J.; Line, D.; Fox, A.; Baldwin, M.; Klondike, T.; et al. Natural Infrastructure Practices as Potential Flood Storage and Reduction for Farms and Rural Communities in the North Carolina Coastal Plain. Sustainability 2021, 13, 9309. [Google Scholar] [CrossRef]
  29. Rains, C. Robeson County Working Lands Protection Plan. October 2019. Available online: https://umo.edu/wp-content/uploads/Robeson-County-Working-Lands-Protection-Plan.pdf (accessed on 14 June 2022).
  30. US Census Bureau. Quick Facts: Robeson County, North Carolina. 2021. Available online: https://www.census.gov/quickfacts/fact/table/robesoncountynorthcarolina/POP010220#POP010220 (accessed on 14 June 2022).
  31. North Carolina Rural Center. About Us. 2020. Available online: https://www.ncruralcenter.org/about-us/ (accessed on 14 June 2022).
  32. Strickland, C.; Disaster Relief for Farmers. NC Cooperative Extension. 2018. Available online: go.ncsu.edu/readext?562285 (accessed on 29 August 2022).
  33. North Carolina Geodetic Survey (NCGS). North Carolina Counties. Available online: https://ncgs.nc.gov/geodeticmonuments/ (accessed on 6 September 2022).
  34. National Agricultural Statistics Service (NASS). County Profile: Robeson County, North Carolina. 2017 Census of Agriculture. 2017. Available online: https://www.nass.usda.gov/Publications/AgCensus/2017/Online_Resources/County_Profiles/North_Carolina/cp37155.pdf (accessed on 14 June 2022).
  35. Brown, M.J. Forest Statistics for North Carolina, 2002; Resour. Bull. SRS-68; U.S. Department of Agriculture, Forest Service, Southern Research Statio: Asheville, NC, USA, 2004; 78p.
  36. Multi-Resolution Land Characteristics Consortium (MRLC). National Land Cover Database (NLCD) Class Legend and Description; Multi-Resolution Land Characteristics Consortium: Research Triangle Park, NC, USA, 2019. Available online: https://www.mrlc.gov/data (accessed on 14 June 2022).
  37. United States Department of Agriculture (USDA). Cropland Data Layer, National Agricultural Statistics Survey (NASS): Washington DC, USA, 2016–2020. Available online: https://nassgeodata.gmu.edu/CropScape/ (accessed on 14 June 2022).
  38. North Carolina Department of Transportation (NC DOT). North Carolina Route Arcs. NCDOT: Raleigh, NC, USA, 2021. Available online: https://connect.ncdot.gov/resources/gis/ (accessed on 14 June 2022).
  39. North Carolina Floodplain Mapping Program. North Carolina Building Footprints. North Carolina Emergency Management: Raleigh, NC, USA, 2019. Available online: https://www.nconemap.gov (accessed on 2 September 2022).
  40. United States Energy Information Administration. Power Plants. Washington DC, 2020. Available online: https://www.eia.gov/opendata/ (accessed on 14 June 2022).
  41. Department of Homeland Security. Cellular Towers; Homeland Infrastructure Foundation-Level Data: Washington, DC, USA, 2021; Available online: https://hifld-geoplatform.opendata.arcgis.com/ (accessed on 14 June 2022).
  42. Cubbage, F.; Glenn, V.; Mueller, J.P.; Robison, D.; Myers, R.; Luginbuhl, J.-M.; Myers, R. Early tree growth, crop yields and estimated returns for an agroforestry trial in Goldsboro, North Carolina. Agrofor. Syst. 2012, 86, 323–334. Available online: https://doi-org.prox.lib.ncsu.edu/10.1007/s10457-012-9481-0 (accessed on 2 September 2022). [CrossRef]
  43. Pattanayak, S.; Mercer, D.E.; Sills, E.; Yang, J.C. Taking stock of agroforestry adoption studies. Agrofor. Syst. 2003, 57, 173–186. [Google Scholar] [CrossRef]
  44. Soil Survey Staff. Gridded Soil Survey Geographic (gSSURGO) Database for North Carolina. United States Department of Agriculture, Natural Resources Conservation Service. 2008. Available online: https://gdg.sc.egov.usda.gov/ (accessed on 14 June 2022).
  45. Luu, T.A.; Nguyen, A.T.; Trinh, Q.A.; Pham, V.T.; Le, B.B.; Nguyen, D.T.; Hoang, Q.N.; Pham, H.T.T.; Nguyen, T.K.; Luu, V.N. Farmers’ Intention to Climate Change Adaptation in Agriculture in the Red River Delta Biosphere Reserve (Vietnam): A Combination of Structural Equation Modeling (SEM) and Protection Motivation Theory (PMT). Sustainability 2019, 11, 2993. [Google Scholar] [CrossRef] [Green Version]
  46. Rogers, R.W. Cognitive and physiological processes in fear appeals and attitude change: A revised theory of protection motivation. In Social Psychophysiology: A Sourcebook; Cacioppo, B.L., Petty, L.L., Eds.; The Guilford Press: Guilford, NC, USA; London, UK, 1983; pp. 153–176. [Google Scholar]
  47. Rogers, R.W.; Prentice-Dunn, S. Protection motivation theory. In Handbook of Health Behaviour Research I: Personal and Social Determinants; Gochman, D.S., Ed.; Plenum Press: New York, NY, USA, 1997; pp. 113–132. [Google Scholar]
  48. Soil Survey Staff. Soil Taxonomy: A Basic System of Soil Classification for Making and Interpreting Soil Surveys; USDA Natural Resources Conservation Service, U.S. Government Printing Office: Washington, DC, USA, 1999; p. 869.
  49. Bryce, S.; Atlas, E. Percent Agriculture on Hydric Soil. U.S. Environmental Protection Agency. 2015. Available online: https://enviroatlas.epa.gov/enviroatlas/DataFactSheets/pdf/ESN/Percentagricultureonhydricsoil.pdf (accessed on 14 June 2022).
  50. North Carolina Floodplain Mapping Program and North Carolina Department of Transportation. Digital Elevation Model (20’ Grid Cells); NC One Map: Raleigh, NC, USA, 2017. Available online: https://www.nconemap.gov (accessed on 14 June 2022).
  51. Stephens, K. Stream and Wetland Restoration Site Searches for NCDOT. In Proceedings of the ESRI User Conference, San Diego, CA, USA, 11–15 July 2022; Available online: https://proceedings.esri.com/library/userconf/proc02/pap0994/p0994.htm (accessed on 27 April 2022).
Figure 1. Location of Atlantic Coastal Plain within the United States with an enlargement showing location of Atlantic Coastal Plain within North Carolina. Within North Carolina, areas located east of the Coastal Plain are frequently referred to as ‘Eastern North Carolina’.
Land 11 01504 g001
Figure 2. Robeson County, North Carolina [33].
Land 11 01504 g002
Figure 3. Summary of Geospatial Analysis and NBS Suitability Process.
Land 11 01504 g003
Figure 4. Locations of nine counties assessed as a potential study area: Robeson County (A); Columbus County (B); Jones County (C); Martin County (D); Edgecombe County (E); Duplin County (F); Cumberland County (G); Halifax County (H); and Nash County (I).
Land 11 01504 g004
Figure 5. Diagram illustrating the general geospatial overlay analysis process for identifying Eligible Cropland.
Land 11 01504 g005
Figure 6. Diagram illustrating the general method of geospatial analysis for identifying forest and tree planting opportunities.
Land 11 01504 g006
Figure 7. Diagram illustrating the general process of geospatial analysis for identifying Wetland Restoration and Creation opportunities.
Land 11 01504 g007
Figure 8. Diagram illustrating the general process of geospatial analysis for identifying Dry Dam and Berm (Water Farming) opportunities.
Land 11 01504 g008
Figure 9. Diagram illustrating the general process of geospatial analysis for identifying Stream Restoration opportunities.
Land 11 01504 g009
Figure 10. Results of Robeson County inventory mapping including: cropland, pasture, and hay (A); forests (B); low-productivity soils (C); slopes below 2% (D); existing wetlands and streams (E); FEMA floodplains (F); hydric soils (G); and roads and developed areas (H).
Land 11 01504 g010
Figure 11. Area identified as Eligible Cropland in Robeson County.
Land 11 01504 g011
Figure 12. Forest and tree planting opportunity areas in Robeson County.
Land 11 01504 g012
Figure 13. Wetland restoration or creation opportunity areas in Robeson County.
Land 11 01504 g013
Figure 14. Dry dam and berm (water farming) opportunity areas in Robeson County.
Land 11 01504 g014
Figure 15. Stream restoration opportunity areas with a 1000-foot minimum length (with adjacent open land requirement) in Robeson County.
Land 11 01504 g015
Figure 16. Overlay of all Robeson County parcels with at least one identified opportunity area. Darker values indicate parcels where opportunity areas for multiple FloodWise practices were identified.
Land 11 01504 g016
Figure 17. Symbolizing the concentrations of opportunity area parcels as a heat map better illustrates spatial patterns of clustering and helps identify hotspots where implementation of FloodWise practices can be explored.
Land 11 01504 g017
Table 1. Preferred FloodWise Flood Mitigation Practices for Rural, Eastern North Carolina, and General Geospatial Criteria for Locating Potential Opportunity Areas (Adapted from [28]).
CategoryDescriptionGeneral Geospatial Criteria
Agricultural
AgroforestryCombining mixed pine trees and pasture fieldsCropland and open land (excluding high-value crops) with low-productivity soils.
Forests and Tree Planting (Afforestation)Planting bottomland hardwood or pine forest speciesCropland and open land (excluding high-value crops) with low-productivity soils.
Hardpan BreakupBreaking up compacted hardpan layers to allow for soil water infiltrationNot suitable for mapping; data unavailable Hardpan can occur naturally or result from farming practices.
Cover Crops and No-tillIncluding legume and non-legume cover crops on fields during winterNot suitable for mapping. No explicit spatial criteria to determine site suitability.
Wetland and Stream
Wetland RestorationRestoring natural wetlands along streams or at a lower elevation with the use of grasses, sedges, and water control structures, or bottomland hardwood wetland banks on prior converted agricultural land Cropland and open land (excluding high-value crops) with hydric soils and slopes less than 2%.
Natural Stream Channel RestorationRestoring previously straightened streams to the original configurationStraightened stream segments (sinuosity < 1.04) no less than 1000 linear feet (304 m) with an unforested 200-foot (61 m) buffer
Structural
Dry Dams and BermsCreating catchment areas to store water during flooding is also referred to as “water farming”.Cropland and open land (excluding high-value crops) located outside the floodplain with slopes less than 2%.
Land Drainage FeaturesInstalling land drainage ditch controls, such as tiles and tiling outletsNot suitable for mapping. County-wide maps identifying locations of existing drainage systems were not available.
Table 2. Initial County Analysis and Assessment.
CountyArea (ac)Slopes
Under 2%
CroplandLow Slope
Cropland
Low-Productivity
Cropland
Inundated
Cropland
Managed
Timber Areas
acpctacpctacpctacpctacpctacpct
Robeson (A)607,914478,11079%234,71139%200,96986%99754%14,3636%18,9223%
Columbus (B)611,415461,66376%149,50224%110,50074%28822%72265%76,12912%
Jones (C)303,750225,11774%63,30921%49,56178%12762%884714%42,65314%
Martin (D)292,954212,46073%90,55631%69,78977%6381%27433%30,47410%
Edgecombe (E)324,893203,77863%128,66040%93,41873%47434%11,3009%19,5476%
Duplin (F)525,540322,10561%190,27236%126,67167%34592%26,53214%37,2127%
Cumberland (G)421,071236,69656%74,74618%58,72379%11,26715%832411%22,3015%
Halifax (H)468,044198,63542%138,25830%76,77556%29272%90047%57,63512%
Nash (I)347,761110,72932%110,29532%42,35738%9671%136,74012%30,1809%
Note: 1 hectare = 2.47 acres.
Table 3. Table summarizing results of FloodWise NBS opportunity area identification.
FloodWise NBSArea (Total Acres)Percentage of Total AreaPercentage of Eligible Cropland
Eligible Cropland208,718 acres34%--
Afforestation67,787 acres11%32%
Wetland Restoration27,716 acres4.50%13%
Dry Dams and Berms3932 acres0.60%1.80%
Stream Restoration (1000-foot minimum)65.7 stream miles2.6% (of total delineated streams)--
Stream Restoration (500-foot minimum)98.8 stream miles3.8% (of total delineated streams)--
Note: 1 ha = 2.47 ac; 1 mile = 1.6 km.
Publisher’s Note: MDPI stays neutral with regard to jurisdictional claims in published maps and institutional affiliations.

