Abstract
Tourism is distinctly regional with respect to the regional distribution of tourism resources, tourist attractions and supply, and spatial continuity of tourist activities. Using point-of-interest data from 2166 tourist attractions in the Yangtze River Delta, this study analyzes the spatial distribution pattern of tourist attractions and their influencing factors by applying the methods of nearest proximity index, kernel density analysis, standard deviation ellipse, hotspot analysis, and spatial superposition analysis. The results show that the number of modern recreational tourist attractions accounts for the largest proportion. The spatial distribution pattern shows more attractions in the north than the south and more in the east than the west. The spatial density of tourist attractions in Shanghai is far greater than that in other regions, followed by Jiangsu and Zhejiang. The five types of tourist attractions show a significant aggregation state. Natural ecological tourist attractions are clustered near Nanjing and Huangshan; historical and cultural tourist attractions are formed in a T-shape by Shanghai, Hangzhou, and Nanjing; modern recreational tourist attractions are clustered in Shanghai and Hangzhou; and industrial integration tourist attractions are clustered in Shanghai, Nanjing, and Hangzhou. Physical geography, traffic, and social economy are the main factors affecting the spatial distribution of tourist attractions.
1. Introduction
Tourist attractions act as gathering places to display tourism resources and are the core and location of tourism activities [1]. Tourist attractions can be scenic spots, nature reserves, cultural museums, tourist resorts, geoparks, etc. They have functions for visiting, leisure/vacation, recreation, and fitness [2]. Therefore, many scholars have explored and analyzed the classification of tourist attractions. For example, Pearce et al. divided tourist attractions into two categories, namely, natural and human-made [3]. This classification is similar to the classification of tourism resources and shows that tourist attractions commonly have integrated elements that are natural and human-made and cannot be separated completely, especially tourist attractions with both natural and cultural heritage. Leask classified tourist attractions according to the natural or human-made, paid or free, public or private, local or regional market, and domestic or international market [4]. However, he did not propose the names of various tourist attractions, only the classification criteria. Lew pointed out that most studies basically have classified tourist attractions from three perspectives, namely, ideographic, structural, and tourist cognition perspectives [1]. However, regardless of the type of tourist attractions, their goal is to provide tourists with a comfortable travel experience and to achieve the social, economic, and environmentally sustainable development of tourist attractions [2].
Tourist attractions are a very general concept and generally refer to a number of geographically connected places with a number of common characteristics, including transportation networks and tourism service facilities composed of regional units [2]. Its interior has the characteristics of consistency, relevance, and integrity. It can be restricted by the administrative region but also can break through the constraints of the administrative region based on landform, landscape, social and cultural relations, and economic relations [5]. Its spatial span varies greatly, from as large as a country to as small as a village. Although there is no definition that applies to all tourist attractions, all tourist attractions have the following basic characteristics. First, they are located in a region with a clear geographical scope. Second, they are based on tourism resources. Third, they are places for engaging in tourism and leisure activities.
The spatial pattern of tourist attractions not only involves the distribution state and element combination of tourist attractions but also has a significant impact on the spatial behavior of tourists [6,7]. For example, Pan et al. analyzed the spatial distribution characteristics of 2424 A-level tourist attractions in China based on methods such as the nearest neighbor index, K-index, and hotspot clustering in GIS. Furthermore, the spatial distribution of tourist attractions has a significant impact on the spatial and temporal behavior of tourists, regional tourism income, and social development level. Previous studies on the spatial structure of tourism mainly used location theory, central periphery theory, and the core edge model to explore the spatial structure and the evolution process of tourism destinations [8,9]. However, there are few studies on the spatial pattern of tourist attractions, which mainly focus on the spatial distribution characteristics of tourist attractions [10,11], influencing factors [12,13], spatio-temporal evolution [14], and optimal path [15]. For example, Kang et al. analyzed the spatial structure of the tourist attraction system in Seoul, South Korea, using a geographic information system based on anchor point theory [16]. Based on the data of high-level tourist attractions in Inner Mongolia, China, Wu et al. systematically sorted out the spatial distribution pattern, accessibility, and influencing factors of various tourist attractions by using methods such as nearest neighbor index, kernel density, accessibility, and spatial autocorrelation [17].
The research objects of previous studies are mostly A-level tourist attractions. Recently, some scholars have conducted classification research for all tourist attractions in the region, using mathematical statistics and spatial analysis as the main research methods. For example, Guo et al. took all tourist attractions in Shanxi Province, China as the research object. Based on their classification, they studied the spatial distribution pattern, distribution direction, and spatial distribution characteristics of different categories of tourist attractions based on GIS analysis technology [18]. In addition, Matthews et al. pointed out that the superposition of two or more attractions creates a cumulative attraction, which can provide a critical mass that cannot be provided by individual attractions and is essential for attracting tourists [19]. Wang et al. further analyzed the spatial structure of tourist attraction’s cooperation in the Yangtze River Delta of China by using geographic information systems and social network analysis methods [11]. Therefore, it is of great practical significance to study the spatial pattern of tourist attractions and their influencing factors.
Although some scholars have found that the size of regional tourism attractions is closely related to the degree of spatial agglomeration of tourist attractions [20,21,22,23,24,25,26,27,28,29,30], the previous research objects of the spatial distribution of tourist attractions were mostly A-level tourist attractions, and there was a lack of research on the spatial distribution of all existing tourist attractions after systematic sorting and classification. Few studies have focused on the spatial patterns of tourist attractions in geographically similar and culturally similar regions (such as the Yangtze River Delta). In particular, the tourist attractions in the Yangtze River Delta region of China, due to their small differences in tourism resource endowments and similar types, have more intense competition among themselves and greater internal friction. In addition, using big data and traditional geographic information systems to study the spatial pattern of tourist attractions in the Yangtze River Delta region is even rarer. To fill this research gap, this study first classified the tourist attractions in the Yangtze River Delta region, and then studied the spatial distribution pattern, distribution direction, and influencing factors of tourist attractions based on point-of-interest (POI) data. The research questions of this study are as follows. What categories can tourist attractions be divided into? What is the spatial pattern of different types of tourist attractions? Are there spatial differences? If there are spatial differences, what are the influencing factors? These issues reflect the spatial structure and spatial distribution of tourist attractions. It is of great significance to understand the spatial organization and attractiveness of tourist attractions for the purpose of policymaking for tourism spatial planning. To answer these questions, we established three sub-goals.
First, based on previous studies, this study uses ArcMap 10.7 software to analyze the spatial pattern of tourist attractions using the methods of average nearest neighbor (ANN) analysis, kernel density analysis, standard deviational ellipse, and hot spot analysis.
Second, the main factors affecting the spatial pattern of tourist attractions are clarified by using spatial superposition analysis from the three aspects of physical geography, location and transportation, and social economy.
Third, this study provides a basis for clarifying the advantageous tourism resources of cities and finding the growth poles of tourist attractions. It also provides a reference for the rational development of tourism resources, the orientation of tourism development, and the corresponding tourism marketing strategies.
2. Materials and Methods
2.1. Study Area
The Yangtze River Delta region is referred to as the Yangtze River Delta. There are 41 cities, including Shanghai, Jiangsu, Zhejiang, and Anhui provinces. The Yangtze River Delta is located in the lower reaches of the Yangtze River in China, bordering the Yellow Sea and the East China Sea. It is located at the intersection of the rivers and seas. There are many coastal ports along the river, and it is an alluvial plain formed before the Yangtze River enters the sea. At the end of 2019, the Yangtze River Delta had a population of 227 million, covering an area of 358,000 square kilometers. In 2020, the GDP of the Yangtze River Delta region was 24.5 trillion yuan. The urbanization rate of permanent residents has exceeded 60 percent. With less than 4 percent of China’s land area, it has generated nearly one-quarter of China’s total economic output and one-third of China’s total imports and exports. In 2019, the density of the railway network in the Yangtze River Delta reached 325 km per 10,000 square kilometers, 2.2 times the average level in China.
The Yangtze River Delta is rich in tourism resources and highly developed in tourist attractions, including natural and ecological tourist attractions, such as Huangshan and Taihu Lake; historical and cultural tourist attractions, such as Xidi and Hongcun; and human-made tourist attractions, such as Disneyland and Songcheng. The Yangtze River Delta enjoys high accessibility, with numerous air, high-speed rail, and high-speed stations and a dense road network, with basically seamless connections between various transportation modes. In addition, it has superior accommodation and catering facilities which can meet the needs of different people for entertainment, business, and other aspects. Thus, it is representative to select the tourist attractions in the Yangtze River Delta as a case study.
2.2. Data Collection and Analysis
Gaode Map (Amap) has Grade A surveying and mapping qualification for navigation of electronic Maps, Grade A surveying and mapping aerial photography, and Grade A surveying and mapping qualification for Internet Map service. Moreover, Gaode Map has the characteristics of deep POI, and its data are scientific, real-time, and effective. Therefore, this study extracted 3533 POI data points from Gaode Map on 19 March 2022. Cities in the Yangtze River Delta were selected as the selected region, and three keywords of “tourism”, “tourist attraction”, and “scenic spot” were entered. The attributes of POI data points included city, name, address, longitude and latitude coordinates, and other information. The POI extraction process contained the keywords related to “tourism” in the data points, such as “hotel” and “tourist hotels”. As tourist attractions are the research object, this study is not related to other parts of the travel service industry. Thus, after eliminating duplicate data and “tourist hotels” where the research object is not based on POI data, we retained a total of 2166 POI data. POI data are points of interest on a map. POI data belongs to the category of geospatial big data, which represents the point-like spatial data of real geographic entities, generally including name, category, geographic coordinates, and other information. Due to its low acquisition cost and high data accuracy, POI data can meet the requirements of urban spatial layout planning and has been widely applied in the field of regional planning research, such as urban functional area identification, residents’ spatio-temporal behavior, urban structure analysis, natural environment assessment, etc. POI data comes from a wide range of sources. Amap and Baidu Map can provide all kinds of POI data needed for research. Researchers can use Python, Java, and other programming languages to obtain the relevant JSON format data through API, and then extract the required POI data from the JSON data.
2.3. Research Methods
Due to the differences in natural geographical environment, history, economy, culture, and other aspects in different regions of the Yangtze River Delta, the distribution of tourist attractions in the Yangtze River Delta may also be different. In this study, the average nearest neighbor analysis, kernel density, standard deviational ellipse, and hot spot analysis were selected to explore the overall spatial distribution pattern, agglomeration characteristics, distribution direction, and spatial distribution characteristics of specific cities of tourist attractions in the Yangtze River Delta. The spatial pattern of tourist attractions was studied by using the correlation method of global spatial distribution and local spatial distribution in GIS spatial analysis from the whole to the local order. This can also be seen as a consecutive analysis line of spatial analysis.
2.3.1. Average Nearest Neighbor Analysis
ANN analysis measures the distance between the centroid of each element and the centroid of its nearest neighbor. It then computes the average of all those nearest neighbor distances. The ANN is calculated by dividing the observed average distance by the expected average distance. The ANN can be calculated by
In Formula (1), is the average of the distance between the measuring element and its nearest neighbor element centroid and is the average distance of the random distribution of factors. If is greater than 1, it is a random distribution; if is less than 1, it is an agglomeration distribution.
2.3.2. Kernel Density
We applied kernel density to analyze the spatial density of tourist attractions [8], and its formula is as follows:
In Formula (2), is the longitude and latitude position shown in the POI data of tourist attractions, is the tourist attractions formed with as the center of the circle and as the radius, and the number of them is .
2.3.3. Standard Deviational Ellipse
The standard deviational ellipse in the spatial analysis was first proposed by Lefever in 1926 [31]. We used this method to analyze the direction of the spatial distribution of tourist attractions. First, we determined the center of the circle. We directly used the arithmetic mean center to calculate the center of the ellipse. The formula is as follows:
In Formulas (3) and (4), and are the spatial position coordinates of each element, and and are the arithmetic mean centers. and are the center of the ellipse.
Then, we took the axis as the criterion; due north (12 points direction) is 0 degrees, with clockwise rotation to determine the direction. The calculation formula is as follows:
In Formulas (6)–(8), and are the difference between the average center and the and coordinates. Finally, we determined the length of the -axis and -axis as follows:
2.3.4. Hot Spot Analysis
We used hot spot analysis to identify spatially significant hot and cold spots by using the local General G index given a set of weighted elements. Getis-Ord was utilized to analyze the identification of hot spots. The formula is as follows:
In Formula (11), represents the impact degree of individual to individual in space, is the attribute value of the location . Further standardization of leads to the following formula:
In Formula (12): and are the matrix of expectation and variance, respectively. When it shows statistical significance, if scores over 0, the higher the score, the denser the high-value clustering of target object attributes (to form hot spots); when scores below 0, the lower the score, the denser the low-value clustering of target object attributes (to form cold spots) [18]. Hot spot analysis checks every element in the environment of neighboring elements. Therefore, a single element and its surrounding are all high values; that is, the area is a gathering area of high values with high values, which is called a hot spot. On the contrary, the cold spot indicates not only the low value itself but also the low value adjacent to it, that is, the aggregation area of low value and low value. We applied this method to analyze the spatial agglomeration of tourist attractions.
3. Spatial Patterns of Tourist Attractions
3.1. Classification of Tourist Attractions
Most previous research on the classification of tourist attractions refers to the classification method of tourist resources, but there are some essential differences between tourist resources and tourist attractions. Tourism resources [22] are the elements that attract tourists to visit tourist destinations and are the basis of tourism product development, while tourist attractions [23] are the product of the market-oriented development of tourism resources and the main body of tourism destination marketing. Therefore, this study refers to the classification standards in “The Development Report of China’s Tourist Attractions (2019–2020) Fact Sheet” published by the Ministry of Culture and Tourism of China and divides the tourist attractions in the Yangtze River Delta into five categories: natural ecological tourist attractions, historical and cultural tourist attractions, modern recreational tourist attractions, industrial integration of tourist attractions, and other kinds of tourist attractions (Table 1).

Table 1.
Types of tourist attractions in the Yangtze River Delta.
Among them, natural ecological tourist attractions refer to scenic attractions based on natural ecological tourism resources (including forests, waters, geology, landforms, etc.). Historical and cultural tourist attractions refer to the attractions based on various historical and cultural tourist resources (including ancient villages, war sites, museums, etc.), such as cultural relics, arts, social environment, ethnic customs, and material production. Modern recreational tourist attractions refer to a recreational area that relies on a variety of recreational activities, elements, services, and reception facilities, including theme parks, resorts, rural areas, urban parks, and characteristic streets. Industrial integration of tourist attractions refers to tourist attractions that are formed based on the intercrossing, interpenetration, and gradual integration of tourism and other different industrial categories (including industrial tourism, science and technology education tourism, cultural and creative tourism, etc.). Other kinds of tourist attractions refer to tourist attractions (specifically buildings, sculptures, etc.) that cannot be counted among the above kinds of tourist attractions.
In the division of tourist attractions, if we found mixed tourist attractions, we will first judge what kind of tourism resources occupy the dominant position and classify tourist attractions according to the tourism resources [1,2,3,4,5,6,7,8,9,10,11,12,13,14,15,16,17,18]. However, there are also exceptions, such as some different types of tourism resources in the same tourist attraction that obviously belong to different functional areas. In this case, we prefer to break it down. For example, the Huangshan Scenic Area belongs to natural ecological tourist attractions and the Huangshan Resort belongs to modern recreational attractions. Therefore, Huangshan Scenic Area and Huangshan Resort are regarded as two independent tourist attractions.
The number of various tourist attractions in descending order is modern recreational tourist attractions, historical and cultural tourist attractions, natural ecological tourist attractions, industrial integration tourist attractions, and other kinds of tourist attractions, indicating that the marketization degree of tourist attractions is relatively high, and their tourist products tend to be diversified. The number of modern recreational tourist attractions has far exceeded other types of tourist attractions, indicating that the development of modern human-made tourist attractions is more in-depth. The number of historical and cultural tourist attractions ranked second, indicating that the Yangtze River Delta is rich in cultural tourism resources, including Nanjing, the ancient capital of the six Dynasties, Shanghai, Anhui, famous for its ancient villages in southern Anhui, and Zhejiang, represented by various neolithic sites, official kiln sites, and overseas Chinese hometown culture. The number of natural ecological tourist attractions is the third, mainly because the Yangtze River Delta has mountain-type tourism resources, including Zhejiang-Fujian hills, Huangshan and Dabie Mountains, and dispersed river/lake tourism resources. The number of industrial integration tourist attractions ranks fourth, which reflects the level of economic development and modernization of the Yangtze River Delta region. However, due to the lack of a deep foundation and large investment, there is still a gap between their number and the top three tourist attractions. The number of other kinds of tourist attractions ranked fifth, mainly as a small number of tourist attractions that could not be classified into the specific types mentioned above.
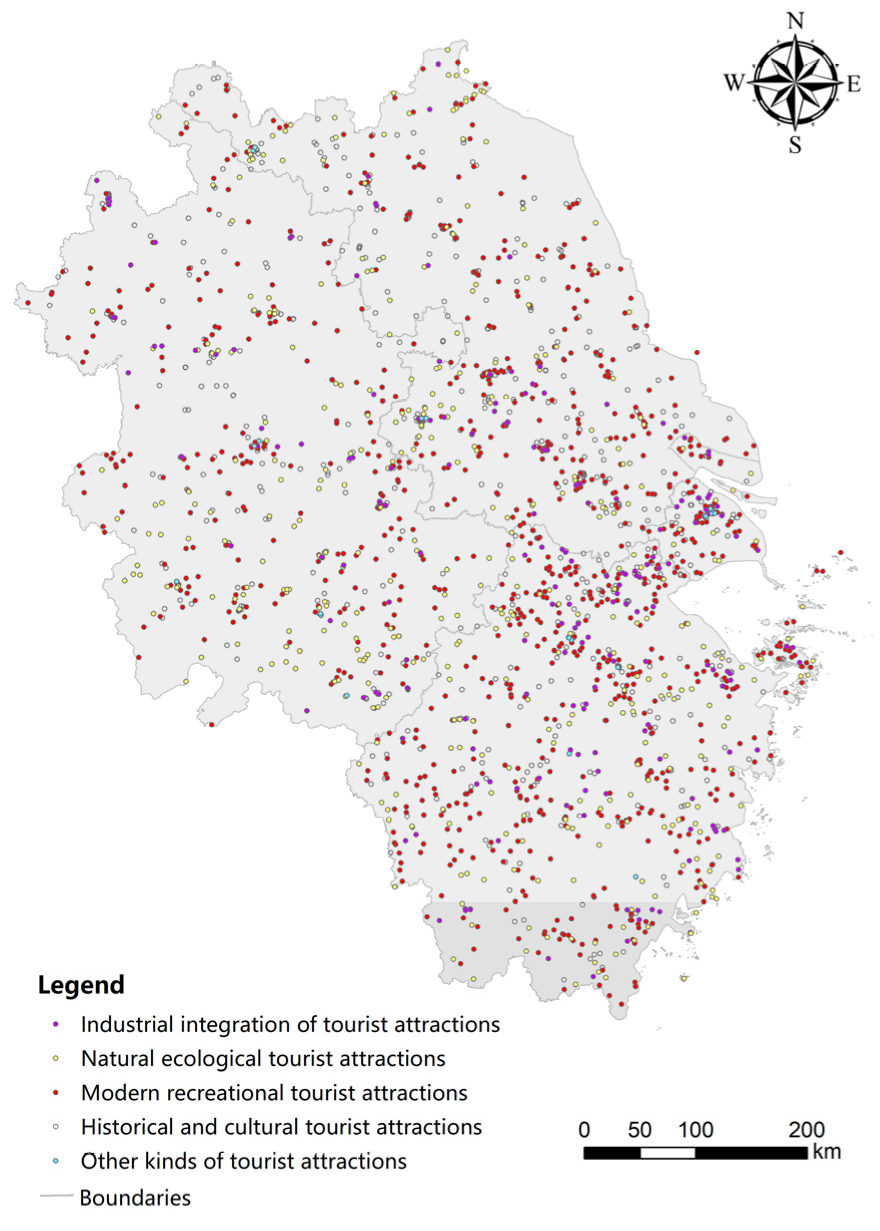
Arcmap10.7 software was used to visually express the types of tourist attractions (Figure 1). The vector map data of administrative boundaries were obtained from the Database of the China National Basic Geographic Information System. The five types of tourist attractions mentioned above are distributed in all cities of the Yangtze River Delta, but there are spatial differences in the quantity distribution of the five types of tourist attractions. The number of tourist attractions presents a spatial distribution pattern of more in the north than the south and more in the east than the west.
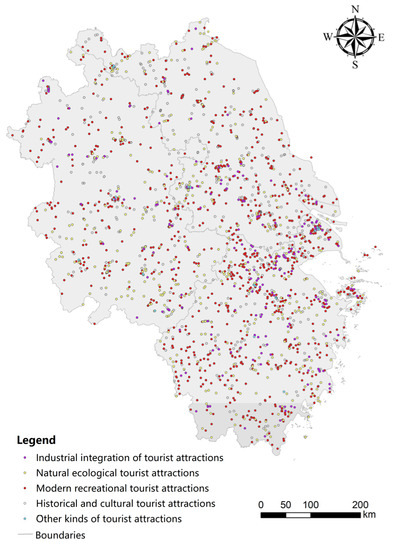
Figure 1.
Spatial layout of different types of tourist attractions.
From the spatial density of tourist attractions (number of tourist attractions/land area) (Table 2), various tourist attractions in Shanghai space density were significantly greater than in other areas, including the historical and cultural tourist attractions, modern recreational tourist attractions, and industrial integration of tourist attractions; the density of other types of tourist attractions are twice that in other areas. This shows that the tourist attractions in Shanghai have formed a certain agglomeration effect, and their overall competitiveness is greater than that of surrounding areas. By comparing various tourist attractions within the territory of Jiangsu, Zhejiang, and Anhui number, we can find that historical and cultural tourist attractions in Jiangsu and Zhejiang natural ecological tourist attractions, modern recreational tourist attractions, and industrial integration of tourist attractions density have a certain comparative advantage, while the density of various kinds of tourist attractions in Anhui province is relatively low.
Table 2.
The density of the five types of tourist attractions (per 10,000 km2).
3.2. Average Nearest Neighbor Analysis
The ANN analysis tool in the spatial statistics toolbar of ArcMap 10.7 software was used to analyze the five categories of tourist attractions and their overall agglomeration effect, and the ANN index of tourist attractions was obtained (Table 3).
Table 3.
Results of average nearest neighbor analysis of tourist attractions.
The ANN values of the five types of tourist attractions and their general situation are all less than 1, and the Z value of the general situation is −30.39, indicating that both the overall distribution of tourist attractions and their spatial distribution of various types present a state of significant agglomeration. This may be due to the rich and dense spatial distribution of tourism resources, resulting in similar spatial characteristics of tourist attractions.
3.3. Kernel Density Analysis
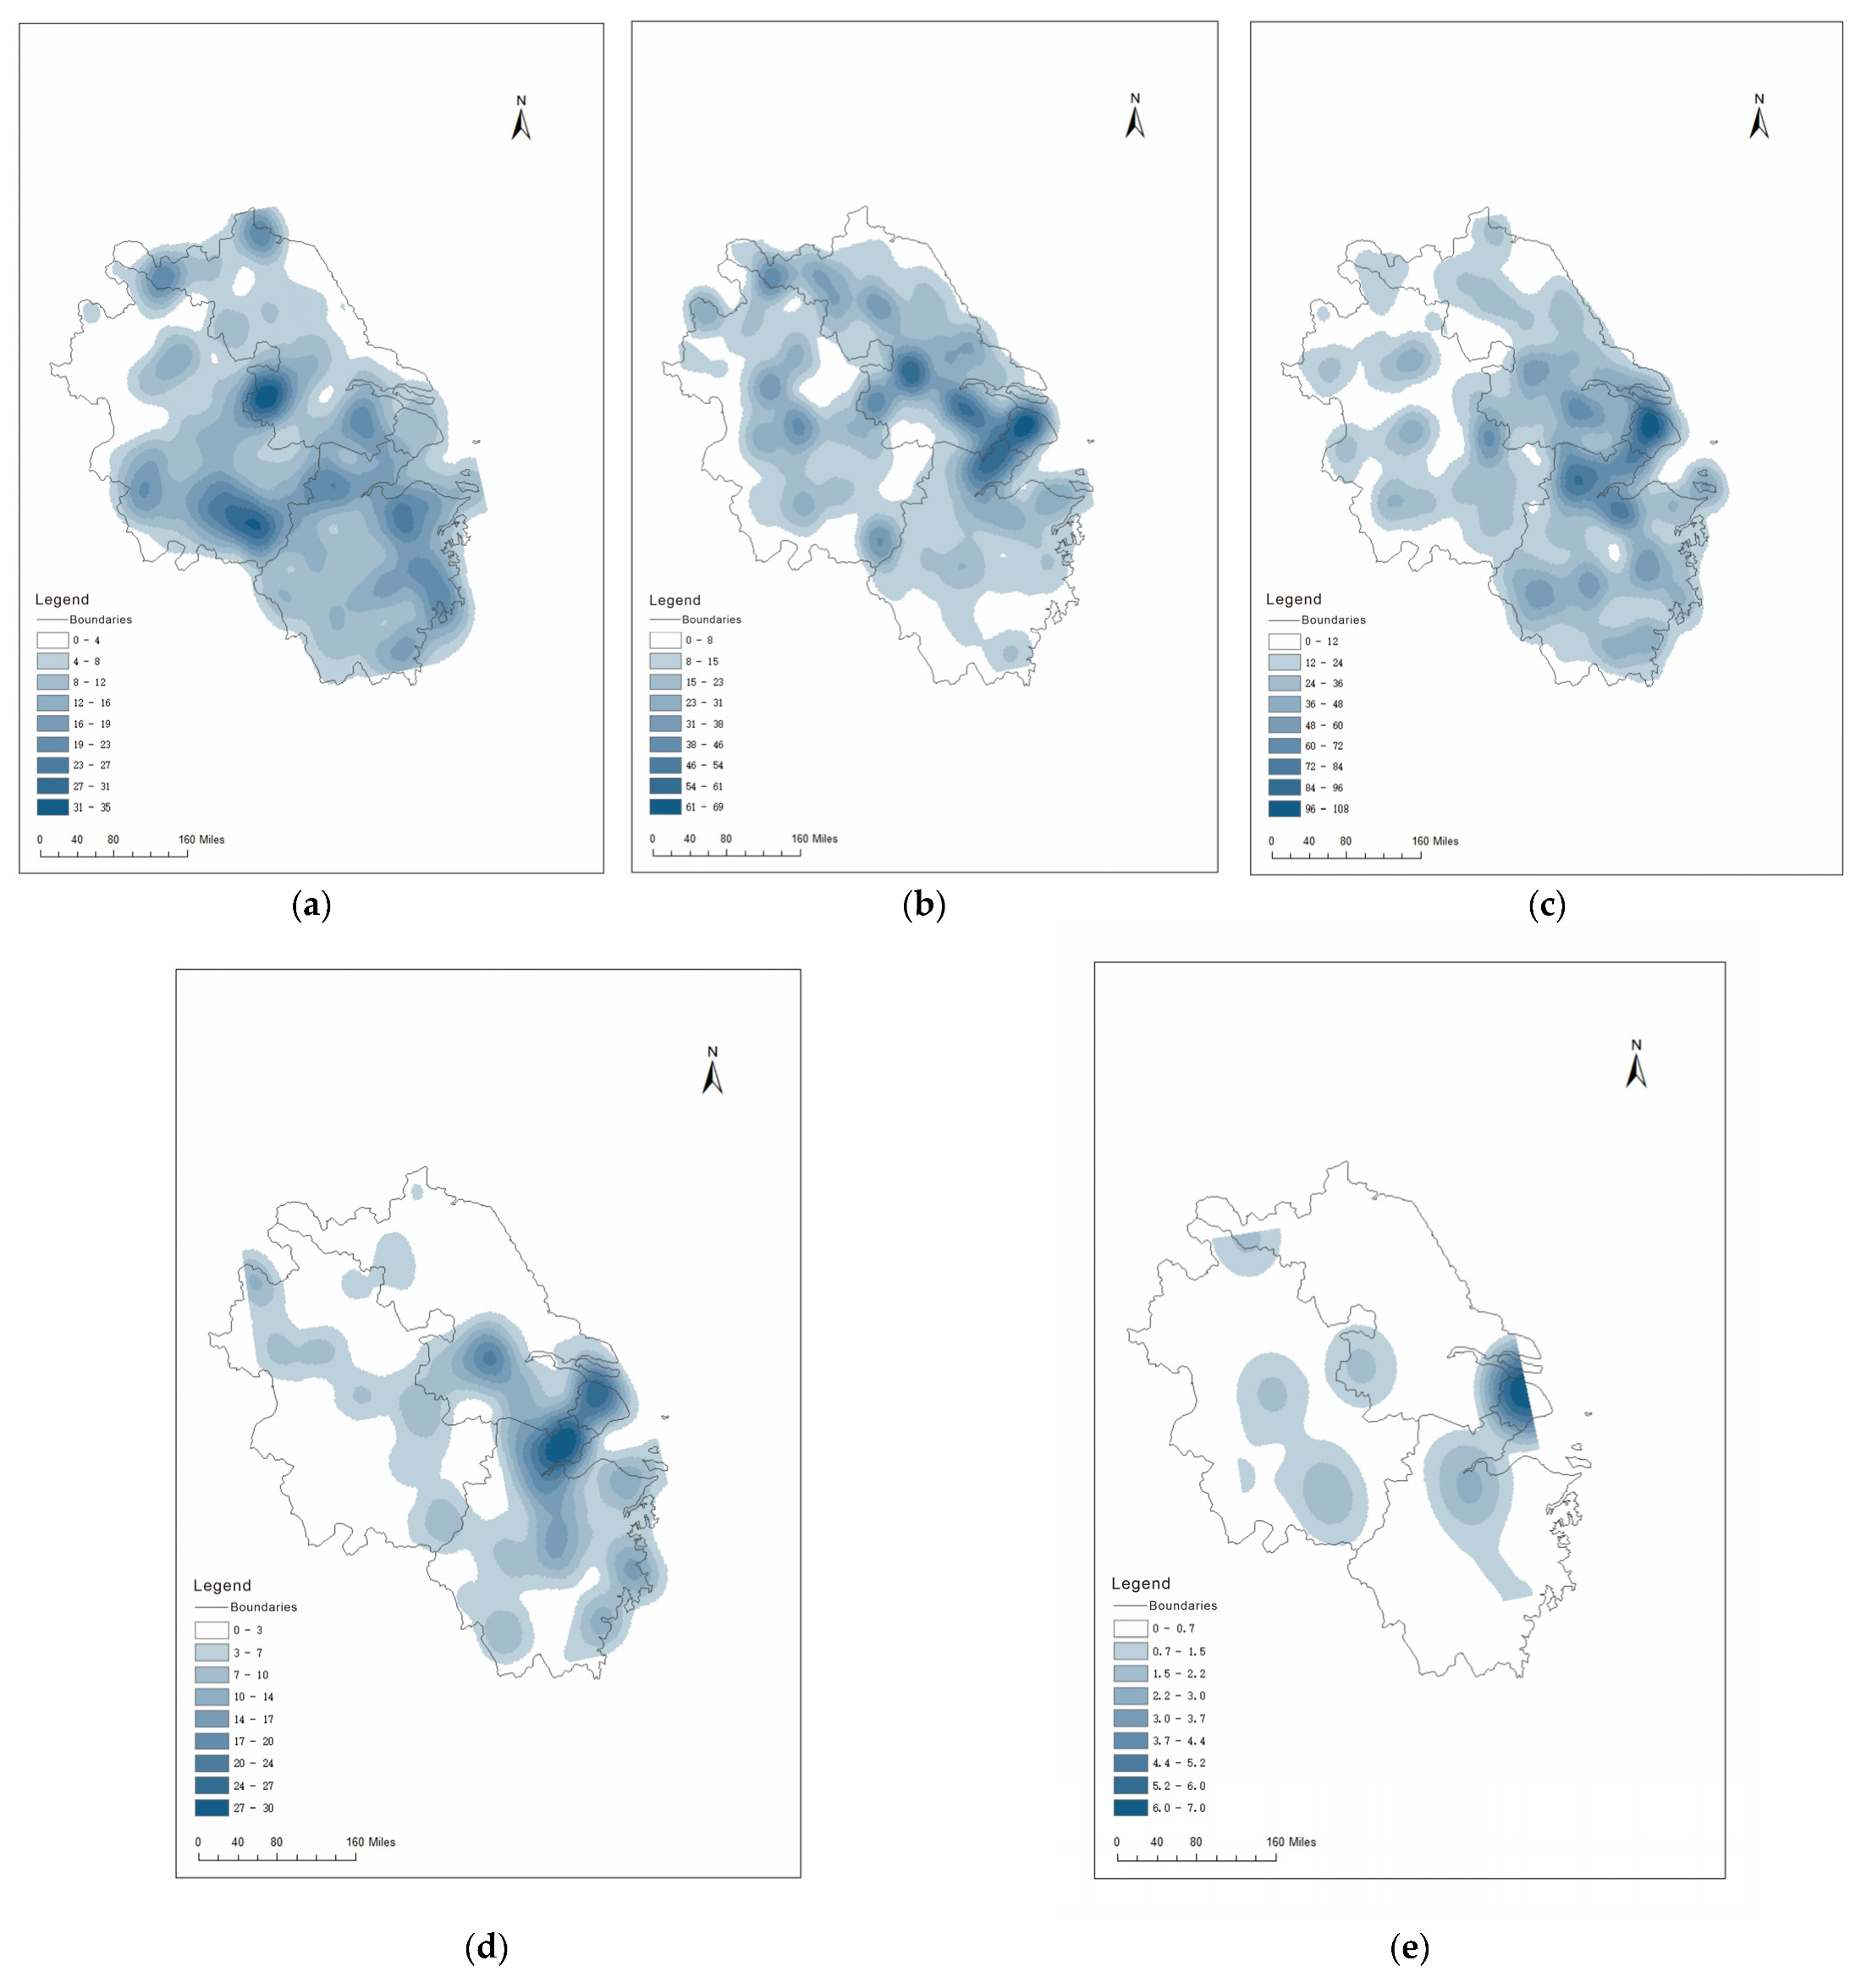
Using kernel density analysis in the spatial analysis toolbar of ArcMap 10.7 software, the POI data of five types of tourist attractions were typed, and the results were visualized and derived to obtain the spatial distribution and characteristics of each type of tourist attraction (Figure 2).
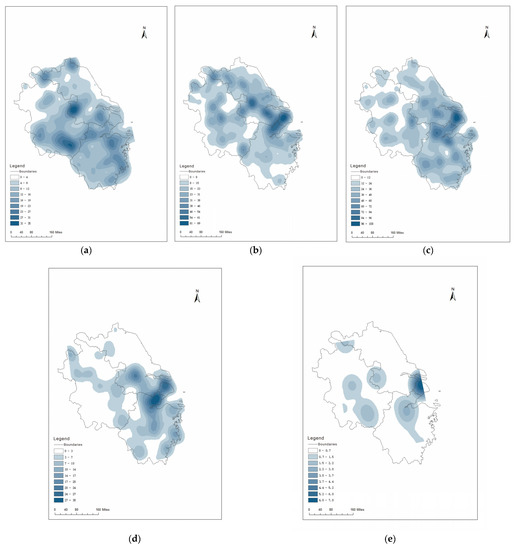
Figure 2.
Kernel density of the five types of tourist attractions (a) Natural ecological tourist attractions; (b) Historical and cultural tourist attractions; (c) Modern recreational tourist attractions; (d) Industrial integration of tourist attractions; and (e) Other kinds of tourist attractions.
Figure 2a shows that the two areas with the highest kernel density of natural ecological tourist attractions are concentrated near Huangshan City and Nanjing City. In the Nanjing area, there are Jiangxinzhou and the riverside scenic belt formed by the Yangtze River, mountain-type tourist landscapes, such as Zhongshan Mountain and Qixia Mountain, and lake-type tourist landscapes such as Xuanwu Lake, while the high-density area with Huangshan city as the core covers many famous mountains, such as Huangshan Mountain, Jiuhua Mountain, Qiyun Mountain, and Tianzhu Mountain. These tourist attractions have become the main tourist attraction for the area. Around the east side of Taihu Lake, there is a relatively high-density area, which is the tourist landscape of the lakes scattered in the lower reaches of the Yangtze River. The density was lower in northern Anhui, central and northern Jiangsu coastal areas, and the area around Shanghai.
It can be seen from Figure 2b that the high kernel density distribution areas of historical and cultural tourist attractions are concentrated in Shanghai, Hangzhou, Nanjing, and their surrounding areas, which together constitute the T-shaped high-density center. This is because Nanjing is the ancient capital of six dynasties in Chinese history, and its historical and cultural tourism resources are rich. Shanghai and Hangzhou have always been places where scholars, businesspeople, and travelers gather, leaving a lot of historical and cultural tourist resources, such as ancient books and residential sites. Anhui is rich in tourism resources along the Yangtze River and Dabie Mountains, and there are many relics and memorials during the War of Resistance against Japanese Aggression. However, due to the topography of Zhejiang-Fujian Hills, there are few historical and cultural tourism resources in southern Zhejiang, and the density of historical and cultural tourist attractions is also low.
According to the kernel density analysis chart of modern recreational tourist attractions, Shanghai is the area with the highest density. There are not only theme amusement and leisure attractions, represented by Disneyland in the suburbs, within the city, Shanghai Wildlife Park, Laowai Street Scenic Spot, and other parks and special streets cater to the recreational needs of both tourists and citizens, stretching all the way to Zhejiang province. In the northeast of Zhejiang, there is a relatively high-density area, namely, the leisure resort area represented by the Moganshan B&B group. However, the density of most of Anhui and northern Jiangsu is very low, which may be due to the relatively undeveloped economies of these regions and the limited funds for the construction of modern recreational tourist attractions.
The industrial integration of tourist attractions in the kernel density analysis diagram shows that the area near Shanghai, Ningbo, and Hangzhou form a high-density area, largely due to its large number of industry categories, giving it a solid industrial foundation, and leading to the integration of industry, agriculture, and tertiary sectors, which have developed industrial tourism, and other tourist attractions.
Other kinds of tourist attractions are mainly single buildings and sculptures, such as Shanghai Tower. The number of such tourist attractions is small and unevenly distributed. However, Shanghai, Hangzhou, Nanjing, Hefei, and Huangshan and their surrounding areas are relatively high-density areas. Because there is no high-density area, it shows that it has not become a growth pole and is not dominant in the competition of various types of tourist attractions in the Yangtze River Delta.
3.4. Standard Deviation Elliptic Analysis
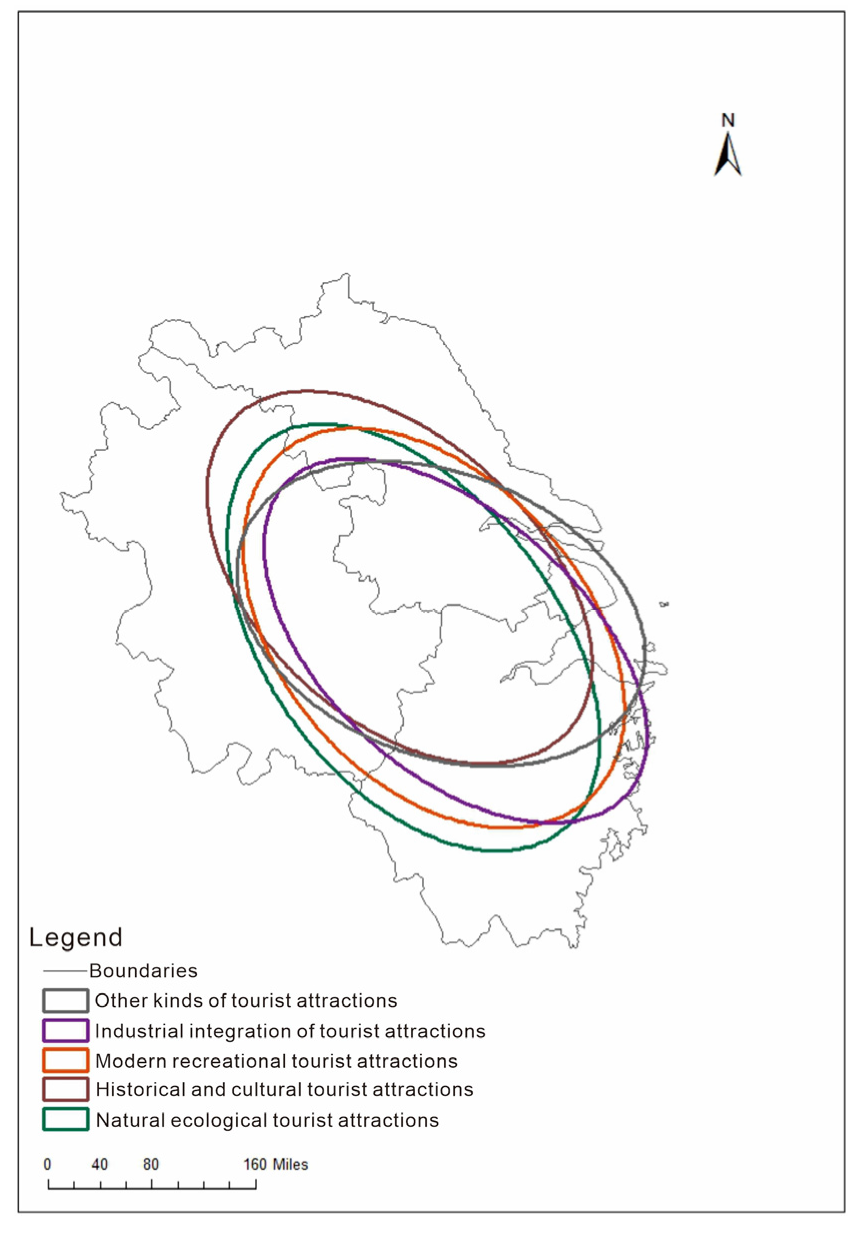
The standard deviation ellipse in the spatial statistics toolbar of ArcMap 10.7 was used to analyze the spatial distribution direction and trend of tourist attractions (Figure 3). According to the shape of the standard deviation ellipse, the distribution direction of the five types of tourist attractions presents a northwest to southeast trend. Comparing the standard deviation ellipse shapes of the five types of tourist attractions, we see that other kinds of tourist attractions have great differences in standard deviation ellipse shapes, while the other types have little differences.
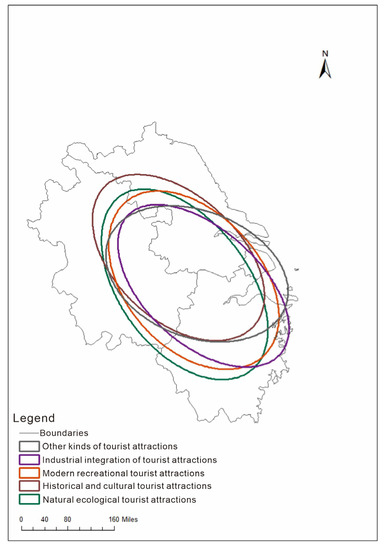
Figure 3.
Standard deviation ellipse of the five types of tourist attractions.
The X-axis of the ellipse represents the spatial distribution direction of tourist attractions, and the shorter the X-axis is, the less obvious the direction is. According to the order from a long to short X axis (Table 4), the length of the long half axis of the standard deviation ellipse of the five types of tourist attractions is as follows: industrial integration tourist attractions, historical and cultural tourist attractions, other kinds of tourist attractions, modern recreational tourist attractions, and natural ecological tourist attractions. It is evident that the direction of the spatial distribution of industrial integration tourist attractions is the most obvious, while the direction of the spatial distribution of natural ecological tourist attractions is the least obvious, and the other three types of tourist attractions fall in between. This may be because the industrial integration of tourist attractions can reflect economic development factors and is largely affected by human factors, making its spatial distribution direction the most obvious. Meanwhile, tourism resources in natural ecological tourist attractions are shaped by natural internal forces and external forces, and are natural expressions of topography and landform, making their distribution direction the least obvious.
Table 4.
Standard deviation ellipse parameters of the five types of tourist attractions.
The length of the short half-axis of the ellipse (Y axis) represents the centrality of the spatial distribution of tourist attractions and the size of the distribution range. According to the length of the Y axis from long to short (Table 4), the length of the standard deviation ellipse short half axis of the five types of tourist attractions is as follows: natural ecological tourist attractions, modern recreation tourist attractions, historical and cultural tourist attractions, other kinds of tourist attractions, and industrial integration tourist attractions. Among them, the centripetal force of natural ecological tourist attractions is the weakest, and its distribution range is the widest. The spatial distribution of industrial integration tourist attractions has a stronger centripetal force and a higher degree of agglomeration.
From the angle of the ellipse (Table 4), the angle of natural ecological tourist attractions, modern recreational tourist attractions, industrial integration tourist attractions, historical and cultural tourist attractions, and other kinds of tourist attractions are between 90 and 180 degrees, showing a northwest to southeast trend, which is consistent with the shape trend of the Yangtze River Delta administrative region. Among them, the deflection angle of natural ecological tourist attractions is the largest, at 145.37°, which is consistent with the terrain trend of Jianghuai Plain, Taihu Plain, and other plains of the lower reaches of the Yangtze River as well as Dabie Mountain, Huangshan Mountain, and other mountains and hills.
3.5. Hot Spot Analysis
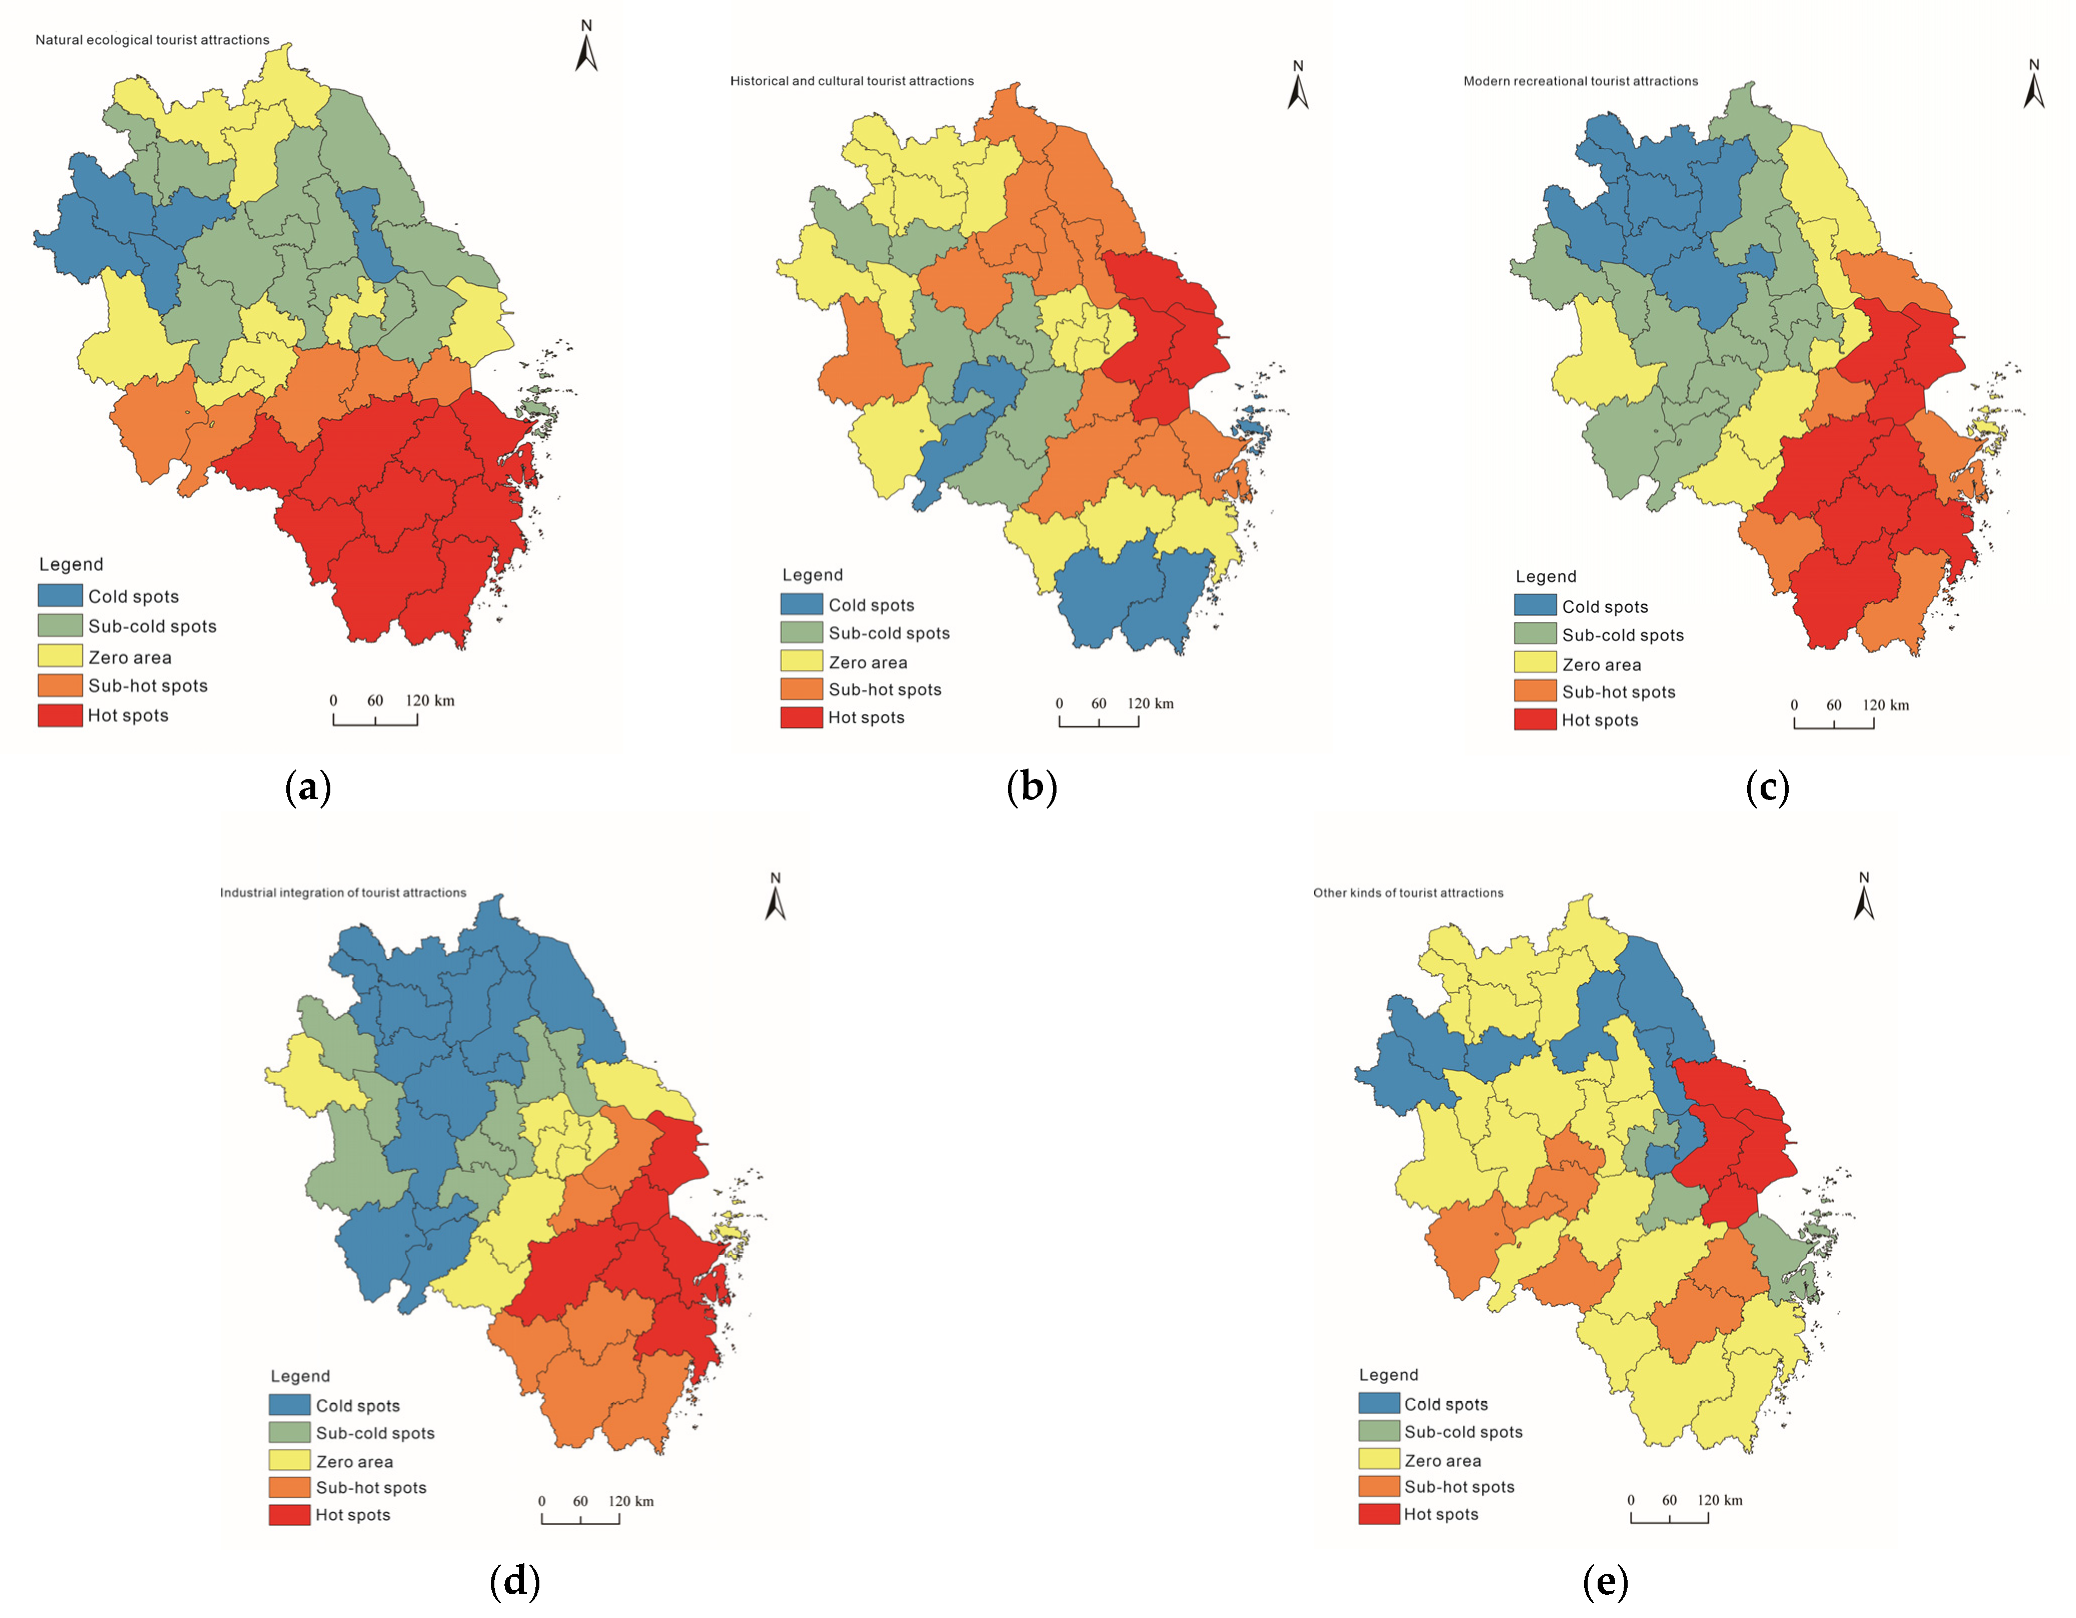
Hot spot analysis in clustering distribution mapping in the spatial statistics toolbar of ArcMap 10.7 software was used to obtain hot spot maps of the five types of tourist attractions (Figure 4). In Figure 4, blue represents the cold spot, green represents the sub-cold spot, yellow represents the zero (also known as the transition zone), orange represents the sub-hot spot, and red represents the hot spot. Due to the influence of physical geographical factors, such as the Zhejiang-Fujian hills and Huangshan Mountain, the cold spots and hot spots of natural ecological tourist attractions show a gradual change from south to north. The hot spots appeared in some cities of Zhejiang province in the south, while the cold spots appeared in Fuyang, Bozhou, Bengbu, and other areas in the north of Anhui. The hot spots of historical and cultural tourist attractions appeared in Shanghai and its surrounding areas, and the northern Jiangsu, Lu’an, Hangzhou, Ningbo, and other regions also had high heat, while the cold spots appeared in Lishui and Wenzhou of Zhejiang province. The cold spots and hot spots of modern recreational tourist attractions show an obvious transition change from southeast to northwest. The hot spots appear in Shanghai and most areas of Zhejiang province, while the cold spots appear in northern Anhui and northern Jiangsu. Similar to the distribution characteristics of modern recreational tourist attractions, the industrial integration tourist attractions show a pattern of centering on Shanghai-Hangzhou-Ningbo and expanding outwards in a circle pattern. Hot spots appear in Shanghai-Hangzhou-Ningbo and other regions, while cold spots appear in the northern part of the Yangtze River. The hot spots of other types of tourist attractions appear in Shanghai and surrounding cities, and the zero-point area occupies most of the region without obvious aggregation phenomenon.

Figure 4.
Distribution of hot spots in the five types of tourist attractions: (a) Natural ecological tourist attractions; (b) Historical and cultural tourist attractions; (c) Modern recreational tourist attractions; (d) Industrial integration of tourist attractions; and (e) Other kinds of tourist attractions.
4. Factors Influencing the Spatial Patterns of Tourist Attractions
The spatial patterns of tourist attractions are comprehensively influenced by different factors [30,31,32,33,34,35,36,37,38,39,40,41,42,43,44,45]. Based on previous studies, this study analyzes the influencing factors of the spatial pattern of tourist attractions from the three dimensions of physical geography, social economy, and traffic. Meanwhile, according to the frequency statistics method, the influencing factors with high frequency in previous studies are selected. Natural geographical factors, such as landforms and river systems, are important landscape elements and endogenous factors that affect the spatial patterns of tourist attractions. Good social and economic conditions are the external guarantee for the stable and healthy development of tourist attractions [46,47,48,49,50,51,52,53,54,55,56,57]. Finally, the connection of the traffic network can effectively connect different types of tourist attractions, form a series of characteristic tourist routes, and promote the reorganization and optimization of the spatial pattern of tourist attractions [20].
4.1. Physical Geographical Factors
4.1.1. Analysis of the Impact of Topography and Landform
Topography is the skeleton of tourist attractions. Undulating topography can increase the sense of spatial hierarchy of tourist landscape and enhance its aesthetic value [46,47,48,49,50,51,52,53,54,55,56,57]. Different types of landforms can not only form tourist landscapes themselves but also form higher tourist landscapes combined with other elements. Therefore, landform restricts the spatial patterns of tourist attractions.
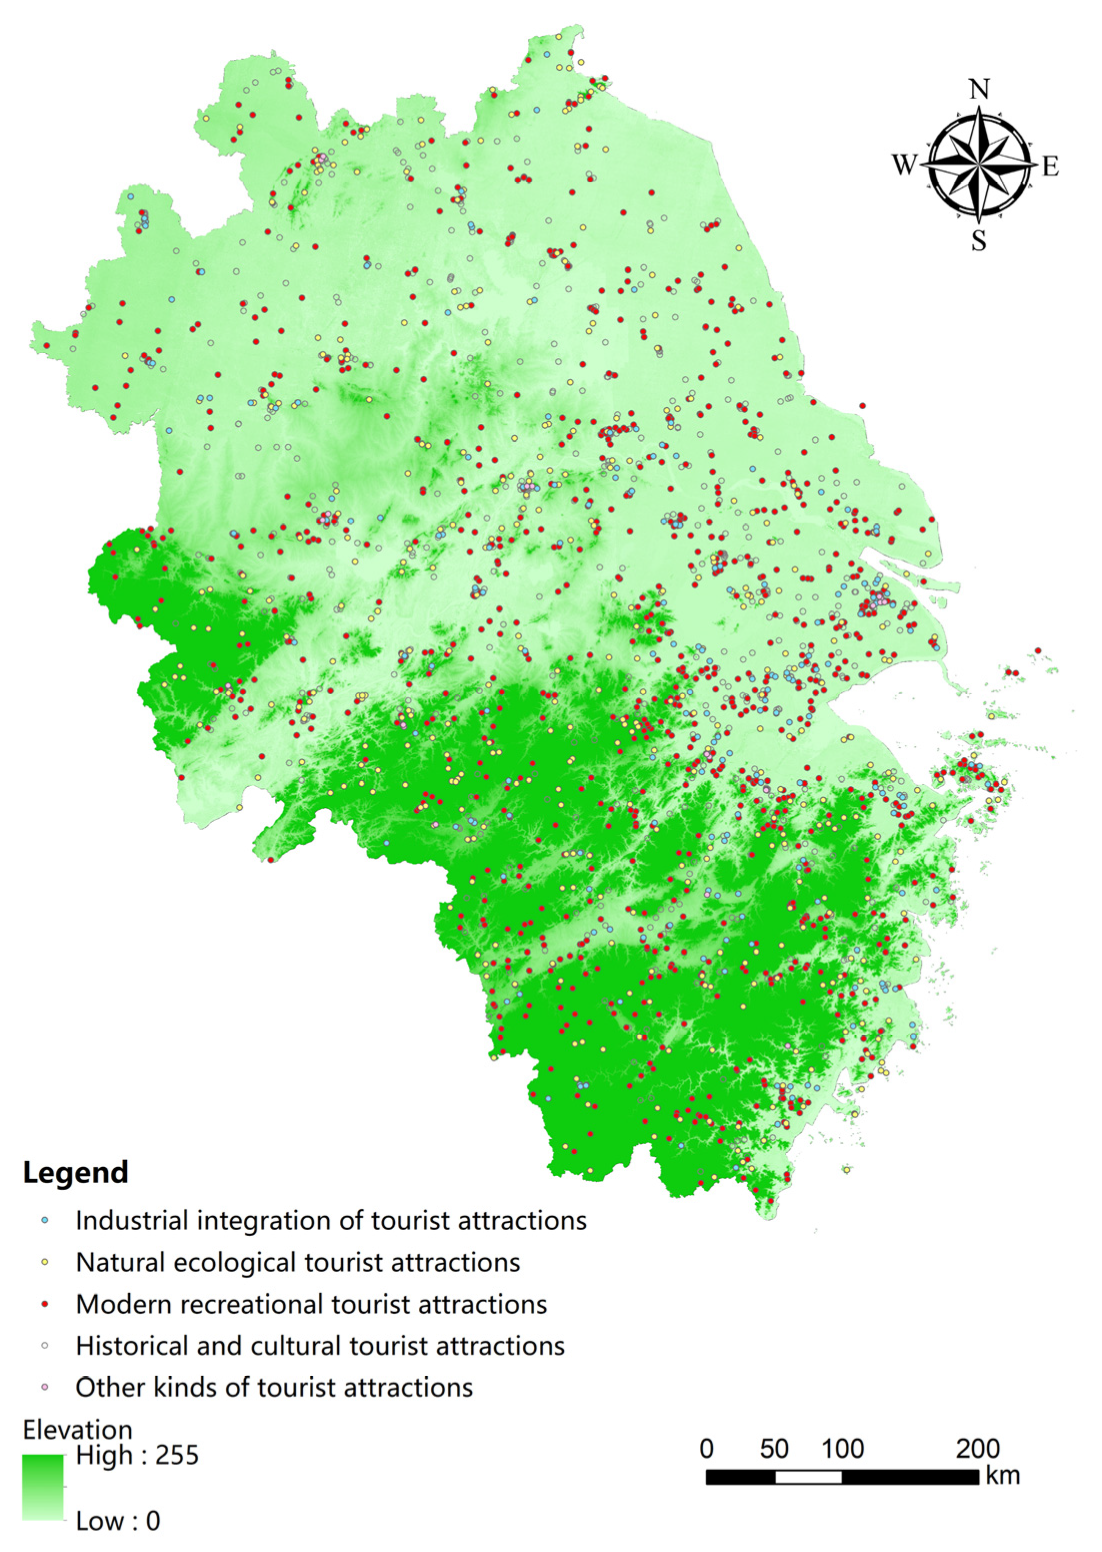
Figure 5 is obtained by superimposing the elevation layer and the spatial patterns layer in tourist attractions. The elevation is represented by grayscale in the legend of Figure 5; the larger the grayscale value, the higher the elevation value. As shown in Figure 5, topographically, the overall regional shape of the Yangtze River Delta is northwest to southeast, which determines the consistency of the distribution direction of various tourist attractions, namely, the northwest to southeast distribution. The Yangtze River Delta is characterized by high terrain in the southwest and low terrain in the central and northern areas. The south and southwest regions are mainly distributed in the southeast hills, including Yandang Mountain, Huangshan Mountain, Dabie Mountain, and other famous mountain tourist attractions. The central part is mainly the Yangtze River and the Yangtze River Delta. To the north of the Yangtze River are the Jianghuai Plain and the Huanghuai Plain, including the middle reaches of the Huaihe River Plain. Topographic conditions determine that the distribution of natural ecological tourist attractions is mostly concentrated in the southern part of the Yangtze River Delta, while the western part is flat. Due to historical reasons, there are many poor areas and tourism development is late, so the agglomeration area of natural ecological tourist attractions has not yet been formed. Since ancient times, the mountainous area has been a battle place for military strategists. Its special topographic conditions determine its important military strategic location, so the southern part of the Yangtze River Delta has become a gathering area of historical and cultural tourist attractions.

Figure 5.
Coupling of topography and the spatial distribution of tourist attractions.
Because of the flat terrain, pleasant climate, and developed water system, the Yangtze River Delta has many kinds of natural ecological tourist attractions, including mountain type natural ecological tourist attractions represented by Jiuhua Mountain, river and lake type natural ecological tourist attractions represented by Taihu Lake and Yangtze River, and island type natural ecological tourist attractions represented by Zhoushan Islands and Chongming Island. In addition, flat terrain is the base of human activities, thus forming human history and culture, leaving a wealth of material and intangible cultural heritage. For example, the Beijing-Hangzhou Grand Canal built in ancient China made Nanjing, Suzhou, Hangzhou, and Xuzhou become important commercial centers and military strongholds, enriching historical and cultural tourism resources in the Yangtze River Delta. In summary, cultural tourist attractions, such as historical tourist attractions, modern recreation tourist attractions, and industrial integration tourist attractions, are more distributed in the plain areas or areas with lower elevations, while natural tourist attractions of famous mountains are more distributed in areas with higher elevations. Areas with flat terrain and low altitude are suitable for production and living activities and are rich in tourism resources. Therefore, altitude determines the type and distribution of tourist attractions to a certain extent.
4.1.2. Influence Analysis of the River System
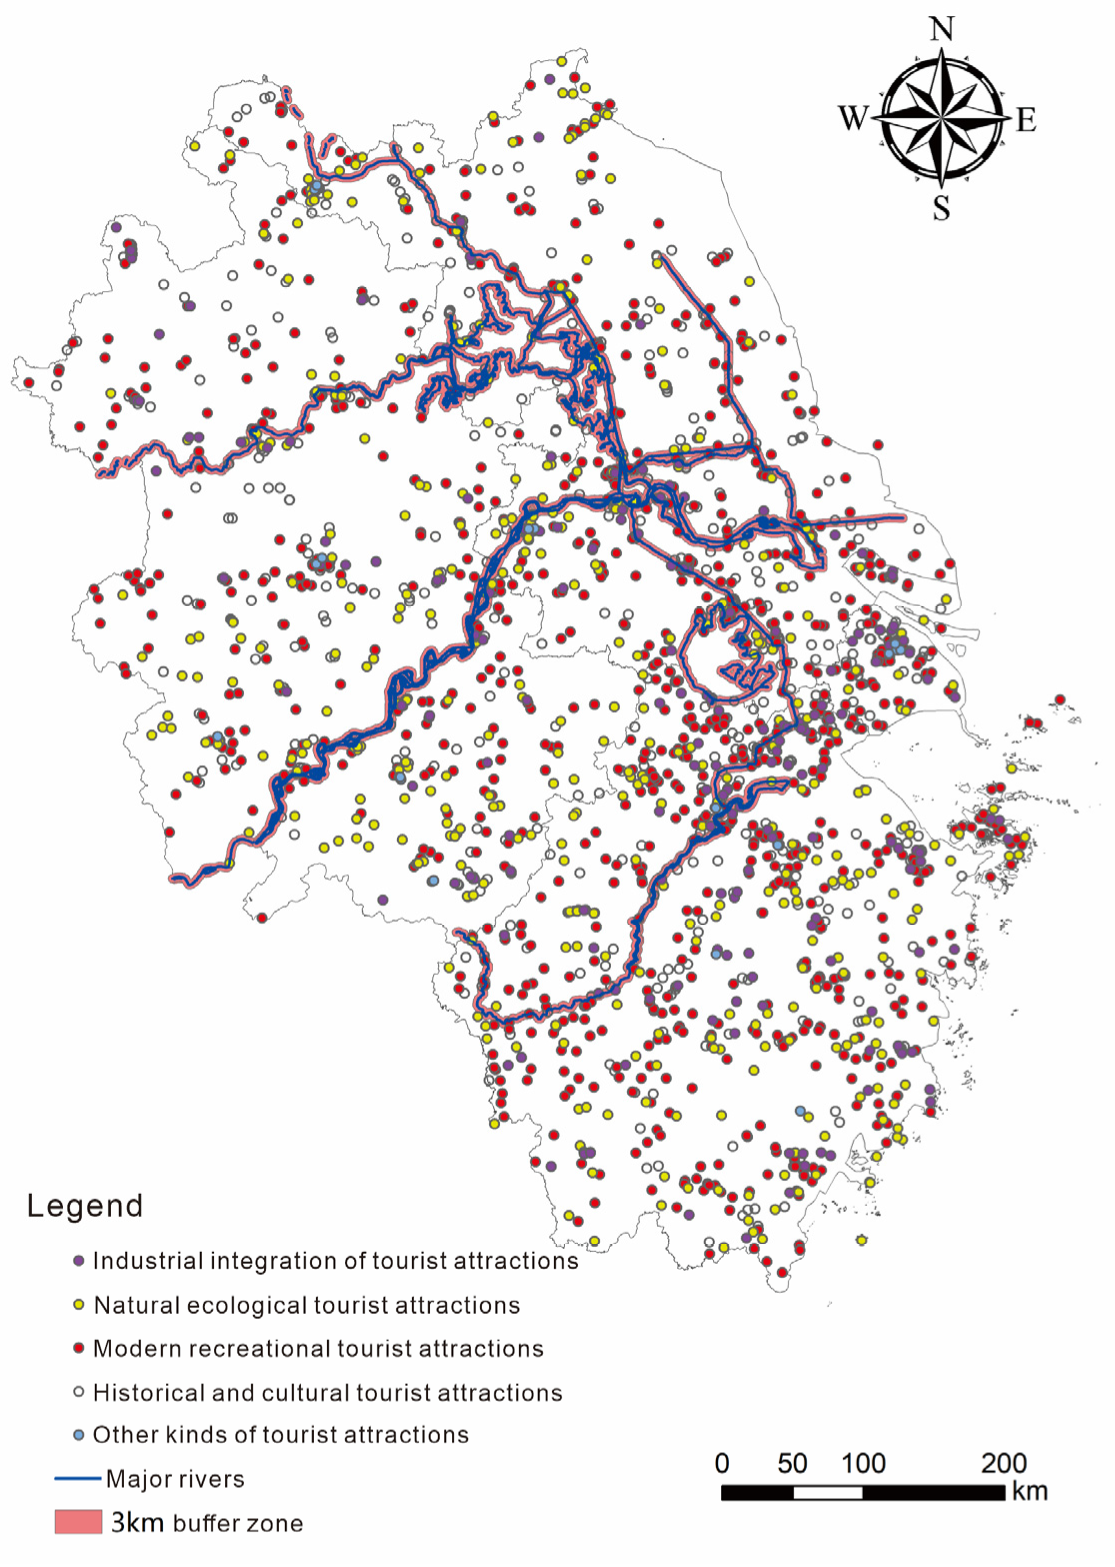
The Yangtze River Delta area has a developed water system and numerous rivers. Coastal areas are the main places of human activities and the birthplace of civilization, which affect the formation of cultural tourism resources. The river system itself is at the same time a natural tourism resource and is important for the construction of landscape elements, with waterfalls, fall deep pools, great tides, flowing water, spring discharge pools, and mountain streams giving the landscape visual esthetics and beauty [58,59,60,61]. The Yangtze River Delta area river network density is high, vertical, and horizontal. From the perspective of water system characteristics, most areas of the Yangtze River Delta belong to the Yangtze River basin, and the water system has a close coupling relationship with the water landscape tourist attractions; that is, the tourist attractions formed by relying on the water landscape tourism resources form a banded distribution along the river valley. In this study, using the Arcmap software buffer analysis tool, the river system was analyzed with a 3-km buffer zone from the main water system (Figure 6). We found that 292 tourist attractions fall within the 3-km buffer zone, accounting for 13.5% of the total number of tourist attractions. This shows that the river system is an important factor affecting the spatial distribution of tourist attractions.
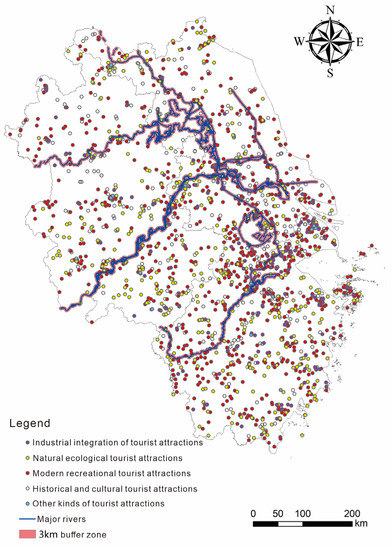
Figure 6.
Coupling of the river system and the spatial distribution of tourist attractions.
4.2. Traffic Factors
Location and transportation factors determine the accessibility of tourist attractions [43]. Large numbers of tourists entering tourist attractions will necessitate transmission facilities to improve and upgrade tourist services and promote the quality of tourist attractions; at the same time, traffic lines linking with feeders can provide a “corridor effect” to promote the surrounding traffic service level of ascension, dilute the boundary of the block effect of regional tourism development, speed up the process of spatial agglomeration tourist attractions, and promote tourist attractions by the isolated dotted steering axis or mesh layout.
Transportation in the Yangtze River Delta is developed. In 2020, the total number of passengers transported in 41 cities of the Yangtze River Delta was 190.286 million, among which, the number of railway passengers accounted for 69%, highway passengers 26%, and ports and airports 4%, all ranking among the top in China. In particular, 41 cities in the Yangtze River Delta, except Zhoushan, have opened high-speed railway lines, and there are a total of 174 high-speed railway stations. Shanghai, Jiangsu, Zhejiang, and Anhui provinces and one city have a total length of 5984.8 km. Among them, Shanghai has 172.3 km of high-speed railway, Jiangsu 2021 km, Zhejiang 1510.1 km, and Anhui 2281.4 km.
Efficient modern transportation has shortened the time distance between cities, allowing local markets to spill over. For example, the 1-h traffic line between Shanghai, Nanjing, and Hangzhou has given rise to a series of four tourist attractions, especially promoting the obvious gathering trend of modern recreational tourist attractions that rely more on traffic and markets.
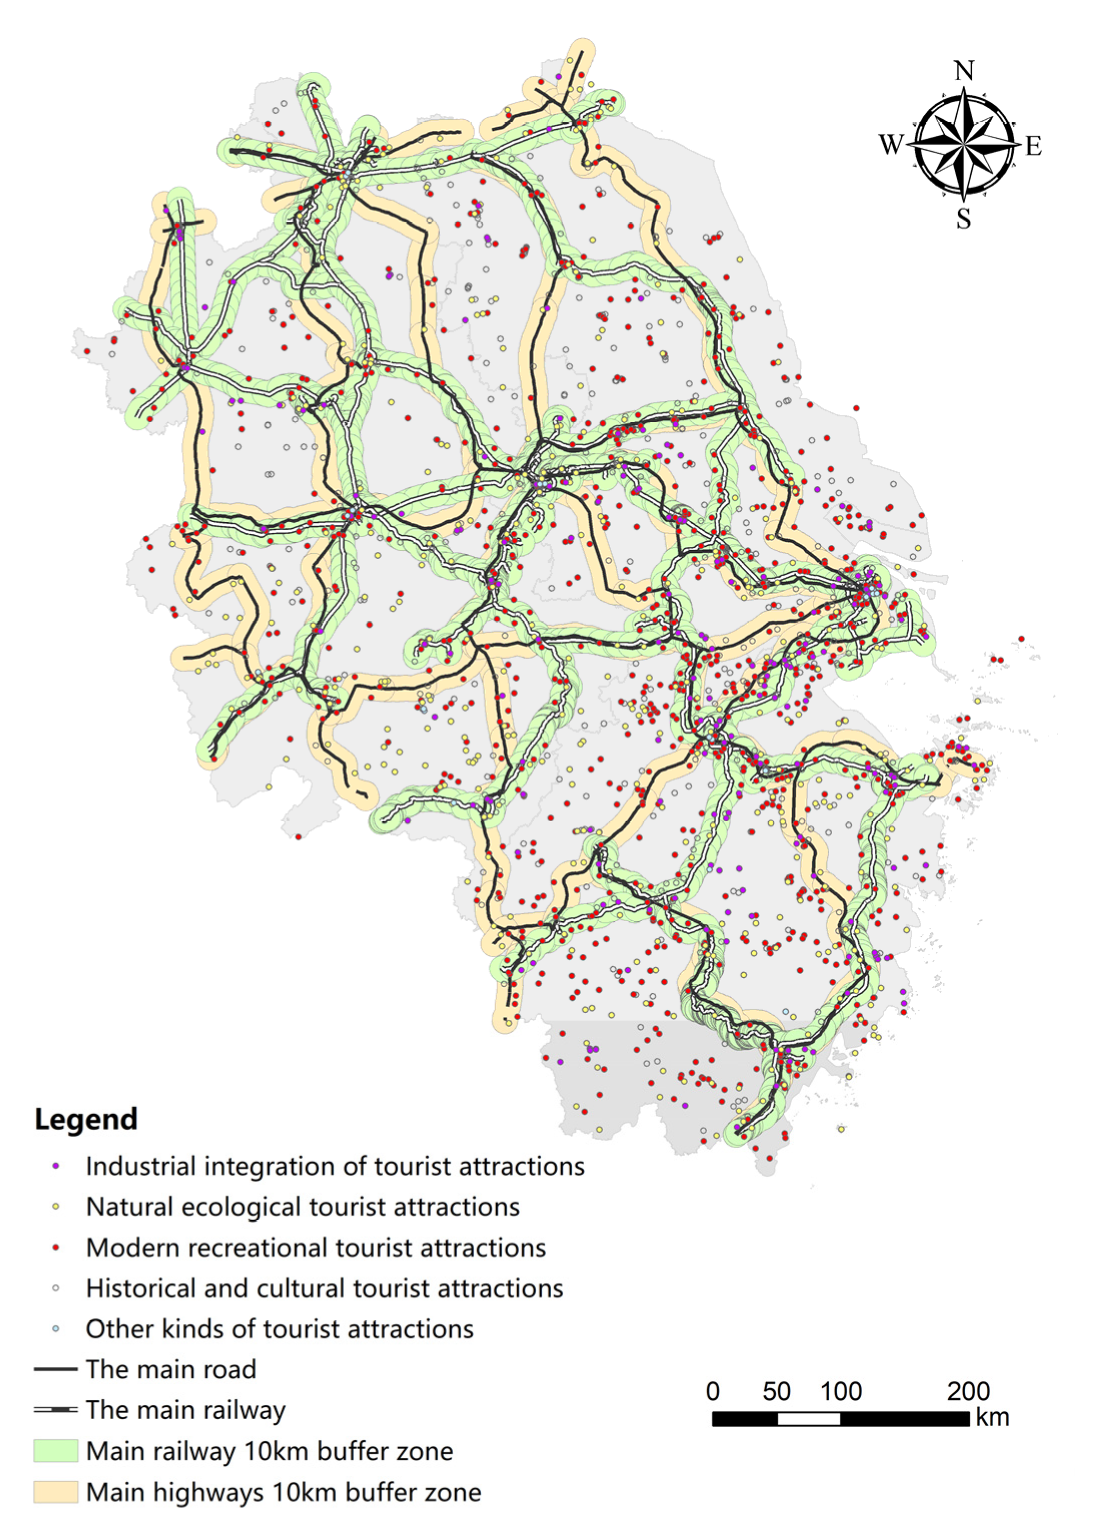
In this study, Arcmap 10.7 software, a GIS software developed by the Environmental Systems Research Institute (ESRI) in Redlands, California, USA, was used to construct a 10-km buffer zone of main traffic arteries (mainly including railways and main highways) (Figure 7). It was further concluded that a total of 1375 tourist attractions were distributed within the 10-km buffer zone of main traffic lines, accounting for 63.83% of the total number of tourist attractions. Among them, there are 1051 tourist attractions along the main highway routes, accounting for 48.79% of the total number of tourist attractions. The number of tourist attractions along the railway line is 1072, accounting for 49.77% of the total number of tourist attractions.
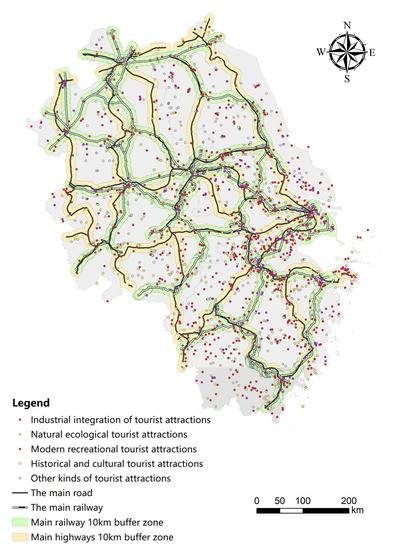
Figure 7.
Coupling of the main traffic lines and the spatial distribution of tourist attractions.
Generally, the density of tourist attractions is consistent with the density of the traffic network, showing characteristics of being higher in the east than in the west, and higher in the south than in the north. Traffic factors affect the accessibility of tourist attractions and change tourists’ mode of travel. At present, southern Jiangsu, Shanghai, and northern Zhejiang have entered the development stage of city integration, which has obvious transportation advantages compared with northern Jiangsu and northern Anhui.
4.3. Social and Economic Factors
Social and economic factors promote the development of tourist attractions. Similarly, the improvement of the social and economic level also provides an economic basis for the development of tourism. With the improvement of residents’ income levels, their tourism demand is gradually increasing. According to the per capita GDP of cities and the distribution of tourist attractions in 2020, Shanghai has 130, and its per capita GDP is 155,800 yuan, both of which are far ahead of other cities. Both measures are also high in Suzhou, Hangzhou, Nanjing, and Ningbo but low in Yicheng, Huaibei, and Tongling. There is a strong correlation between the level of social and economic development and the number of tourist attractions (Figure 8). Social and economic factors can affect the development of tourist attractions in different regions. In 2020, the tourism industry was seriously affected by the COVID-19 epidemic, but the free admission policy of A-level tourist attractions in the Yangtze River Delta played an important role in stimulating the rapid recovery of the tourism industry and stimulating tourist consumption. The rise and prosperity of the tourism industry fundamentally stimulates the development of tourist attractions. The formation and development of the five tourist attractions are directly affected by the economic level.
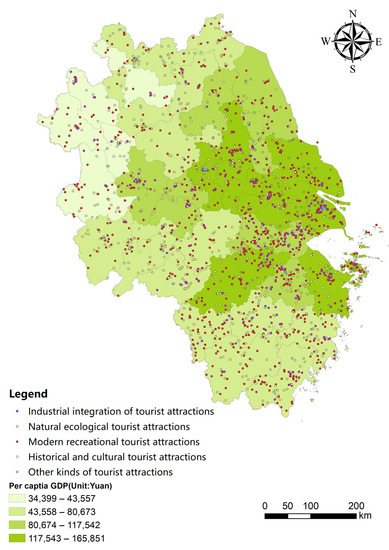
Figure 8.
The coupling between social economy and the distribution of tourist attractions.
5. Discussion
Although it is very important to study the types of tourist attractions and the degree of spatial agglomeration of tourist attractions, there is limited research on the spatial patterns and influencing factors of overall tourist attractions in specific regions and their components. To address the research gap and further study the spatial structure of the distribution of different types of tourist attractions, this study not only classifies the tourist attractions in the Yangtze River Delta but also explores their spatial structure characteristics and influencing factors.
Tourist attractions are widely distributed in terms of spatial density and spatial distribution characteristics. This may be due to the rich tourism resources and developed regional economy, which ultimately has created a large number of tourist attractions and a high degree of development. This finding validates the view of Wang et al. [28]. In addition, both the overall spatial distribution of tourist attractions and the spatial distribution of their various types show a significant agglomeration and trend from northwest to southeast. Among them, the natural ecological tourist attractions in Huangshan city and Nanjing city are the core. The historical and cultural tourist attractions are centered in Shanghai, Hangzhou, and Nanjing. Shanghai is the core of modern recreational tourist attractions, and the core of industrial integration tourist attractions are in Shanghai, Nanjing, and Hangzhou. Other types of tourist attractions are mainly concentrated in Shanghai, Hangzhou, Nanjing, Hefei, and Huangshan. It is easy to observe that the core clustering places of tourist attractions are distributed in municipalities directly under the central government (Shanghai), provincial capital cities (Hangzhou, Nanjing, and Hefei), or tourist cities (Huangshan and Ningbo), and the number of tourist attractions decreases from these cities (as the core) to surrounding areas. The basic reasons for this discovery may be that the regional central city or city is a famous tourist resort, with strong regional economic development and good infrastructure, making it a destination of choice for tourists; however, the limited bearing capacity of a single tourist attraction may deter tourists and be the driver for more tourist attractions to develop more fully. Thus, the viewpoints of Gunn et al. are supported and conform to the law of distance attenuation [62,63].
The spatial patterns of tourist attractions are mainly affected by three factors: physical geography, social economy, and traffic. The first choice for site selection of tourist attractions in the Yangtze River Delta is along rivers, traffic routes, or areas with concentrated tourism resources and a developed economy. This also validates the findings of Truchet et al. [55].
This study contributes the following to the broad literature. Previous studies mainly focused on the classification, evaluation, and spatial distribution of tourism resources, ignoring the central role of tourist attractions. Therefore, the empirical analysis of the spatial patterns of different types of tourist attractions in this study can supplement relevant research on tourist destinations to a certain extent. In addition, this study reveals that physical geography, transportation accessibility, and social and economic conditions have a significant impact on the development and layout of tourist attractions.
This study also provides a basis for identifying advantageous tourism resources and determining the growth poles of tourist attractions. It provides a reference for the rational development of tourism resources, the orientation of tourism development, and corresponding tourism marketing strategies. In addition, the overall comprehensive analysis and classification of the spatial distribution characteristics of tourist attractions in the Yangtze River Delta are conducive to overcoming the defects of traditional official data, clarifying the types of tourism resources in surrounding cities, mining the characteristic resources of surrounding cities, and providing a reference for tourism positioning, adapting measures to local conditions, and developing characteristics and personalized tourism modes to promote the sustainable development of tourism in the Yangtze River Delta region.
6. Conclusions
In this study, 2166 tourist attractions in the Yangtze River Delta region were selected as the research object. Using ArcMap 10.7 software, a GIS software developed by the Environmental Systems Research Institute (ESRI) in Redlands, CA, USA, the spatial patterns of tourist attractions were analyzed using the methods of nearest proximity index, kernel density analysis, standard deviation ellipse, and hot spot analysis. Spatial superposition analysis was used to clarify the relationship between the spatial patterns of tourist attractions and physical geography, transportation, and social and economic factors.
The main conclusions of this study are as follows.
First, among the 2166 tourist attractions, the number and proportion of the category of modern recreational tourist attractions are the highest. Natural ecological tourist attractions and historical and cultural tourist attractions also have a large proportion. The proportion of industrial integration tourist attractions and other kinds of tourist attractions is relatively small. In general, the spatial patterns of these tourist attractions are more in the north than the south, and more in the east than the west. The spatial density of tourist attractions in Shanghai is much higher than that of other regions, followed by Jiangsu and Zhejiang, while Anhui has the lowest spatial density. Such a conclusion is consistent with the research conclusions of Xu et al. [64] and Han et al. [65]. Xu et al. and Han et al. also pointed out in their studies that the density of high-grade tourist attractions in the eastern part of the Yangtze River Delta was higher than that in the western part, which was consistent with the conclusion of this study. Furthermore, they showed that the density of high-grade tourist attractions in the Yangtze River Delta was higher in the south than in the north. This is because there are more low-grade tourist attractions in the northern part of the Yangtze River Delta than in the southern part. If all tourist attractions are regarded as research objects, there will be a spatial pattern with more tourist attractions in the north and fewer in the south.
Second, the five types of tourist attractions show significant spatial aggregation, including natural ecological tourist attractions in Nanjing, Huangshan area; the historical and cultural tourist attractions cluster in the vicinity of Shanghai, Hangzhou, and Nanjing, forming a T-shaped cluster state; and modern recreational tourist attractions cluster in Shanghai and Hangzhou. Industrial integration tourist attractions are clustered in Shanghai, Nanjing, and Hangzhou and other kinds of tourist attractions are prominent in Shanghai; there is no obvious agglomeration in the region. Due to the different classifications of tourist attractions, the conclusions cannot be compared with those of other scholars. However, from only the agglomeration area of tourist attractions, many scholars also believe that Shanghai, Nanjing, Hangzhou, Ningbo, and Huangshan are the cities with the most agglomeration of tourist attractions [11,64,65].
Third, the spatial distribution direction of modern recreational tourist attractions and industrial integration of tourist attractions is obvious. The centripetal force of the spatial distribution of industrial integration of tourist attractions and historical and cultural tourist attractions is stronger. The deviation angles of the standard deviation ellipses of the five types of tourist attractions are all between 90 and 180 degrees, showing a northwest-southeast trend. This is consistent with the shape trend of the Yangtze River Delta administrative region.
Fourth, there are different degrees of cold spots and hot spots in the spatial patterns of the five types of tourist attractions. Except for natural ecological tourist attractions in Nanjing and Huangshan, the other four types of tourist attractions are located in Shanghai and its adjacent areas. This conclusion validates the study of Xu et al. who, based on the panel data of 3A or above tourist attractions in the Yangtze River Delta from 2001 to 2015, comprehensively applied mathematical statistics and GIS spatial analysis methods, and concluded that Shanghai has always been the polar core center of the Yangtze River Delta region [64].
Fifth, physical geography, transportation, and social and economic factors affect the spatial patterns of tourist attractions. This is partly consistent with the research conclusion of Kang et al. [16] and Wu et al. [17]. They believe that the spatial pattern of tourist attractions is affected by four factors: resource endowment, transportation network, natural environment, and economic level. The conclusion is compared with the lack of resource endowment factor. However, this study classifies tourist attractions based on tourism resources, so resource endowment will naturally have an impact on the spatial pattern of tourist attractions. In short, this study comprehensively analyzed the spatial distribution characteristics and differences of different types of tourist attractions in the Yangtze River Delta region. The advantages of this approach are that it can overcome the defects of traditional official data and clarify the types of tourism resources in various cities, so as to provide a reference for each city to excavate characteristic resources, find accurate tourism positioning, and develop characteristic and personalized tourism models according to local conditions so as to promote the sustainable development of tourism in the Yangtze River Delta region. The conclusions obtained in this study effectively make up for the lack of research by Yang et al. [66] and Yao et al. [67].
However, this study has the following limitations. It did not assign weight to the level of tourist attractions in the data calculation and analysis. In addition, the analysis of the influencing factors of the spatial patterns of tourist attractions lacked combined qualitative and quantitative methods, resulting in a lack of in-depth analysis of the influencing factors. In future research, the comprehensive use of mathematical statistics could be used for further exploration of the data.
Author Contributions
Conceptualization, Y.W. and H.C.; methodology, Z.L.; software, Z.L. and Y.Z.; validation, X.W.; formal analysis, Y.W. and H.C.; resources, Y.W. and H.C.; data curation, Z.L.; writing—original draft preparation, Y.W. and H.C.; writing—review and editing, Y.W. and H.C.; visualization, Z.L. and Y.Z.; supervision, Y.W. and H.C.; funding acquisition, Y.W. and H.C. All authors have read and agreed to the published version of the manuscript.
Funding
This research study was supported by the National Social Science Foundation of China (To Yuewei Wang) (Grant No. 19BGL145).
Institutional Review Board Statement
Not applicable.
Informed Consent Statement
Not applicable.
Data Availability Statement
Not applicable.
Acknowledgments
The authors would like to acknowledge all experts’ contributions in the building of the model and the formulation of the strategies in this study. All individuals included in this section have consented to the acknowledgment.
Conflicts of Interest
The authors declare no conflict of interest.
References
- Lew, A.A. A Framework of Tourist Attraction Research. Ann. Tour. Res. 1987, 14, 553–575. [Google Scholar] [CrossRef]
- Leiper, N. Tourist attraction systems. Ann. Tour. Res. 1990, 17, 367–384. [Google Scholar] [CrossRef]
- Pearce, P.; Benckendorff, P.; Johnstone, S. Tourist attractions: Evolution, analysis and prospects. In Tourism in the Twenty-First Century: Reflections on Experience; Continuum: New York, NY, USA, 2001. [Google Scholar]
- Leask, A. Visitor attraction management: A critical review of research 2009–2014. Tour. Manag. 2016, 57, 334–361. [Google Scholar] [CrossRef]
- Pearce, P.L. Analysing tourist attractions. J. Tour. Stud. 1991, 2, 46–55. [Google Scholar]
- Pan, J.; Li, J. Spatial Distribution Characteristics and Accessibility of A-Class scenic spots in China. J. Nat. Resour. 2014, 29, 55–66. [Google Scholar]
- Azazz, A.; Elshaer, I.A.; Ghanem, M. Developing a measurement scale of opposition in tourism public-private partnerships projects. Sustainability 2021, 13, 5053. [Google Scholar] [CrossRef]
- Song, Y.; Lee, K.; Anderson, W.P.; Lakshmanan, T. Industrial agglomeration and transport accessibility in metropolitan Seoul. J. Geogr. Syst. 2012, 14, 299–318. [Google Scholar] [CrossRef]
- Masson, S.; Petiot, R. Can the high speed rail reinforce tourism attractiveness? The case of the high speed rail between Perpignan (France) and Barcelona (Spain). Technovation 2009, 29, 611–617. [Google Scholar] [CrossRef]
- Lin, X.; Chen, Q. A Study on Spatial Distribution Characteristics and Influencing Factors of Tourist Towns in Fujian. Geogr. Sci. 2021, 41, 1645–1653. [Google Scholar]
- Wang, Y.; Chen, H.; Wu, X. Spatial Structure Characteristics of Tourist Attraction Cooperation Networks in the Yangtze River Delta Based on Tourism Flow. Sustainability 2021, 13, 12036. [Google Scholar] [CrossRef]
- Ma, X.; Yang, X. Spatial and Temporal Distribution Characteristics and Spatial Heterogeneity of Influential Factors in the High-level Scenic Spots of GreatWestern Hunan. J. Nat. Resour. 2019, 34, 1902–1916. [Google Scholar]
- Kropinova, E. Transnational and cross-border cooperation for sustainable tourism development in the Baltic Sea Region. Sustainability 2021, 13, 2111. [Google Scholar] [CrossRef]
- Hu, W.; Liang, X.; Sang, Z. Analysis on the characteristics and causes of the spatial-temporal evolution of 3A and above tourist attractions in Shanxi province. J. Arid Land Resour. Environ. 2020, 34, 187–194. [Google Scholar]
- Tao, S. The Developing Predicament and Optimizing Path of the Growing Summer-Avoiding scenic spots in the Ethnic Areas: Based on the Empirical Study of Maoba Scenic Spot in Youyang Tujia and Miao Autonomous County of Chongqing. J. Southwest Univ. Natl. 2019, 40, 40–46. [Google Scholar]
- Kang, S.; Lee, G.; Kim, J.; Park, D. Identifying the spatial structure of the tourist attraction system in South Korea using GIS and network analysis: An application of anchor-point theory. J. Destin. Mark. Manag. 2018, 9, 358–370. [Google Scholar] [CrossRef]
- Wu, X.; Chen, C. Spatial Distribution and Accessibility of High Level Scenic Spots in Inner Mongolia. Sustainability 2022, 14, 7329. [Google Scholar] [CrossRef]
- Guo, Y.; Liu, M. Classification and Spatial Distribution of scenic spots in Shanxi Province Based on POI Data. Geogr. Sci. 2021, 41, 1246–1255. [Google Scholar]
- Matthews, Y.; Scarpa, R.; Marsh, D. Cumulative attraction and spatial dependence in a destination choice model for beach recreation. Tour. Manag. 2018, 66, 318–328. [Google Scholar] [CrossRef]
- Pearce, D.G.; Tan, R. The distribution mix for tourism attractions in Rotorua, New Zealand. Hosp. Manag. 2003, 22, 17–35. [Google Scholar] [CrossRef]
- Wang, S.; He, Y.; Wang, X.; Zhu, G.; Cao, W. Regional disparity and convergence of China’s inbound tourism economy. Chin. Geogr. Sci. 2011, 21, 715–722. [Google Scholar] [CrossRef]
- Li, L.; Tao, W. Spatial structure evolution of system of recreation business district-A case of Suzhou City. Chin. Geogr. Sci. 2003, 13, 370–377. [Google Scholar] [CrossRef]
- Jamaludin, M.; Kadir, S.A. Accessibility in Buildings of Tourist Attraction: A Case Studies Comparison. Procedia-Soc. Behav. Sci. 2012, 35, 97–104. [Google Scholar] [CrossRef]
- Paül, I.A.D. Territorial distribution of tourist attractions. Comparing projected and perceived image in Uruguay. Econ. Soc. Y Territ. 2018, 18, 735–762. [Google Scholar]
- Dóniz-Páez, F.J.; Becerra-Ramírez, R.; Carballo-Hernández, M. Proposal for an urban geotourism route in Garachico (Tenerife, Canary Islands, Spain). Investig. Geogr. 2016, 66, 95–115. [Google Scholar]
- Andreas, P. Exploring the evolution of tourism resorts. Ann. Tour. Res. 2004, 31, 219–237. [Google Scholar]
- Yang, R.; Xu, Q.; Long, H.L. Spatial distribution characteristics and optimized reconstruction analysis of China’s rural settlements during the process of rapid urbanization. J. Rural Stud. 2016, 47, 413–424. [Google Scholar] [CrossRef]
- Wang, X.G.; Xi, J.C.; Yang, D.Y.; Chen, T. Spatial differentiation of rural touristization and its determinants in China: A geodetector-based case study of Yesanpo scenic area. J. Resour. Ecol. 2016, 7, 464–472. [Google Scholar]
- Zhu, H.; Liu, J.; Chen, C.; Lin, J.; Tao, H. A spatial-temporal analysis of urban recreational business districts: A case study in Beijing, China. J. Geogr. Sci. 2015, 25, 1521–1536. [Google Scholar] [CrossRef]
- Wang, J.F.; Li, X.H.; Christakos, G.; Liao, Y.L.; Zhang, T.; Gu, X.; Zheng, X.Y. Geographical detectors based health risk assessment and its application in the neural tube defects study of the Heshun Region, China. Int. J. Geogr. Inf. Sci. 2010, 24, 107–127. [Google Scholar] [CrossRef]
- Wang, T.; Wu, P.; Ge, Q.; Ning, Z. Ticket prices and revenue levels of tourist attractions in China: Spatial differentiation between prefectural units. Tour. Manag. 2020, 83, 104214. [Google Scholar] [CrossRef]
- Jaemun, B.; Jang, S. Effective promotions for membership subscriptions and renewals to tourist attractions: Discount vs. bonus. Tour. Manag. 2015, 50, 194–203. [Google Scholar]
- Zhang, Y.; Xiao, X.; Zheng, C.; Xue, L.; Guo, Y.; Wu, Q. Is tourism participation in protected areas the best livelihood strategy from the perspective of community development and environmental protection? J. Sustain. Tour. 2020, 28, 587–605. [Google Scholar] [CrossRef]
- Jamieson, W. Overtourism management competencies in Asian urban heritage areas. Int. J. Tour. Cities 2019, 5, 581–597. [Google Scholar] [CrossRef]
- Christaller, W. Some considerations of tourism location in Europe: The peripheral region under-developed countries recreation areas. Pap. Proc. Reg. Sci. Assoc. 1964, 12, 95–105. [Google Scholar] [CrossRef]
- Bevilacqua, E.; Cesti, E. The Structure and Impact of International Tourism in the Veneto Region, Italy. GeoJournal 1989, 19, 285–288. [Google Scholar] [CrossRef]
- Judd, D.R. Promoting Tourism in US Cities. Tour. Manag. 1995, 16, 175–187. [Google Scholar] [CrossRef]
- Canale, R.R.; De Simone, E.; Di Maio, A.; Parenti, B. UNESCO world heritage sites and tourism attractiveness: The case of Italian provinces. Land Use Policy 2019, 85, 114–120. [Google Scholar] [CrossRef]
- Po, R.Y.; Reichel, A.; Cohen, R. Tourists perceptions of world heritage site and its designation. Tour. Manag. 2013, 35, 272–274. [Google Scholar]
- Poku, G.; Boakye, K.A. Insights into the safety and security expressions of visitors to the Kakum National Park: Implications for management. Tour. Manag. Perspect. 2019, 32, 1–8. [Google Scholar] [CrossRef]
- Tatum, K.; Porter, N.; Hale, J. A feeling for what’s best: Landscape aesthetics and notions of appropriate residential architecture in dartmoor national park, England. J. Rural. Stud. 2017, 56, 167–179. [Google Scholar] [CrossRef]
- Chi, C.G.Q.; Cai, R.; Li, Y. Factors influencing residents’ subjective well-being at world heritage sites. Tour. Manag. 2017, 63, 209–222. [Google Scholar] [CrossRef]
- Erdogan, N.; Tosum, C. Environmental performance of tourism accommodations in the protected areas: Case of goreme historical national park. Int. J. Hosp. Manag. 2009, 28, 406–414. [Google Scholar] [CrossRef]
- Seidl, A. Cultural ecosystem services and economic development: World heritage and early efforts at tourism in Albania. Ecosyst. Serv. 2014, 10, 164–171. [Google Scholar] [CrossRef]
- Song, D.; Kuwaha, R.S. Ecotourism and world natural heritage: Its influence on islands in Japan. J. Mar. Isl. Cult. 2016, 5, 36–46. [Google Scholar] [CrossRef]
- Weidenfeld, A.; Butler, R.W.; Williams, A.M. Clustering and compatibility between tourism attractions. Int. J. Tour. Res. 2010, 12, 1–16. [Google Scholar] [CrossRef]
- Weidenfeld, A.; Butler, R.W.; Williams, A.M. The role of clustering, cooperation and complementarities in the visitor attraction sector. Curr. Issues Tour. 2011, 14, 595–629. [Google Scholar] [CrossRef]
- Back, A.; Marjavaara, R. Mapping an invisible population: The uneven geography of second-home tourism. Tour. Geogr. 2017, 19, 595–611. [Google Scholar] [CrossRef]
- Blasco, D.; Guia, J.; Prats, L. Tourism destination zoning in mountain regions: A consumer- based approach. Tour. Geogr. 2014, 16, 512–528. [Google Scholar] [CrossRef]
- Hjalager, A.M. Tourism destinations and the concept of industrial districts. Tour. Hosp. Res. 2000, 2, 199–213. [Google Scholar] [CrossRef]
- Balaguer, J.; Pernías, J.C. Relationship between spatial agglomeration and hotel prices. Evidence from business and tourism consumers. Tour. Manag. 2013, 36, 391–400. [Google Scholar] [CrossRef]
- Vasiliadis, C.A.; Kobotis, A. Spatial analysis-an application of nearest-neighbour analysis to tourism locations in Macedonia. Tour. Manag. 1999, 20, 141–148. [Google Scholar] [CrossRef]
- Jackson, J.; Murphy, P. Clusters in regional tourism an Australian case. Ann. Tour. Res. 2006, 33, 1018–1035. [Google Scholar] [CrossRef]
- Bernini, C. Convention industry and destination clusters: Evidence from Italy. Tour. Manag. 2009, 30, 878–889. [Google Scholar] [CrossRef]
- Truchet, S.; Piguet, V.; Aubert, F.; Callois, J.-M. Spatial influence of attractions on tourism development. Tour. Geogr. 2016, 18, 539–560. [Google Scholar] [CrossRef]
- Paul, T. What factors make rail trails successful as tourism attractions? Developing a conceptual framework from relevant literature. J. Outdoor Recreat. Tour. 2015, 12, 89–98. [Google Scholar]
- Sammy, C.H.; Li, P.R.; Ade, O. Destination marketing: The use of technology since the millennium. J. Destin. Mark. Manag. 2017, 6, 95–102. [Google Scholar]
- Heng, C.; Gang, L.; Haiyan, S. Modelling the interdependence of tourism demand: The global vector autoregressive approach. Ann. Tour. Res. 2017, 67, 1–13. [Google Scholar]
- Aristeidis, S.; Dimitrios, A.; Stathis, P.; Dimitris, K. Terrorist incidents and tourism demand: Evidence from Greece. Tour. Manag. Perspect. 2018, 25, 23–28. [Google Scholar]
- Lan, F.; Anna, L.; Paul, B.; Adele, L. Managing Asian attractions, Generation Y and face. J. Hosp. Tour. Manag. 2017, 32, 35–44. [Google Scholar]
- Stephen, L.J. Tourism Analysis: A Handbook; Longman Group: London, UK, 1989; p. 21. [Google Scholar]
- Gunn, C.A. Tourism Planning: Basics, Concepts, Cases, 3rd ed.; Routledge: London, UK, 1994. [Google Scholar]
- Yu, P.; Zhang, J.; Wang, Y.; Wang, C.; Zhang, H. Can tourism development enhance livelihood capitals of rural households? Evidence from Huangshan National Park adjacent communities, China. Sci. Total Environ. 2020, 748, 141099. [Google Scholar] [CrossRef]
- Xu, D.; Huang, Z.; Lv, L.; Chen, X.C.; Zhang, Z. Spatio-temporal Evolution of 3A and Above Level Scenic Spots in Pan-Changjiang River Delta. Resour. Dev. Market 2017, 33, 95–99. [Google Scholar]
- Shi, H. Spatial distribution pattern and influencing factors of A-class scenic spots in Yangtze River Delta. West. West. Tour. 2022, 2, 5–8. [Google Scholar]
- Yang, Q.; Wu, L.; Zeng, J. Spatial Structure of Class A Tourist Spots in the Yangtze River Delta urban agglomerations. Tour. Res. 2020, 12, 82–96. [Google Scholar]
- Yao, Y.J.; Jing, H.; Liu, D.J. Spatial Evolution and Influence Mechanism of A-Level Scenic Spots in Urban Agglomeration in the Middle Reaches of the Yangtze River. Econ. Geogr. 2019, 1, 198–206. [Google Scholar]

Publisher’s Note: MDPI stays neutral with regard to jurisdictional claims in published maps and institutional affiliations. |
© 2022 by the authors. Licensee MDPI, Basel, Switzerland. This article is an open access article distributed under the terms and conditions of the Creative Commons Attribution (CC BY) license (https://creativecommons.org/licenses/by/4.0/).