1. Introduction
As the material carrier of human production activities, land is an essential natural resource. Land use/cover (LUC) change is the fundamental way in which humans’ socio-economic actions affect the Earth’s surface landscape [
1,
2]. Therefore, research on LUC change and its driving mechanism is essential to improve knowledge of global climate change, biodiversity, regional sustainable development, and human livelihood systems [
3,
4,
5]. LUC research is not only the focus of governments and scientists but is also a core subject that was jointly initiated by the International Geosphere-Biosphere Programme (IGBP) and the International Human Dimensions Programme (IHDP) [
6]. With the advancement of scientific programs and conferences related to LUC research [
7,
8], all sectors of society have gained a deeper understanding of the theoretical significance and application value of LUC research.
Since the 1990s, the advancement of satellite Earth observation technology and the long-term accumulation of satellite image data have provided the ability to carry out global LUC mapping. Many well-known agencies have produced LUC products with a resolution of 300 m to 1 km, including IGBP DISCover [
9], GLC2000 [
10], MODIS Collections 5 [
11], and GlobCover 2009 [
12]. However, due to the low spatial resolution of the above datasets, the requirements of fine time-series-based LUC change analysis in local regions cannot be satisfied [
13]. Since the 21st century, there has been rapid development of satellite remote sensing cloud computing platforms represented by Google Earth Engine and machine learning methods. International academic institutions and groups have successively developed a new generation of high-precision (10–100m) LUC products such as GlobeLand30 [
14], FROM-GLC10, FROM-GLC30 [
15], GLC_FCS30 [
16], CGLS-LC100 [
17], and ESRI 10 [
18] et al. These high-precision, long-term LUC datasets provide basic data for revealing the spatial and temporal patterns, economic and social impacts, and climate response characteristics of regional LUC changes, as well as the scientific basis for national and regional sustainable development planning.
Currently, all regions of the world are experiencing rapid LUC changes. Land use is subject to the natural environment and human activities, which may lead to an imbalance of ecosystem services and a reduction in biodiversity [
19]. Thus, it is crucial to study land use drivers and weigh their impact on regional sustainable development. Research agrees that climate change and human socio-economic activities are the key driving factors in LUC changes. Eric et al. [
20] found that the global tropics show trends of agricultural intensification, pasture expansion, deforestation, and urban expansion; the main driving factors are climate change, external policy intervention, and socio-economic development, etc. Hu et al. [
21,
22] pointed out that land degradation in Central Asia and Kazakhstan is mainly caused by large-scale, high-intensity cropland reclamation, excessive livestock husbandry, and industrial water consumption. In addition to local climatic changes. The trend of warming and drying also has an important impact on the process of regional desertification. Msofe et al. [
23] found that from 1990 to 2016, the Kiombero valley floodplain of Tanzania showed an increase in the area of farmland and grassland and a decrease in the area of wetland and forest. Where human socio-economic activities were the direct drivers of land use change, climate change and topographic features were potential drivers of land use change. Studies provide a scientific basis for judging land degradation and ecological protection at the national scale and give valuable examples for extracting factors affecting LUC change at the national and regional scales, the framework for action, and the model methods.
Cambodia’s national economy is backward, with agriculture being the mainstay and a weak industrial base. In 2016, the World Bank announced that Cambodia had graduated from the ranks of the least developed countries and become a lower–middle-income country. Previously, LUC studies related to Cambodia were usually conducted on a smaller regional scale. For example, Chim et al. [
24] applied the supervised maximum likelihood classification to study forest cover changes in Cambodia’s upper Siem Reap River area from 1988 to 2018. The multi-layer perceptron neural network-Markov chain (MLPNN-MC) was used to predict land LUC change for 2058 and 2098. The results predicted that deforestation in the region would continue to rise in the future and showed that the ecosystem might face severe damage. Senevirathne et al. [
25] explored LUC variation in the Tonle Sap Lake area using the supervised classification and maximum likelihood methods for automated land mapping. The results showed that from 1999 to 2009, the forest coverage rate decreased, the area of farmland increased, water bodies decreased and construction land increased significantly. In previous decades, a national-scale study of the spatial distribution pattern and dynamic evolution pattern in Cambodia, as well as a quantitative analysis of the impact factors and mechanisms of LUC dynamics, have been lacking. This is mainly due to the lack of national-scale, regular land mapping planning and action programs and the difficulty of obtaining free, fine-grained, reliable, and long-time series LUC datasets.
In response to the above issues, this paper attempts to analyze the spatio-temporal pattern and dynamic changes in LUC in Cambodia based on the long-term, high-resolution GLC_FCS30 (Global Land-Cover product with Fine Classification System) dataset. In addition, we seek to synthesize critical data on Cambodia’s national economic and social development and, in this context, further explore the relationship between LUC change in Cambodia and regional climate and socio-economic development. We try to answer the following three questions:
- (1)
What were the distribution patterns and temporal changes in LUC in Cambodia from 2000 to 2020?
- (2)
What climate change and national development factors are related to LUC change in Cambodia?
- (3)
What are the uncertainties associated with the analysis of LUC change and its impact factors in Cambodia?
2. Data and Methods
2.1. Study Area
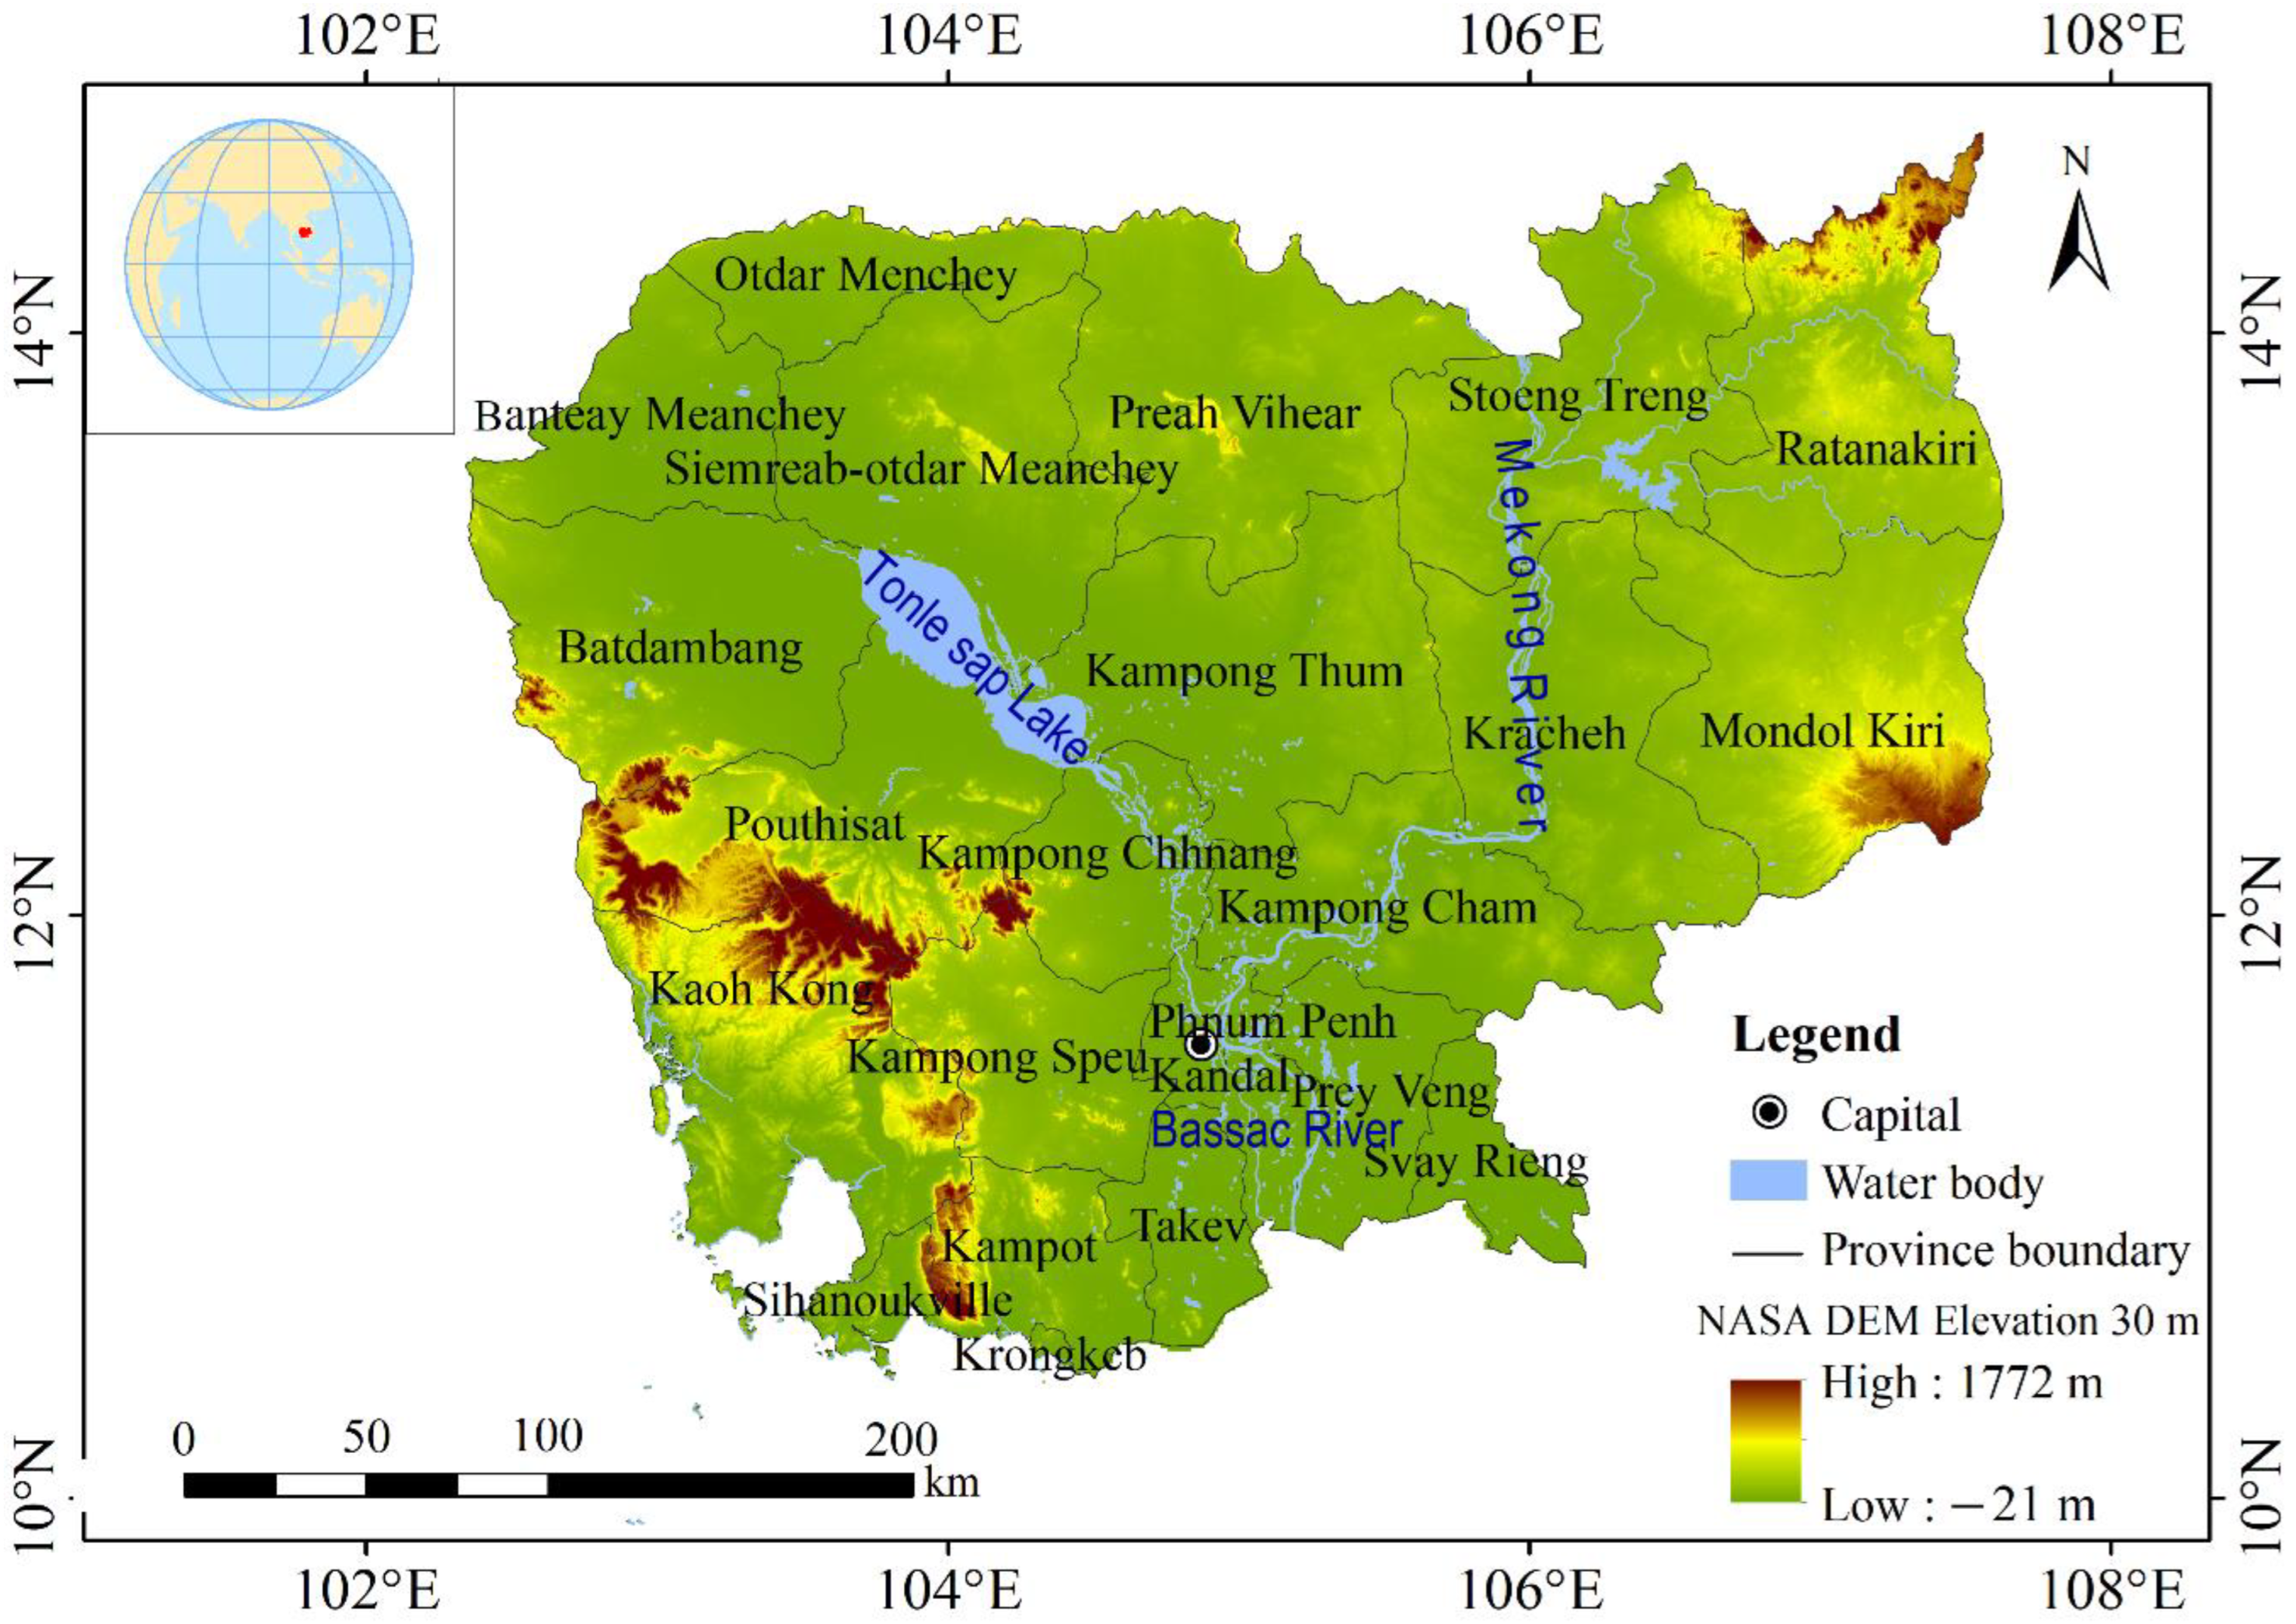
Cambodia is located in the southern part of the Indo-China Peninsula (10°–15° N, 102–108°) and borders Thailand to the west and northwest, Laos to the northeast, Vietnam to the east and southeast, and the Gulf of Thailand to the south. It has a total land area of about 180,000 km
2 (
Figure 1). Cambodia’s climate is tropical monsoon and is characterized by high temperatures and high precipitation. It is summer-like all year round, with distinct dry and rainy seasons. The average annual temperature is 25–28 °C. The rainy season is from May to October, and the dry season is from November to April of the following year. Affected by topography and monsoons, the annual precipitation varies significantly between different regions of Cambodia. The southern section of the Elephant Mountains can reach 5400 mm, while the east of Phnom Penh only has about 1000 mm.
The territory of Cambodia is a saucer-shaped basin. The central and southern parts are plain (the Tonle Sap Basin and the alluvial plains of the Mekong River), occupying three-quarters of the country’s land area. The east, north, and west are surrounded by mountains and plateaus (the Chlong highlands connected to Vietnam, the Dangrek mountain range related to the Korat plateau of Thailand, and the Cardamom and Elephant Mountains in the territory, respectively), thus forming a landform with high edges and low middles, which are open to the southeast.
Agriculture is the first pillar industry of Cambodia’s economy. The main crop is rice, which is exported in large quantities in addition to contributing to self-sufficiency. Cambodia is rich in forestry, fishery, fruit, and wood resources. With a forest coverage of 61.4%, the country produces valuable tropical forest trees such as teak, rosewood, and ebony, as well as many kinds of bamboo and tropical cash crops (such as natural rubber forests). The Tonle Sap Lake is the largest freshwater lake in Southeast Asia, and the southwest coast is also an important fishing ground.
2.2. Data Sources
The LUC dataset (GLC_FCS30) with a 5-year interval used in this study comes from the China Earth Big Data Science and Engineering Data Sharing Service System (
https://data.casearth.cn/sdo/list?searchKey=GLC_FCS30, accessed on 7 September 2022). This dataset is the first LUC product to provide a fine classification system at 30m resolution on a global scale, including nine basic land cover types (Level-0), 16 UN-LCCS (United Nations Land Cover Classification System) land cover types (Level-1), and 29 fine land cover types (Level-2) (
Table 1). The overall accuracy is 82.5% for Level-0, 71.4% for Level-1, and 68.7% for Level-2 [
16,
26]. In this paper, according to the actual situation of the study area, the cropland was studied on the second-level land type, and the other land types were studied on the 0-level land type (
Table 2).
The meteorological data (2000–2020 annual) are from the GLDAS-2.1 [
27] and PERSIANN-CDR [
28] datasets, both with a spatial resolution of 0.25 radians. Based on the daily data obtained from the above datasets, the authors further calculated the annual total precipitation, rainy season precipitation, and annual average temperature in the study area. The economic and social statistics for 2000–2020 (annual) are from the World Bank (
https://data.worldbank.org/country/cambodia?view=chart, accessed on 7 September 2022). Among them, agricultural raw materials include various agricultural products such as agriculture, forestry, animal husbandry, and fishery, excluding oil seeds and oil-containing fruits. Based on the 14 meteorological and socio-economic statistics shown in
Table 3, the authors established a system of driving factors for LUC change.
2.3. LUC Analysis Method
This paper uses single land use dynamics, integrated dynamic degree of LUC, and land transfer matrix to measure the spatio-temporal characteristics of LUC change. The integrated dynamic degree of LUC is used to monitor the active degree of the overall change in all land types in the study area. It is an indicator to describe the regional differences in the speed of land change. In this paper, the integrated land use dynamic attitude of each province in the study area is visually expressed with the help of ArcGIS 10.8. Its calculation method is as follows:
where
LC is the integrated land use dynamic degree during the study period;
,
denote the area of the land type
i at the beginning and end of the study, respectively; and T is the research period.
The single land use dynamic degree is used to characterize the change rate and magnitude of LUC type in a certain period. The calculation method is as follows:
In the formula, K is the dynamic degree of the LUC type at the study time; , represent the area of a certain land type at the beginning and end of the study.
The land use transfer matrix portrays the process of land use change. In this paper, the transfer matrix of LUC types in Cambodia was visualized using Origin 2020 to map the land transfer flows. The transition matrix expression is:
where
S represents the land area;
i and
j represent the LUC types at the beginning and end of the study period.
n is the number of LUC types.
2.4. Analysis of Driving Factors
When analyzing the factors impacting LUC, multiple variables are usually included. An extensive data set with various variables will undoubtedly provide rich study information, but there are also certain drawbacks in using many variables. In previous studies, the use of multiple variables directly for correlation analysis to determine key driving factors has complicated the calculation process and led to correlations between variables being ignored, thus affecting the accuracy of the driving mechanism analysis [
29].
Since the principal component analysis (PCA) is based on the assumption that the data are normally distributed, we first perform a normality test of the data. Many scholars consider the Shapiro–Wilk test to be the most powerful method for testing whether small sample data obey a normal distribution [
30]. The range of
p-values corresponding to the test statistic W value can be found in the Shapiro–Wilk
Table 2. If the
p-value exceeds the chosen alpha level (0.05), the original hypothesis holds that the data are normally distributed; otherwise, the initial hypothesis does not hold [
31]. The formula for calculating
W is as follows:
where
ai is the coefficient of the Shapiro–Wilk test (in our study,
a1 = 0.6646,
a2 = 0.2413);
xi is the ordered random sample value (i.e.,
x1 ≤
x2 ≤ ⋯ ≤
xn);
m =
n/2 when n is even and
m = (
n − 1)/2 when n is odd (in our study,
n = 5,
m = 2), and
is average of the data.
In this paper, the author first performed PCA on each driver using the SPSS platform. The information contained in multiple variables was synthesized into a few critical dimensions while minimizing the loss of information from the original variables. We ensured that the variables were not related to each other. There was no information redundancy. Then, a regression model with each LUC change was constructed based on critical factors.
PCA is a widely used data dimensionality reduction algorithm [
32]. The main idea is to use orthogonal transformation for some linear projection to map the information contained in multidimensional variables to a few dimensions, forming comprehensive variables that are unrelated to each other. These extensive independent variables are called principal components. The first principal component F1 contains an immense amount of information and variance. If F1 is not sufficient to express the information contained in many of the original indicators, the researcher can consider selecting F2, but the information contained in F1 does not need to appear in F2, and construct F3, F4…FP, by analogy. Its construction formula is as follows:
where
A1i,
A2i,
,
Api are the eigenvectors corresponding to the eigenvalues of the covariance matrix of the variable X, and
ZX1,
ZX2,
,
ZXp are the values of the original variables after the Z standardization process.
Multiple stepwise regression analysis is a method of iteratively testing the significance of independent variables. Its basic idea is to repeat the analysis through the automatic programming of the model, eliminate the variables that are not statistically significant, and retain only the independent variables that have a considerable impact on the dependent variable. In this study, the regression model was constructed with the support of the MASS package for the R 4.0.2 software platform, and the AIC value was used as the standard for model optimization. The AIC criterion balances the accuracy and simplicity of the model, and a smaller AIC value indicates a better model fit [
33,
34]. The multiple regression model is as follows:
where
α1,
α2, …,
αn represent the regression coefficients and
β is a constant term.
3. Results
3.1. Spatial Distribution
The statistics for the land area of Cambodia in 2020 (
Figure 2) show that cropland and forest are Cambodia’s main land cover types. The cropland area is the largest (the total area is 8.63 × 10
4 km
2, accounting for 47.67% of the land area), of which the rainfed cropland has the highest proportion (6.50 × 10
4 km
2, 35.90%), while the irrigated cropland and other cropland areas are relatively small (1.31 × 10
4 km
2, 7.26%; 0.82 × 10
4 km
2, 4.51%, respectively). The forest area is second only to cropland (7.64 × 10
4 km
2, 42.22%). Then there are shrubland (0.85 × 10
4 km
2, 4.70%), water bodies (0.46 × 10
4 km
2, 2.54%), wetlands (0.39 × 10
4 km
2, 2.17%), and impervious surfaces (0.13 × 10
4 km
2, 0.70%).
Cropland is widely distributed, among which rainfed cropland is mainly distributed in the alluvial plains of the Mekong River and the Tonle Sap Basin. The irrigated cropland is spread around the Tonle Sap Lake, the Bassac River, and the Mekong River. Other croplands are scattered in various parts of Cambodia. Forests are mainly distributed on the Ratanak Kiri plateau and Chlong highlands in the east, the Dangrek Mountains in the north, and the Cardamom and Elephant Mountains in the southwest, including provinces such as Mondol Kiri, Ratanakiri, Stoeng Treng, Preah Vihear, and Kaoh Kong. Shrubland is scattered throughout the study. Wetlands are mainly located in the northeastern part of Batdambang Province and the western part of Kampong Thum Province around Tonle Sap Lake. The impervious surface is relatively small and scattered in the Mekong alluvial plain and southern coastal areas, especially some large cities such as Phnum Penh City, Sihanoukville City, Batdambang City, and Siemreab-otdar Meanehey City. Water bodies in the study area are mainly Tonle sap lake in the central plain, the Bassac River, and the Mekong River. Tonle sap lake is the largest freshwater lake in the Indo-China Peninsula.
It should be emphasized that the area of water bodies in the study area is affected by the temporal phase of the remote sensing imagery, which results in there being very different areas of water bodies and wetlands at different water levels (flood level, dry water level, flat water level, etc.) at different times. During the rainy season, the water from the Mekong River will backflow into Tonle Sap Lake, and the size of the water body will also expand significantly under the premise of infringing on a large number of wetlands along the lake. This means that the study area’s water bodies and wetlands are uncertain. Therefore, the author did not analyze the driving mechanism for the changes in water bodies and wetlands in the subsequent research.
3.2. Spatio-Temporal Dynamic Changes
From 2000 to 2020, the cropland in Cambodia expanded significantly, and all kinds of cropland showed an upward trend. Among them, the area of rainfed cropland increased the most. The increase in impervious surfaces was the largest. While the forest area shrunk greatly, the wetland area decreased, and the area of shrubland and water bodies showed different degrees of expansion. Specifically, the cropland area increased significantly (6.53 × 10³ km2, 8.19%). The rapid increase in cropland mainly occurred after 2005. The area of rainfed cropland has increased significantly over the past 20 years (4.69 × 10³ km2, 7.77%). Although the area of other crops increased by only 1.47 × 10³ km2, the relative increase reached 22.01%. The area of irrigated cropland increased the least (0.37 × 10³ km2, 2.91%). The forest area continued to decrease (7.71 × 10³ km2, 9.16%). The change in impervious surfaces was also significant; although the absolute area only increased by 0.80 × 10³ km2, the relative increase reached 161.16%. The areas of shrubland and water bodies increased slightly (0.46 × 10³ km2, 5.72%; 0.11 × 10³ km2, 2.49%, respectively). The wetlands area generally showed a downward trend (0.20 × 10³ km2, 4.76%).
From 2000 to 2020, Cambodia’s integrated dynamic degree of LUC showed an increasing trend from southwest to northeast (
Figure 3). The integrated dynamic degree of mountainous land in the northeast is relatively high, the Ratanakiri province being the most active with 71.03% of the integrated dynamic degree of LUC. It was followed by Mondolkiri (53.05%), Preah Vihear (50.32%), and Stoeng Treng (36.91%). The central provinces of Otdar Menchey, Kampong Thum, Kracheh, and Siemreab-otdar Menchey municipality were relatively lower (28.17%, 21.77%, 21.09%, and 23.97%, respectively). Land changes in the northeastern and central regions were mainly caused by the decrease in forests and the increase in rainfed cropland. The integrated dynamic degree of LUC in the Southwest Plain is the lowest, among which the degree of land change in the Takev area is the lowest, and the integrated dynamic degree of LUC is only 5.57%. The LUC change in this region was mainly caused by the decrease in rainfed cropland and the increase in impervious surfaces. Due to relatively active socio-economic activities in Phnum and Sihanoukville, their integrated dynamic degree of LUC was significantly higher than those in surrounding areas (21.66% and 19.12%, respectively), and LUC changes in these areas were mainly caused by the increase in impervious surfaces. In addition, the integrated dynamic degree of LUC in other regions is mostly between 9% and 19%.
3.3. Source and Destination
Analyzing the area and composition of LUC change in Cambodia from 2000 to 2020 (
Figure 4), it can be found that 0.64 × 10
4 km
2 of LUC types were transformed from 2000 to 2010, and 1.20 × 10
4 km
2 from 2010 to 2020. In different periods, the most dominant LUC change processes were the conversion of forest to cropland and shrubland and the unidirectional conversion of rainfed cropland to impervious surfaces.
From 2000 to 2020, the dynamic degree of cropland was 0.41%, and the cropland area showed an overall increasing trend. The vast majority of the lost cropland was rainfed cropland (3.36 × 10
3 km
2), followed by irrigated cropland and other cropland (1.39 × 10
3 km
2, 0.49 × 10
3 km
2, respectively), which was mainly converted to forest (48.63%) and impervious surfaces (22.76%). Losses occurred in most provinces and cities in Cambodia, among which Phnum Penh was the most affected. Moreover, the growth in cropland area was dominated by the increase in rainfed cropland (8.04 × 10
3 km
2), while the increases in irrigated cropland and other cropland were relatively small (1.76 × 10
3 km
2, 1.96 × 10
3 km
2, respectively). These increases in cropland were mainly due to decreases in forest (83.91%) and shrubland (10.68%), most of which were distributed in Kracheh, Kampong Thum, Stoeng Treng, and Siemreab-otdar Meanehey (
Figure 5A).
The forest area decreased at a rate of 0.46% per year. In total, 9.75 × 10
3 km
2 of forest area was lost, mainly to rainfed cropland (65.03%), other cropland (16.01%), and shrubland (14.70%) and mainly in Kracheh, Kampong Thum, Stoeng Treng, Siemreab- Provinces, and cities such as otdar Meanehey and Ratanakin. During the same period, the forest area increased by 2.04 × 10
3 km
2, mainly due to conversion from rainfed cropland (60.68%) and shrubland (22.32%), primarily in the northeastern provinces such as Ratanakiri, Stoeng Treng, and Mondol Kiri (
Figure 5B).
The shrubland area showed an increasing trend with a dynamic degree of 0.29%. There was a decrease in the shrubland area of 1.54 × 10
3 km
2, mainly due to conversion from rainfed cropland (46.64%) and forest (29.65%). Shrubland area increased to 2.0 × 10
3 km
2, mainly from the forest (71.78%). The shrubland conversion process has occurred primarily in the provinces of Kracheh, Kampong Thum, and Ratanakiri (
Figure 5C).
The wetlands area showed a decreasing trend. From 2000 to 2020, the wetlands area decreased by an average of 0.46% per year. The size of the wetlands area decreased by 0.43 × 10
3 km
2, mainly to irrigated cropland (46.55%) and rainfed cropland (42.56%), mostly on the coast of Tonle sap lake. During the same period, there was an increase in the wetlands area of 0.23 × 10
3 km
2, mainly due to conversion from rainfed cropland (27.12%) and irrigated cropland (55.12%) and mainly in the Kandal province (
Figure 5D).
The dynamic degree of impervious surfaces was as high as 8.46%. The net gain in impervious surfaces was 0.80 × 10
3 km
2, mainly due to conversion from rainfed cropland (74.46%), mostly concentrated in the socio-economically active provinces and cities, e.g., Sihanoukville, Batdambang, Siemreab-otdar Meanehey, Phnum Penh, and Kandal (
Figure 5E).
The dynamic degree of the water bodies was 0.12%, showing a slight upward trend. In total, a water body area of 0.15 × 10
3 km
2 was lost, mainly to irrigated cropland (70.19%). This mostly occurred along the coast of Tonle sap lake and Kandal Province. The area of water bodies increased by 0.26 × 10
3 km
2, mainly due to conversion from rainfed cropland (28.34%), irrigated cropland (38.32%), and forest (30.13%), mainly in the Stoeng Treng Province (
Figure 5F).
3.4. Economic, Social and Climate Change
To better build the driving model of Cambodia’s LUC changes, we analyzed the socio-economic development trends and climate change trends in Cambodia from 2000 to 2020 using the data from
Table 3. The details are as follows.
From 2000 to 2020, Cambodia’s climate generally showed a slight warming and drying trend. The multi-year average annual temperature was 26.5 °C. An overall increasing trend (0.7 °C/10a) over the past 20 years has occurred. Except for the peak of total precipitation in 2000 (2572.42 mm), from 2001 to 2020, rainfall fluctuated around 2200mm. The change in total precipitation in the rainy season was consistent with the total annual rainfall and showed a fluctuating downward trend (
Figure 6A).
Since 2000, the total population of Cambodia has been growing at an annual rate of 16.07 per thousand, with a total increase of 4,563,700 people in 20 years. The rural population has increased by 2.77 million, and the urban population has increased by 1.79 million. The urbanization rate has grown steadily, from 18.6% in 2000 to 24.2% in 2020, an increase of 2.8 percentage points per year (
Figure 6B).
Cambodia’s national economy is growing rapidly. Since 2000, the average annual growth rate of the national GDP has been 10.3%, from 3.654 USD billion in Cambodia in 2000 to 25.809 USD billion in 2020. The value added of the primary industry rose relatively slowly, with an increase of USD 4.463 billion in the past 20 years. The industrial added value showed a rapid growth trend and surpassed that of the primary industry in 2015 (
Figure 6C).
From 2000 to 2020, national cereal production showed a rapid upward trend (4.3 × 10
5 t/a), from 4.2 × 10
6 t in 2000 to 7.9 × 10
6 t in 2020. Fishery production also showed a relatively significant upward trend (3.8 × 10
4 t/a), from 3.3 × 10
5 t in 2000 to 1.4 × 10
6 t in 2020. Along with the marked increase in material quantity, the export value of agricultural raw materials has also increased markedly. The average annual growth rate of the export value of agricultural raw materials reached 1.6 × 10
7 USD/a. Compared with the value in 2000, the value of agricultural raw material exports in 2020 was 3.7 times higher (
Figure 6D).
3.5. Driving Mechanisms of LUC
We calculated the W-values of the 14 factors using Equation (4). We used linear interpolation to obtain the
p-values (
Table 4) regarding the W and
p values shown in the Shapiro–Wilk
Table 2. The results showed that the
p-values of the 14 factors were all much more significant than the alpha level of 0.05, and the original hypothesis held, i.e., our independent variables, were all normally distributed.
Due to the different measurement units of the 14 factors, their numerical values are quite different. Before PCA, we normalized them to ensure that all variables had the same standard deviation. The PCA showed (
Table 5) that Cambodia’s economic, social, and climate changes in the past 20 years can be attributed to two dimensions. F1 is the dimension of economic and social development, which is related to the gross population (X4), urban population (X5), rural population (X6), urbanization rate (X7), GDP (X8), agricultural value added (X9), manufacturing value added (X10), industrial value added (X11), cereal Production (X12), and export value of agricultural raw material (X14) have strong positive correlations. F2 is the dimension of climate change, which has a strong positive correlation with the two factors, the total annual precipitation (X1) and the rainy season precipitation (X2). Regarding the contribution of F1 and F2, the effect of F1 is much more significant than that of F2 (85.54% vs. 11.98%).
As mentioned earlier, because of the high uncertainty of the water bodies and wetlands areas, this paper used the area of the remaining four LUC types (cropland/forest/shrubland/impervious surfaces) as the dependent variable. The two principal components were taken as the independent variables. The multiple linear stepwise regression method was applied to obtain the regression model of the area of each category with the principal components (
Table 6). The results show that the cropland area has a significantly positive relationship with socio-economic development (F1) and climate change (F2). This indicates that, with the development of Cambodia’s national economy and society, the national cropland area has increased accordingly to meet the needs of domestic people for food production.
Furthermore, the change in climate (a slightly decreasing trend in precipitation) over the past 20 years has restrained the expansion of cropland (mainly rainfed cropland). The forest area was shown to have a significant negative relationship with socio-economic development (F1) and climate change (F2), but the forest area has been more affected by socio-economic development. This reflects the trend of deforestation and reclamation into cropland as the country’s economy developed and precipitation increased. Additionally, changes in climate over the past 20 years have had a deterrent effect on the deforestation process. The area of shrubland expanded due to processes such as deforestation and cropland abandonment. There was a significant positive relationship between the size of impervious surfaces and shrubland and socio-economic development factors (F1). This shows that with the development of the country’s economy and society, the impervious surfaces across the country have expanded rapidly due to urban construction. The main LUC type changes in Cambodia were mainly affected by economic and social development. Climate change affected various other land types by influencing the cropland reclamation process.
Further, PCA used four land area types as the dependent variable and the 12 critical factors identified by independent variables. We established the multiple linear regression models of the different land use types (
Table 7). It can be found that there was a significant positive relationship between the cropland area and the export value of agricultural raw materials (X14) but a significant negative relationship with agricultural value added (X9). There was a positive relationship between forest area and agricultural added value (X9) but a significant negative relationship with the export value of agricultural raw materials (X14). There was a significant positive relationship between shrubland and the urbanization rate (X7). Impervious surfaces had a significant positive relationship with the urban population (X5) but had a negative relationship with urbanization rate (X7) and industrial value added (X11). It can be seen that the main LUC type changes in Cambodia were mainly affected by core socio-economic development factors such as agricultural value added, the export value of agricultural raw materials, urban population size, and urbanization rate.
5. Conclusions
Based on the GLC_FCS30 dataset and authoritative economic and social statistical data, this paper analyzed the spatio-temporal patterns of LUC changes in Cambodia from 2000 to 2020, revealed the impact of economic and social development on LUC, and discussed the potential effects of LUC change on national sustainable development and the uncertainties in the study. This study provides the most recent and the most extended time series of the LUC change pattern and mechanism analysis for Cambodia.
Our research points out that the main LUC types in Cambodia are cropland and forest. Over the past 20 years, Cambodia’s rainfed cropland area has increased significantly, the areas of impervious surfaces have expanded rapidly, the forest area has shrunk significantly, the area of shrubland and water bodies has increased, and the wetland area has shown a decreasing trend. LUC changes in Cambodia are mainly affected by socio-economic activities and are less affected by changes or fluctuations in the climate. The current LUC changes in Cambodia have tended to degrade the ecosystem structure, weaken ecosystem service functions, and threaten the country’s sustainable development. The Cambodian government must take targeted measures to control deforestation, open up wasteland, and protect forest ecosystems.
Our study established a LUCC spatiotemporal evolution analysis method based on the GLC-FCS30 dataset, a driving mechanism analysis method based on PCA and a multiple linear stepwise regression analysis. This technical route can be used as a reference for other countries and regions to conduct similar LUCC research. However, the limitations of this method are that some policy factors cannot be quantified, and the modeling process of driving factors is too simplified. In the future, we should further develop the framework and model methods for studying the driving mechanism of regional LUC changes.


 ,
, 


