

Climate Change and Diurnal Warming: Impacts on the Growth of Different Vegetation Types in the North–South Transition Zone of China
Abstract
:1. Introduction
2. Data and Methods
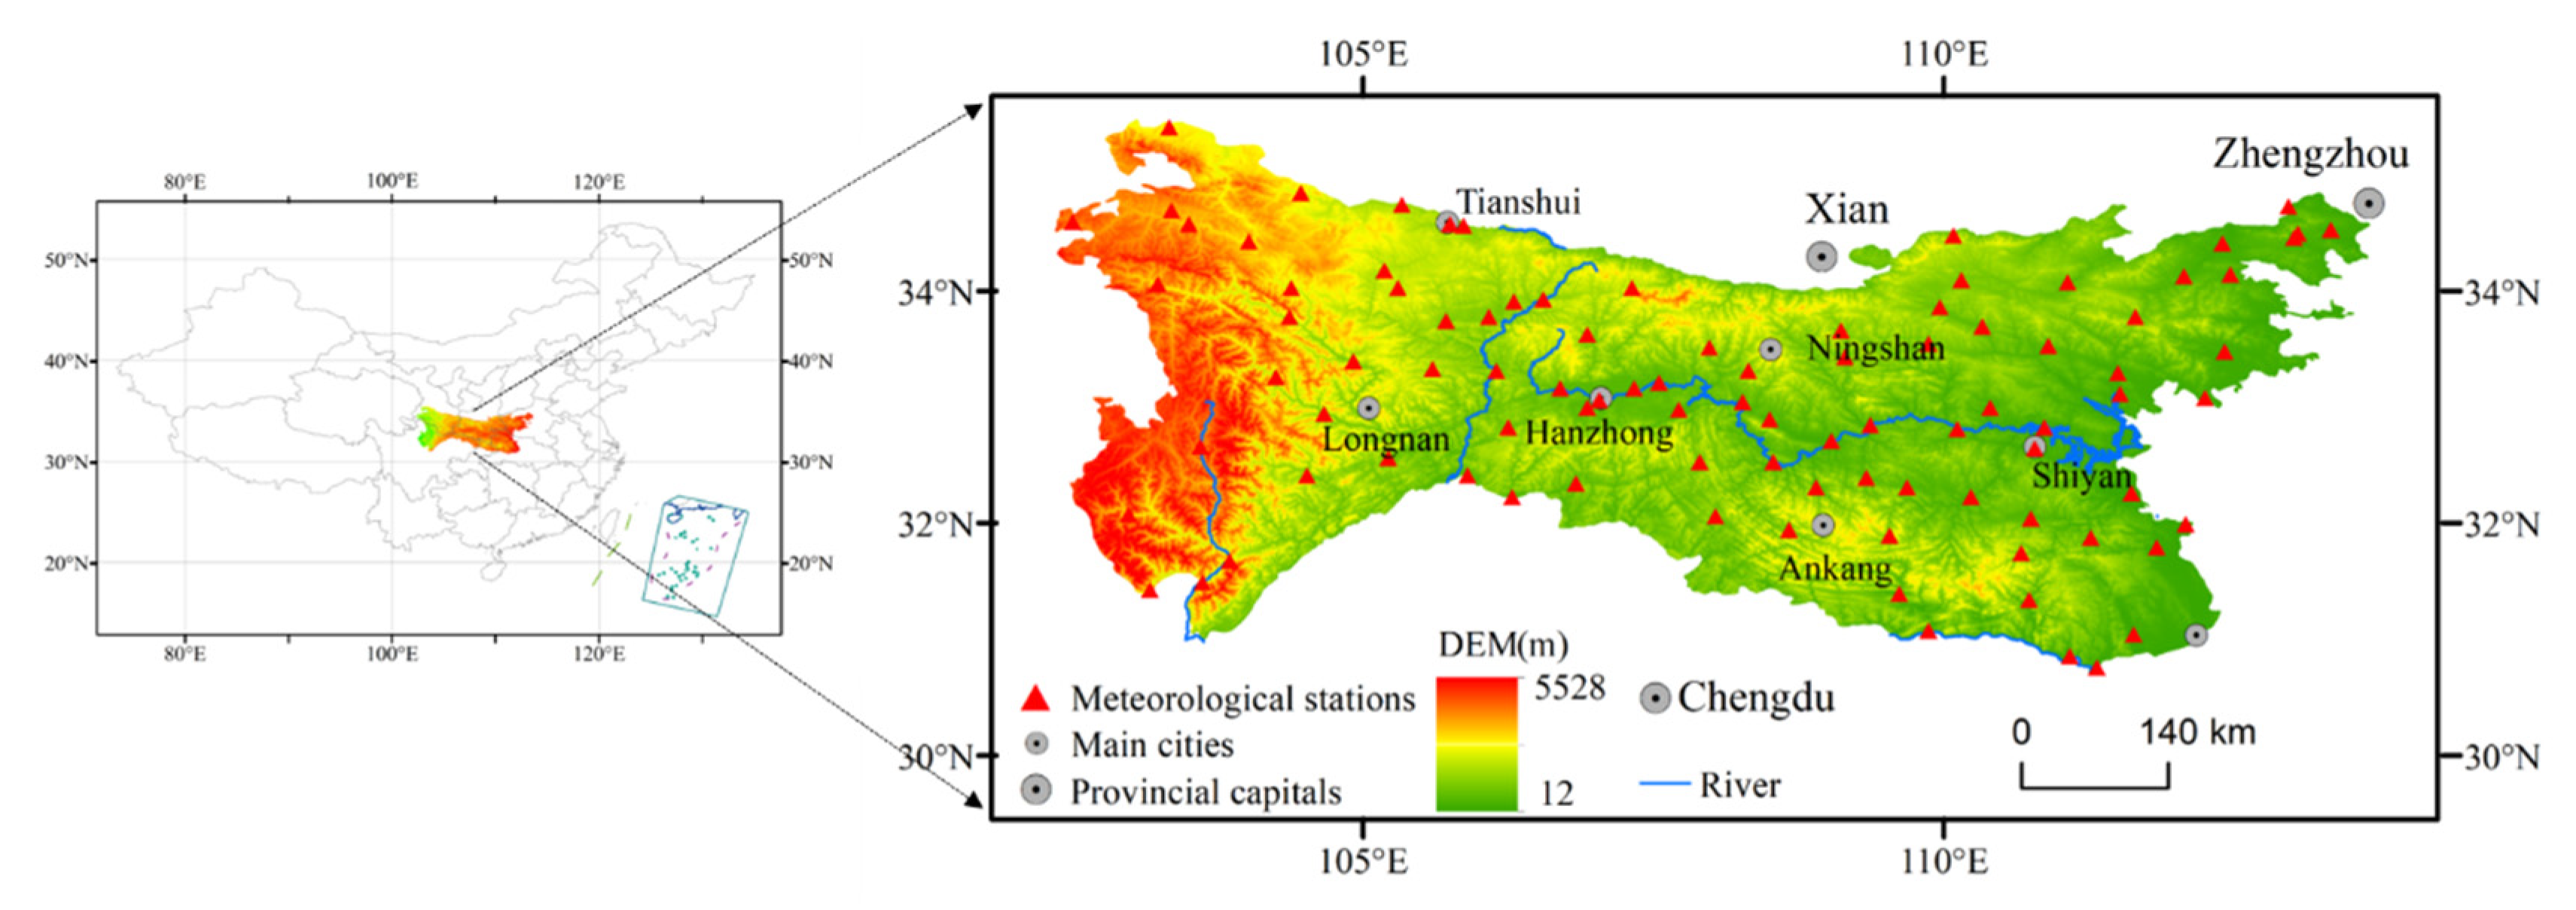
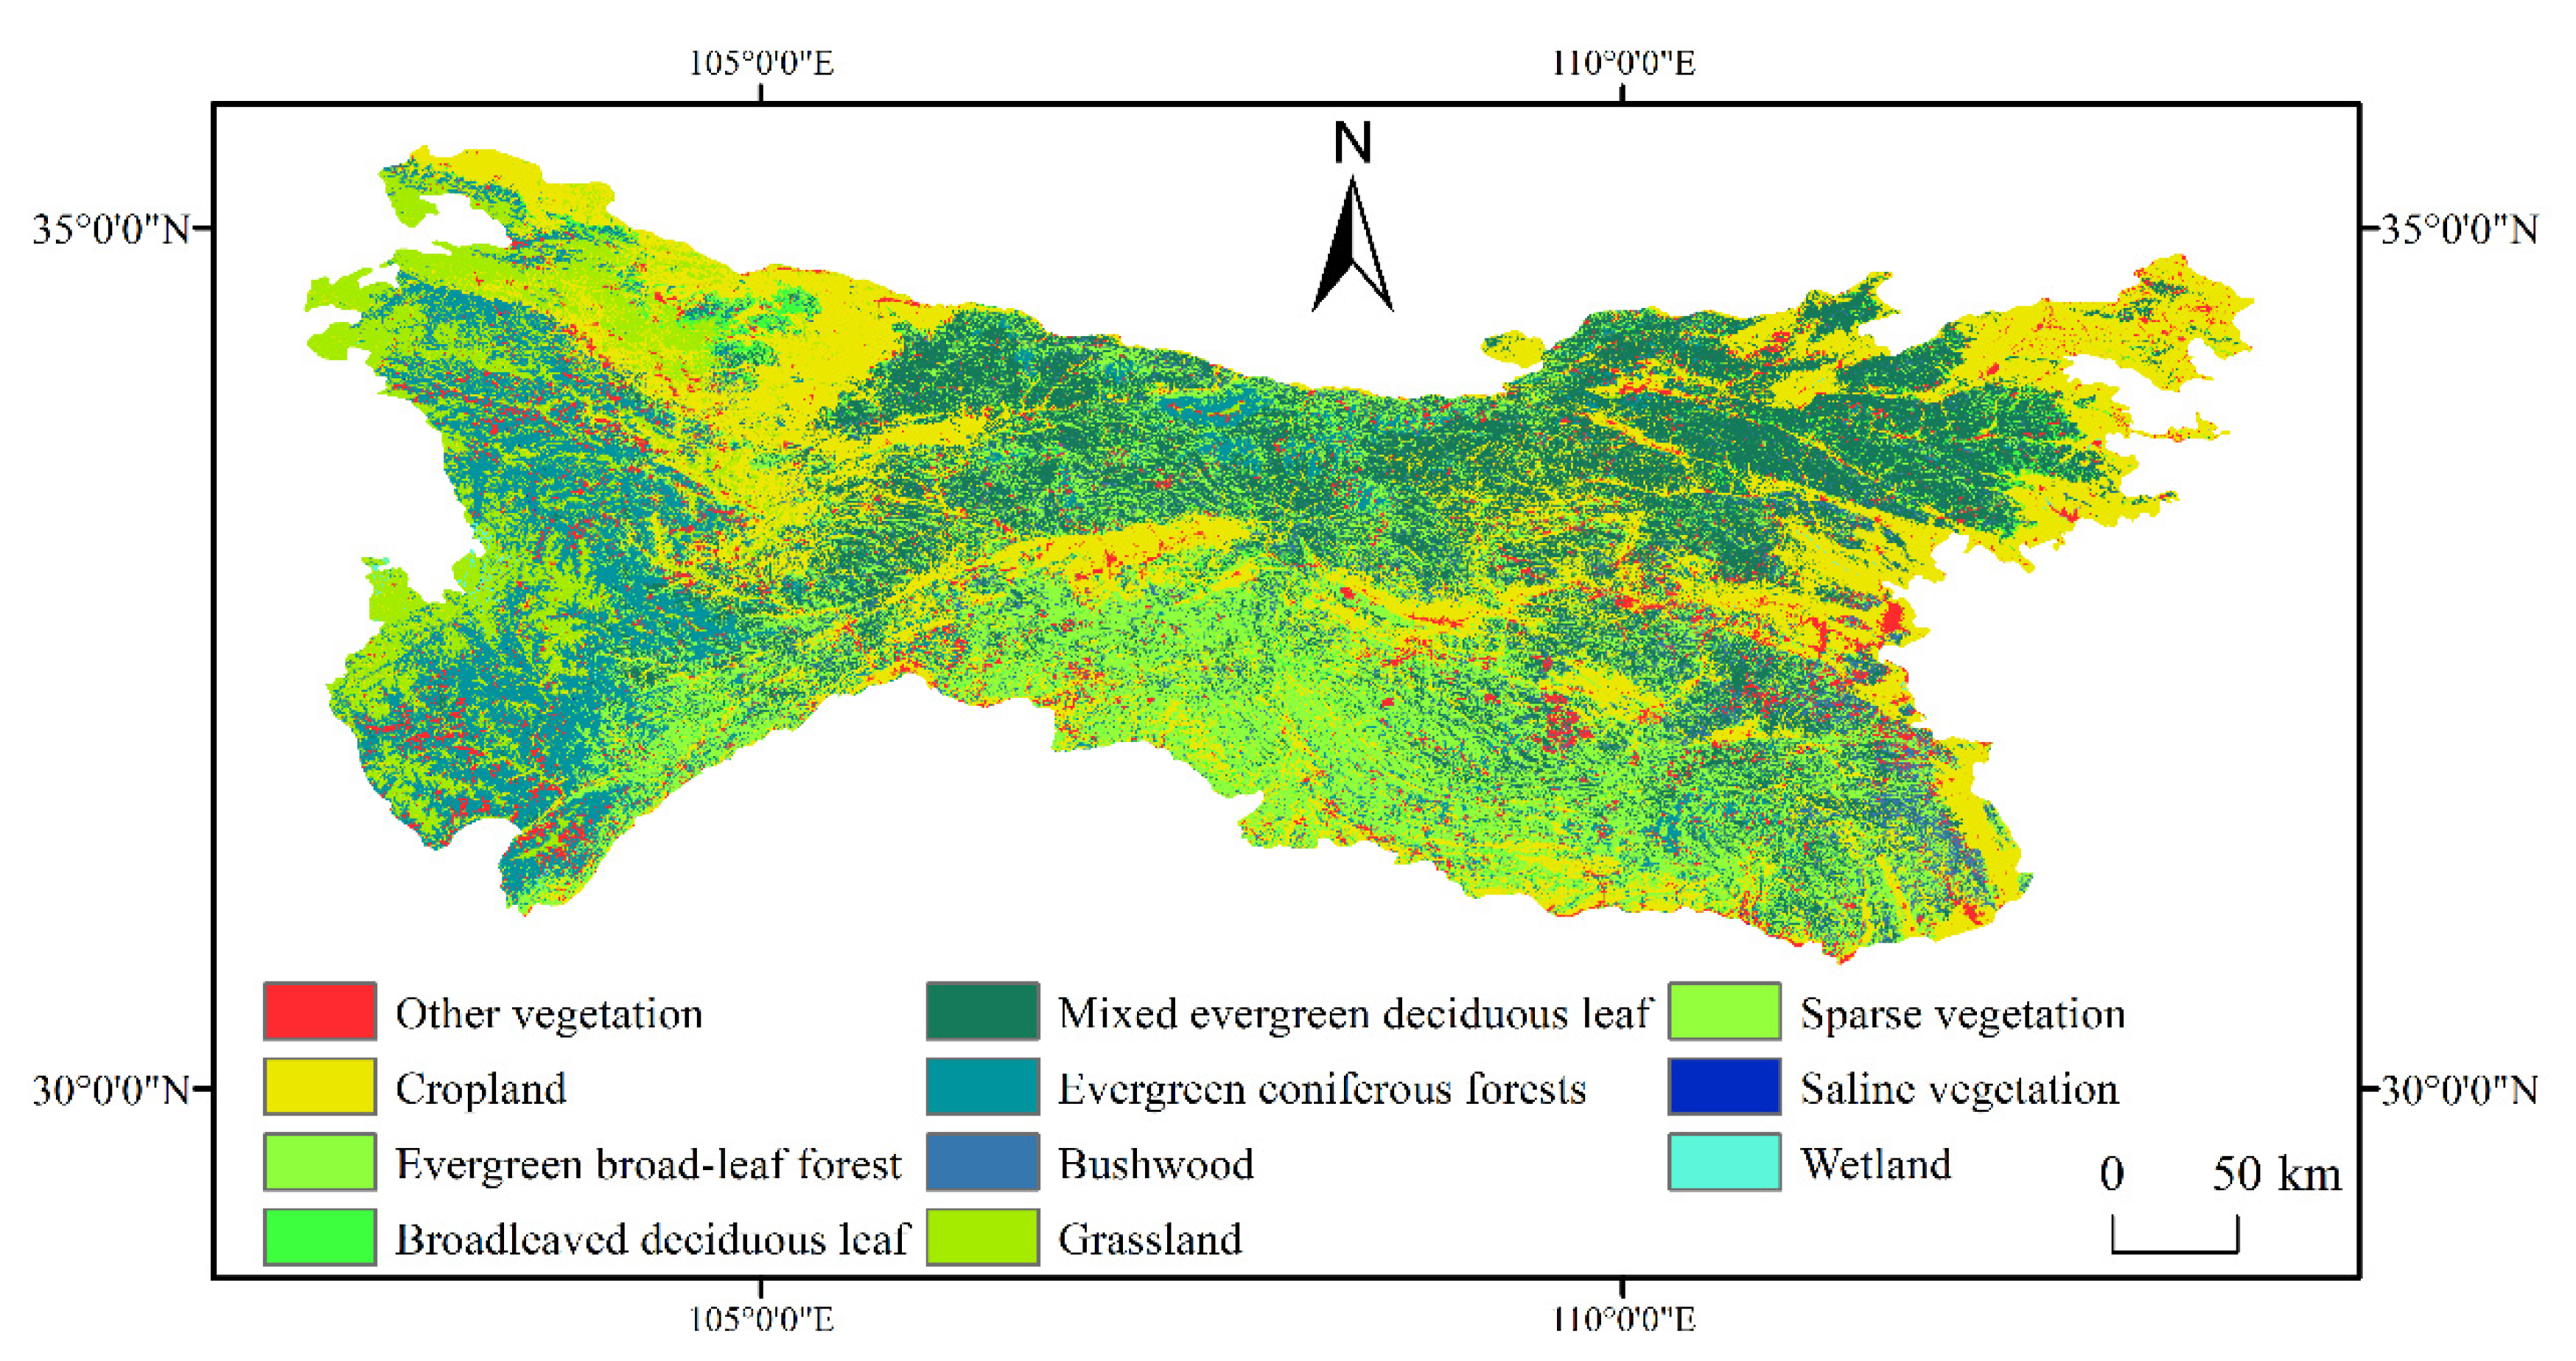
2.1. Study Area
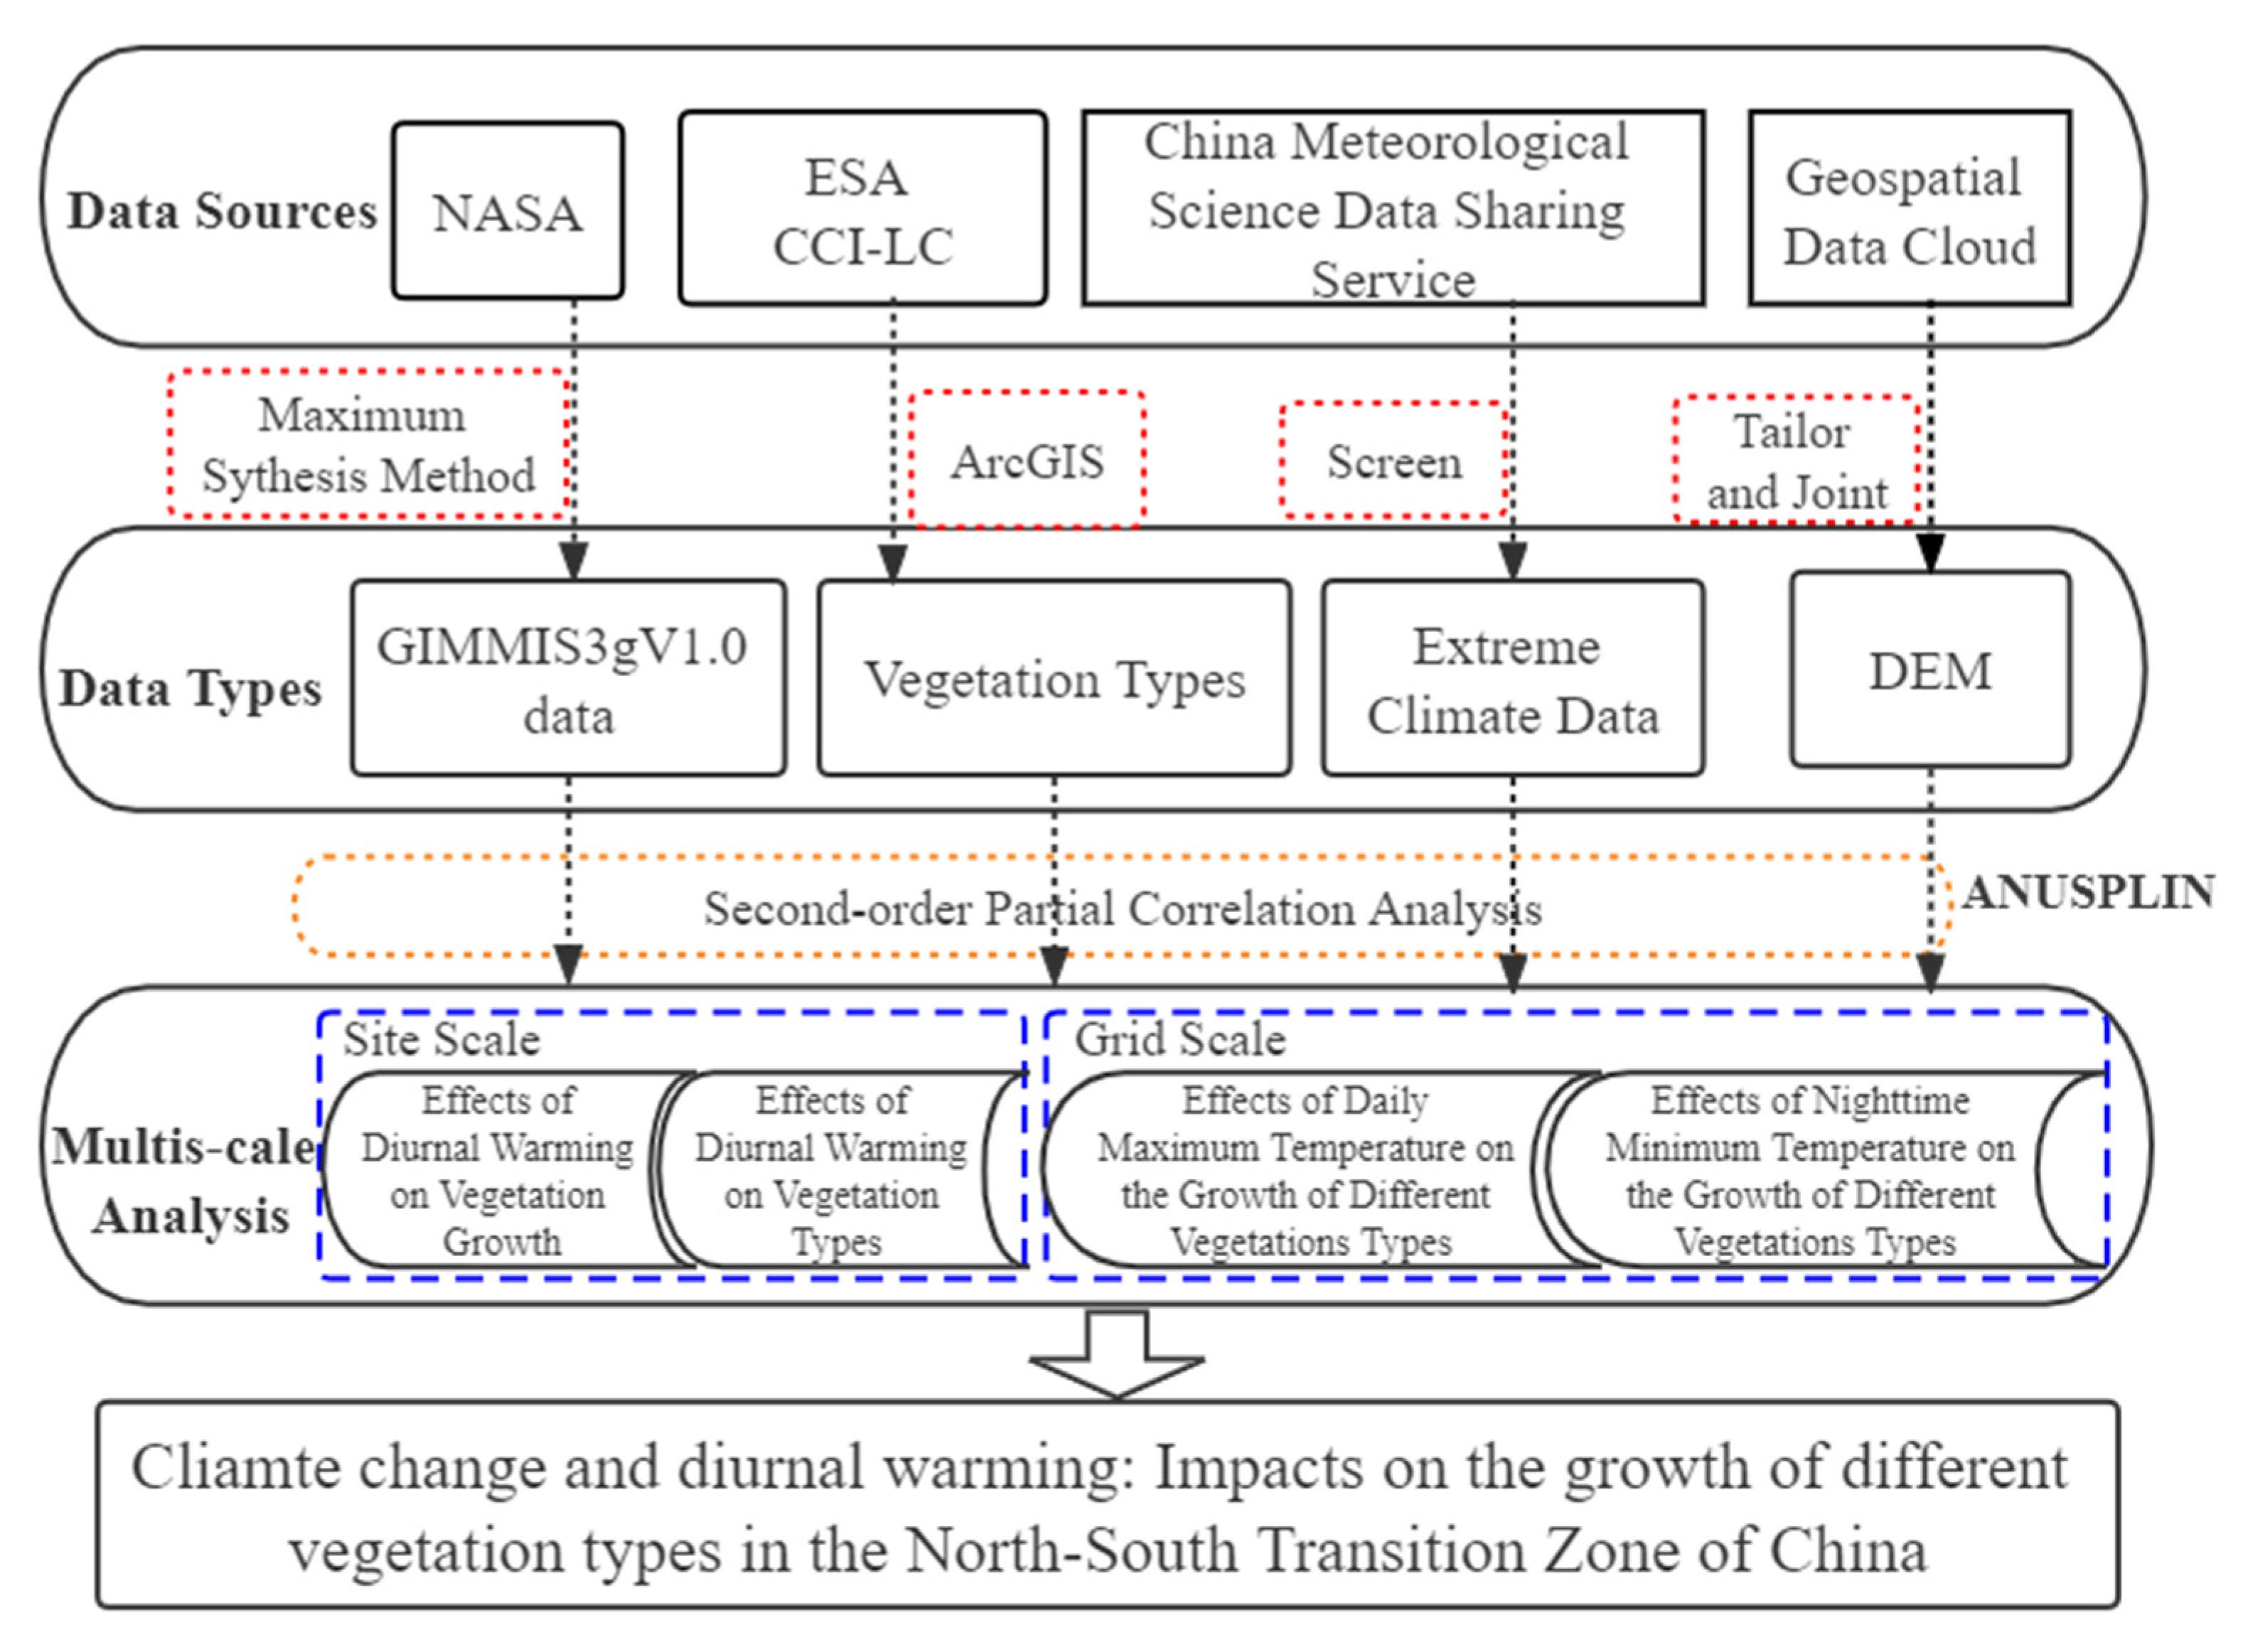
2.2. Data Source and Processing
2.3. Methodology
2.3.1. Maximum Value Composite Method
2.3.2. ANUSPLIN Interpolation Method
2.3.3. Second-Order Partial Correlation Analysis Method
3. Results
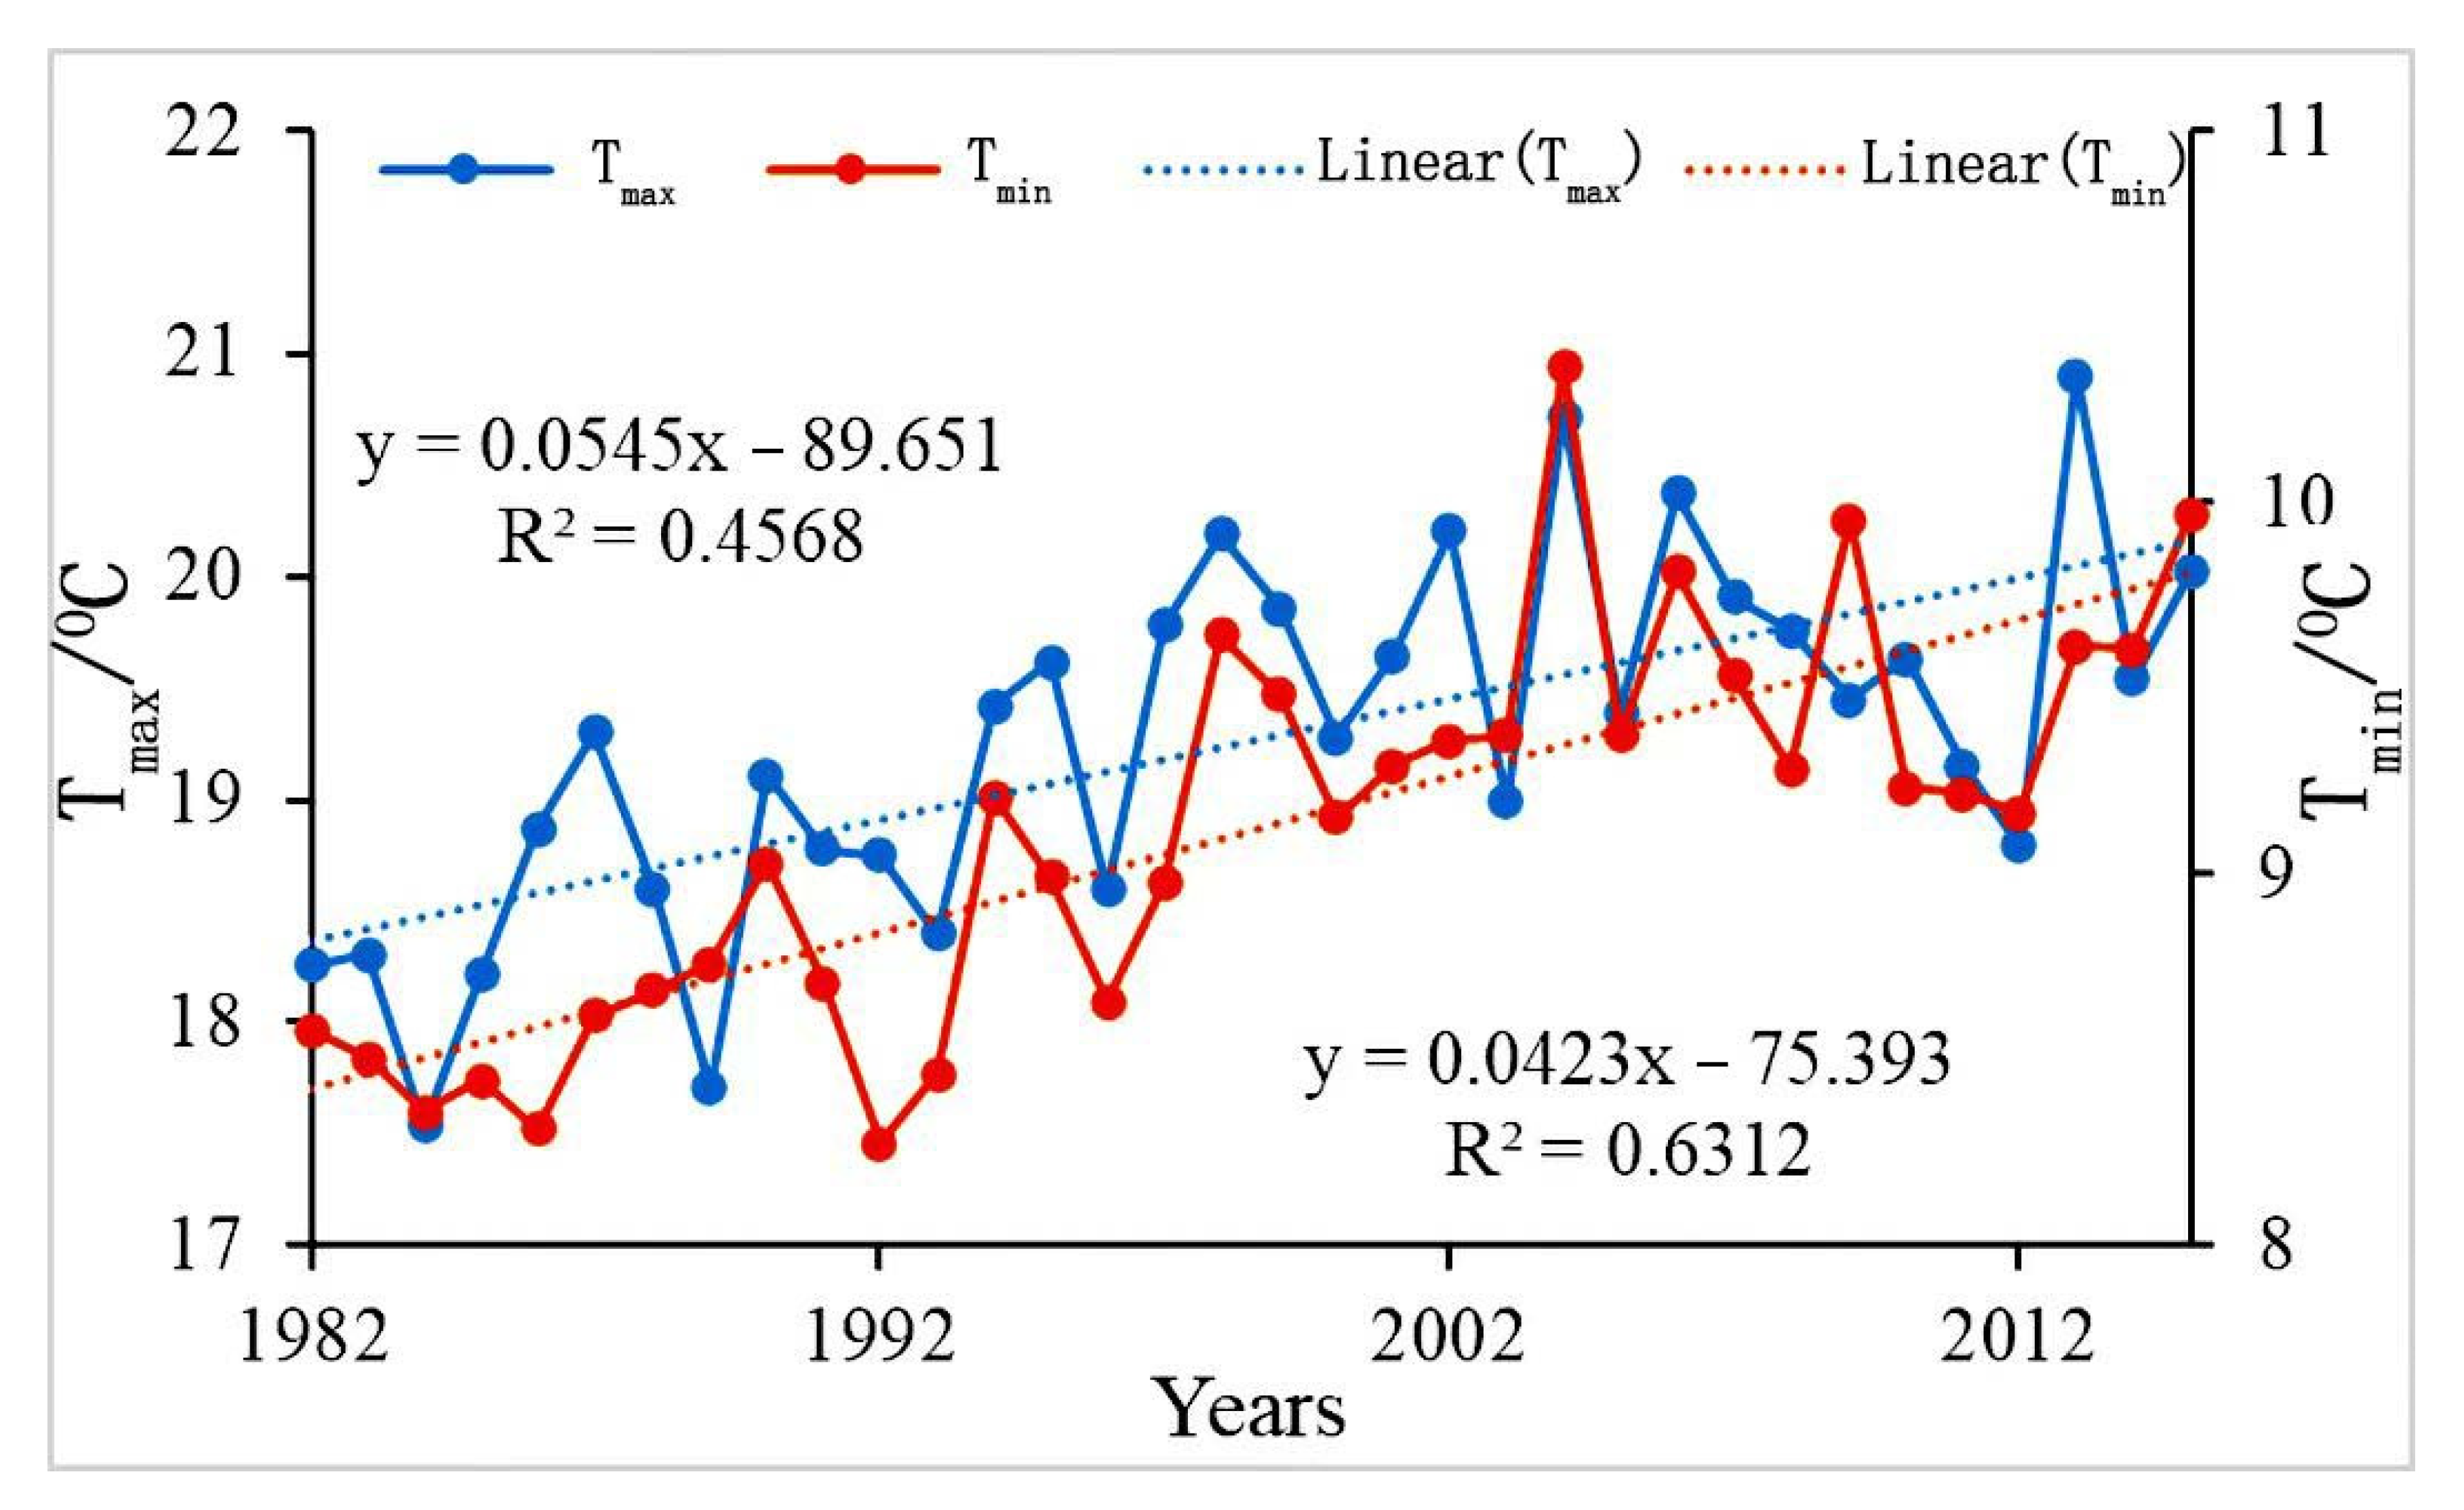
3.1. Analysis of Diurnal Warming Trends in the Qinba Mountains
3.2. Effect of Site-Scale Diurnal Warming on Different Vegetation Types in the Qinba Mountains
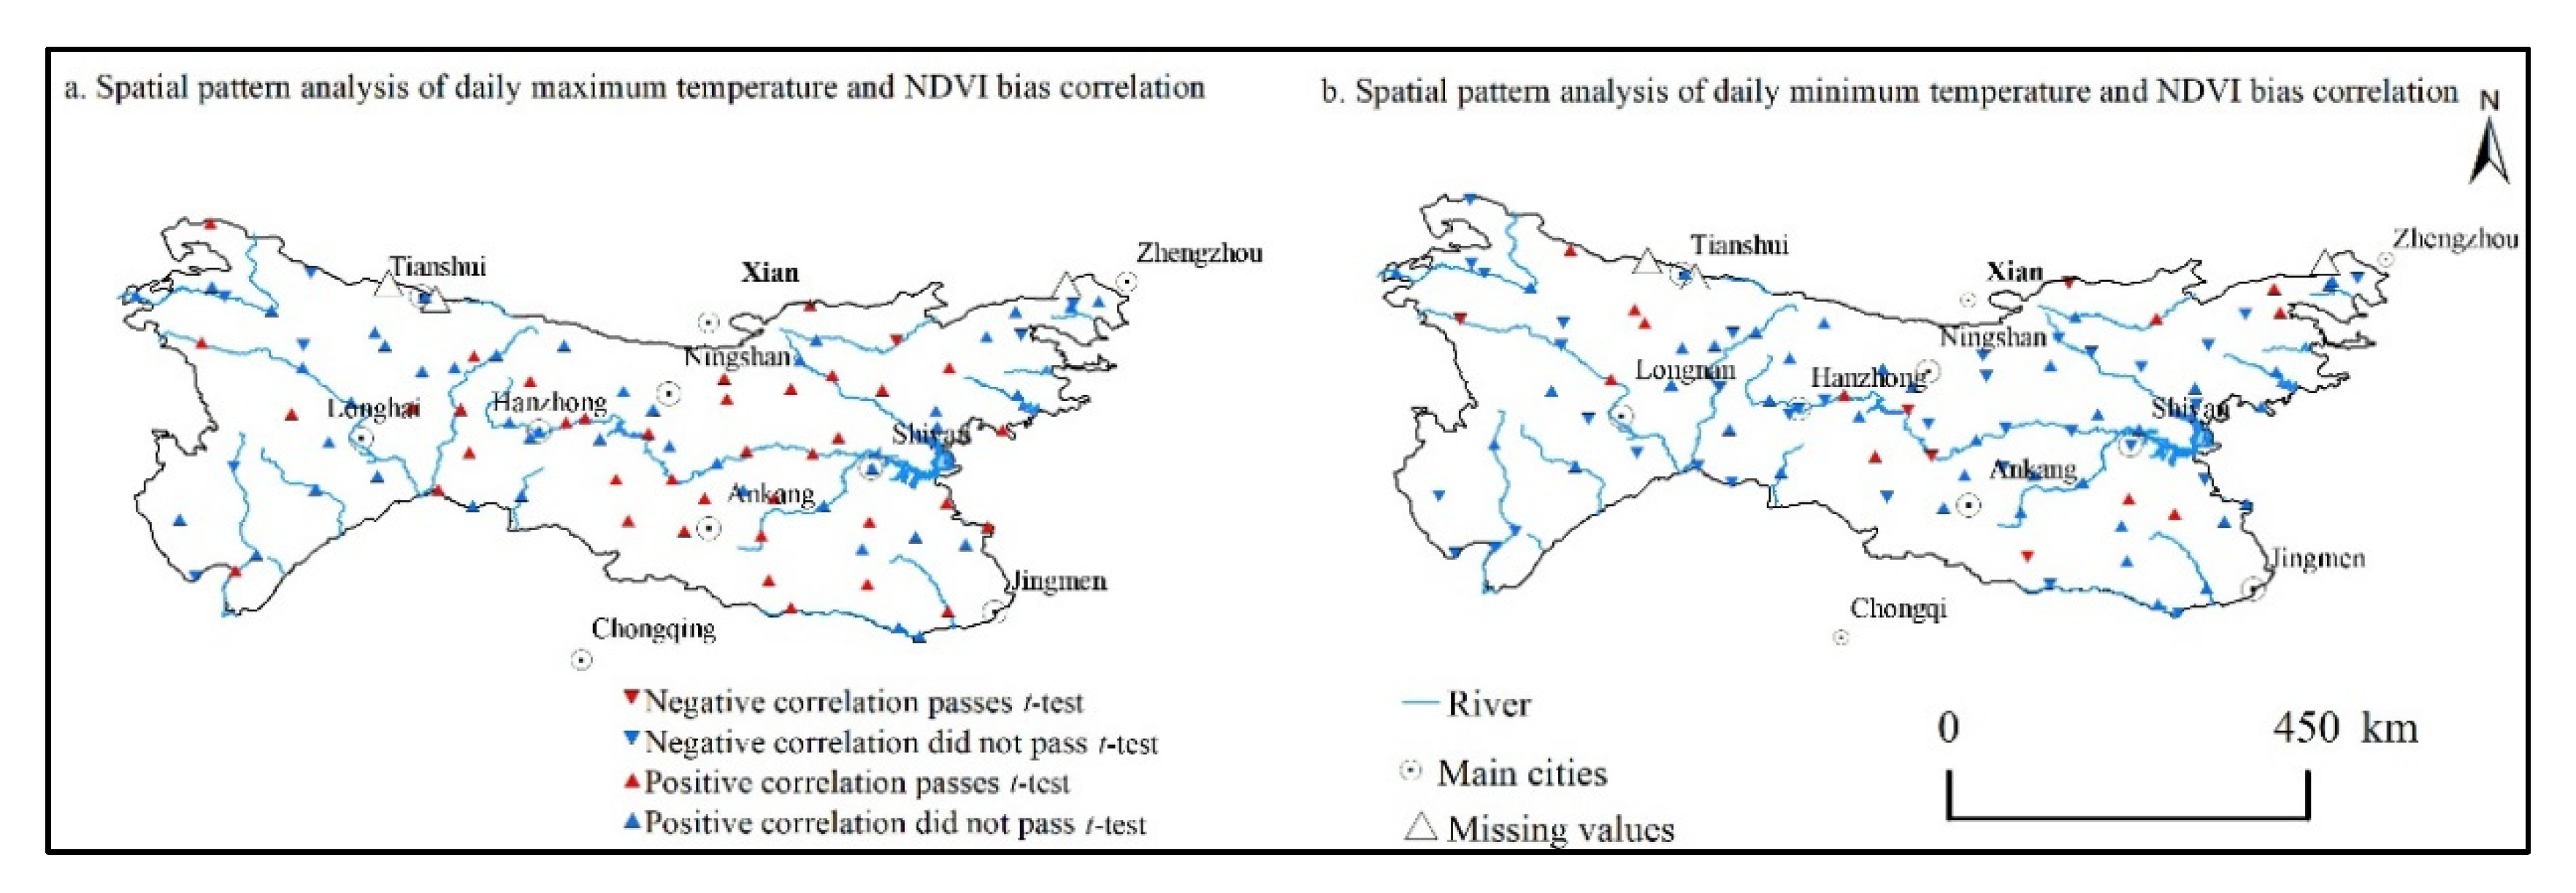
3.2.1. Significance Analysis of Diurnal Warming and NDVI Activity on the Site Scale
3.2.2. Correlation Analysis of Different Vegetation Types on Diurnal Warming
3.3. Effect of Grid-Scale Diurnal Warming on Different Vegetation Types in the Qinba Mountains
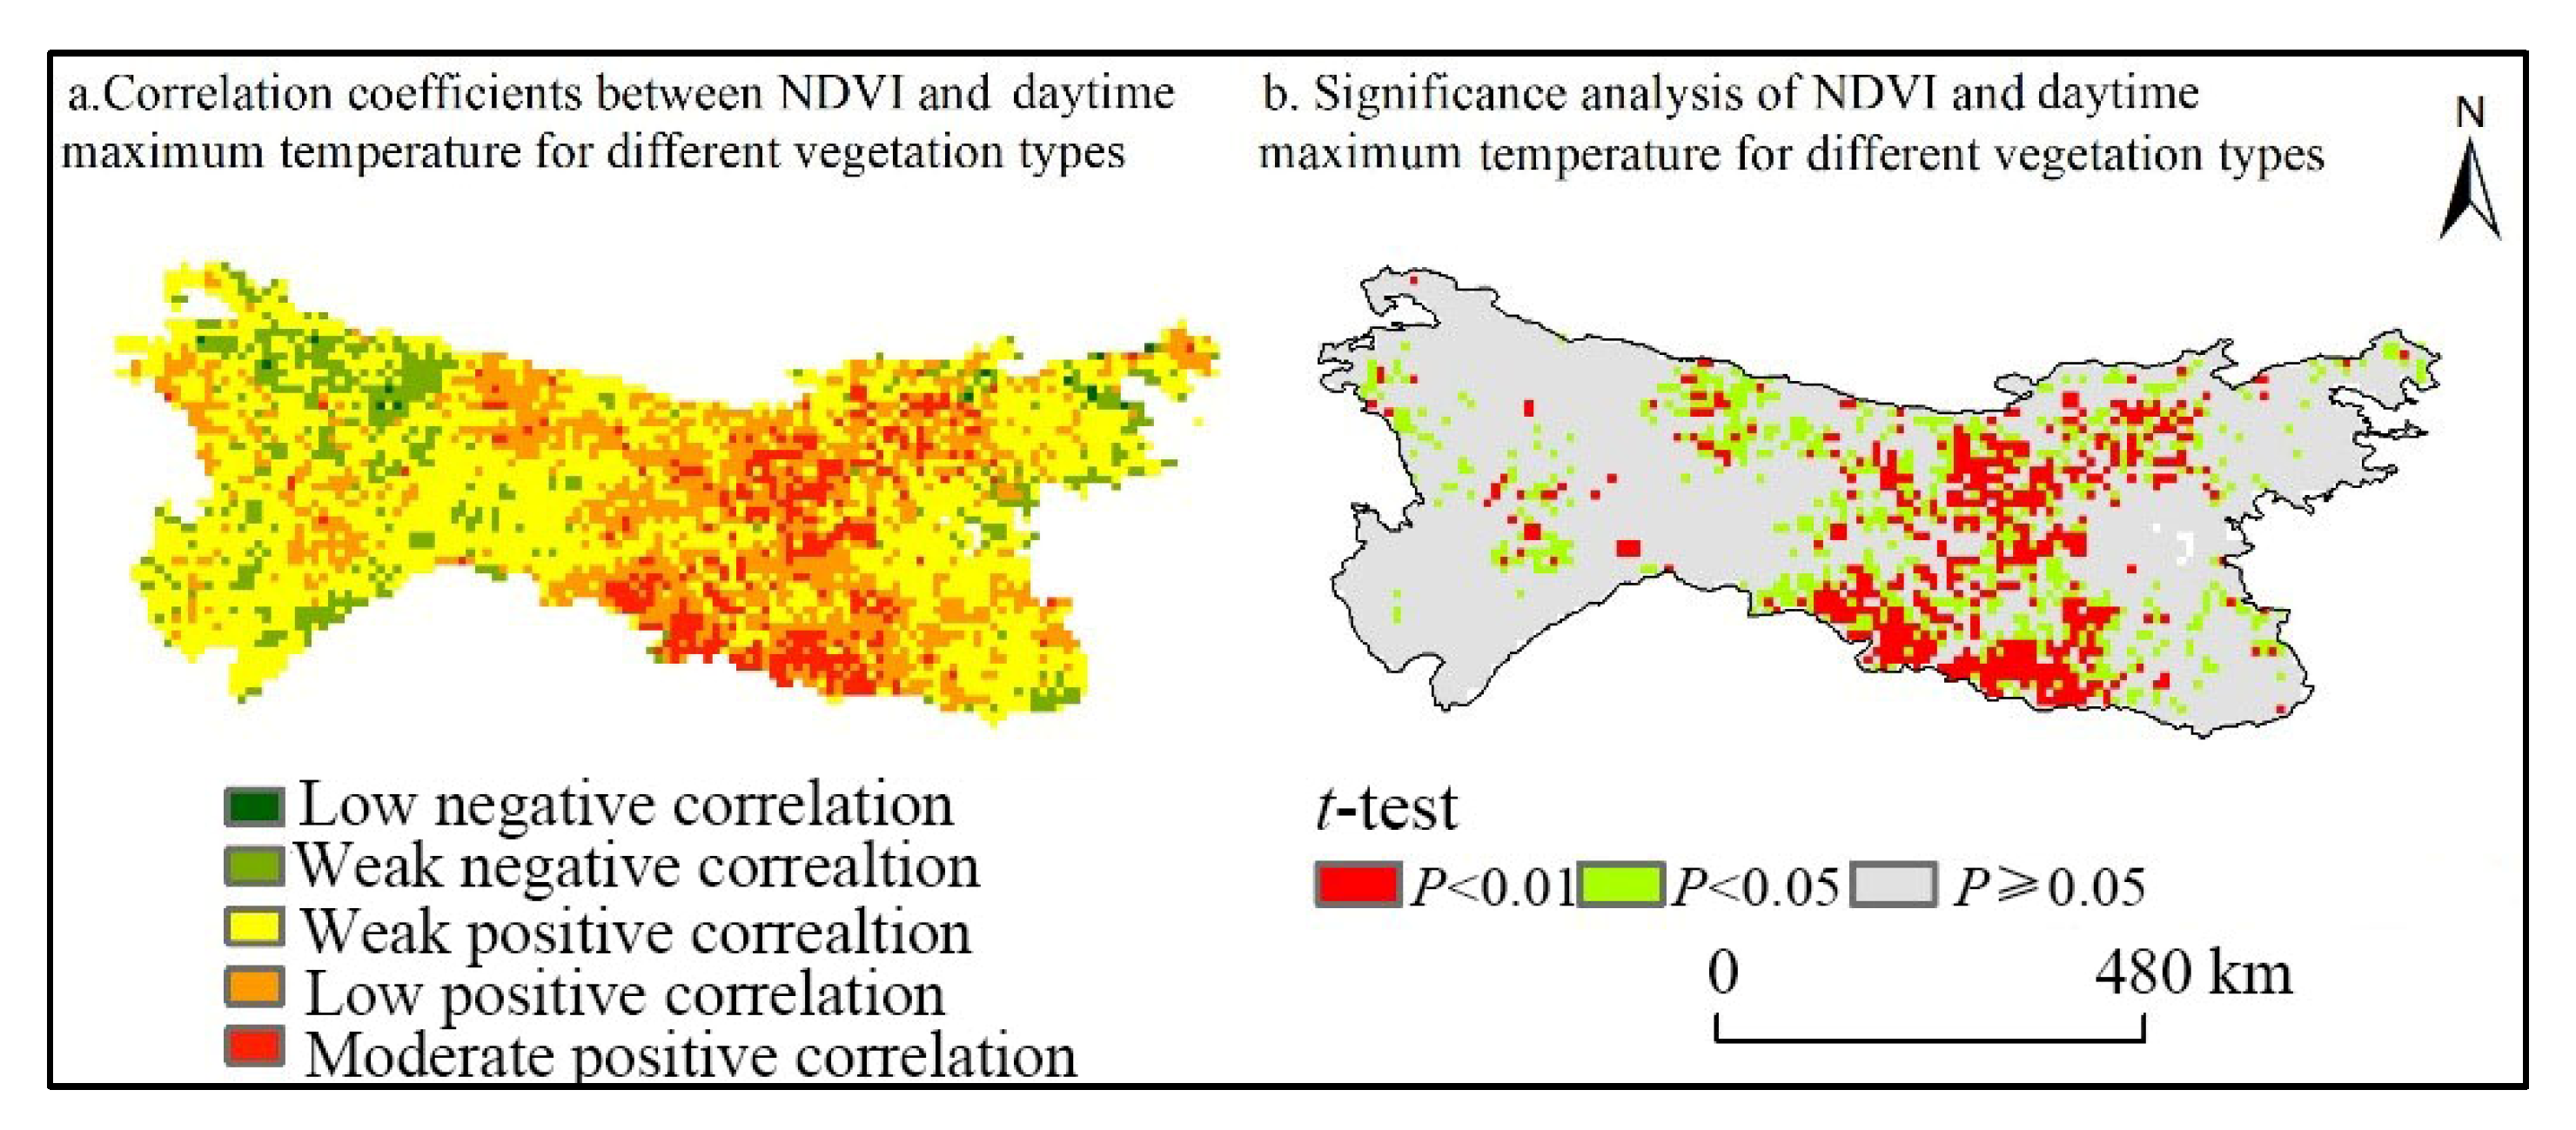
3.3.1. Spatial Response Characteristics of NDVI to Daytime Maximum Temperatures in Different Vegetation Types
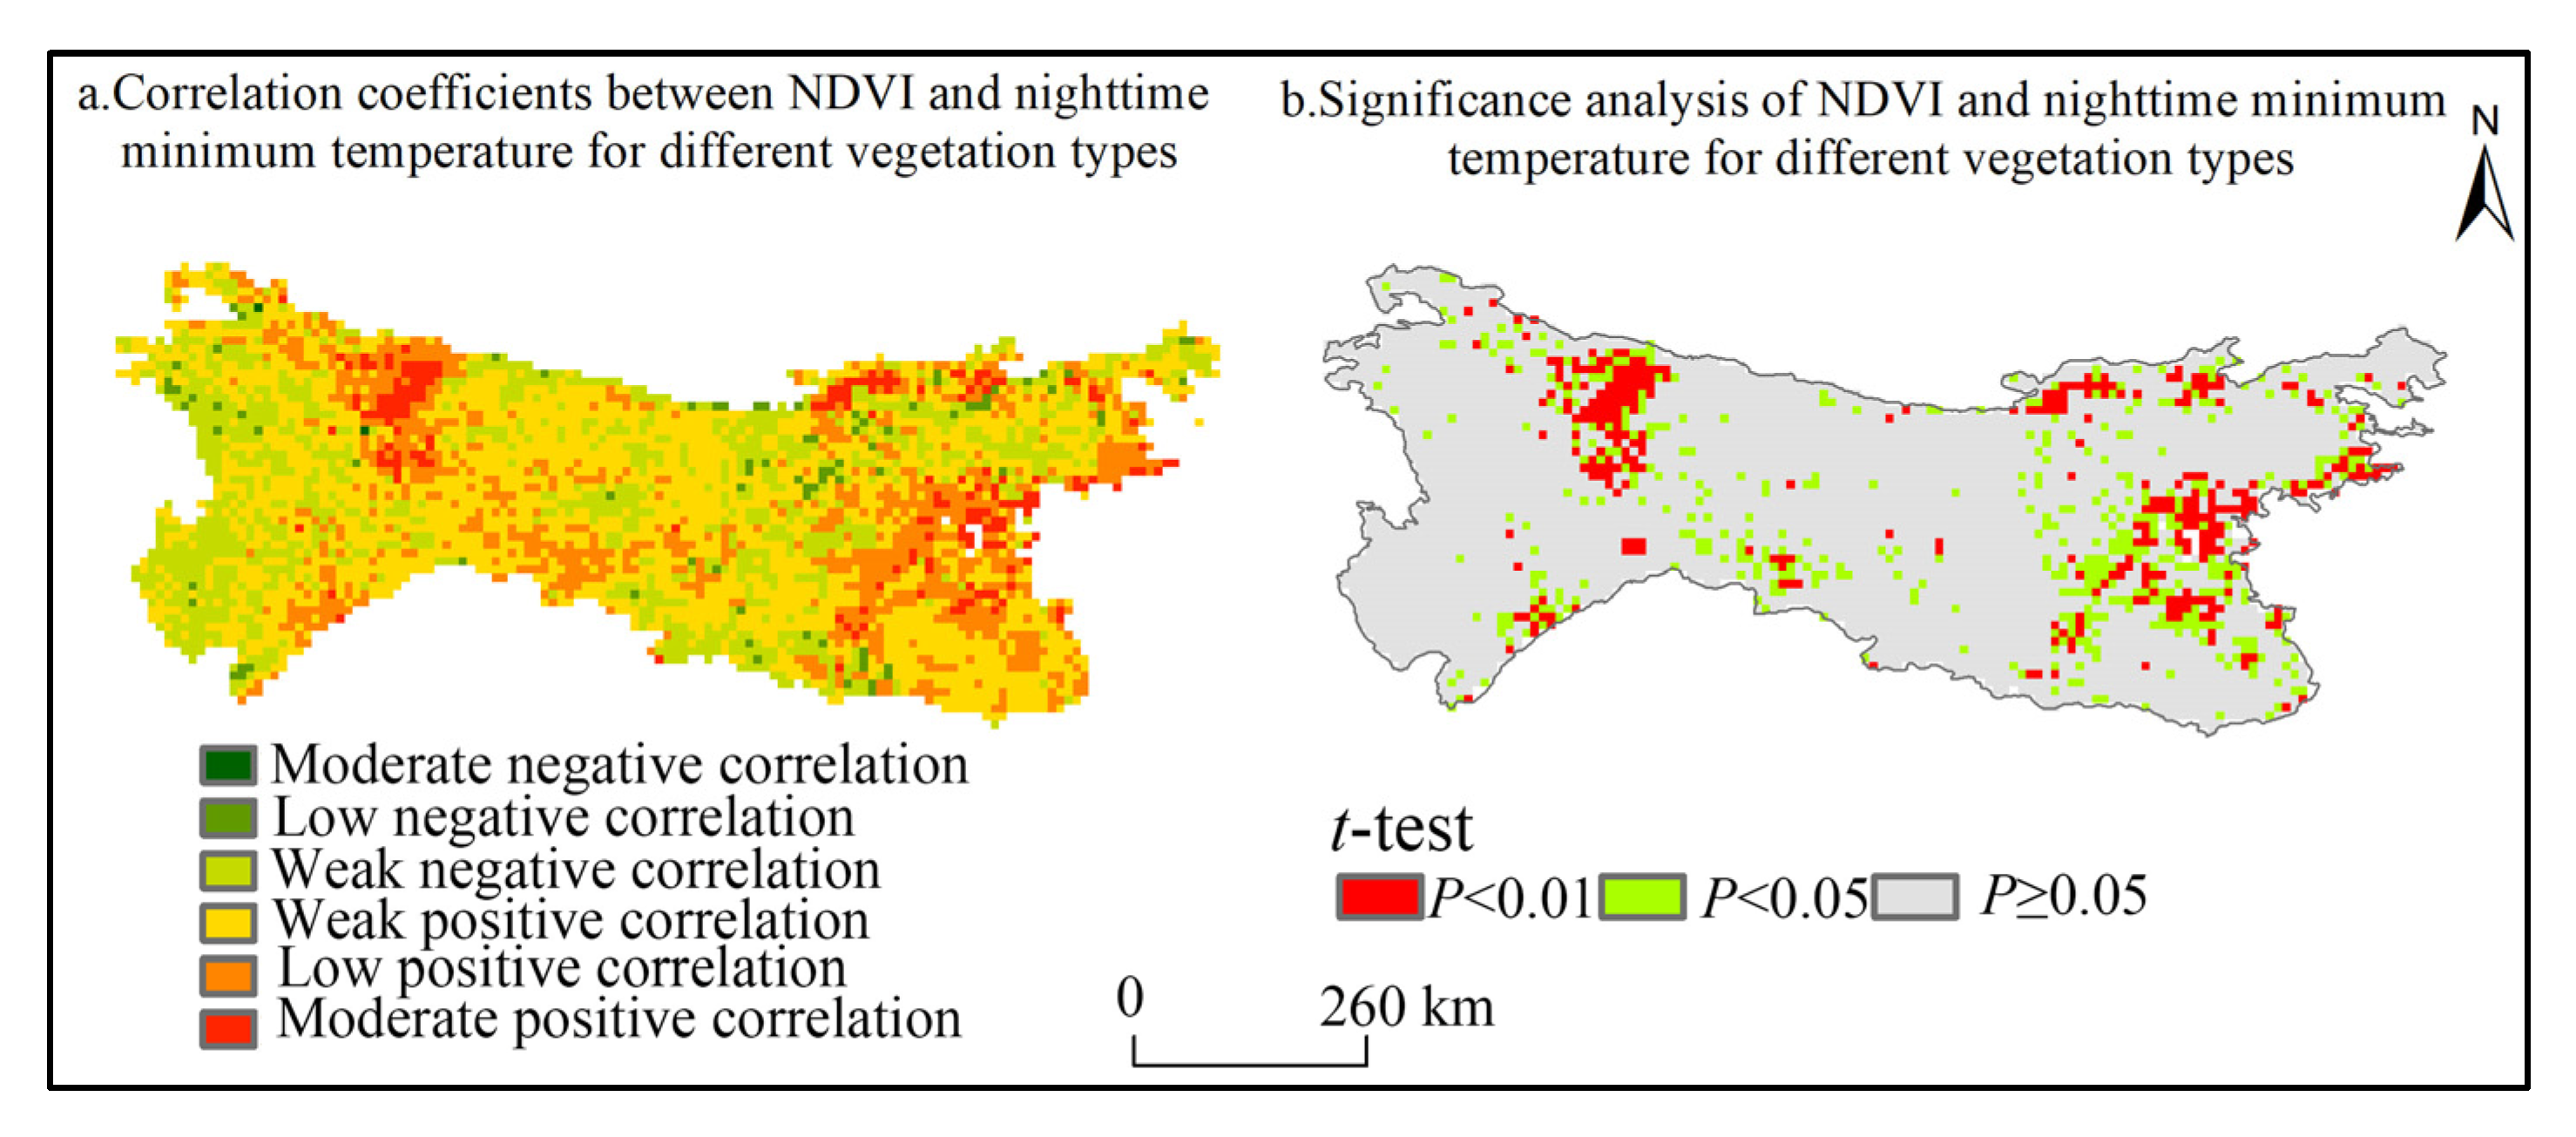
3.3.2. Spatial Response Characteristics of NDVI to Nighttime Minimum Temperatures in Different Vegetation Types
4. Discussion
5. Conclusions
Author Contributions
Funding
Institutional Review Board Statement
Informed Consent Statement
Data Availability Statement
Conflicts of Interest
References
- IPCC. Summary for Policymakers of Climate Change: The Physical Science Basis. In Contribution of Working Group I to the Fourth Assessment Report of the Intergovernmental Panel on Climate Change; Cambridge University Press: Cambridge, UK, 2007. [Google Scholar]
- Yin, Y.H.; Wu, S.H.; Chen, G.; Dai, E.F. Attribution analyses of potential evapotranspiration changes in China since the 1960s. Theor. Appl. Climatol. 2010, 101, 19–28. [Google Scholar] [CrossRef]
- Liu, Q.H.; Liu, L.S.; Zhang, Y.L.; Wang, Z.F.; Wu, J.S.; Li, L.H.; Li, S.C.; Basanta, P. Identification of impact factors for differentiated patterns of NDVI change in the headwater source region of Brahmaputra and Indus, Southwest Tibetan Plateau. Ecol. Indic. 2021, 125, 107–604. [Google Scholar] [CrossRef]
- Li, M.H.; Du, J.K.; Li, W.T.; Li, R.J.; Wu, S.Y.; Wang, S.S. Global vegetation change and its relationship with precipitation and temperature based on GLASS-LAI in 1982–2015. Sci. Geogr. Sin. 2020, 40, 823–832. (In Chinese) [Google Scholar]
- Krishnaswamy, J.; John, R.; Joseph, S. Consistent response of vegetation dynamics to recent climate change in tropical mountain regions. Glob. Chang. Biol. 2013, 20, 203–215. [Google Scholar] [CrossRef] [PubMed]
- Zhou, G.S.; He, Q.J.; Yin, X.J. Adaptability and Vulnerability of Chinese Vegetation/Terrestrial Ecosystems under Climate Change; Meteorology Press: Beijing, China, 2015. (In Chinese) [Google Scholar]
- Del Grosso, S.; Parton, W.; Stohlgren, T.; Zheng, D.; Bachelet, D.; Prince, S.; Hibbard, K.; Olson, R. Global potential net primary production predicted from vegetation class, precipitation, and temperature. Ecology 2008, 89, 2117–2126. [Google Scholar] [CrossRef] [PubMed]
- Baez, S.; Collins, S.L.; Pockman, W.T.; Johnson, J.E.; Small, E.E. Effects of experimental rainfall manipulations on Chihuahuan Desert grassland and shrubland plant communities. Oecologia 2013, 172, 1117–1127. [Google Scholar] [CrossRef]
- Peng, S.; Piao, S.; Ciais, P.; Myneni, R.B.; Chen, A.; Chevallier, F.; Dolman, A.J.; Janssens, I.A.; Peñuelas, J.; Zhang, G.; et al. Asymmetric effects of daytime and night-time warming on Northern Hemisphere vegetation. Nature 2013, 501, 88–92. [Google Scholar] [CrossRef]
- Hoover, D.L.; Knapp, A.K.; Smith, M.D. Resistance and resilience of a grassland ecosystem to climate extremes. Ecology 2014, 95, 2646–2656. [Google Scholar] [CrossRef] [Green Version]
- Fensholt, R.; Sandholt, I.; Rasmussen, M.S. Evaluation of MODIS LAI, fAPAR and the relation between fAPAR and NDVI in a semi-arid environment using in situ measurements. Remote. Sens. Environ. 2004, 91, 490–507. [Google Scholar] [CrossRef]
- Fensholt, R.; Rasmussen, K.; Nielsen, T.T.; Mbow, C. Evaluation of earth observation based long term vegetation trends—intercomparing NDVI time series trend analysis consistency of Sahel from AVHRR GIMMS, Terra MODIS and SPOT VGT data. Remote Sens. Environ. 2009, 113, 1886–1898. [Google Scholar] [CrossRef]
- Fu, B.-J.; Zhang, Q.-J.; Chen, L.-D.; Zhao, W.-W.; Gulinck, H.; Liu, G.-B.; Yang, Q.-K.; Zhu, Y.-G. Temporal change in land use and its relationship to slope degree and soil type in a small catchment on the Loess Plateau of China. Catena 2006, 65, 41–48. [Google Scholar] [CrossRef]
- Emamian, A.; Rashki, A.; Kaskaoutis, D.G.; Gholami, A.; Opp, C.; Middleton, N. Assessing vegetation restoration potential under different land uses and climatic classes in northeast Iran. Ecol. Indic. 2021, 122, 107325. [Google Scholar] [CrossRef]
- Ghebrezgabher, M.G.; Yang, T.; Yang, X.; Sereke, T.E. Assessment of NDVI variations in responses to climate change in the Horn of Africa. Egypt. J. Remote Sens. Space Sci. 2020, 23, 249–261. [Google Scholar] [CrossRef]
- Zhou, L.; Tucker, C.J.; Kaufmann, R.K.; Slayback, D.; Shabanov, N.V.; Myneni, R.B. Variations in Northern Vegetation Activity Inferred from Satellite Data of Vegetation Index during 1981 to 1999. J. Geophys. Res. Atmos. 2001, 106, 20069–20083. [Google Scholar] [CrossRef]
- Zhao, M.S.; Fu, C.B.; Yan, X.D.; Wang, G. Study on the relationship between different ecosystems and climate in China using NOAA/AVHRR data. Acta Geogr. Sin. 2001, 56, 287–296. (In Chinese) [Google Scholar]
- Piao, S.; Fang, J.; Ji, W.; Guo, Q.; Ke, J.; Tao, S. Variation in a satellite-based vegetation index in relation to climate in China. J. Veg. Sci. 2004, 15, 219–226. [Google Scholar] [CrossRef]
- Dana, E.D.; Vivas, S.; Mota, J.F. Urban vegetation of Almería City: A contribution to urban ecology in Spain. Landsc. Urban Plan. 2002, 59, 203–216. [Google Scholar] [CrossRef]
- Jin, K.; Wang, F.; Li, P. Responses of Vegetation Cover to Environmental Change in Large Cities of China. Sustainability 2018, 10, 270. [Google Scholar] [CrossRef] [Green Version]
- Liu, Y.; Li, Y.; Li, S.C.; Motesharrei, S.C. Spatial and Temporal Patterns of Global NDVI Trends: Correlations with Climate and Human Factors. Remote Sens. 2015, 7, 13233–13250. [Google Scholar] [CrossRef] [Green Version]
- Trenberth, K.E.; Fasullo, J.T.; Shepherd, T.G. Attribution of climate extreme events. Nat. Clim. Chang. 2015, 5, 725–730. [Google Scholar] [CrossRef]
- Driouech, F.; ElRhaz, K.; Moufoumaokia, W.; Arjdal, K.; Balhanem, S. Assessing future changes of climate extreme events in the CORDEX-MENA region using regional climate model aladin-climate. Earth Syst. Environ. 2020, 4, 477–492. [Google Scholar] [CrossRef]
- Easterling, D.R.; Horton, B.; Jones, P.D.; Peterson, T.C.; Karl, T.R.; Parker, D.E.; Salinger, M.J.; Razuvayev, V.; Plummer, N.; Jamason, P.; et al. Maximum and minimum temperature trends for the globe. Science 1997, 277, 364–367. [Google Scholar] [CrossRef]
- Vose, R.S.; Easterling, D.R.; Gleason, B. Maximum and minimum temperature trends for the globe: An update through 2004. Geophys. Res. Lett. 2005, 32, L23822. [Google Scholar] [CrossRef] [Green Version]
- Davy, R.; Esau, I.; Chernokulsky, A.; Outten, S.; Zilitinkevich, S. Diurnal asymmetry to the observed global warming. Int. J. Climatol. 2017, 37, 79–93. [Google Scholar] [CrossRef] [Green Version]
- Xu, L.; Myneni, R.B.; Chapinlll, F.S.; Callaghan, T.V.; Pinzon, J.E.; Tucker, C.J.; Zhu, Z.; Bi, J.; Ciais, P.; Tommervik, H.; et al. Temperature and vegetation seasonality diminishment over northern lands. Nat. Clim. Chang. 2013, 3, 581–586. [Google Scholar] [CrossRef] [Green Version]
- Wen, Z.; Wu, S.; Chen, J.; Lü, M. NDVI indicated long-term interannual changes in vegetation activities and their responses to climatic and anthropogenic factors in the Three Gorges Reservoir Region, China. Sci. Total Environ. 2017, 574, 947–959. [Google Scholar] [CrossRef]
- Gao, J.; Jiao, K.; Wu, S.; Ma, D.; Zhao, D.; Yin, Y.; Dai, E. Past and future effects of climate change on spatially heterogeneous vegetation activity in China. Earths Futur. 2017, 5, 679–692. [Google Scholar] [CrossRef]
- Tucker, C.J.; Pinzon, J.E.; Brown, M.E.; Slayback, D.A.; Pak, E.W.; Mahoney, R.; Vermote, E.F.; El Saleous, N. An extended AVHRR 8-km NDVI dataset compatible with MODIS and SPOT vegetation NDVI data. Int. J. Remote Sens. 2005, 26, 4485–4498. [Google Scholar] [CrossRef]
- Fensholt, R.; Proud, S.R. Evaluation of Earth Observation based global long term vegetation trends—Comparing GIMMS and MODIS global NDVI time series. Remote. Sens. Environ. 2012, 119, 131–147. [Google Scholar] [CrossRef]
- Fu, G.; Zhang, H.R.; Sun, W. Response of plant production to growing/non-growing season asymmetric warming in an alpine meadow of the Northern Tibetan Plateau. Sci. Total Environ. 2018, 650, 2666–2673. [Google Scholar] [CrossRef]
- Jiang, S.; Wei, G.; Zhang, Z.; Wang, Y.; Xu, M.; Wang, Q.; Das, P.; Liu, B. Detecting the Dynamics of Urban Growth in Africa Using DMSP/OLS Nighttime Light Data. Land 2020, 10, 13. [Google Scholar] [CrossRef]
- Piao, S.; Yin, G.; Tan, J.; Cheng, L.; Huang, M.; Li, Y.; Liu, R.; Mao, J.; Myneni, R.B.; Peng, S.; et al. Detection and attribution of vegetation greening trend in China over the last 30 years. Glob. Chang. Biol. 2015, 21, 1601–1609. [Google Scholar] [CrossRef]
- Zhao, J.; Du, Z.Q.; Wu, Z.T.; Zhang, H.; Guo, N.; Ma, Z.T.; Liu, X.J. Seasonal variations of day- and nighttime warming and their effects on vegetation dynamics in China’s temperate zone. Acta Geogarphica Sin. 2018, 73, 395–404. (In Chinese) [Google Scholar]
- Rossi, S.; Isabel, N. Bud break responds more strongly to daytime than night-time temperature under asymmetric experimental warming. Glob. Chang. Biol. 2017, 23, 446–454. [Google Scholar] [CrossRef] [Green Version]
- Zhao, J.; Liu, X.J.; Du, Z.Q.; Wu, Z.T.; Xu, X.M. Effects of the asymmetric diurnal-warming on vegetation dynamics in Xinjiang. China Environ. Sci. 2017, 37, 2316–2321. (In Chinese) [Google Scholar]
- Liu, J.; Wen, Z.M.; Gang, C.C. Normalized difference vegetation index of different vegetation cover types and its responses to climate change in the Loess Plateau. Acta Ecol. Sin. 2020, 40, 678–691. [Google Scholar]
- Fick, S.E.; Hijmans, R.J. WorldClim 2: New 1-km spatial resolution climate surfaces for global land areas. Int. J. Climatol. 2017, 37, 4302–4315. [Google Scholar] [CrossRef]
- Guo, B.; Zhang, J.; Meng, X.; Xu, T.; Song, Y. Long-term spatio-temporal precipitation variations in China with precipitation surface interpolated by ANUSPLIN. Sci. Rep. 2020, 10, 81. [Google Scholar] [CrossRef] [Green Version]
- Wen, H.Y.; Chen, F.J.; Li, J.; Qiu, K.J.; Wang, G. A study on spatial interpolation of temperature in Anhui Province based on ANUSPLIN. Meteorol. Environ. Res. 2019, 10, 51–60. [Google Scholar]
- Jia, Y.; Cui, P. Contrastive analysis of temperature interpolation at different time scales in the Alpine Region by Anusplin. Plateau Meteorol. 2018, 37, 757–766. [Google Scholar]
- Cleophas, T.J.; Zwinderman, A.H. Partial Correlations. In Regression Analysis in Medical Research; Springer International Publishing: Berlin/Heidelberg, Germany, 2018. [Google Scholar]
- de la Fuente, A.; Bing, N.; Hoeschele, I.; Mendes, P. Discovery of meaningful associations in genomic data using partial correlation coefficients. Bioinformatics 2004, 20, 3565–3574. [Google Scholar] [CrossRef] [PubMed] [Green Version]
- Niu, Y.S.; Hao, N.; Zhang, H.H. Interaction screening by partial correlation. Stat. Its Interface 2018, 11, 317–325. [Google Scholar] [CrossRef]
- Holben, B.N. Characteristics of maximum-value composite images from temporal AVHRR data. Int. J. Remote Sens. 1986, 7, 1417–1434. [Google Scholar] [CrossRef]
- Huang, C.; Yang, Q.; Guo, Y.; Zhang, Y.; Guo, L. The pattern, change and driven factors of vegetation cover in the Qin Mountains region. Sci. Rep. 2020, 10, 2059. [Google Scholar] [CrossRef] [PubMed]
- Hijmans, R.J.; Cameron, S.E.; Parra, J.L.; Jones, P.G.; Jarvis, A. Very high resolution interpolated climate surfaces for global land areas. Int. J. Climatol. A J. R. Meteorol. Soc. 2005, 25, 1965–1978. [Google Scholar] [CrossRef]
- Hutchinson, M.F. Interpolating mean rainfall using thin plate smoothing splines. Int. J. Geogr. Inf. Sci. 1995, 9, 385–403. [Google Scholar] [CrossRef]
- Hutchinson, M.; Xu, T.B. Anusplin version 4.4 user guide. In Canberra: Fenner School of Environment and Society; Australian National University: Canberra, Australia, 2013; pp. 1–52. [Google Scholar]
- Lu, F.Z.; Lu, H.Y. A high-resolution grid dataset of air temperature and precipitation for Qinling-Daba Mountains in central China and its implications for regional climate. Acta Geogr. Sin. 2019, 74, 875–888. (In Chinese) [Google Scholar]
- Ma, L.Q.; Qin, F.; Sun, J.L.; Wang, H.; Xia, H.M. Diurnal asymmetry of temperature and its effect on NDVI in Loess Plateau. Resour. Sci. 2018, 40, 1684–1692. (In Chinese) [Google Scholar]
- Zhang, X.D.; Zhu, W.B.; Cui, Y.P.; Zhang, J.J.; Zhu, L.Q. The response of forest dynamics to hydro-thermal change in Funiu Mountain. Geogr. Res. 2016, 35, 1029–1040. (In Chinese) [Google Scholar]
- Xia, H.; Li, A.; Feng, G.; Li, Y.; Qin, Y.; Lei, G.; Cui, Y. The Effects of Asymmetric Diurnal Warming on Vegetation Growth of the Tibetan Plateau over the Past Three Decades. Sustainability 2018, 10, 1103. [Google Scholar] [CrossRef]
- He, Z.-S.; He, W.-M. Asymmetric climate warming does not benefit plant invaders more than natives. Sci. Total Environ. 2020, 742, 140624. [Google Scholar] [CrossRef]
- Wan, S.; Xia, J.; Liu, W. Photosynthetic overcompensation under nocturnal warming enhances grassland carbon sequestration. Ecology 2009, 90, 2700–2710. [Google Scholar] [CrossRef] [Green Version]
- Turnbull, M.H.; Murthy, R.; Griffin, K.L. The relative impacts of daytime and night-time warming on photosynthetic capacity in Populus deltoides. Plant Cell Environ. 2002, 25, 1729–1737. [Google Scholar] [CrossRef] [Green Version]
- Nicholls, N. Increased Australian wheat yield due to recent climate trends. Nature 1997, 387, 484–485. [Google Scholar] [CrossRef]
- Todisco, F.; Vergni, L. Climatic changes in Central Italy and their potential effects on corn water consumption. Agric. For. Meteorol. 2007, 148, 1–11. [Google Scholar] [CrossRef]
- Yang, Z.; Jiang, L.; Su, F.; Zhang, Q.; Xia, J.; Wan, S. Nighttime warming enhances drought resistance of plant communities in a temperate steppe. Sci. Rep. 2016, 6, 23267. [Google Scholar] [CrossRef]
- Peng, S.; Huang, J.; Sheehy, J.E.; Laza, R.C.; Visperas, R.M.; Zhong, X.; Centeno, G.S.; Khush, G.S.; Cassman, K.G. Rice yields decline with higher night temperature from global warming. Proc. Natl. Acad. Sci. USA 2004, 101, 9971–9975. [Google Scholar] [CrossRef] [Green Version]
- Alward, R.D.; Detling, J.K.; Milchunas, D.G. Grassland Vegetation Changes and Nocturnal Global Warming. Science 1999, 283, 229–231. [Google Scholar] [CrossRef] [Green Version]
- Tan, K.Y.; Fang, S.B.; Ren, S.X. Asymmetric trends of daily maximum and minimum temperature in global warming and its effects on agriculture ecosystems. J. Appl. Meteorol. Sci. 2009, 20, 634–641. [Google Scholar]
- Welch, J.R.; Vincent, J.R.; Auffhammer, M.; Moya, P.F.; Dobermann, A.; Dawe, D. Rice yields in tropical/subtropical Asia exhibit large but opposing sensitivities to minimum and maximum temperatures. Proc. Natl. Acad. Sci. USA 2010, 107, 14562–14567. [Google Scholar] [CrossRef] [Green Version]
- Morita, S.; Yonemaru, J.-I.; Takanashi, J.-I. Grain Growth and Endosperm Cell Size Under High Night Temperatures in Rice (Oryza sativa L.). Ann. Bot. 2005, 95, 695–701. [Google Scholar] [CrossRef]
- Zhang, B.P.; Yao, Y.H.; Mo, S.G.; Tan, Y. Digital spectra of altitudinal belts and their hierarchical system. J. Mt. Sci. 2002, 20, 660–665. [Google Scholar]
- Zhang, G.; Zhang, Y.; Dong, J.; Xiao, X. Green-up dates in the Tibetan Plateau have continuously advanced from 1982 to 2011. Proc. Natl. Acad. Sci. USA 2013, 110, 4309–4314. [Google Scholar] [CrossRef] [PubMed] [Green Version]
- Sun, Q.; Li, B.; Zhou, G.; Jiang, Y.; Yuan, Y. Delayed autumn leaf senescence date prolongs the growing season length of herbaceous plants on the Qinghai–Tibetan Plateau. Agric. For. Meteorol. 2020, 284, 107896. [Google Scholar] [CrossRef]

| Vegetation Type | Tmax | Tmin |
|---|---|---|
| Grass | 0.182 | 0.323 |
| Scrub | 0.156 | 0.776 ** |
| Deciduous broad-leaved forest | - | - |
| Evergreen deciduous broad-leaved mixed forest | 0.414 | −0.136 |
| Evergreen broad-leaved forest | 0.168 | −0.003 |
| Coniferous forest | 0.146 | 0.843 ** |
| Crops | −0.145 ** | 0.175 ** |
| Correlation Coefficient Grade | Grass | Scrub | Deciduous Broad-Leaved Forest | Evergreen Deciduous Broad-Leaved Mixed Forest | Evergreen Broad-Leaved Forest | Coniferous Forest | Crops | ||||||||
|---|---|---|---|---|---|---|---|---|---|---|---|---|---|---|---|
| Number | % | Number | % | Number | % | Number | % | Number | % | Number | % | Number | % | ||
| Moderately positive correlation | Tmax | - | - | 20 | 12.2 | 6 | 7.5 | 87 | 9.30 | 103 | 11.55 | 15 | 3.10 | 98 | 9.21 |
| p < 0.01 | - | - | 20 | 100 | 6 | 87 | 100 | 103 | 100 | 15 | 100 | 98 | 100 | ||
| p < 0.05 | - | - | - | - | - | - | - | - | - | - | - | - | |||
| Low positive correlation | Tmax | 35 | 10.61 | 54 | 32.93 | 19 | 23.75 | 335 | 35.83 | 314 | 35.20 | 107 | 22.11 | 234 | 21.99 |
| p < 0.01 | - | - | 3 | 5.56 | - | - | 63 | 18.81 | 34 | 10.83 | 8 | 7.48 | 38 | 16.24 | |
| p < 0.05 | - | - | 31 | 57.41 | 11 | 57.89 | 163 | 48.66 | 163 | 51.91 | 55 | 51.40 | 121 | 51.71 | |
| Weak positive correlation | Tmax | 226 | 68.48 | 79 | 48.17 | 44 | 55.00 | 468 | 50.05 | 432 | 48.43 | 304 | 62.81 | 512 | 48.12 |
| p < 0.01 | 3 | 1.33 | - | - | - | - | - | - | - | - | - | - | - | - | |
| p < 0.05 | 16 | 7.08 | - | - | - | - | - | - | - | - | - | - | - | - | |
| Weak negative correlation | Tmax | 69 | 20.91 | 11 | 6.70 | 11 | 13.75 | 44 | 4.71 | 43 | 4.82 | 58 | 11.98 | 209 | 19.64 |
| p < 0.01 | - | - | - | - | - | - | - | - | - | - | - | - | - | ||
| p < 0.05 | - | - | - | - | - | - | - | - | - | - | - | - | - | ||
| Low negative correlation | Tmax | - | - | - | - | - | 1 | 0.11 | - | - | - | - | 11 | 1.03 | |
| p < 0.01 | - | - | - | - | - | - | - | - | - | - | - | 1 | 9.09 | ||
| p < 0.05 | - | - | - | - | - | - | - | - | - | - | - | 1 | 9.09 | ||
| Moderately negative correlation | Tmax | - | - | - | - | - | - | - | - | - | - | - | - | - | |
| p < 0.01 | - | - | - | - | - | - | - | - | - | - | - | - | - | ||
| p < 0.05 | - | - | - | - | - | - | - | - | - | - | - | - | - | ||
| Total | 330 | 100 | 164 | 100 | 80 | 100 | 935 | 100 | 892 | 100 | 484 | 1064 | |||
| Correlation Coefficient Grade | Grass | Scrub | Deciduous Broad-Leaved Forest | Evergreen Deciduous Broad-Leaved Mixed Forest | Evergreen Broad-Leaved Forest | Coniferous Forest | Crops | ||||||||
|---|---|---|---|---|---|---|---|---|---|---|---|---|---|---|---|
| Number | % | Number | % | Number | % | Number | % | Number | % | Number | % | Number | % | ||
| Moderately positive correlation | Tmin | 2 | 0.61 | 6 | 3.66 | 5 | 6.25 | 39 | 4.17 | 12 | 1.34 | 8 | 1.65 | 103 | 9.68 |
| p < 0.01 | 2 | 1 | 6 | 100 | 5 | 100 | 3 | 7.69 | 12 | 100 | - | - | 103 | 100 | |
| p < 0.05 | - | - | - | - | - | - | 6 | 15.38 | - | - | - | - | - | - | |
| Low positive correlation | Tmin | 39 | 11.82 | 41 | 25 | 18 | 22.5 | 202 | 21.60 | 195 | 21.86 | 40 | 8.26 | 300 | 28.20 |
| p < 0.01 | 6 | 15.38 | 6 | 14.63 | 2 | 11.11 | 24 | 11.88 | 11 | 5.64 | 4 | 10.00 | 57 | 19.00 | |
| p < 0.05 | 13 | 33.33 | 23 | 56.10 | 9 | 50 | 15 | 7.43 | 95 | 48.72 | 2 | 5.00 | 144 | 48.00 | |
| Weak positive correlation | Tmin | 155 | 46.97 | 81 | 49.39 | 39 | 48.75 | 461 | 49.30 | 479 | 53.70 | 218 | 45.04 | 421 | 39.57 |
| p < 0.01 | - | - | - | - | - | - | 26 | 5.64 | - | - | 4 | 1.83 | - | - | |
| p < 0.05 | - | - | - | - | - | - | 40 | 8.68 | - | - | 11 | 5.05 | - | - | |
| Weak negative correlation | Tmin | 130 | 39.39 | 31 | 18.90 | 16 | 20 | 215 | 22.99 | 188 | 21.08 | 206 | 42.56 | 216 | 20.30 |
| p < 0.01 | - | - | - | - | - | - | 19 | 8.84 | - | - | 5 | 2.43 | - | - | |
| p < 0.05 | - | - | - | - | - | - | 41 | 19.07 | - | - | 14 | 6.80 | - | - | |
| Low negative correlation | Tmin | 3 | 0.91 | 5 | 3.05 | 2 | 2.5 | 18 | 1.93 | 18 | 2.92 | 12 | 2.48 | 23 | 2.16 |
| p < 0.01 | - | - | 3 | 60.00 | - | - | - | - | 1 | 5.56 | - | - | 2 | 8.70 | |
| p < 0.05 | 1 | 33.33 | - | - | - | - | - | - | 4 | 22.22 | - | - | 1 | 4.35 | |
| Moderately negative correlation | Tmin | 1 | 0.30 | - | - | - | - | - | - | - | - | - | - | 1 | 0.09 |
| p < 0.01 | 1 | 1 | - | - | - | - | - | - | - | - | - | - | 1 | 100 | |
| p < 0.05 | - | - | - | - | - | - | - | - | - | - | - | - | - | - | |
| Total | 330 | 100 | 164 | 100 | 80 | 100 | 935 | 100 | 892 | 100 | 484 | 100 | 1064 | 100 | |
Disclaimer/Publisher’s Note: The statements, opinions and data contained in all publications are solely those of the individual author(s) and contributor(s) and not of MDPI and/or the editor(s). MDPI and/or the editor(s) disclaim responsibility for any injury to people or property resulting from any ideas, methods, instructions or products referred to in the content. |
© 2022 by the authors. Licensee MDPI, Basel, Switzerland. This article is an open access article distributed under the terms and conditions of the Creative Commons Attribution (CC BY) license (https://creativecommons.org/licenses/by/4.0/).
Share and Cite
Li, L.; Zhu, L.; Xu, N.; Liang, Y.; Zhang, Z.; Liu, J.; Li, X. Climate Change and Diurnal Warming: Impacts on the Growth of Different Vegetation Types in the North–South Transition Zone of China. Land 2023, 12, 13. https://doi.org/10.3390/land12010013
Li L, Zhu L, Xu N, Liang Y, Zhang Z, Liu J, Li X. Climate Change and Diurnal Warming: Impacts on the Growth of Different Vegetation Types in the North–South Transition Zone of China. Land. 2023; 12(1):13. https://doi.org/10.3390/land12010013
Chicago/Turabian StyleLi, Li, Lianqi Zhu, Nan Xu, Ying Liang, Zhengyu Zhang, Junjie Liu, and Xin Li. 2023. "Climate Change and Diurnal Warming: Impacts on the Growth of Different Vegetation Types in the North–South Transition Zone of China" Land 12, no. 1: 13. https://doi.org/10.3390/land12010013