Article

Ecological Environment Dynamic Monitoring and Driving Force Analysis of Karst World Heritage Sites Based on Remote-Sensing: A Case Study of Shibing Karst

1
School of Karst Science, Guizhou Normal University, Guiyang 550001, China
2
State Engineering Technology Institute for Karst Desertification Control, Guiyang 550001, China
*
Authors to whom correspondence should be addressed.
Land 2023, 12(1), 184; https://doi.org/10.3390/land12010184
Submission received: 17 November 2022 / Revised: 20 December 2022 / Accepted: 4 January 2023 / Published: 6 January 2023

Abstract

:
The evaluation and monitoring of the ecological environment quality of heritage sites can help provide sustainable and healthy development strategies for heritage management organizations. In this study, an ecological evaluation model based on the remote sensing ecological index (RSEI) was used to measure the ecological environment of the Shibing Karst World Heritage Site and its buffer zone and the Moran index and geographic probe model were combined to quantify the ecological environment. The results show that, (1) from 2013 to 2020, the ecological environment quality of the heritage site and buffer zone was moderate to high and the mean RSEI values in the three periods studied were 0.720, 0.723 and 0.742, showing an overall upward and improving trend; (2) ecological environment quality grades of moderate and good accounted for more than 70% of the area, the distribution pattern of ecological environment quality is significantly better at the heritage site than in the buffer zone and the southwest is better than the northeast; (3) the Moran index increased from 0.600 in 2013 to 0.661 in 2020, residing in the first and third quadrants, respectively, with significantly spatial aggregation; and (4) greenness and humidity were shown to play a positive feedback role on the ecological environment quality and the spatial influence ability of humidity and dryness was greater. Overall, the RSEI is an effective method of evaluating and monitoring the ecological environment quality of heritage sites, the ecological environment quality of the Karst heritage site in Shibing is in a steady state of improvement and the relevant departments of heritage conservation need to further coordinate the relationship between conservation and development to promote the sustainable development of the heritage site and provide effective solutions for the monitoring of other Karst World Heritage sites.

1. Introduction

To protect the common natural and cultural heritage of mankind, UNESCO adopted the Convention Concerning the Protection of the World Culture and Natural Heritage at its 17th General Conference, held at its headquarters in Paris, in November 1972 and initiated the organization of the World Heritage Organization in 1976 [1]. World Heritage refers to cultural and natural heritage with outstanding value that is a precious treasure of nature and a symbol of human history, culture and civilization, representing the most valuable cultural and natural landscapes and the common wealth of mankind [2]. In many countries around the world, World Heritage Sites have been considered representatives of national culture and even as symbols of the country [3,4]; however, in recent years, World Natural Heritage Sites (WNHs) have suffered extensive damage due to earthquakes, tsunamis, soil erosion, human activities, etc. [5,6]. To date, 17 World Natural Heritage (WNH) properties have been inscribed on the List of World Heritage in Danger.
Karst is one of the most remarkable landscapes in the world, mainly consisting of special topography and associated ecosystems developed on carbonate rocks, characterized by vadose flows, caves, dark rivers, canyons, depressions and conical and towering peaks [7]. China is one of the countries with the most extensive karst distribution in the world, with 1.25 million km2 of carbonate rock outcrops [8] accounting for 13% of the total land area of China. The “South China Karst” is a series of heritage sites, the first phase of which consists of three constituent sites: Shilin Karst (Yunnan), Libo Karst (Guizhou) and Wulong Karst (Chongqing), which were inscribed on the World Heritage List in 2007 for meeting World Heritage criteria (vii) and (viii) [9]. The second phase of heritage sites consists of Guilin Karst (Guangxi), Shibing Karst (Guizhou) and Jinfo Mountain Karst (Chongqing), which were inscribed on the World Heritage List in 2014 for meeting World Heritage criteria (vii) and (viii). As karst areas are characterized by soil vulnerability, hydrological vulnerability, vegetation vulnerability and human vulnerability [10], it is necessary to monitor them regularly and to protect the sustainability of karst WNHs.
To protect World Heritage properties, the World Heritage Centre developed a program of periodic monitoring reports, conservation status reports, etc., in the 1970s to investigate and track the health of natural World Heritage properties [11]. Monitoring is the process of collecting information, analyzing data [12] and subsequently using the information to assess the status, threat factors and severity of resources [13]. Current research applications to monitor ecological quality through integrated survey data by remote sensing [14], PSR models [15], urbanization factors [16] and natural succession of the landscape [17] are also common. However, in the process of monitoring heritage sites, it is important to consider human and financial constraints and to choose an appropriate strategy. With the development of remote sensing science, multi-source remote sensing technology is frequently applied in the monitoring of WNHs [18], especially the combination of GIS and remote sensing technology, which enables researchers and managers of heritage sites to effectively and reliably monitor the ecological environment quality [19,20]. Currently, one method for measuring ecological quality is single-factor change analysis, including analysis of land use change [21,22], NPP [23] and eco-efficiency change [24], as well as other factor changes closely related to the ecological environment. Another method is integrated multi-factor change analysis, which is more comprehensive and accurate compared with single-factor analysis, and scholars have proposed various evaluation index systems for this purpose [25,26]. Xu Hanqiu et al. [27] proposed a pure remote sensing-driven Remote Sensing based Ecological Index (RSEI) to reflect the ecological status comprehensively, which was normalized and subjected to principal component analysis from four aspects: greenness NDVI, heat LST, humidity WET and dryness NDISI, to achieve remote sensing ecological status evaluation. Subsequently, several scholars have conducted practical studies in areas such as Bayinbrook WNHs and Karajun-Kurdening WNHs in Xinjiang, China [28]. Although this method has been successfully applied in different regions, no remote sensing ecological evaluation study on karst WNHs have been conducted.
As a typical representative of dolomite karst landscapes, this study uses Landsat remote sensing images as the data source, explores the characteristics of ecological environment quality changes in the heritage site by constructing a RSEI model and using principal component analysis, Moran index [29] and geographic probe, further analyzes the driving factors of its ecological environment changes and provides a reference basis for the ecological environmental protection and sustainable development of karst heritage sites.

2. Materials and Methods
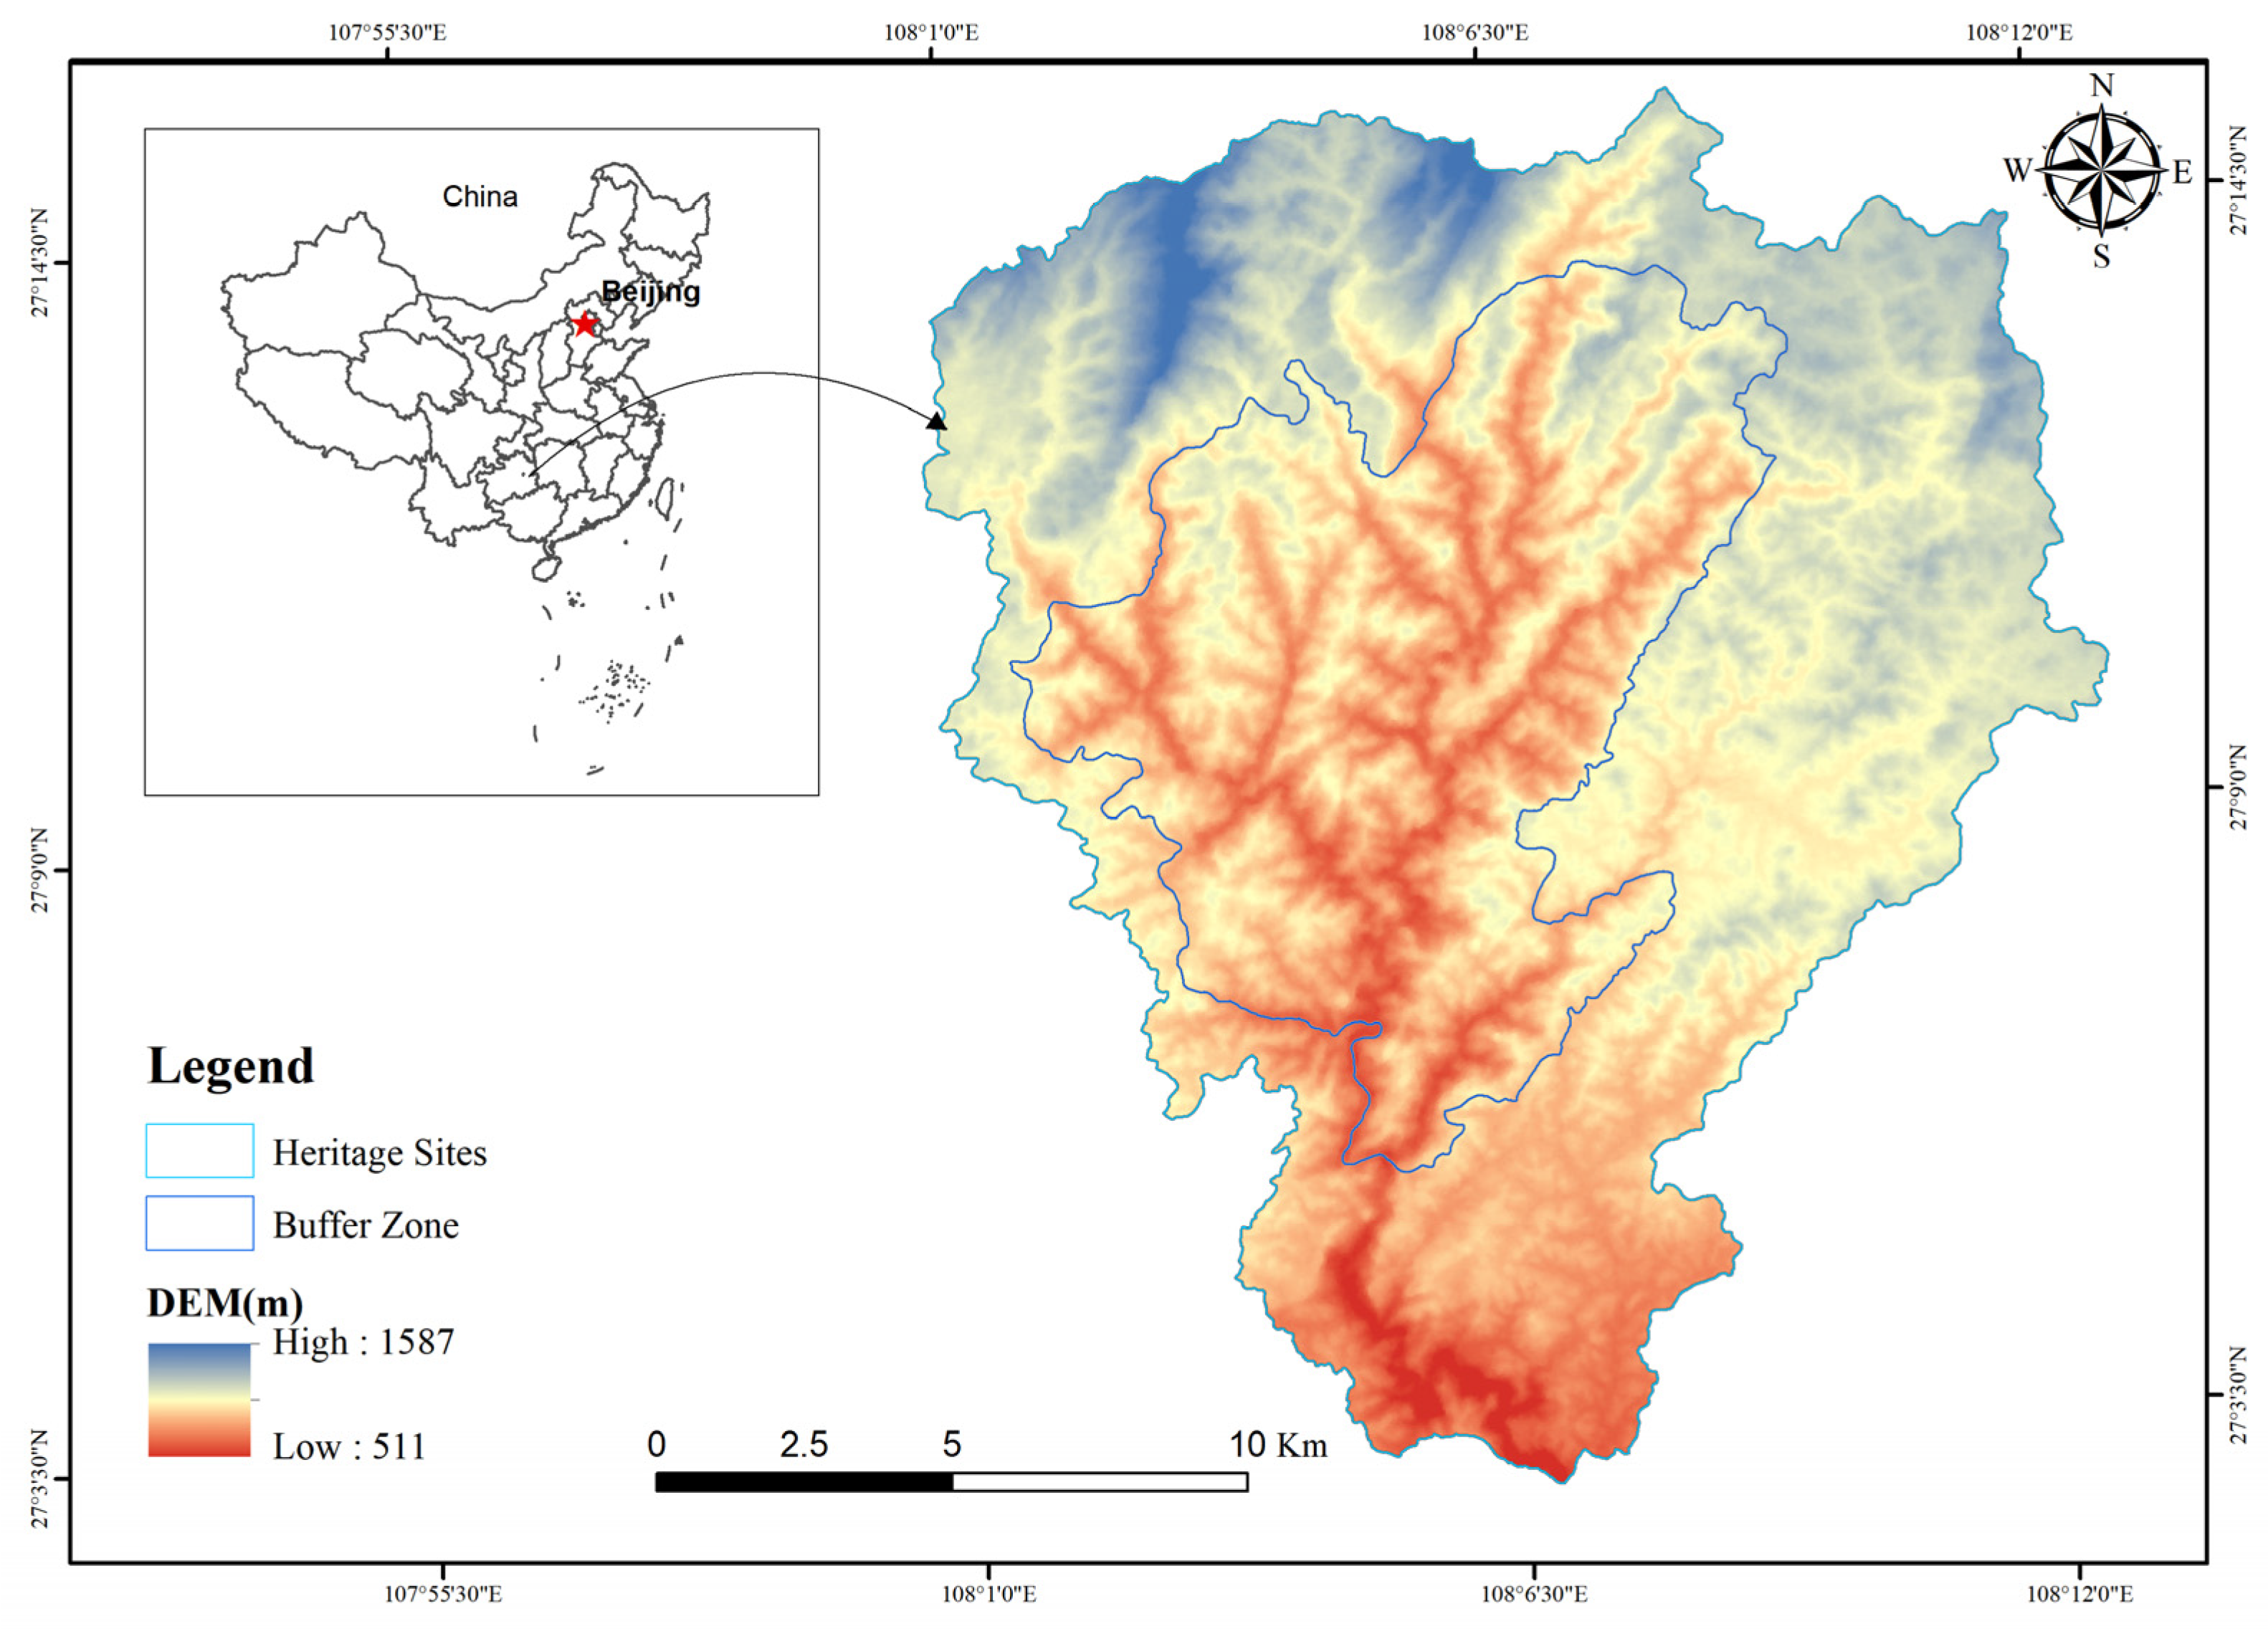
2.1. Study Area

Shibing Karst WNHs is located at 108°01′36″–108°10′52″ E, 27°13′56″–27°04′51″ N in Shibing County, Guizhou Province. The average elevation is 912 m (ranging from 600 to 1250 m). It is located on the slope of the overlap between the mountains of Qianzhong and the hills of western Hunan (Figure 1). It has a typical and complete dolomite karst landscape, which is deeply cut by rivers and has a surface form of crested canyons and crested valleys. The heritage site represents continental tropical–subtropical dolomite karst geological evolution and bio-ecological processes and is an ideal place and natural test site for the study of dolomite karst forest vegetation.

2.2. Data Source and Pre-Processing

The image data used for this study were Landsat 8 OLI remote sensing images of the Shibing Karst WNHs from 2013 to 2020, which are available through the USGS (https://earthexplorer.usgs.gov/; last accessed on 12 October 2022) and Geospatial Data Cloud (http://www.gscloud.cn/; last accessed on 12 October 2022). The image data are available for free. The acquired images were all in the third quarter of the year and cloud-free in the study area and the image quality was good. The data are preprocessed with radiometric calibration, atmospheric correction, geometric correction, image mosaic, image alignment, etc.

2.3. Methodology

2.3.1. Ecological Indicators Extracted

RSEI is a new ecological index that uses multi-source remote sensing data and integrates several natural factors as the main driving factors to monitor and evaluate the ecological environment quality of a certain area, which has the characteristics of short cycle time and wide application when compared with the code EI index and complements the EI index well. The index couples four quantifiable indexes, namely, greenness, humidity, dryness and heat, and is constructed using a principal component analysis (PCA), which can quickly evaluate the ecological environment quality for a certain study area.
Greenness. The Normalized Difference Vegetation Index (NDVI) is one of the best indicators of healthy vegetation growth, vegetation distribution and vegetation density distribution and has the following formula [30,31]:
N D V I = ρ 4 ρ 3 ρ 4 + ρ 3
Humidity. The wetness component of the tasseled cap transformation (WET) component reflects the moisture content of water bodies, soil and vegetation and is mainly obtained from the remote sensing tassel cap transformation.
W E T O L T = 0.1511 ρ 1 + 0.1973 ρ 2 + 0.3283 ρ 3 + 0.3407 ρ 4 0.7117 ρ 5 0.4559 ρ 6
Dryness. The degree of soil drying is an important factor that affects the ecological environment and is positively related to it [32]. However, in practice, the presence of certain building sites in the area is also an important factor affecting the ecological environment. Therefore, the Normalized Difference Imperviousness and Soil Index (NDISI) is synthesized using both the bare soil index (SI) and the Impervious Built-up Index (IBI).
N D I S I = S I + I B I 2
S I = ( ρ 3 + ρ 5 ) ( ρ 1 + ρ 4 ) ( ρ 3 + ρ 5 ) + ( ρ 1 + ρ 4 )
I B I = 2 ρ 5 / ( ρ 5 + ρ 4 ) [ ρ 4 / ( ρ 4 + ρ 3 ) + ρ 2 / ( ρ 2 + ρ 5 ) ] 2 ρ 5 / ( ρ 5 + ρ 4 ) + [ ρ 4 / ( ρ 4 + ρ 3 ) + ρ 2 / ( ρ 2 + ρ 5 ) ]
Heat. Land surface temperatures (LST) were calculated using the Landsat user manual model [33] and the surface temperature was chosen to represent the heat index.
L ρ = [ ε P ( T s ) + ( 1 ε ) L ] τ + L
P ( T s ) = L ρ L τ ( 1 ε ) L τ ε
T s = K 2 L n [ K 1 / P ( T S ) + 1 ]
In the equation, Lρ is the thermal infrared radiance brightness value; ε is the surface-specific emissivity; Ts is the real surface temperature; and k is the calibration parameter.
Construction of RSEI. The above four indicators were standardized in order to facilitate comparisons under the same system and the standardization formula was as follows:
N I i = ( I i I min ) ( I max I min )
where NIi is the index value after the normalization of an image element; Ii is the DN value of the index at an image element i; Imax is the maximum value of the index; and Imin is the minimum value of the index.
The four standardized images were then synthesized and the four indicators were coupled using principal component analysis (PCA), a multidimensional data compression technique that selects a few important variables via the orthogonal linear transformation of multiple variables that has the advantages of integrating the weights of each indicator, avoiding human determination and automatically and objectively determining each indicator based on the nature of the data themselves and the contribution of each indicator to each principal component. The following equation was used for the initial RSEI calculation:
R S E I = 1 P C A [ f ( N D V I , W E T , N D B S I , L S T ) ]
Similarly, the calculated RSEI values were standardized to obtain the final RSEI.

2.3.2. Exploratory Spatial Data Analysis

The first law of geography states that the correlation between features is related to distance and, in general, the closer the distance, the greater the correlation between features; the farther the distance, the greater the dissimilarity between features [34]; therefore, the law of spatial correlation is often used in spatiotemporal evolution studies [35] and the global Moran’s I index is used to express the global spatial autocorrelation.
I = i = 1 n i = 1 n ω i j ( x i x ¯ ) ( x j x ¯ ) S 2 i = 1 n j = 1 n ω i j
S 2 = 1 n ( x i x ¯ ) 2
where I is the global Moran’s I index with a value range of (−1, 1), I < 0 indicates a negative correlation and I > 0 indicates a positive correlation; ωij is the weighting coefficient; and Xi and Xj are the remotely sensed ecological indices at i and j in the study area, respectively.
Local spatial autocorrelation in terms of local Moran’s I index:
I i = ( x i x ¯ ) s 2 j ω i j ( x j x ¯ )

2.3.3. Geographical Detector

A geographic detector is a statistical method that detects spatial differentiation and reveal the driving forces behind it. It is mainly used to analyze the interaction between multiple factors [36] and the analysis of spatial differences in regional variables, such as changes in spatial patterns. A model consists of four main detectors: the divergence and factor detector, interaction, risk and ecological detector.
Divergence and factor detection. This is mainly used to detect the spatial heterogeneity of the attributes and the ability of the drivers to explain the RSEI attributes.
q = 1 1 N σ 2 h = 1 L N h σ h 2
where q is the explanatory power of an influencing factor on RSEI, which takes values in the range [0, 1]—the larger the value, the stronger the explanatory power; h is the sub-region of the image factor; L is the number of grades and classifications of RSEI and the influence factor; Nh and N are the numbers of units in different grades of the region and the whole region, respectively; σ h 2 and σ 2 is the variance of RSEI in different grades of the region and the whole region.
Risk Area Detection. This is mainly used to determine whether there is a significant difference in the mean values of attributes between two sub-regions using the t-statistic test.
t y ¯ h = 1 y ¯ h = 2 = Y ¯ h = 1 Y ¯ h = 2 [ V a r ( Y ¯ h = 1 ) n h = 1 + V a r ( Y ¯ h = 2 ) n h = 2 ] 1 / 2
where Y ¯ h = i denotes the mean value of the attributes in subregion h, n h denotes the number of samples in subregion h and Var indicates the variance. If H 0 is rejected at the confidence level, there is a significant difference in the mean values of the attributes between the two sub-regions.

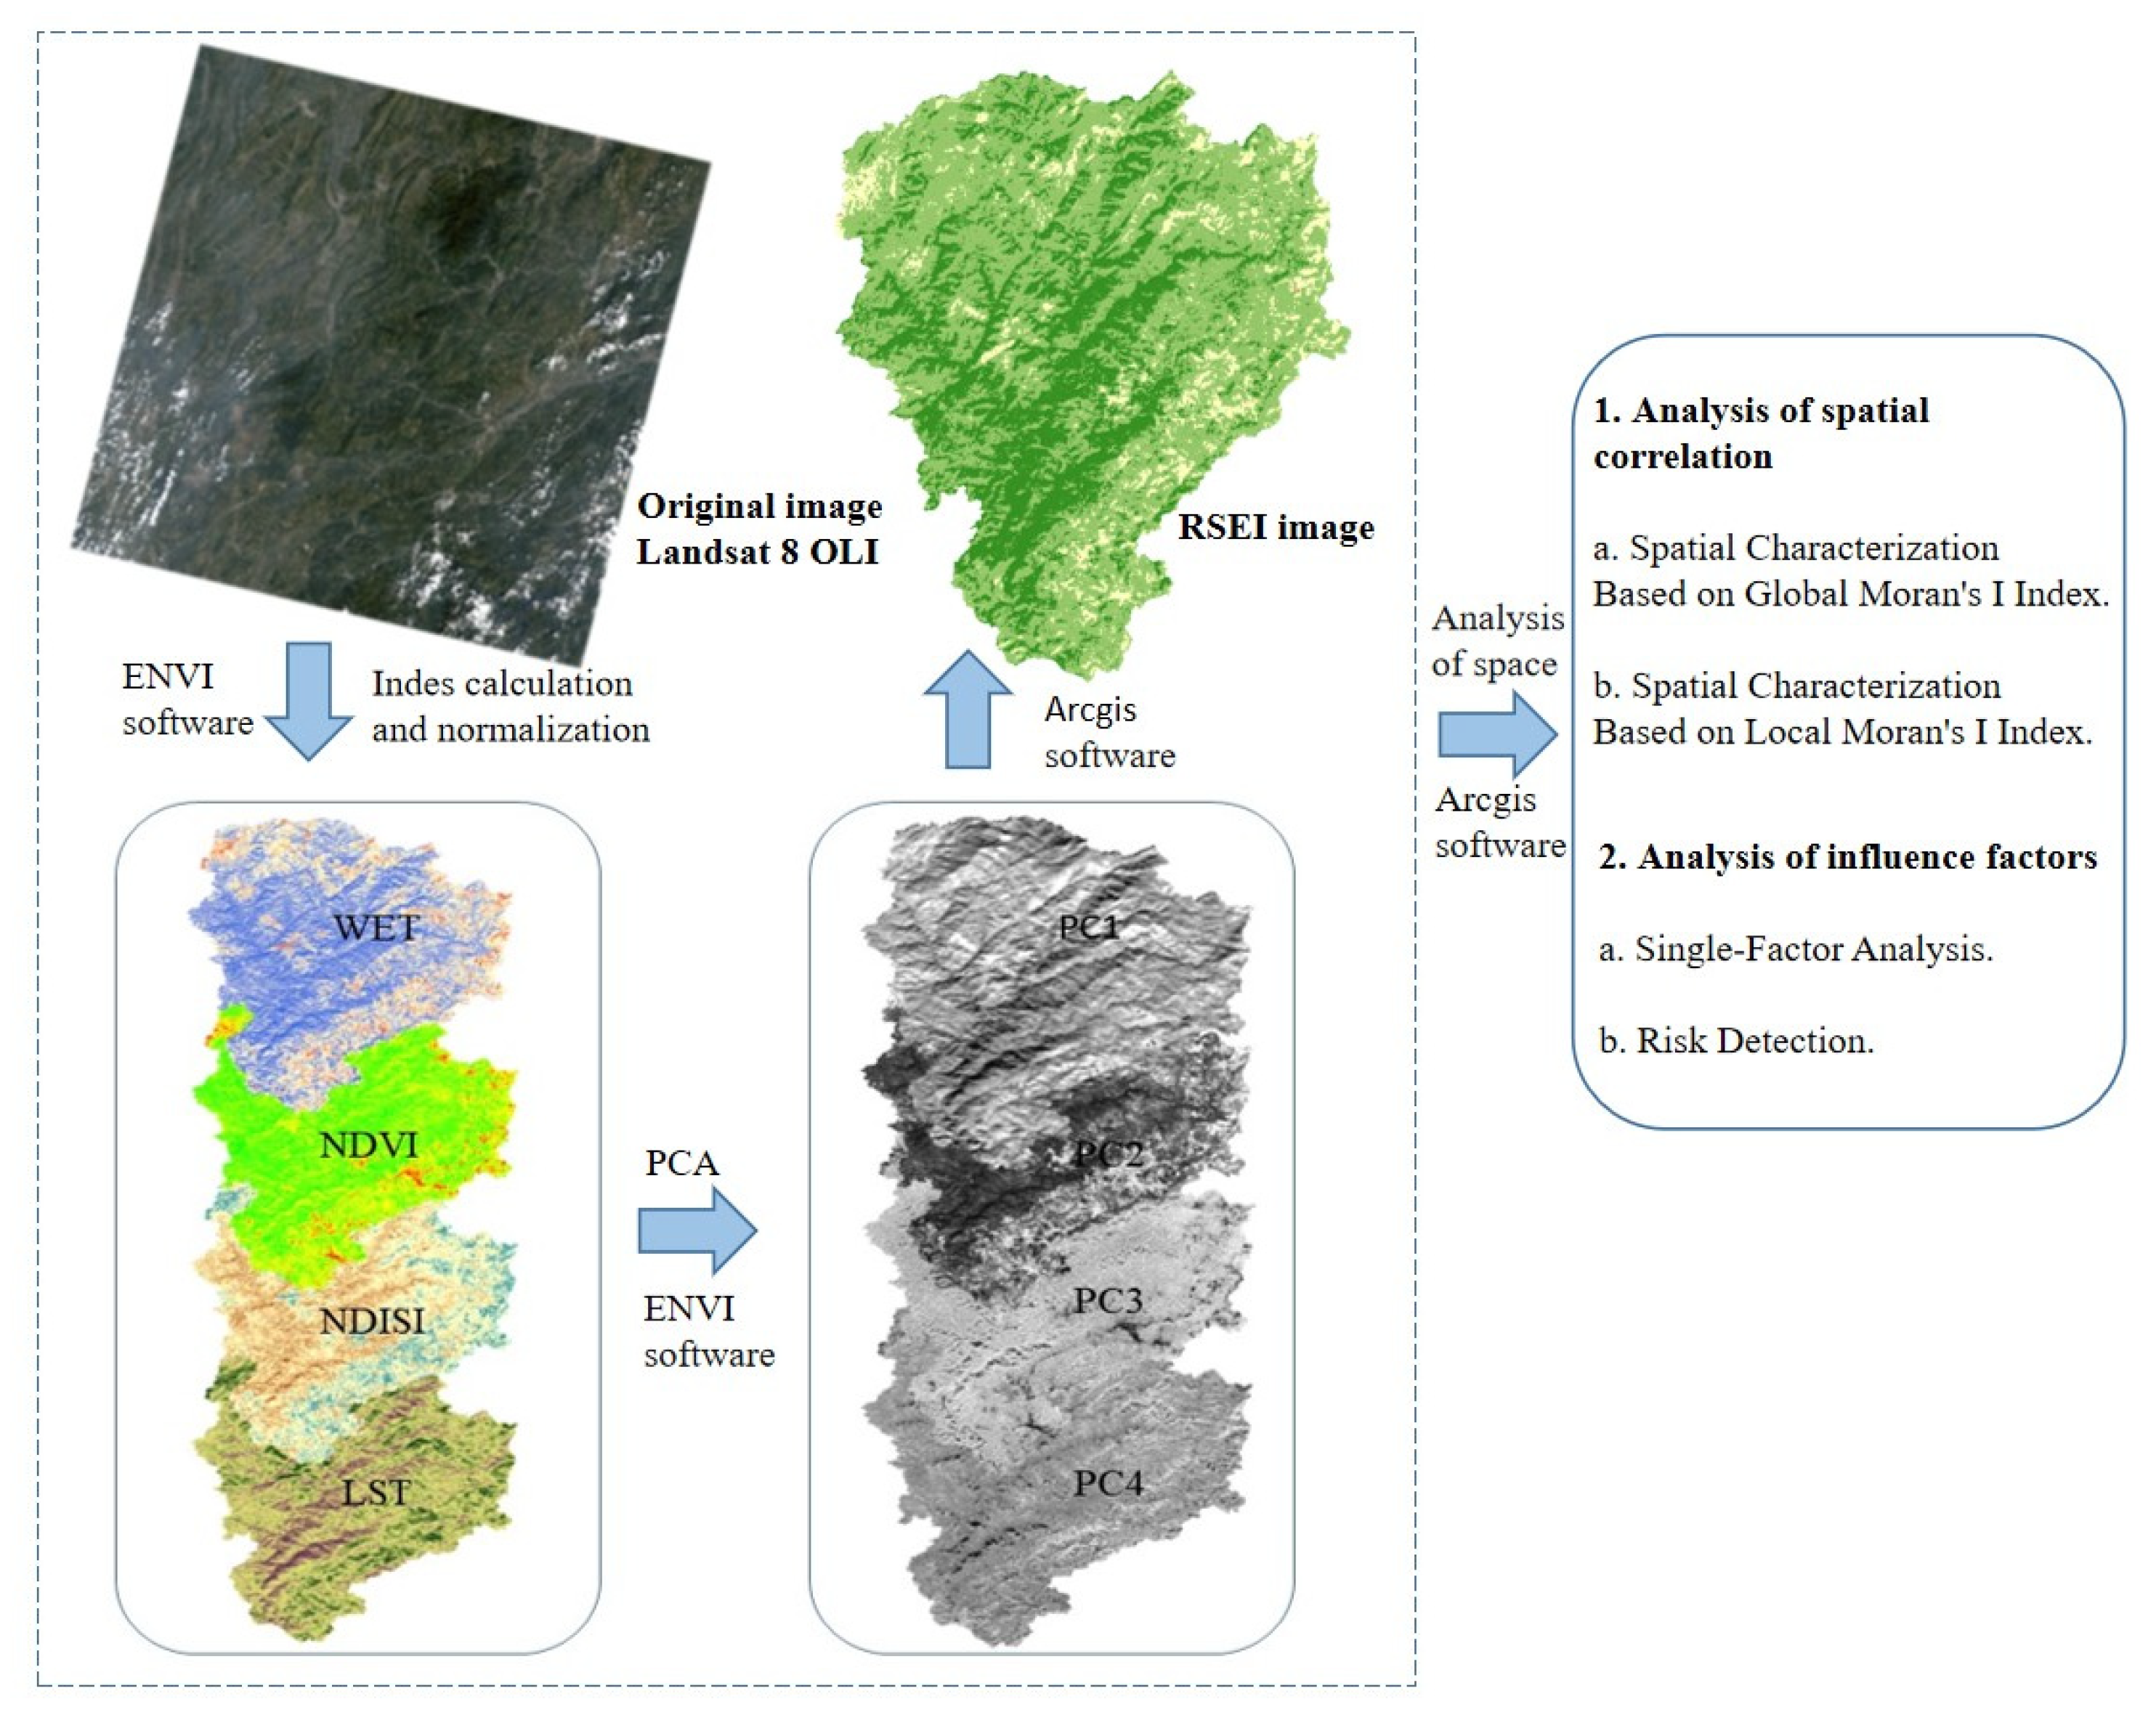
2.3.4. Processing Flow

A flow chart of the ecological environment dynamic monitoring and driver analysis is shown in Figure 2.

3. Results

3.1. Characteristics of the Ecological Environment

In a principal component analysis, the principal component is a linear combination of individual indicators and the weights of the indicators are the eigenvectors. These indicate the contribution of each indicator to the principal component and determine the actual significance of the principal component. The four normalized indicators were analyzed using the principal component analysis module in ENVI. The eigenvalues and contribution rates of the principal components were obtained to demonstrate the applicability of RSEI in karst heritage sites (Table 1). The results showed that PC1 had the largest eigenvalues among the four PCs in the study years, with a proportion of 80–87%, indicating that PC1 collected the most information on the variability of the four indicators compared to PC2, PC3 and PC4. Therefore, all four indicator variables are represented by PC1.
Table 2 provides the mean values of RSEI, which range from 0.720 to 0.742 (corresponding to level 4). This indicates that the overall ecological quality of Shibing karst improved during the study period. The mean values of the four indicators during the study period are also provided. Over all four study years, WET, which contributed the most to PC1, increased by 18.8%, from 0.753 to 0.895 and NDVI increased by 0.056 (7.2%). Of the other two indicators, NDISI decreased by 60.7% and LST increased by 7.5%. The increases in NDVI and WET and the decreases in NDISI and LST can be offset by an increase in RSEI by 3.1% over the study period. Together, the four indicators of RSEI produce a quantitative signal of response to ecological stressors. The strength of RSEI lies not only in its ability to provide a specific area final score but also in its interpretation of the scores of four indicators representing specific spatial characteristics of ecological states. Thus, as an ecological quality evaluation indicator, RSEI is more comprehensive than other individual indicators.

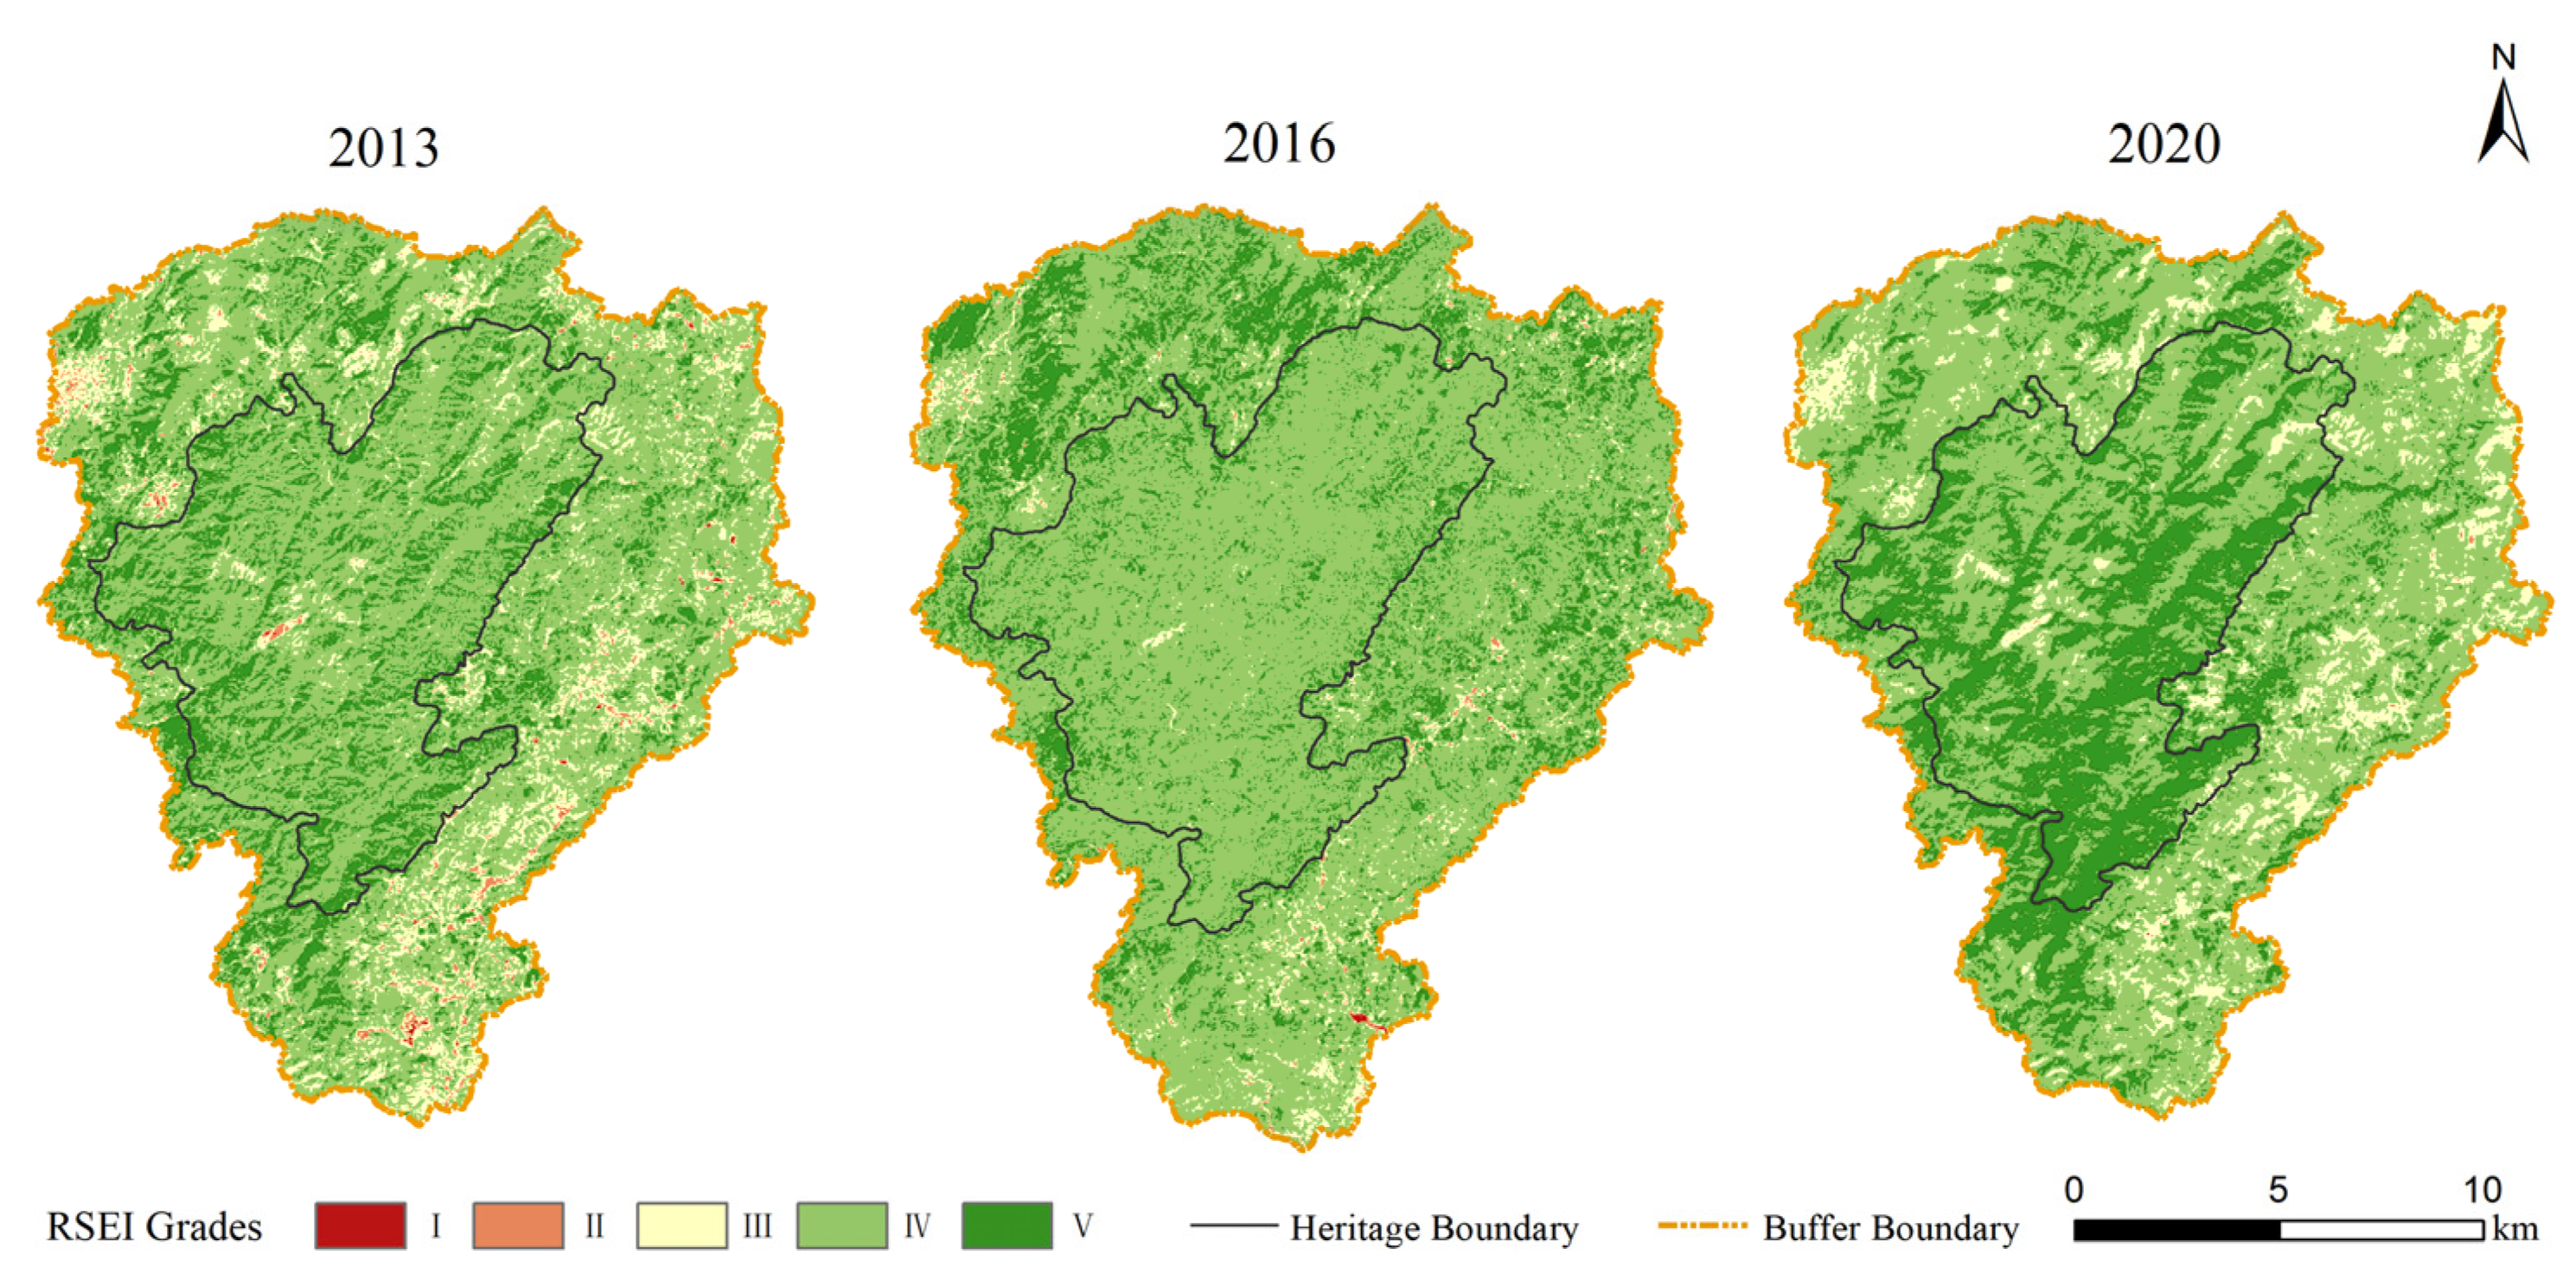
3.2. Analysis of Spatial and Temporal Variation in RSEI

In order to more accurately reflect the characteristics of ecological environment quality changes at the Shibing Karst WNHs, the RSEI was divided into five levels of parity, with Level 1 0–0.2 (very poor), Level 2 0.2–0.4 (poor), Level 3 0.4–0.6 (moderate), Level 4 0.6–0.8 (good) and Level 5 0.8–1 (excellent). In the RSEI grade images of the study years (Figure 3), the changes in the ecological environment quality of the Shibing Karst WNHs from 2013 before the inscription to 2020 after the inscription are comprehensively illustrated. The red patches representing areas with poor to very poor ecological conditions are mainly concentrated in the southern part of the buffer zone, near the urban area of Shibing County, and have been developed intensively. The green patches, ranging from good to excellent, are widely distributed over the site, which is dominated by dolomite karst with good forest and shrub cover. The overall greening trend indicates that the ecological condition within the site is very good, while the eastern and southern areas of the buffer zone near the urban area need to be improved.
The area of each ecological status class was calculated and the data are shown in Figure 4. The area of the five areas in 2013 was 0.167 km2, 3.124 km2, 30.012 km2, 189.774 km2 and 60.222 km2, respectively. From 2013 to 2020, the fifth level increased to 84.861 km2 and the first, second, third and fourth levels decreased to 0.002 km2, 0.0981 km2, 23.076 km2 and 175.262 km2, respectively. The area of the region with poor and worse RSEI levels decreases period by period and the regional transition mainly occurs between adjacent layers, which is manifested as a transition from lower to higher levels. The main transition types are level 1 to level 2, level 2 to level 3, level 3 to level 4 and level 4 to level 5.
We counted the area of the three RSEI grades. Combined with Table 3, the area of good and excellent regions in the third RSEI classification of the Shibing Karst WNHs increased from 88.24% in 2013 to 91.82% in 2020, indicating that the overall ecological environment quality within the site is good. The area of the medium region decreased from 10.6% in 2013 to 8% in 2020, indicating that the medium region is more stable. The areas with poor and worse RSEI grades decreased period by period, from 1.15% in 2013 to 0.04% in 2020 and the degree of decrease was more obvious.
As can be seen from Table 4, from 2013 to 2020, 37 km2 of the Shibing Karst WNHs were converted from good to excellent, accounting for 13.23% of the total area. The area of excellent turned to poor is 0% and the area of good and medium turned to poor is less than 0.1%. In general, the ecological environment quality of Shibing Karst WNHs is in a better state after its inscription.
To further indicate the spatial and temporal changes in the ecological environmental quality of the heritage site, this paper analyzes the changes in RSEI values between 2013 and 2020 (Figure 5) and divides the results into five conversion levels: significantly lower, slightly lower, basically unchanged, slightly higher and significantly higher, for a comprehensive analysis of the data of the three phases of the Shibing Karst WNHs. It can be seen that, from 2013 to 2016, the ecological environment quality within the heritage site basically remained unchanged. Between 2016 and 2020, the ecological environment quality of the heritage site significantly improved and the parts that showed a decreased index were almost all within the buffer zone. Through on-site investigations and by understanding the relevant local areas, we found that both the buffer zone and the heritage site were developing tourism during this period and human activities were more obvious, which caused damage to the ecological environment in the buffer zone. In general, the ecological environment quality of the heritage site and buffer zone is improving and only in the buffer zone are there scattered areas with a decreasing trend.

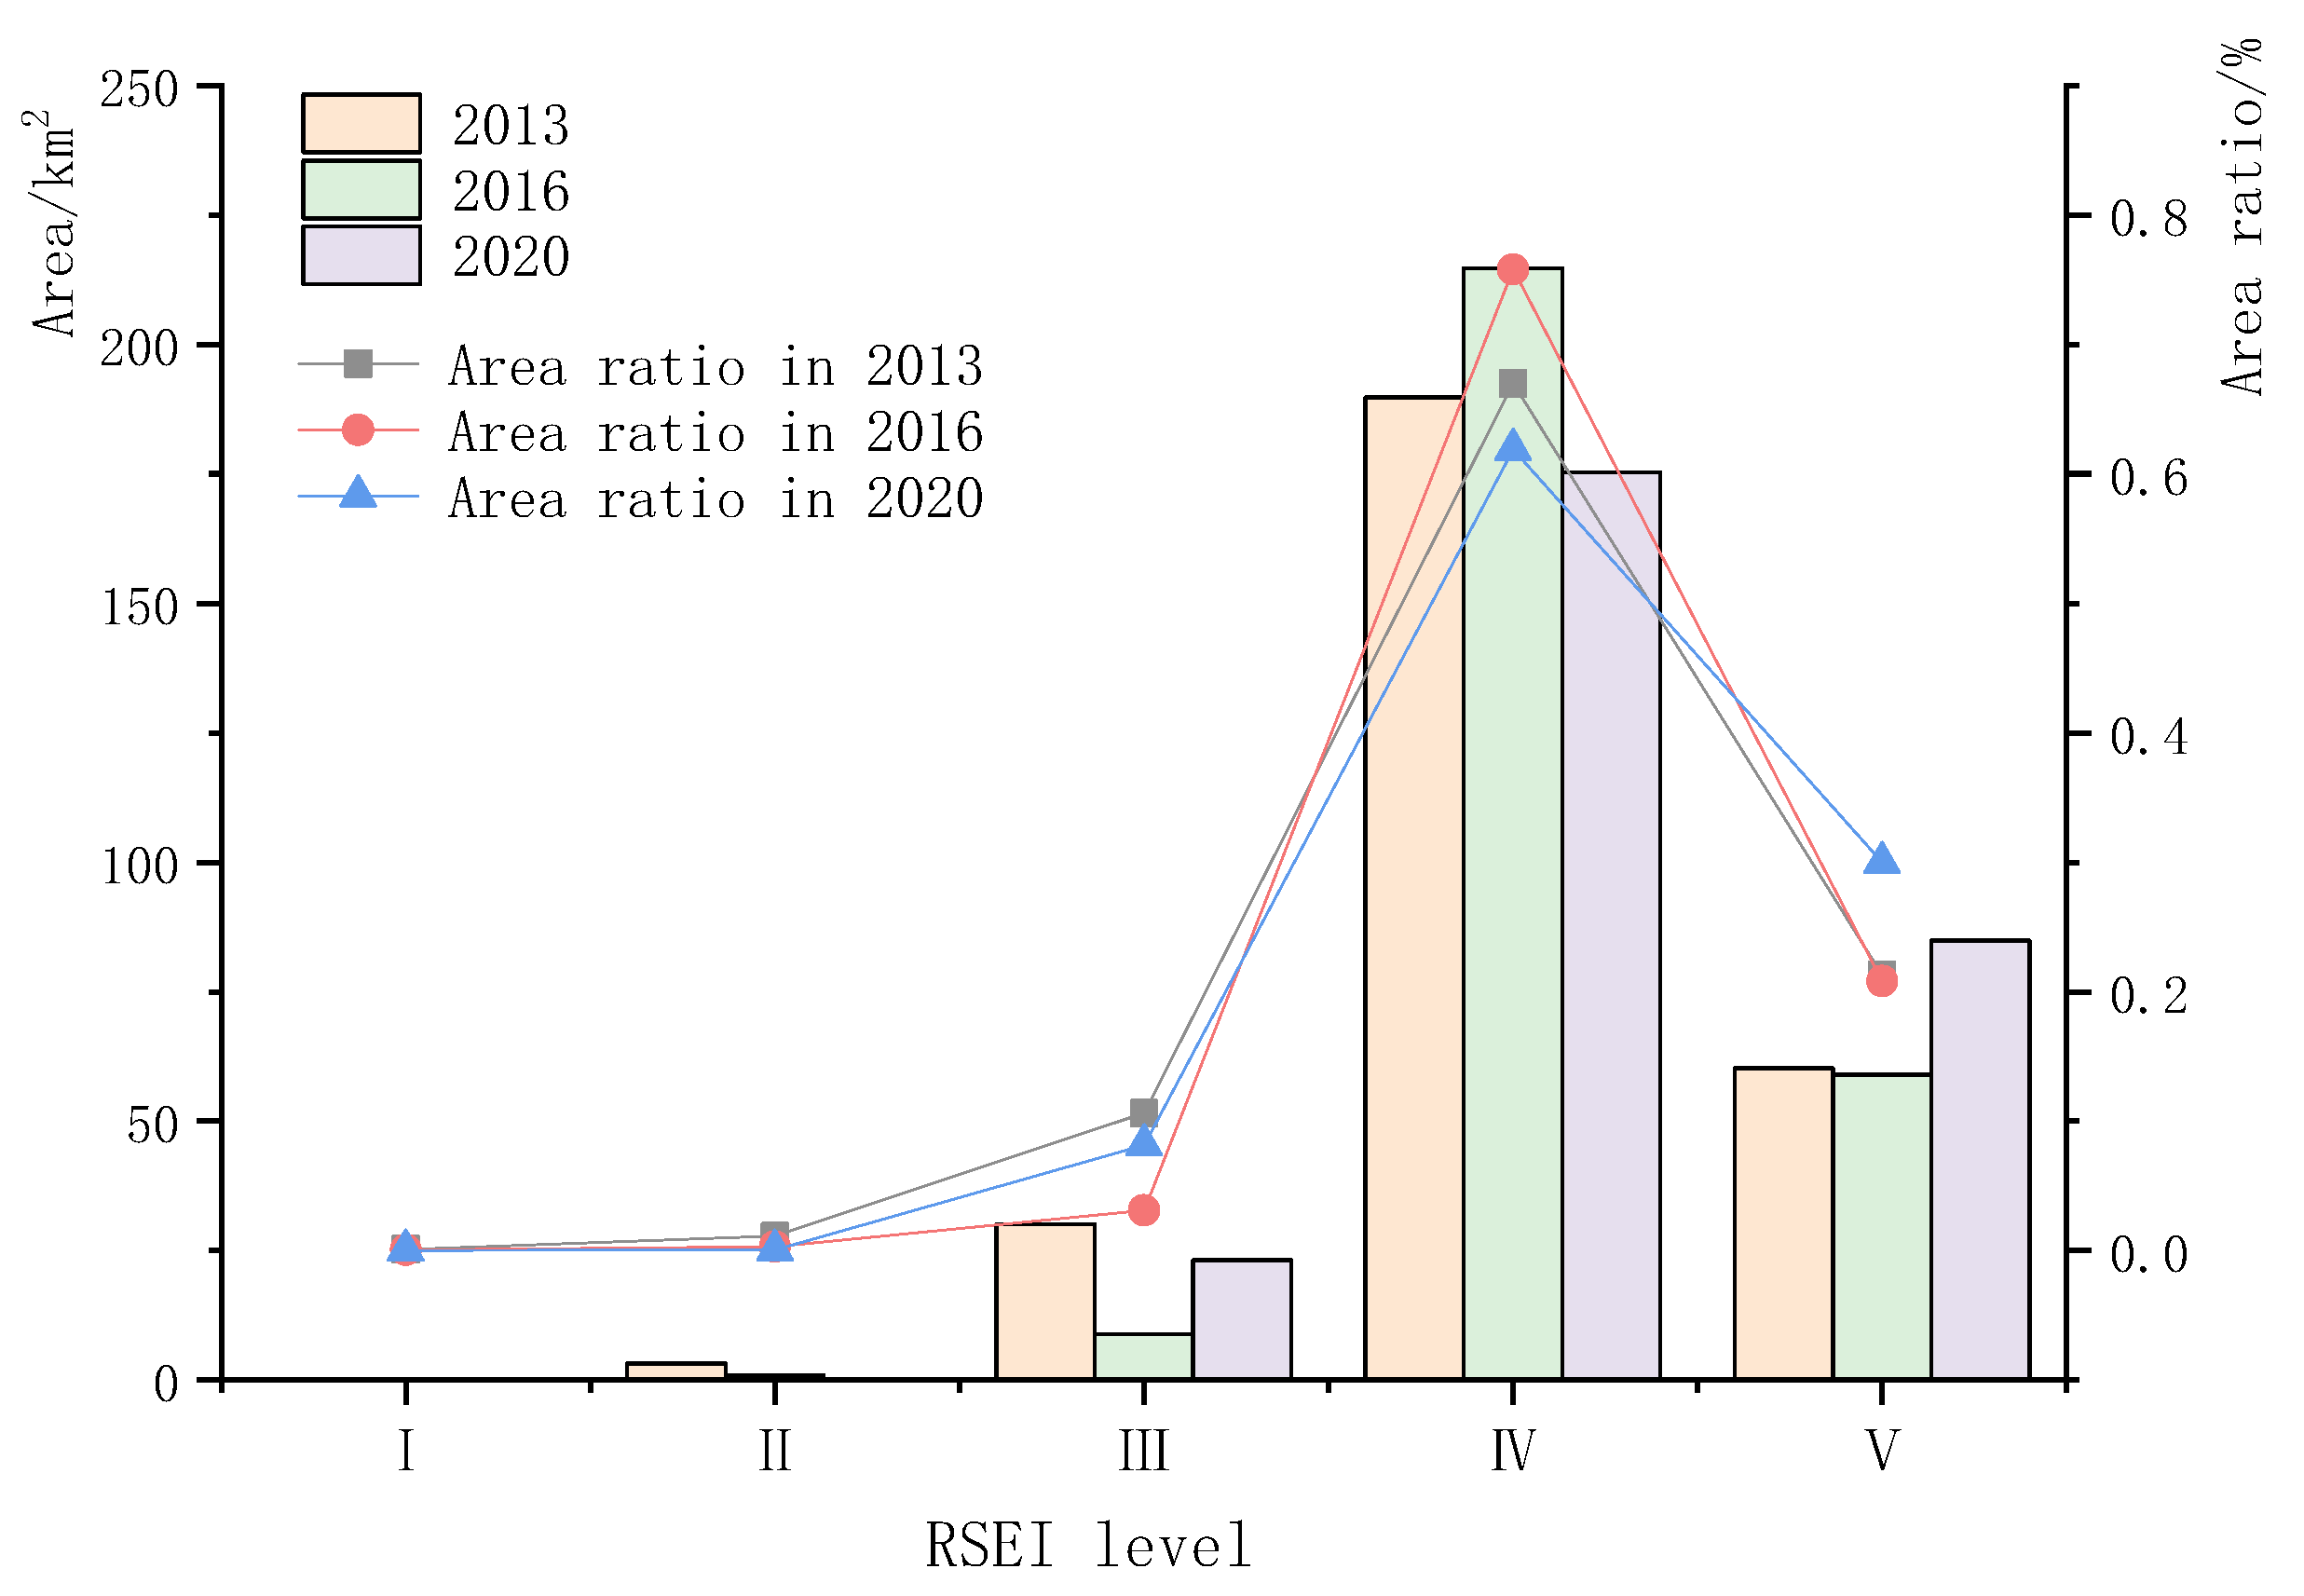
3.3. Characteristics of Ecological and Environmental Quality Changes

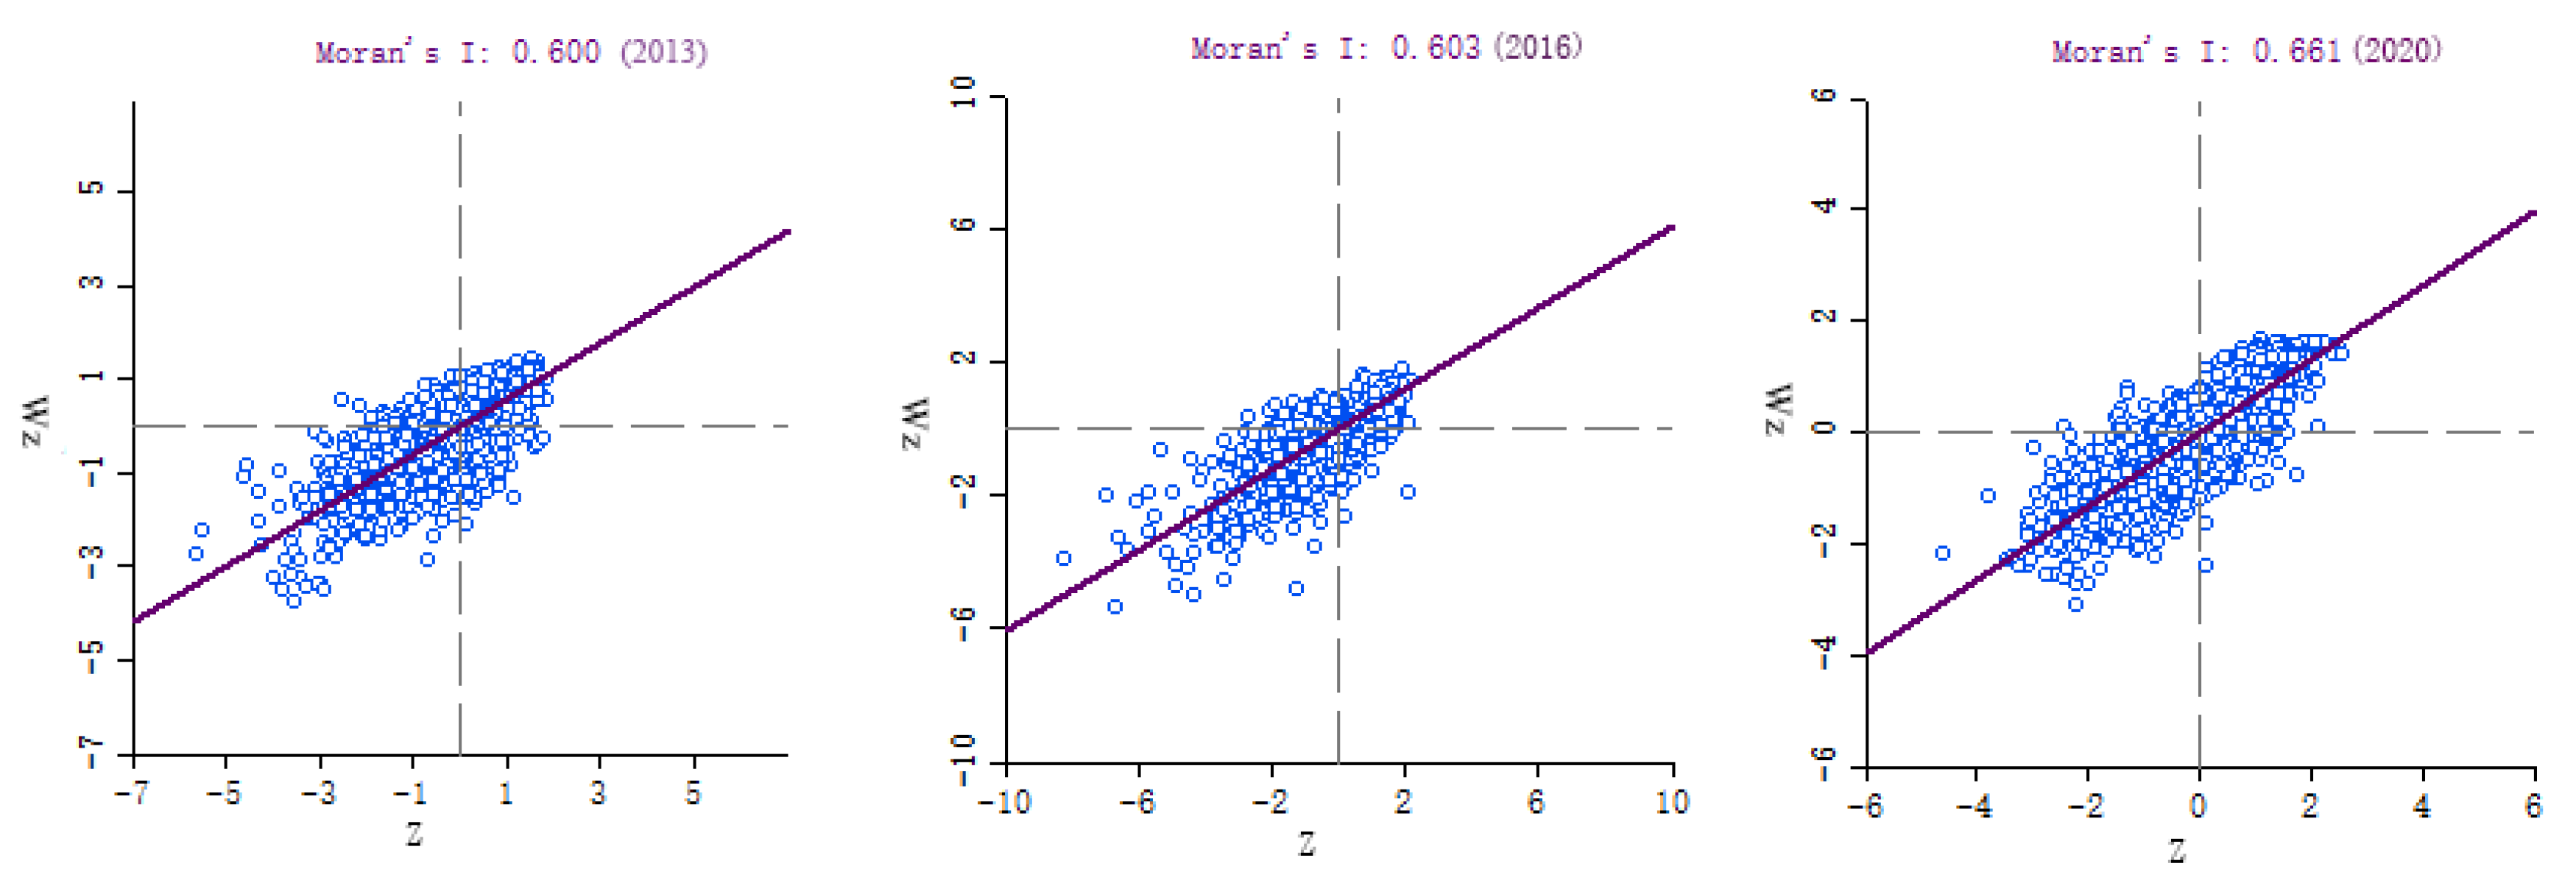
3.3.1. Spatial Characterization Based on Global Moran’s I Index

The RSEI maps for 2013–2020 were used to examine the global Moran’s I index, which can describe the overall correlation (Figure 6). The global Moran’s I indices all passed the significance test (0.02 significance level), indicating that the ecological and environmental quality of Shibing Karst WNHs has significant spatial autocorrelation characteristics. In terms of evolutionary trends, the global Moran’s I index showed an increasing characteristic from 2007 to 2018, the degree of spatial clustering of the ecological environment in the study area was continuously strengthened and the level of clustering was improved.

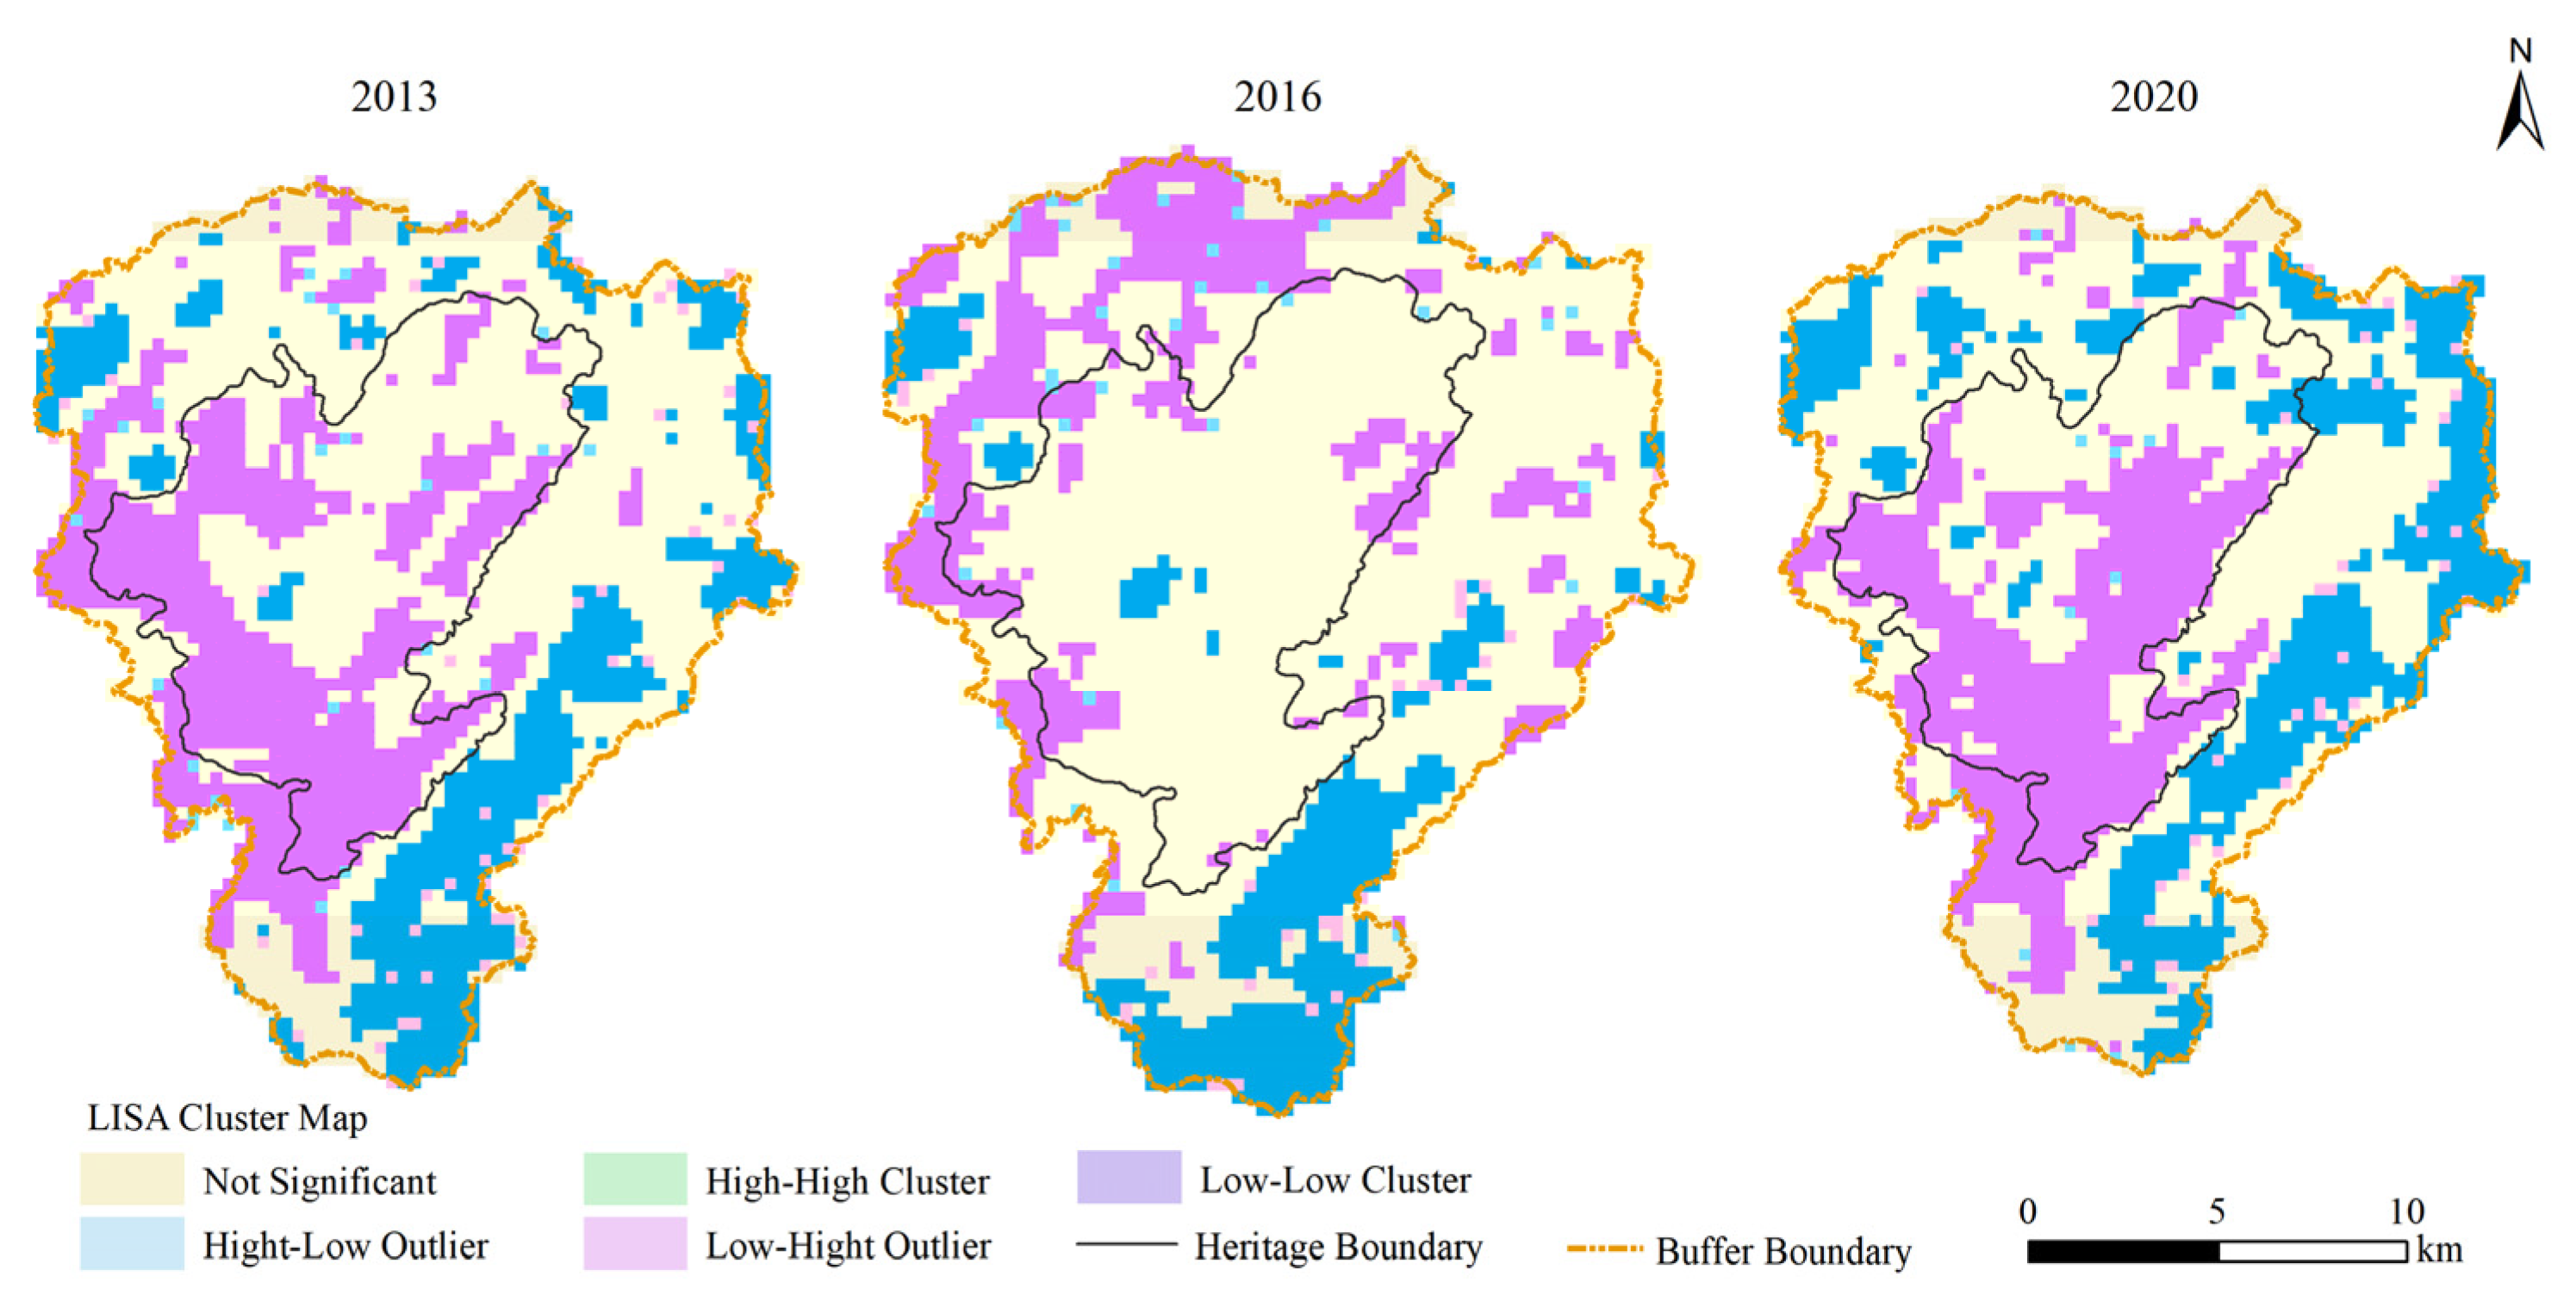
3.3.2. Spatial Characterization Based on Local Moran’s I Index

The local Moran index was used to assess the spatial dependence between samples. The following four types of spatial association were proposed. High–high cluster value type, high–low outlier type, low–high outlier type and low–low cluster type. High–high and low–low clusters correspond to positive spatial autocorrelation, while high–low and low–high outliers correspond to negative spatial autocorrelation. The characteristics of local spatial clustering are summarized in Figure 7. 1. High–high clustering type. The spatial differences of the high–high clustering type are small. The values of neighboring samples are highly sampled and show significant positive correlations. Most of the high-clustering samples are distributed in the middle, i.e., within the heritage site. 2. High–low outlier type. The sample itself has high ecological quality, while its neighboring samples have low ecological quality, showing a negative correlation of “high itself, low surrounding”. The high–low outlier samples were scattered at the edge of the study area, showing a point-like distribution structure. 3. Low–high outlier type. The value of this sample is very low, while the value of the neighboring samples is high. The low–high outlier type shows a negative correlation of “low itself, high surrounding”. They are mainly distributed in parts of the buffer zone. 4. The spatial variation of the low–low clustering type is small. These samples and their neighboring samples are of low ecological quality and show a significant positive correlation. The number of low–low clustering type samples gradually decreased and showed a blocky distribution, mainly in the buffer area.

3.4. Detection and Analysis of Factors Influencing Ecological Environment Quality

3.4.1. Single-Factor Analysis

In this study, the remote sensing ecological index was used as the dependent variable in geo-detector and land use type, elevation, NDVI, NDISI, WET and LST in the study area were selected as independent variables. Data integration of dependent and independent variables was performed before model construction. Geographic detectors generally use a grid to represent spatial statistical units. Therefore, in this study, the natural interruption method was used to classify the independent variables into five classes and a 300*300 image element grid was created in the study area to obtain the grid center points as sample points, of which there were 3135 in total. Additionally, the values of the dependent and independent variables in the three periods were factor-probed. The q value represents the degree of influence of the independent variable on the dependent variable, i.e., the explanatory power of the spatially divergent characteristics of the RSEI (Table 4). The results showed that the q-statistics of the factors detected in 2007 were ranked as follows: WET (0.970) > NDISI (0.823) > LUCC (0.612) > NDVI (0.418) > LST (0.279) > DEM (0.011).The q-statistics in 2016 were ranked as follows: NDISI (0.900) > WET (0.750) > NDVI (0.611) > LUCC (0.341) > LST (0.271) > DEM (0.033). The q-statistic ranking in 2020 was as follows: WET (0.834) > NDISI (0.798) > LUCC (0.655) > LST (0.531) > NDVI (0.364) > DEM (0.129). WET and NDISI have a greater ability to spatially influence the quality of the ecological environment, while elevation has a smaller ability to influence the quality of the ecological environment.

3.4.2. Risk Detection

Risk area detection refers to the degree of influence of each factor on RSEI at different levels and the results indicate that NDVI and WET positively affect ecological environment quality, indicating that areas with higher vegetation cover and higher humidity have a greater influence on the ecological environment quality. Additionally, NDISI and LST have a negative feedback effect on the ecological environment quality, indicating that the higher the dryness value and the higher the surface temperature, the higher the ecological pressure and the poorer the area’s quality. The risk area detection of land use shows that shrubs, grasslands, water bodies and woodlands play a positive feedback role in ecological quality and building land plays a negative feedback role. Altitude-specific risk zone detection shows that areas at sufficiently high or low elevations negatively affect ecological quality. Conversely, areas at intermediate elevations have a positive feedback effect.

4. Discussion

There are numerous methods for monitoring and evaluating the ecological environment quality. Li Hailong et al. established an urban evaluation index system from five target layers: resource conservation, environmental friendliness, economic sustainability, social harmony, economic sustainability and social harmony [37]; Peng Tao et al. established an ecological evaluation system for coastal wetlands including 17 specific indicators such as population density, degree of eutrophication of water bodies, biodiversity and awareness of wetland protection [38]. In recent years, national and regional government agencies have also established some ecological evaluation index systems, such as the ecological environment status index (EI) proposed by the Chinese Ministry of Environmental Protection in 2006. Remote sensing images are used to select indicators as well as to evaluate the ecological environment quality of heritage sites so as to visualize and analyze them spatially. With the development of remote sensing data, the development of large-scale remote sensing satellites, medium-scale UAV monitoring and small-scale ground monitoring stations provides a multi-scale, multi-data source approach for the monitoring of the ecological environment quality of heritage sites. Many scholars also obtained spatial data of ecological environment in cities, economic circles and mining areas by remote sensing technology, selected indicators of natural environmental conditions, environmental quality, natural landscape pattern and urbanization impact and assimilated environmental pollution monitoring data and socioeconomic statistics by using GIS spatial analysis technology to make a comprehensive evaluation of the ecological environment status [39,40,41]. Currently, the RSEI is mainly applied to the evaluation of ecological environment quality in urban and mining areas. There are fewer applications in karst areas. It is challenging to apply RSEI to monitor and evaluate the ecological quality of karst areas with a fragile ecological background, unique hydrogeological dichotomy development and particularly contradictory human-land relationship.
In this study, the monitoring and evaluation of the ecological environment quality of Shibing Karst WNHs was carried out using the RSEI index model, the indicators of heat, humidity, dryness and greenness were selected as evaluation indicators and the weight was determined by the contribution rate of each indicator to the first principal component, which was found to be above 80% by measurement. This indicates that PC1 concentrates most of the information of the four indicators. The selection of indicators and the determination of weights are more reasonable. An analysis of Table 4 reveals that the greenness index and humidity index are the preferred factors affecting the ecological environment quality of the heritage site, which is strongly related to the vegetation cover and precipitation of the Shibing Karst WNHs and increases in temperature and precipitation are favorable to the growth of vegetation. This finding is also consistent with the relevant studies of Wangguo-Qing et al. [42] and Chen-Juan et al. [43]. In this paper, satellite images were used to invert surface temperature instead of air temperature and humidity to represent precipitation, which were used to analyze the effects of changes in air temperature and precipitation on ecological environment quality.
The Shibing Karst has the properties of a WNHs and a Scenic Area for conservation and heritage display as one of the important functions [44] and is mainly concentrated in the heritage showcase area, including the Sugimu River and Yuntai Mountain scenic areas in the southern part of the nominated site. The ecological environment in this area is well maintained, the geological and geomorphological features are outstanding, the Science and Research development is in its early stages and the conditions for carrying out science and education tourism are relatively mature. As Shibing belongs to a karst region, its fragile ecological environment is vulnerable to the natural environment and human activities. However, this study reveals that since the listing of Shibing Karst as a World Heritage Site, the heritage management departments at all levels of government have protected and managed the site in accordance with the law and the local aboriginal village rules and regulations and the ecological quality of the site has been well preserved, in line with the sustainable heritage tourism advocated by UNESCO. Karst is mainly composed of a special topography developed in carbonate rocks and related ecosystems [45]. In this study, lithological data were not used as the main evaluation index due to the high vegetation cover in the Shibing Karst WNHs and the surface morphology of the peak canyon and peak valley in the Shibing Karst WNHs and thus elevation was used as an important index to study its spatial differentiation. In this paper, we considered that there are only a few human activities in the heritage site, all of them are at the junction of the heritage site and the buffer zone and most of them involve tourists and tourism employees, Because the study year was 2020, the development of the tourism industry was suspended due to the impact of the COVID-19 epidemic and thus the population and economic data were not used as evaluation indexes [46]. Unlike other regions, there is not only surface loss but also subsurface leakage of soil and water in karst areas [47]. Therefore, in the future environmental monitoring of the Karst World Natural Heritage, we should focus on the above-ground and below-ground monitoring in the field, in order to protect the ecological environment of the heritage sites more comprehensively. Remote sensing images were used to select indicators as well as to evaluate the ecological and environmental quality of heritage sites so as to visualize and analyze them spatially. With the development of remote sensing data, large-scale remote sensing satellites, medium-scale UAV monitoring and small-scale ground monitoring stations have been developed to provide a multi-scale, multi-data source approach to monitoring the ecological and environmental quality of heritage sites. In future ecological environment quality monitoring, full consideration should be given to UAV monitoring as well as ground monitoring stations to give full play to the synergy of sky–ground integration [48,49] and provide effective solutions for the conservation and sustainable development of WNHs.

5. Conclusions

The proposed method for karst-like heritage sites using RSEI and the geo-detector model, combined with GIS spatial analysis and statistical methods, provides a quantifiable and visualized method with large temporal and spatial scales for assessing and monitoring the ecological environment quality, which can be used for monitoring the ecological environment quality of WNHs, especially karst-like WNHs with a more fragile ecology. The evaluation of ecological environment quality is important for the management, conservation and sustainable development of heritage sites. This study uses remote sensing data and geospatial analysis methods to evaluate the ecological environment quality of karst heritage sites, taking the pre-application, post-application and current conditions of the heritage sites as the temporal research scale. The study found that:
(1) In the evaluation of the ecological environment quality of the three phases of the Karst Heritage Site in Shibing, the contribution of the PC1 principal component eigenvalues reached more than 80% and the RSEI was applicable to the ecological environment quality assessment of the karst WNHs.
(2) The proportion of the areas with good and excellent ecological quality rose from 88.24% in 2013 to 91.82% in 2020, while the proportion of areas with poor RSEI grades declined period by period, from 1.15% in 2013 to 0.04% in 2020, showing a significant decline.
(3) The ecological environment quality shows a positive spatial correlation and the Moran index value is steadily increasing. The ecological environment quality has significant spatial aggregation characteristics, generally showing that the west side of the heritage site is more aggregated than the east side of the heritage site. The high–high aggregation is mainly distributed in the heritage site and low–low aggregation is mainly distributed in the buffer zone.
(4) The results based on the geo-detectors model show that WET and NDISI have greater explanatory power for the spatially divergent features of ecological environmental quality in single-factor detection and are the dominant factors of environmental quality in Shibing WNHs. NDVI and WET were found to play a positive feedback role in ecological environmental quality in terms of risk area detection and NDISI and LST play a negative feedback role in terms of ecological environmental quality.

Author Contributions

Writing—original draft, N.Z.; Conceptualization, N.Z.; Writing—review & editing, N.Z.; Data curation, N.Z.; Methodology, N.Z.; Funding acquisition, K.X.; Project administration, K.X.; Resources, H.X.; Validation, H.X.; Visualization, H.X.; Supervision, J.Z.; Investigation, C.S. All authors have read and agreed to the published version of the manuscript.

Funding

This study was supported by the Philosophy and Social Science Planning Key Project of Guizhou Province (Grant No. 21GZZB43), the Key Project of Science and Technology Program of Guizhou Province (No. 5411 2017 Qiankehe Pingtai Rencai) and the China Overseas Expertise Introduction Program for Discipline Innovation (No. D17016).

Institutional Review Board Statement

Not applicable.

Informed Consent Statement

Not applicable.

Data Availability Statement

Not applicable.

Conflicts of Interest

The authors declare no conflict of interest.

References

  1. Wu, B.H.; Li, M.M.; Huang, G.P. A study on relationship of conservation and tourism demand of World Heritage Sites in China. Geogr. Res. 2002, 21, 617–626. [Google Scholar]
  2. Sun, K.Q. Heritage Conservation and Development; Tourism Education Press: Beijin, China, 2008. [Google Scholar]
  3. Jaafar, M.; Noor, S.M.; Rasoolimanesh, S.M. Perception of young local residents toward sustainable conservation programmes: A case study of the Lenggong World Cultural Heritage Site. Tour. Manag. 2015, 48, 154–163. [Google Scholar] [CrossRef]
  4. Lollino, G.; Giordan, D.; Marunteanu, C.; Christaras, B.; Yoshinori, I.; Margottini, C. Engineering geology for society and territory. In Volume 8 The Monviso Ophiolite Geopark, a Symbol of the Alpine Chain and Geological Heritage in Piemonte, Italy; Springer: Cham, Switzerland, 2015; Volume 40, pp. 239–243. [Google Scholar]
  5. Chen, X.Q.; Chen, J.G.; Cui, P.; You, Y.; Hu, K.H.; Yang, Z.J.; Zhang, W.F.; Li, X.P.; Wu, Y. Assessment of prospective hazards resulting from the 2017 earthquake at the world heritage site Jiuzhaigou Valley, Sichuan, China. J. Mt. Sci. 2018, 15, 779–792. [Google Scholar] [CrossRef]
  6. Pavlova, I. Global overview of the geological hazard exposure and disaster risk awareness at world heritage sites. J. Cult. Herit. 2017, 28, 151–157. [Google Scholar] [CrossRef]
  7. Li, G.C.; Xiong, K.N.; Xiao, S.Z. Comparison study of World Heritage geomorphologic value of Dolomite Karst in Shibing and Huanjiang. Acta Sci. Nat. Univ. Sunyatseni 2014, 53, 142–148. [Google Scholar]
  8. Yuan, D.X. Challenges and opportunities for karst research of our country under the new situation. Carsologica Sin. 2009, 28, 329–331. [Google Scholar]
  9. Xiong, K.N.; Xiao, S.Z.; Liu, Z.Q.; Chen, P.D. Comparative analysis on World Natural Heritage value of South China Karst. Strateg. Study CAE 2008, 10, 17–28. [Google Scholar]
  10. Xiong, K.N.; Chi, Y.K. The problems in Southern China Karst ecosystem in Southern of China and its countermeasures. Ecol. Econ. 2015, 31, 23–30. [Google Scholar]
  11. Titchen, S.M. On the construction of ‘outstanding universal value’: Some comments on the implementation of the 1972 UNESCO World Heritage Convention. Conserv. Manag. Archaeol. Sites 1996, 1, 235–242. [Google Scholar] [CrossRef]
  12. Alexander, M. Survey, surveillance, monitoring and recording. Manag. Plan. Nat. Conserv. A Theor. Basis Pract. Guide 2008, 1, 49–62. [Google Scholar]
  13. Bruner, A.G. Effectiveness of parks in protecting tropical biodiversity. Science 2001, 291, 125–128. [Google Scholar] [CrossRef] [PubMed] [Green Version]
  14. Irfan, Z.B.; Venkatachalam, L.; Jayakumar, S. Ecological health assessment of the Ousteri wetland in India through synthesizing remote sensing and inventory data. Lakes Reserv. Res. Manag. 2020, 25, 84–92. [Google Scholar] [CrossRef]
  15. Das, S. Assessment of wetland ecosystem health using the pressure–state–response (PSR) model: A case study of mursidabad district of West Bengal (India). Sustainability 2020, 12, 5923. [Google Scholar] [CrossRef]
  16. Cui, N. Impact of urbanization on ecosystem health: A case study in Zhuhai, China. Int. J. Environ. Res. Public Health 2019, 16, 4717. [Google Scholar] [CrossRef] [Green Version]
  17. Wu, N. An Assessment framework for grassland ecosystem health with consideration of natural succession: A case study in Bayinxile, China. Sustainability 2019, 11, 1096. [Google Scholar] [CrossRef] [Green Version]
  18. Smith, A.M. Remote sensing the vulnerability of vegetation in natural terrestrial ecosystems. Remote Sens. Environ. 2014, 154, 322–337. [Google Scholar] [CrossRef]
  19. Groom, G. Remote sensing in landscape ecology: Experiences and perspectives in a European context. Landsc. Ecol. 2006, 21, 391–408. [Google Scholar] [CrossRef]
  20. Hu, X.S.; Xu, H.Q. A new remote sensing index for assessing the spatial heterogeneity in urban ecological quality: A case from Fuzhou City, China. Ecol. Indic. 2018, 89, 11–21. [Google Scholar] [CrossRef]
  21. Ren, W.; Zhang, X.S.; Shi, Y.B. Evaluation of ecological environment effect of villages land use and cover change: A Case study of some Villages in Yudian Town, Guangshui city, Hubei Province. Land 2021, 10, 251. [Google Scholar] [CrossRef]
  22. Yu, Z.Y.; Deng, X.Z. Assessment of land degradation in the North China Plain driven by food security goals. Ecol. Eng. 2022, 183, 106766. [Google Scholar] [CrossRef]
  23. Li, Z.H. Tradeoffs between agricultural production and ecosystem services: A case study in Zhangye, Northwest China. Sci. Total Environ. 2020, 707, 136032. [Google Scholar] [CrossRef] [PubMed]
  24. He, D.W. Ecological efficiency of grass-based livestock husbandry under the background of rural revitalization: An empirical study of Agro-Pastoral Ecotone. Front. Environ. Sci. 2022, 10, 100. [Google Scholar] [CrossRef]
  25. Li, Z.H. Multilevel modelling of impacts of human and natural factors on ecosystem services change in an oasis, Northwest China. Resources. Conserv. Recycl. 2021, 169, 105474. [Google Scholar] [CrossRef]
  26. Wang, W.X. Impacts of infrastructure construction on ecosystem services in new-type urbanization area of North China Plain. Resources. Conserv. Recycl. 2022, 185, 106376. [Google Scholar] [CrossRef]
  27. Xu, H.Q. A remote sensing index for assessment of regional ecological changes. China Environ. Sci. 2013, 33, 889–897. [Google Scholar]
  28. Liu, Q. Ecological environment assessment in World Natural Heritage site based on Remote-Sensing Data. A case study from the Bayinbuluke. Sustainability 2019, 11, 6385. [Google Scholar] [CrossRef] [Green Version]
  29. Balducci, F.; Ferrara, A. Using urban environmental policy data to understand the domains of smartness: An analysis of spatial autocorrelation for all the Italian chief towns. Ecol. Indic. 2018, 89, 386–396. [Google Scholar] [CrossRef]
  30. Rouse, J.W.; Haas, R.H.; Schell, J.A.; Deering, D.W. Monitoring vegetation systems in the great plains with ERTS. In Proceedings of the 3rd ERTS Symposium, Washington, DC, USA, 10–14 December 1974; Volume 12, pp. 309–317. [Google Scholar]
  31. Freden, S.C.; Mercanti, E.P.; Becker, M.A. Third Earth Resources Technology Satellite-1 Symposium-Volume I: Technical Presentations; NASA SP-351; NASA: Washinton, DC, USA, 1974; p. 351.
  32. Wang, H.S. Discussion on feedback effect of soil desiccation by vegetation and related issues. Prog. Geogr. 2007, 26, 33–39. [Google Scholar]
  33. Huang, C.Q. Derivation of a tasselled cap transformation based on Landsat 7 at-satellite reflectance. Int. J. Remote Sens. 2002, 23, 1741–1748. [Google Scholar] [CrossRef]
  34. Tobler, W.R. A computer movie simulating urban growth in the Detroit region. Econ. Geogr. 1970, 46, 234–240. [Google Scholar] [CrossRef]
  35. Jiang, T.Y. Study on spatial and temporal evolution and factors of regional innovation in China. Econ. Geogr. 2013, 33, 22–29. [Google Scholar]
  36. Wang, J.F.; Xu, C.D. Geodetector: Principle and prospective. Acta Geogr. Sin. 2017, 72, 116–134. [Google Scholar]
  37. Li, H.L.; Yu, L. Chinese Eco-city indicator construction. Urban Stud. 2011, 18, 81–86. [Google Scholar]
  38. Peng, T.; Chen, X.H.; Wang, G.X.; Li, Y.H.; Li, J. Assessment of coastal wetland ecosystem health based on set pair analysis and triangular fuzzy numbers. Ecol. Environ. Sci. 2014, 23, 917–922. [Google Scholar]
  39. Xu, P.W.; Zhao, D. Ecological environmental quality assessment of Hangzhou urban area based on RS and GIS. Chin. J. Appl. Ecol. 2006, 17, 1034–1038. [Google Scholar]
  40. Wang, W.; Wang, X.L.; Feng, Z.K.; Dong, S.Y. Dynamic evaluation of eco-environmental quality in the capital economic circle based on RS and GIS. J. Anhui Agric. Univ. 2015, 42, 257–262. [Google Scholar]
  41. Huang, H.; Chen, W.; Zhang, Y.; Qiao, L.; Du, Y. Analysis of ecological quality in Lhasa Metropolitan Area during 1990–2017 based on remote sensing and Google Earth Engine platform. J. Geogr. Sci. 2021, 31, 265–280. [Google Scholar] [CrossRef]
  42. Wang, G.Q.; Guan, X.X.; Wang, L.Y.; Wang, J. Impacts of climate change and human activities on stream flow of the key runoff generation areas of the Yellow River Basin. Yellow River 2019, 41, 26–30. [Google Scholar]
  43. Chen, J.; Song, N.P.; Chen, L.; Wang, X.; Wang, Q.X. Soil moisture dynamics and its response to precipitation in different cover types of desert steppe. J. Soil Water Conserv. 2021, 35, 198–206. [Google Scholar]
  44. Fang, R.N.; Zhang, J.; Xiong, K.N. Influencing factors of residents perception of responsibilities for heritage conservation in world heritage buffer zone: A case study of libo karst. Sustainability 2021, 13, 10233. [Google Scholar] [CrossRef]
  45. Xiong, K.N.; Li, G.C.; Wang, L.Y. Study on the protection and sustainable development of South China Karst Libo World Natural Heritage Site. Chin. Landsc. Archit. 2012, 28, 66–71. [Google Scholar]
  46. Wang, Z.J.; Zhou, X.M.; Fang, Z.Q. Evaluation on the resilience of urban tourism flow network structure under the impact of COVID-19 pandemic: A case of Chongqing. J. Arid. Land Resour. Environ. 2022, 11, 148–157. [Google Scholar]
  47. Chen, H.S.; Feng, T.; Li, Z.C.; Fu, Z.Y.; Lian, J.J.; Wang, K.L. Characteristics of soil erosion in karst regions of Southwest China: Research Advance and Prospective. J. Soil Water Conserv. 2018, 32, 10–16. [Google Scholar]
  48. Li, Q.; Yang, Y.G.; Ti, B.; Xu, K.; Zhao, X.Q. Integrated aerial-space-ground ecological monitoring technology system of Baima Snow Mountain National Nature Reserve. J. West China For. Sci. 2021, 50, 49–54. [Google Scholar]
  49. Wu, L.X.; Li, J.; Miao, Z.L.; Wang, W.; Chen, B.Y.; Li, Z.W.; Dai, W.J.; Xu, W.B. Pattern and directions of spaceborne-airborne-ground collaborated intelligent monitoring on the geo-hazards developing environment and disastersin glacial Basin. Acta Geod. Cartogr. Sin. 2021, 50, 1109–1121. [Google Scholar]
Figure 1. Location of the study area.
Land 12 00184 g001
Figure 2. Methodological framework for the ecological quality analysis of the Shibing Karst.
Land 12 00184 g002
Figure 3. Spatial and temporal evolution of the RSEI grades at the Shibing Karst.
Land 12 00184 g003
Figure 4. Area and proportion of each ecological class from 2013 to 2020.
Land 12 00184 g004
Figure 5. Analysis of RSEI changes from 2013 to 2020.
Land 12 00184 g005
Figure 6. Moran’s I scatter plot.
Land 12 00184 g006
Figure 7. Distribution of spatial association types.
Land 12 00184 g007
Table 1. Results of principal component analysis.
Year PC1PC2PC3PC4
2013Eigenvalues/λ0.0120.0020.0010.000
Contribution Ratio/%80.21%11.51%7.81%0.47%
2016Eigenvalues/λ0.6600.0010.0010.0001
Contribution Ratio/%87.42%7.9%3.46%1.22%
2020Eigenvalues/λ0.0080.0020.0010.000
Contribution Ratio/%80.56%10.94%6.17%2.33%
Table 2. RSEI and mean value of each index.
YearIndexRSEI
NDVIWETNDISILST
20130.7730.7530.8800.4690.720
20160.7820.7760.5090.5700.723
20200.8290.8950.3450.4360.742
Table 3. RSEI and mean value of each index.
Area (km2)2020
2013IIIIIIIVVTotal
I00.0190.0950.05100.165
II00.0271.9801.1090.0053.121
III0.0010.04113.09516.7970.07730.011
IV0.0010.0067.869144.40737.489189.772
V00.0020.03512.89547.28860.220
Total0.0020.09523.074175.25984.859283.289
Table 4. Single-factor detection q-value.
Factors201320162020
NDVI0.4180.6110.364
NDISI0.8230.9000.798
WET0.9070.7500.834
LST0.2790.2710.531
DEM0.0110.0330.129
LUCC0.6120.3410.655
Disclaimer/Publisher’s Note: The statements, opinions and data contained in all publications are solely those of the individual author(s) and contributor(s) and not of MDPI and/or the editor(s). MDPI and/or the editor(s) disclaim responsibility for any injury to people or property resulting from any ideas, methods, instructions or products referred to in the content.

