Article

How Has the Inter-City Corporate Network Spatio-Temporally Evolved in China? Evidence from Chinese Investment in Newly Established Enterprises from 1980–2017

1
Research Center for China Administrative Division, East China Normal University, Shanghai 200241, China
2
School of Urban and Regional Science, East China Normal University, Shanghai 200241, China
3
Future City Lab, East China Normal University, Shanghai 200241, China
4
Eco-Chongming, 20 Cuiniao Rd., Chenjia Zhen, Chongming, Shanghai 202162, China
*
Author to whom correspondence should be addressed.
Land 2023, 12(1), 204; https://doi.org/10.3390/land12010204
Submission received: 6 December 2022 / Revised: 1 January 2023 / Accepted: 6 January 2023 / Published: 8 January 2023

Abstract

:
Based on social network analysis (SNA) and the modified Boston Matrix (also known as Market Growth Rate—Relative Market Share Matrix or Four Quadrant Analysis, which was developed by the Boston Consulting Group (BCG) in the early 1970s.), this paper presents the temporal and spatial evolution process of inter-city corporate investment networks in 338 city regions (prefecture level and above) in China from 1980 to 2017. First, we find that inter-city investment linkages formed a diamond-shaped connection structure, with Beijing–Shanghai–Shenzhen–Chongqing as the spatial vertices; moreover, the overall investment network underwent a transition from looseness to aggregation. Second, the spatial layout of module division presents a situation of overall fragmentation and partial agglomeration, and regional integration is increasing. Third, the resource control capability of nodes showed the Beijing unipolar pattern before the 2000s and developed into the Beijing–Shanghai–Hangzhou one-pole, dual-core pattern after the 2000s. The reachability of nodes presents the Beijing uni-polar pattern during all the study years. The core–periphery model of nodes weakened over the study period, and the nodes’ positions have obvious administrative hierarchy and economic level orientation. Fourth, the node potentials and development stages are stronger in the east than in the west overall. Finally, we propose some political implications that the government can consider in order to improve the regional coordination of development.

1. Introduction

After World War II, central place theory was considered the basic theory of regional and urban systems. It emphasizes that urban functions can only be radiated in one direction from high level cities to low level cities; that is, a city can only provide services that match or are lower than its own level but cannot provide services that are higher than its own level. Thus, the theory implies that urban flows are unidirectional and asymmetric [1]. However, since the third revolution of science and technology [2], advances in information and communication technology (ICT) and transportation infrastructure systems have led to increasingly close and complex relationships between cities [3]. Geographical distance and city size are becoming less restrictive to the connection between cities and the outside world, and geographical boundaries have been gradually broken down. As a result, capital, commodities, information, and labor have been liberated in recent years, leading to the formation of modern economic systems. On this basis, Castells proposed the theory of flow space and argued that regional and social development is no longer limited by geographic areas. Further, he stated that various forms of flows (transportation, capital, information, etc.) act as bridges connecting cities via physical and virtual carriers, gradually weakening the limiting role of administrative boundaries, social relations, and political systems in urban and rural areas [4]. Based on the flow space theory, cities are linked horizontally through various elemental flows, thus forming a networked urban system. The introduction of this concept has set off a wave of research exploring the characteristics of regional spatial structure from the perspective of inter-urban network relations. Unlike central place theory, urban networks emphasize the division of labor and the complementarity of nodes. Large cities may not occupy significant positions in the network, while small and medium-sized cities (e.g., gateway cities and hub cities) can occupy key positions by virtue of certain prominent functions [5].
The current dominant approach to global urban network pattern analysis is divided into two parts: infrastructure and business organization [6]. Infrastructure mainly involves links across the boundaries of regions via transport flows (including railways, flights, and ports) [7,8,9] and telecommunications [10] through inter-city “hard networks” based on attribute data linkages between cities. On the other side is the “soft network,” which is based on corporate organizational relationships. Two research paradigms have been proposed for such networks. First, scholars guided by World City Hypothesis theory [11] assessed the hierarchy of world cities and their evolution over decades using data on the vertical headquarters–branch layout of the world’s top 500 multinational corporations [12]. Second, building on the Global City concept [13], the Globalization and World Cities Study Group and Network (GaWc) explored the strength of service connectivity among global cities. In particular, they used interlocking network models based on relational data on specific firms providing advanced producer services such as accounting, management consulting, and financial services [14,15].
However, neither of the two paradigms considered the full range of firm types. Moreover, both place a strong emphasis on the wealthiest parts of the world economy, such as the five financial centers of London, New York, Tokyo, Hong Kong, and Singapore, which have the most global connectivity [16]. Therefore, scholars have warned against “underestimating the diversity and complexity of global interactions” [17,18]. There was an argument that focusing on other local nodes in the global network could improve our understanding of the extra-local relationships and statuses of cities located in less affluent parts of the global economy [19]. Also, a study showed that major economic centers in Asia are becoming increasingly important, while Western cities, particularly those in the United States, are losing importance in the world city network. Non-Western countries scored relatively highly in the 2011 international city comparison for overall network connectivity [20]. Meanwhile, the rise of China led to some scholars finding that Beijing and Shanghai were more strategically important in the world city network than before [21]. In addition, the segmentation of industries has broadened the research field of corporate networks, as they have gradually expanded from the original dominance of finance-related industries to other industries such as manufacturing, film, oil and gas, and cultural industries [22,23,24,25].
Nevertheless, enterprise organizational relationships are internal vertical links among enterprises, which may involve issues of affiliation. As such, they do not provide true factor flow data (e.g., real capital) and can hardly reflect inter-city links in an effective way. Not only do internal organizational and strategic choices affect the development of the company itself, but also the external relationships of the company have an important impact. Such horizontal relationships are not subordinate; as such, they are more in line with the cooperation and complementarity of urban networks. At the same time, horizontal relationships are not limited to within-industry links. They can also connect different types of enterprises, as industries can establish connections through factor flows, which eliminate the control attributes within enterprises [26]. As an aggregate reflecting the flow of various factors in cities, inter-firm linkages are a powerful tool for revealing inter-city relationships [27]. Nevertheless, due to the difficulty of obtaining micro-level data, urban networks based on horizontal linkages among enterprises have been less studied. Only in recent years have scholars conducted exploratory studies on them; such research now represents a new field within urban network research. Horizontal linkages are mainly studied from the perspectives of financial connections and innovation relationships [28,29]. This paper concerns the former linkages. Related studies are mostly based on listed companies or Advanced Productive Services (APS) firms, finding that Beijing, Shenzhen, Shanghai are capital center and key nodes [30,31]. Other studies chose one urban agglomeration, such as the Pearl River Delta or Yangtze River Delta, as the study area [32,33]. Meanwhile, social network analysis methods have been introduced into the study of the spatial structure of urban networks, such as centrality analysis, community division, and the core–edge model [22,34,35].
Since China’s Reform and Opening-Up, the gradual establishment of the market economy system has stimulated many enterprises to make inter-city investments in order to expand their scale and business paths [36]. The resulting strengthening of inter-regional linkages has increasingly contributed to the evolution of complex urban network patterns. With the increasing prevalence of inter-city investment, inter-firm investment linkages—as an objective linkage that includes flow direction—can reflect the strength, opportunity, and frequency of inter-city linkages [34]. Unlike in most Western countries, the urban system in China has a distinct administrative hierarchy due to the state system; indeed, the influence of this hierarchy is as important as economic effects or city sizes. In the context of globalization, the relationships between Chinese cities increasingly cross the boundaries of administrative regions, creating more and more cross-level urban linkages. However, much work remains to be done to overcome inter-city administrative barriers in order to respond to the call of China’s national coordinated regional development strategy. Therefore, it is necessary to study the evolution of the spatial structure of inter-city corporate investment networks, which is of great value and significance for Chinese companies, their local economies, and the development of regional integration.
To summarize, the existing literature that explores urban networks’ spatial structure from the perspective of business linkages has several gaps that motivate this study. First, most studies select capitals or central cities in certain countries, which cannot characterize the evolution of a whole country’s urban networks nor reveal the interactions between regions with different development situations. Second, most studies choose APS firms or listed companies as their study samples, which cannot adequately represent all corporations. Listed companies have strong capital and are mostly located in important cities 1. Moreover, the scope of the business of producer services is specific, and not all areas have companies of this type. Therefore, neither of the two categories discussed above can represent all the kinds of enterprises. Third, the vast majority of existing studies on inter-city corporate investment networks only examine data after 2000, which does not reflect the development process and evolution over the long term. To fill these gaps, this paper conducts an analysis of the temporal and spatial evolution of inter-city corporate investment networks in 338 city regions (prefecture level and above) in China from 1980 to 2017 by using social network analysis and a modified Boston Matrix (seen in Section 2.2.2). The Boston Matrix is rarely used in related studies, which can provide a different perspective to analyze city nodes characteristics in the network. This study has a more thorough and comprehensive exploration of the spatio-temporal pattern evolution characteristics of inter-city corporate investment linkages in China since the forty years of China’s Reform and Opening Up. Also, it provides a reference direction for China to strengthen regional connections and achieve regional integration and coordinated economic development.

2. Data and Methodology

2.1. Study Area and Data Sources

The sample areas used in this paper are all 338 administrative regions at the prefecture level and higher administrative regions in China, including 294 prefecture-level cities, 4 municipalities directly under the Central Government, 7 prefectures, 30 autonomous prefectures, and 3 leagues (based on the administrative division standards of 2017). In this paper, investment refers to the equity investment that one enterprise makes in a newly established enterprise whose purpose is to expand the original enterprise’s scale or to expand to new industries in other areas. The required data come from www.qichacha.com, accessed on 30 November 2020, which is a fast and comprehensive enterprise credit inquiry tool serving the public. It contains all registered companies in China (including active and cancelled companies) and provides accurate, timely, and complete company information
In terms of data processing, first the original records of enterprises (including their survival, revocation, and cancellation) are collected in batches from Qichacha before matching firms’ established and invested time. Then, incomplete records are eliminated in order to ensure data integrity. Meanwhile, according to the University financial database (http://www.bjinfobank.com/, accessed on 30 November 2020), the average currency exchange rate of each year is uniformly converted into RMB for the correction of monetary units. Subsequently, errors and outliers of the investment amount, the enterprise location, and other attributes are inspected and corrected. Finally, actual and effective corporate investment records in China from 1979 to 2017 are obtained on Stata SE17. The data included 295,135 inter-city investment records. In order to ensure the accuracy of the processed data, 1000 investment records were randomly selected by a weeklong manual inspection of the National Enterprise Credit Information Publicity System (http://www.gsxt.gov.cn/, accessed on 20 December 2020), and the results matched completely.
Considering the effects of inflation and deflation, the investment amount since 1979 was deflated by calculating the Consumer Price Index (CPI) in order to make data from different years comparable. The raw data for this index are provided by the Qianzhan Database (https://d.qianzhan.com/, accessed on 30 November 2020), which contains the Chinese national CPI index from 1950 to 2020.

2.2. Analysis Methods

2.2.1. Social Network Analysis

Social network analysis (SNA) can explore the corporate investment links between regions from the perspective of relationships. As such, it can not only analyze the overall structure of the network but also reflect the relative status of node cities within it. The specific indicators and their calculations, definitions, and functions (Table 1) have been thoroughly discussed in the literature [26,37,38]. Average centrality degree, average clustering coefficient, density, diameter, shortest path lengths, and modularity are selected to describe the growth situation of the network, and betweenness centrality and closeness centrality are applied to measure the positions of the nodes. The calculation was conducted with Gephi 0.9.4.

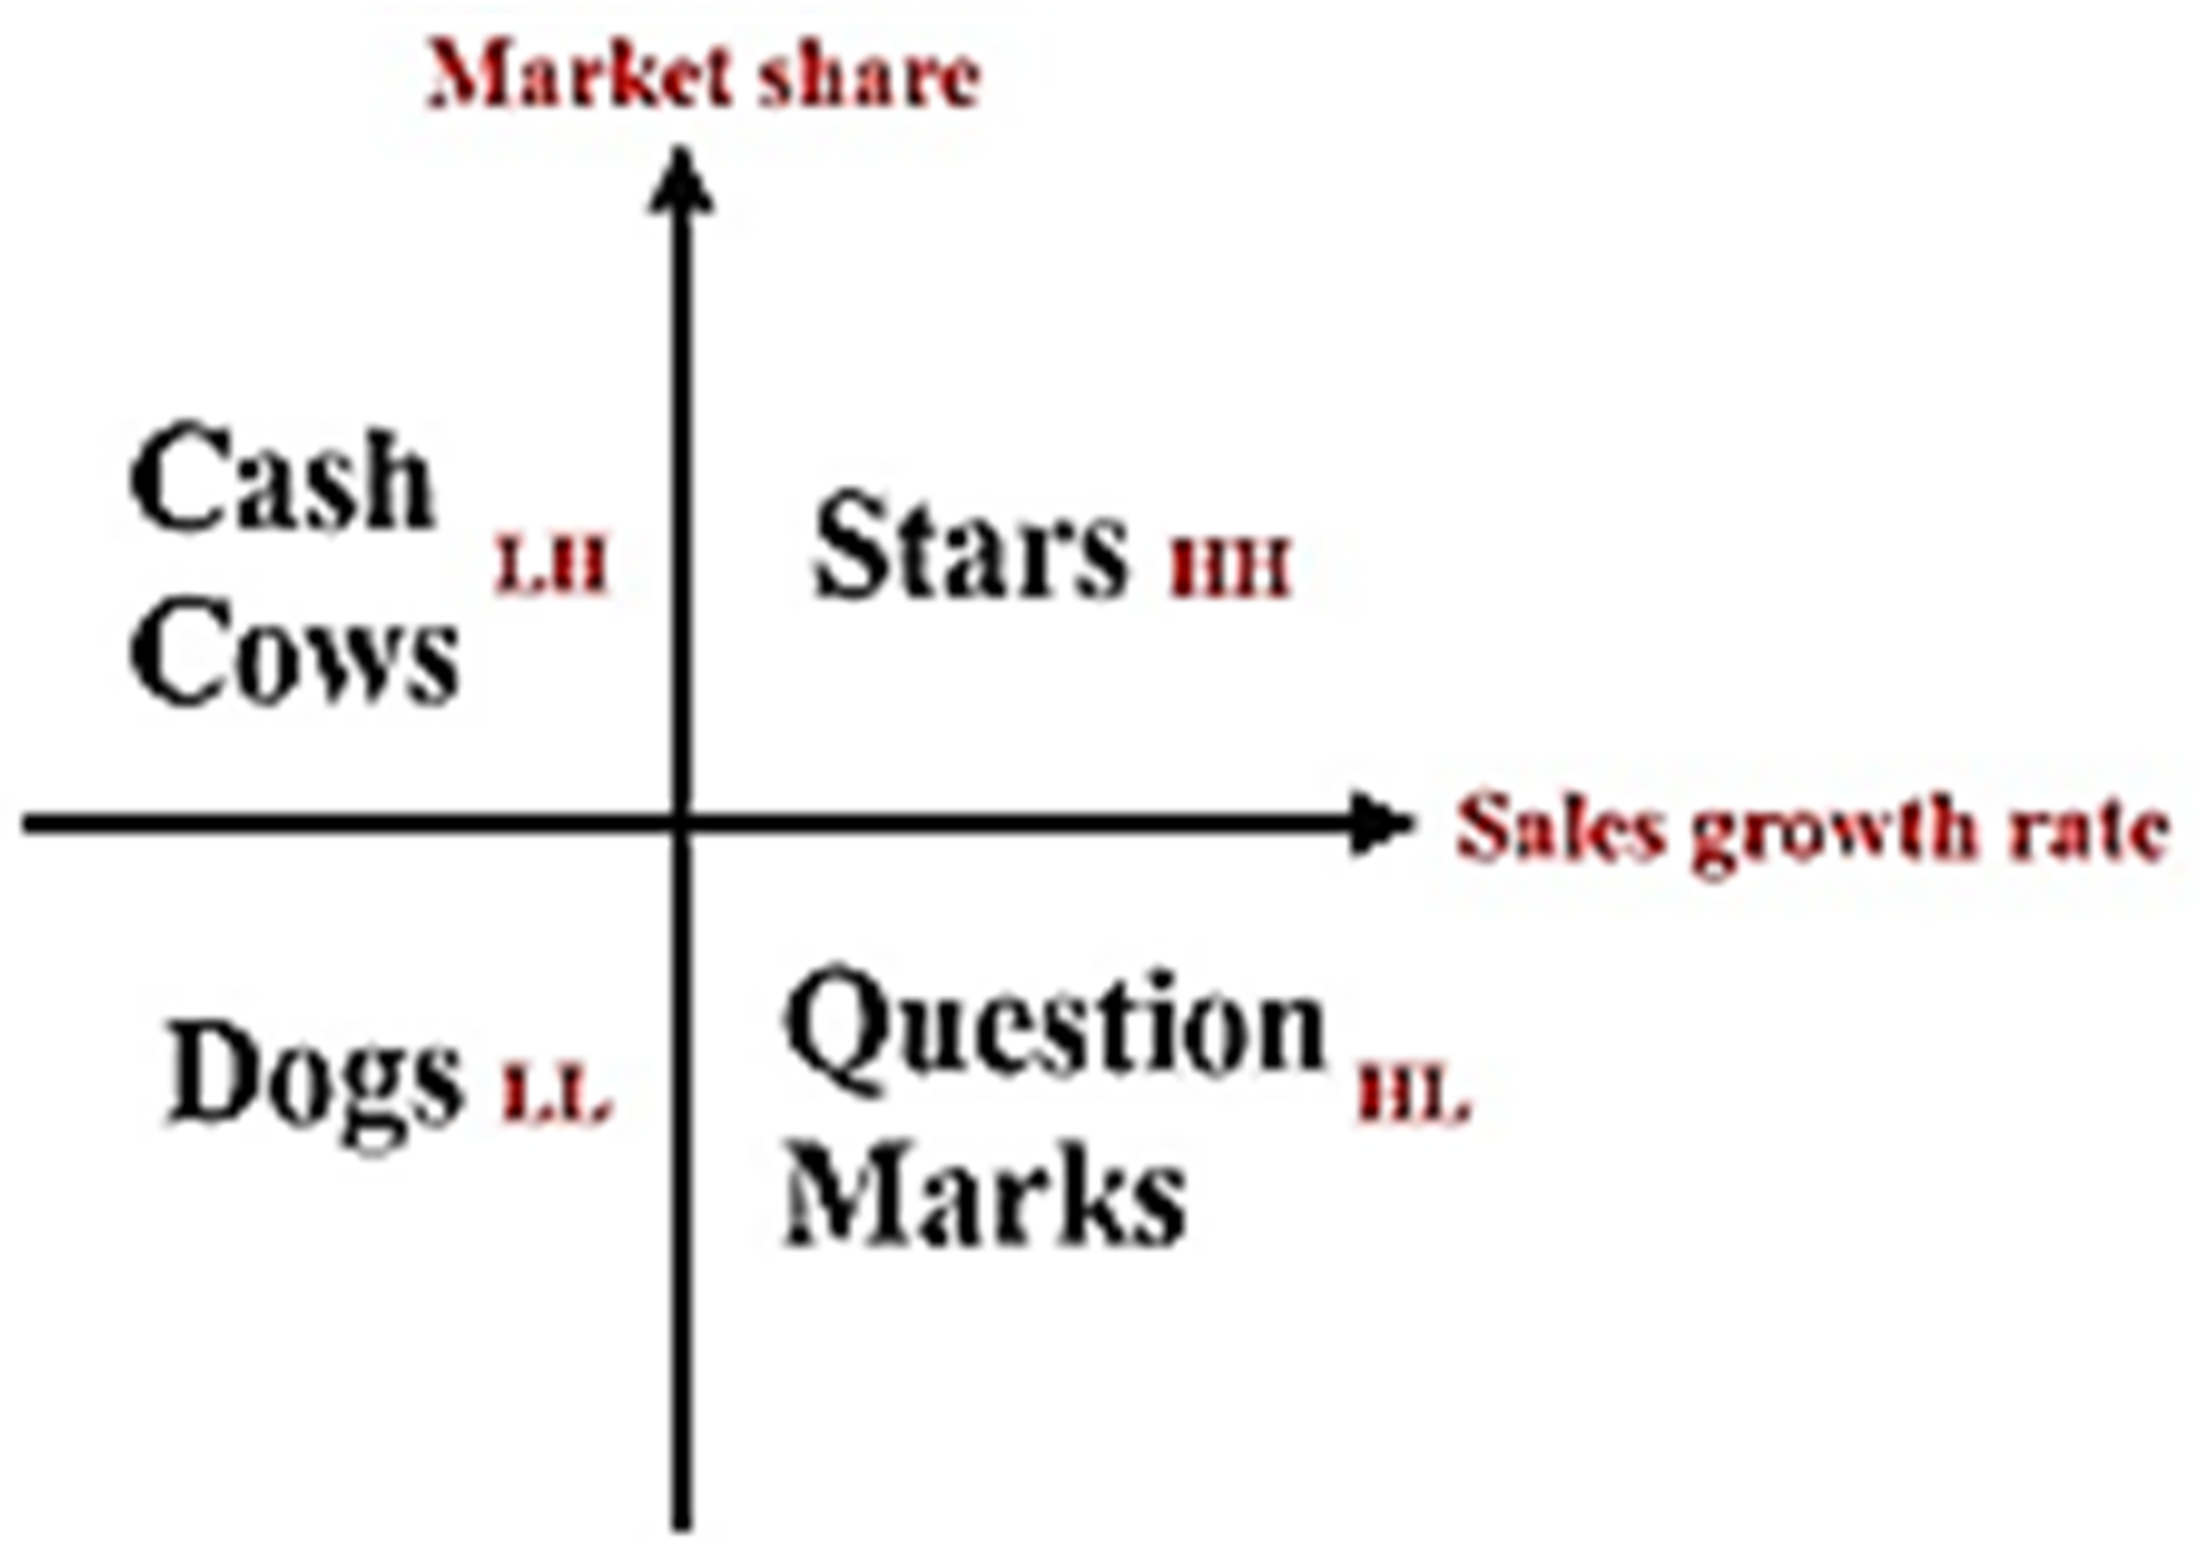
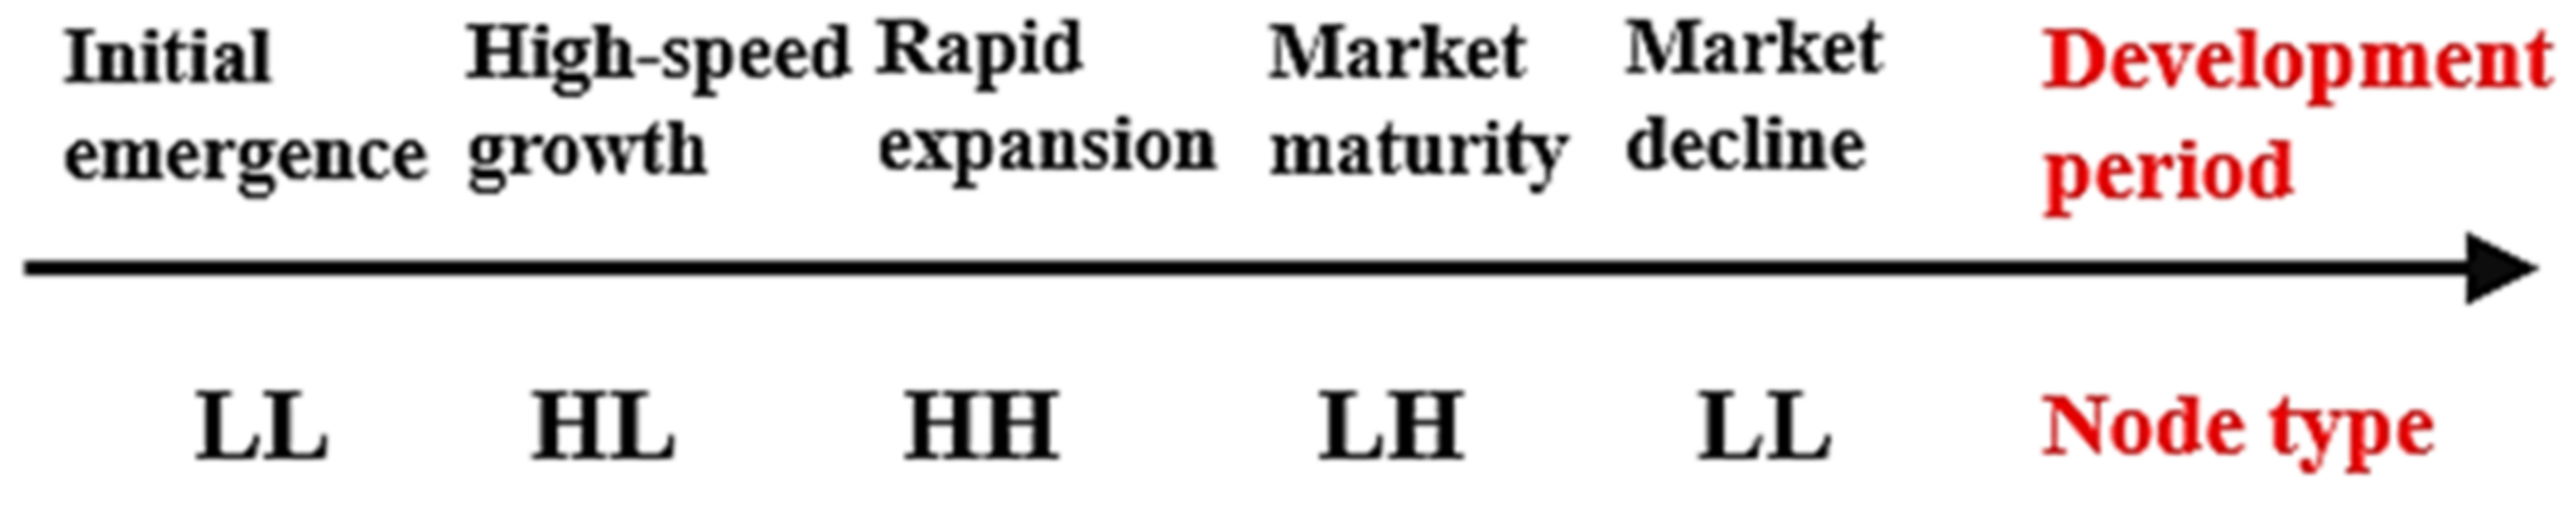
2.2.2. Modified Boston Matrix

The Boston Matrix states that sales growth rates and market share determine the quality of the product mix [39]. Product mix refers to the proportional relationship between the different types of products. Enterprises take different decisions through product mix to ensure that they eliminate products with no development prospects and optimize the allocation of surplus products to enhance their own competitiveness. Based on their combinations, four different types of products will be obtained: “stars,” with high sales growth rate and high market share; “question marks,” with high growth rate and low market share; “dogs,” with low growth rate and low market share; and “cash cows,” with low growth rate and high market share (Figure 1).
The enterprise inter-city investment network has similarities with this framework. A city node can be regarded as a certain product, and the entire inter-city investment network can be regarded as the market environment. In this context, the sustainable development prospect of a node in the investment network can be calculated as its centrality growth rate and relative centrality ratio [40], as follows:
G r o w t h   r a t e   o f   c e n t r a l i t y = C e n t r a l i t y   i n   c u r r e n t   p e r i o d / C e n t r a l i t y   i n   l a s t   p e r i o d 1 ;
A b s o l u t e   c e n t r a l i t y   s h a r e = C e n t r a l i t y   o f   c e r t a i n   n o d e / S u m   o f   a l l   n o d e s   c e n t r a l i t y ;
R e l a t i v e   c e n t r a l i t y   s h a r e = A b s o l u t e   c e n t r a l i t y   s h a r e / M a x i m u m   a b s o l u t e   c e n t r a l i t y   s h a r e .
By referring to the calculation formula of sales growth rate and relative market share, the evolution of dual indicators of urban nodes can be calculated by taking every decade as a stage (8 years after 2010). All nodes in the network are divided into four types: high centrality growth rate and high relative centrality ratio (HH), high centrality growth rate and low relative centrality ratio (HL), low centrality growth rate and high relative centrality ratio (LH), and low centrality growth rate and low relative centrality ratio (LL). The median value of the two indicators in each period is used to distinguish high and low values. Drawing on product life cycle theory (PLC) [41], the development of the product (node) in the market (network) is divided into five stages (Figure 2). At the beginning, the node enters the network because it takes time to receive information and therefore has little contact with other cities for a while. Therefore, its centrality growth rate and centrality share are both low and we call this stage ‘initial emergence’. Afterwards, the rapid establishment of connections with other regions leads to a high centrality growth rate, but the centrality share as a new node is still far below that of the key nodes; this stage is ‘high-speed growth’. Subsequently, due to the good growth trend, it gradually achieves more nodes in the network with the intention to connect, so it is able to further expand the centrality growth rate and centrality share; we regard this stage as ‘rapid expansion’. Finally, the centrality growth rate decreases due to the saturation of resources received and the development of other nodes, but the centrality share in the network is still high because the position is already solid; this stage we call ‘market maturity’. It is important to mention that a node that goes through these processes and ends up with low centrality growth rate and centrality share enters the ‘market decline’ phase.
The ‘cash cow’ refers to a product with low growth rate and high relative market share, which is the leader in the mature market and is a source of cash for the company. Because the market is mature, the company does not need to invest in it heavily to expand market size. As the market leader, ‘cash cow’ enjoys economies of scale and high marginal profitability, thus generating significant financial resources for the company. Companies often use the cash cow business to pay their bills and support three other cash-intensive products, so the ultimate goal of a company is to develop its products into a ‘cash cow’ to maintain its sustainability in the market. This classification can be used to explore the development potential of node cities in the investment network.
This study used ArcMap 10.4.1 to visualize the spatial pattern of inter-city investment, which can intuitively reflect the node distribution and the trend of spatial evolution.

3. Results and Discussions

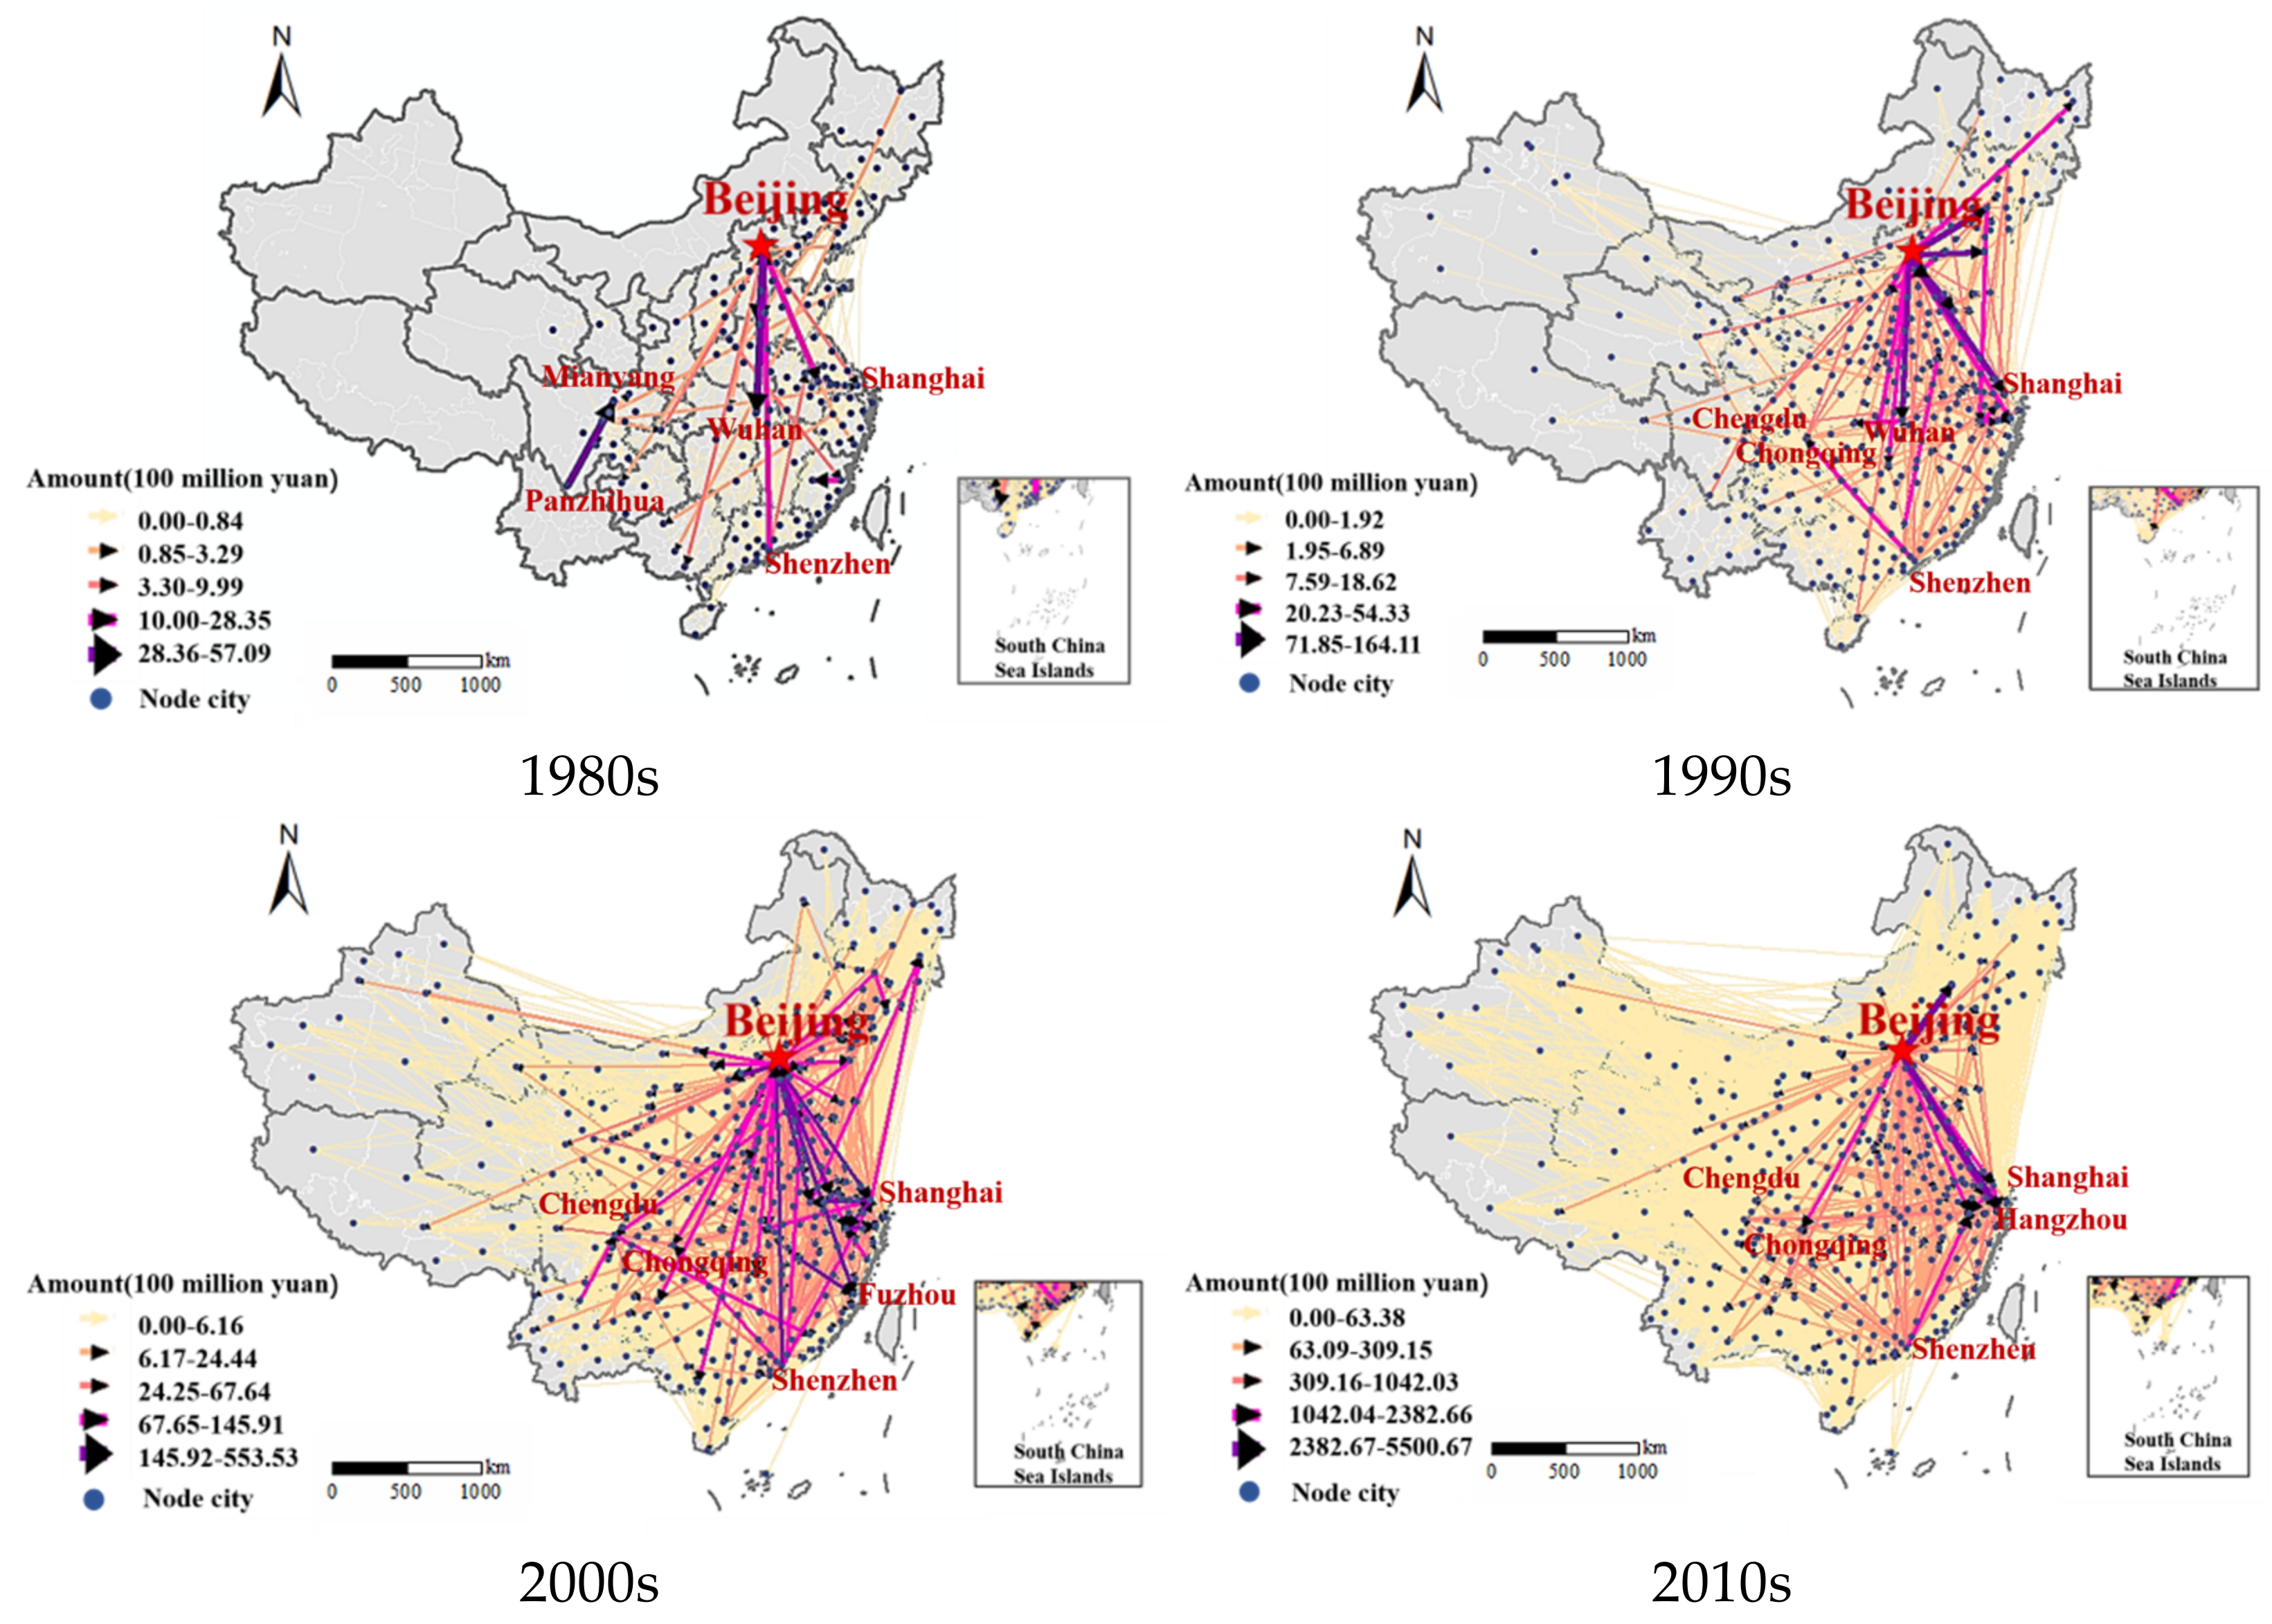
3.1. Spatio-Temporal Evolution of Inter-City Investment in China

In general, the trend in the number and amount of inter-city investment events since 1979 can be divided into three stages (Figure 3). The initial improvement stage is 1980–2000, after China’s Reform and Opening-Up. In this period, independent investment activities slowly increased with the gradual establishment of the market economy system. During the second stage, 2000–2013, an important factor that changed China’s industrial structure was Chinese accession to the WTO in 2000. Producer services exceeded the manufacturing industry and became China’s largest industry in terms of capital outflow. The rapid development stage was 2013–2017, when capital outflows from advanced production services such as finance and leasing business services further accelerated, accounting for approximately 75% of total investment outflows. In 2014, China’s State Council launched the “Guidance on Accelerating the Development of Productive Service Industry to Promote the Adjustment and Upgrading of Industrial Structure” 3, which promoted the transformation of China’s industrial structure from manufacturing-oriented to production service–oriented.
To present the spatial distribution of inter-city investment connections, the research period is divided into four stages to eliminate the impacts of abnormal years: 1980–1989, 1990–1999, 2000–2009, and 2010–2017 (Figure 4).
From 1980 to 1989, the overall corporate inter-city investment links were relatively infrequent and were primarily concentrated in southeast China. Most high-level investment links formed a pattern diverging to the south, with Beijing as the apex. The investment links between Panzhihua and Mianyang and between Fuzhou and Sanming were also strong due to manufacturing enterprises’ investment activities.
From 1990 to 1999, the overall inter-city investment network became denser. Compared with the previous decade, a considerable number of the western regions began to participate in investment activities. Beijing remained the center of high-level investment linkages, connecting Bohai Rim, the Yangtze River Delta, and the Triangle of Central China. This stage saw the initial formation of a “diamond-shaped” network with the four vertices of Beijing, Shanghai and Zhejiang, Shenzhen, and Chongqing.
From 2000 to 2009, Chinese inter-city corporate investment connections strengthened further, with the heavy involvement of the western regions in capital linkages. The quadrilateral network with Beijing, Shanghai, Shenzhen, and Chongqing as the apex stabilized further. Moreover, the strength of the Beijing–Shanghai and Beijing–Shenzhen links rank in the first echelon, as well as the links in some areas in the Yangtze River Delta. Besides, Chengdu also had many senior executives and connections during this period, occupying an important position in the Chinese inter-city investment network.
In the latest period from 2010–2017, most investment links were in the third level, and only a few of them were high-level links. This means that the general linkages were in a more stable situation. Beijing was the divergence point of high-level investment ties, while Shanghai, Zhejiang, and Shenzhen were also the most important capital exchange areas. As of 2017, all prefectural cities in the China mainland have participated in inter-city investment activities. The quadrilateral connection pattern with Beijing, Shanghai, Shenzhen, and Chongqing as the apex is clearly visible. However, the connection between Chengdu-Chongqing and the Pearl River Delta is weaker than the link between Beijing and Shanghai.

3.2. Spatio-Temporal Evolution Trend of Inter-City Corporate Investment Network

3.2.1. General Overview of Network Evolution

This paper uses Gephi 0.9.2 software to represent the evolving morphology of the Chinese corporate inter-city investment network (Figure 5). The approach directly illustrates that the network becomes denser and more aggregated as the number of nodes increases and their locations move closer. The capital, Beijing, is always in the key position, although Shanghai and Hangzhou City also become cores of the network with the passage of time. Meanwhile, more nodes become closer to each other and more concentrated, gradually forming a denser and more aggregated network through more frequent connections. There is also an increase in the number of network core nodes, while the number of edge nodes first increases and then decreases. This indicates that more cities become core nodes that are more connected with other nodes in the network, while edge nodes gradually enhance their importance and position in the network, growing closer to core node cities in the network by investing or receiving capital.
Meanwhile, the results for the overall indicators are in line with expectations (Table 2). In addition to the number of nodes and edges, the average centrality degree, density, and average clustering coefficient increased, proving that the inter-city investment network is growing denser and more aggregated. At the same time, the diameter, shortest path lengths, modularity, and number of modules declined, which demonstrates that the network has stronger accessibility and a higher degree of fusion.

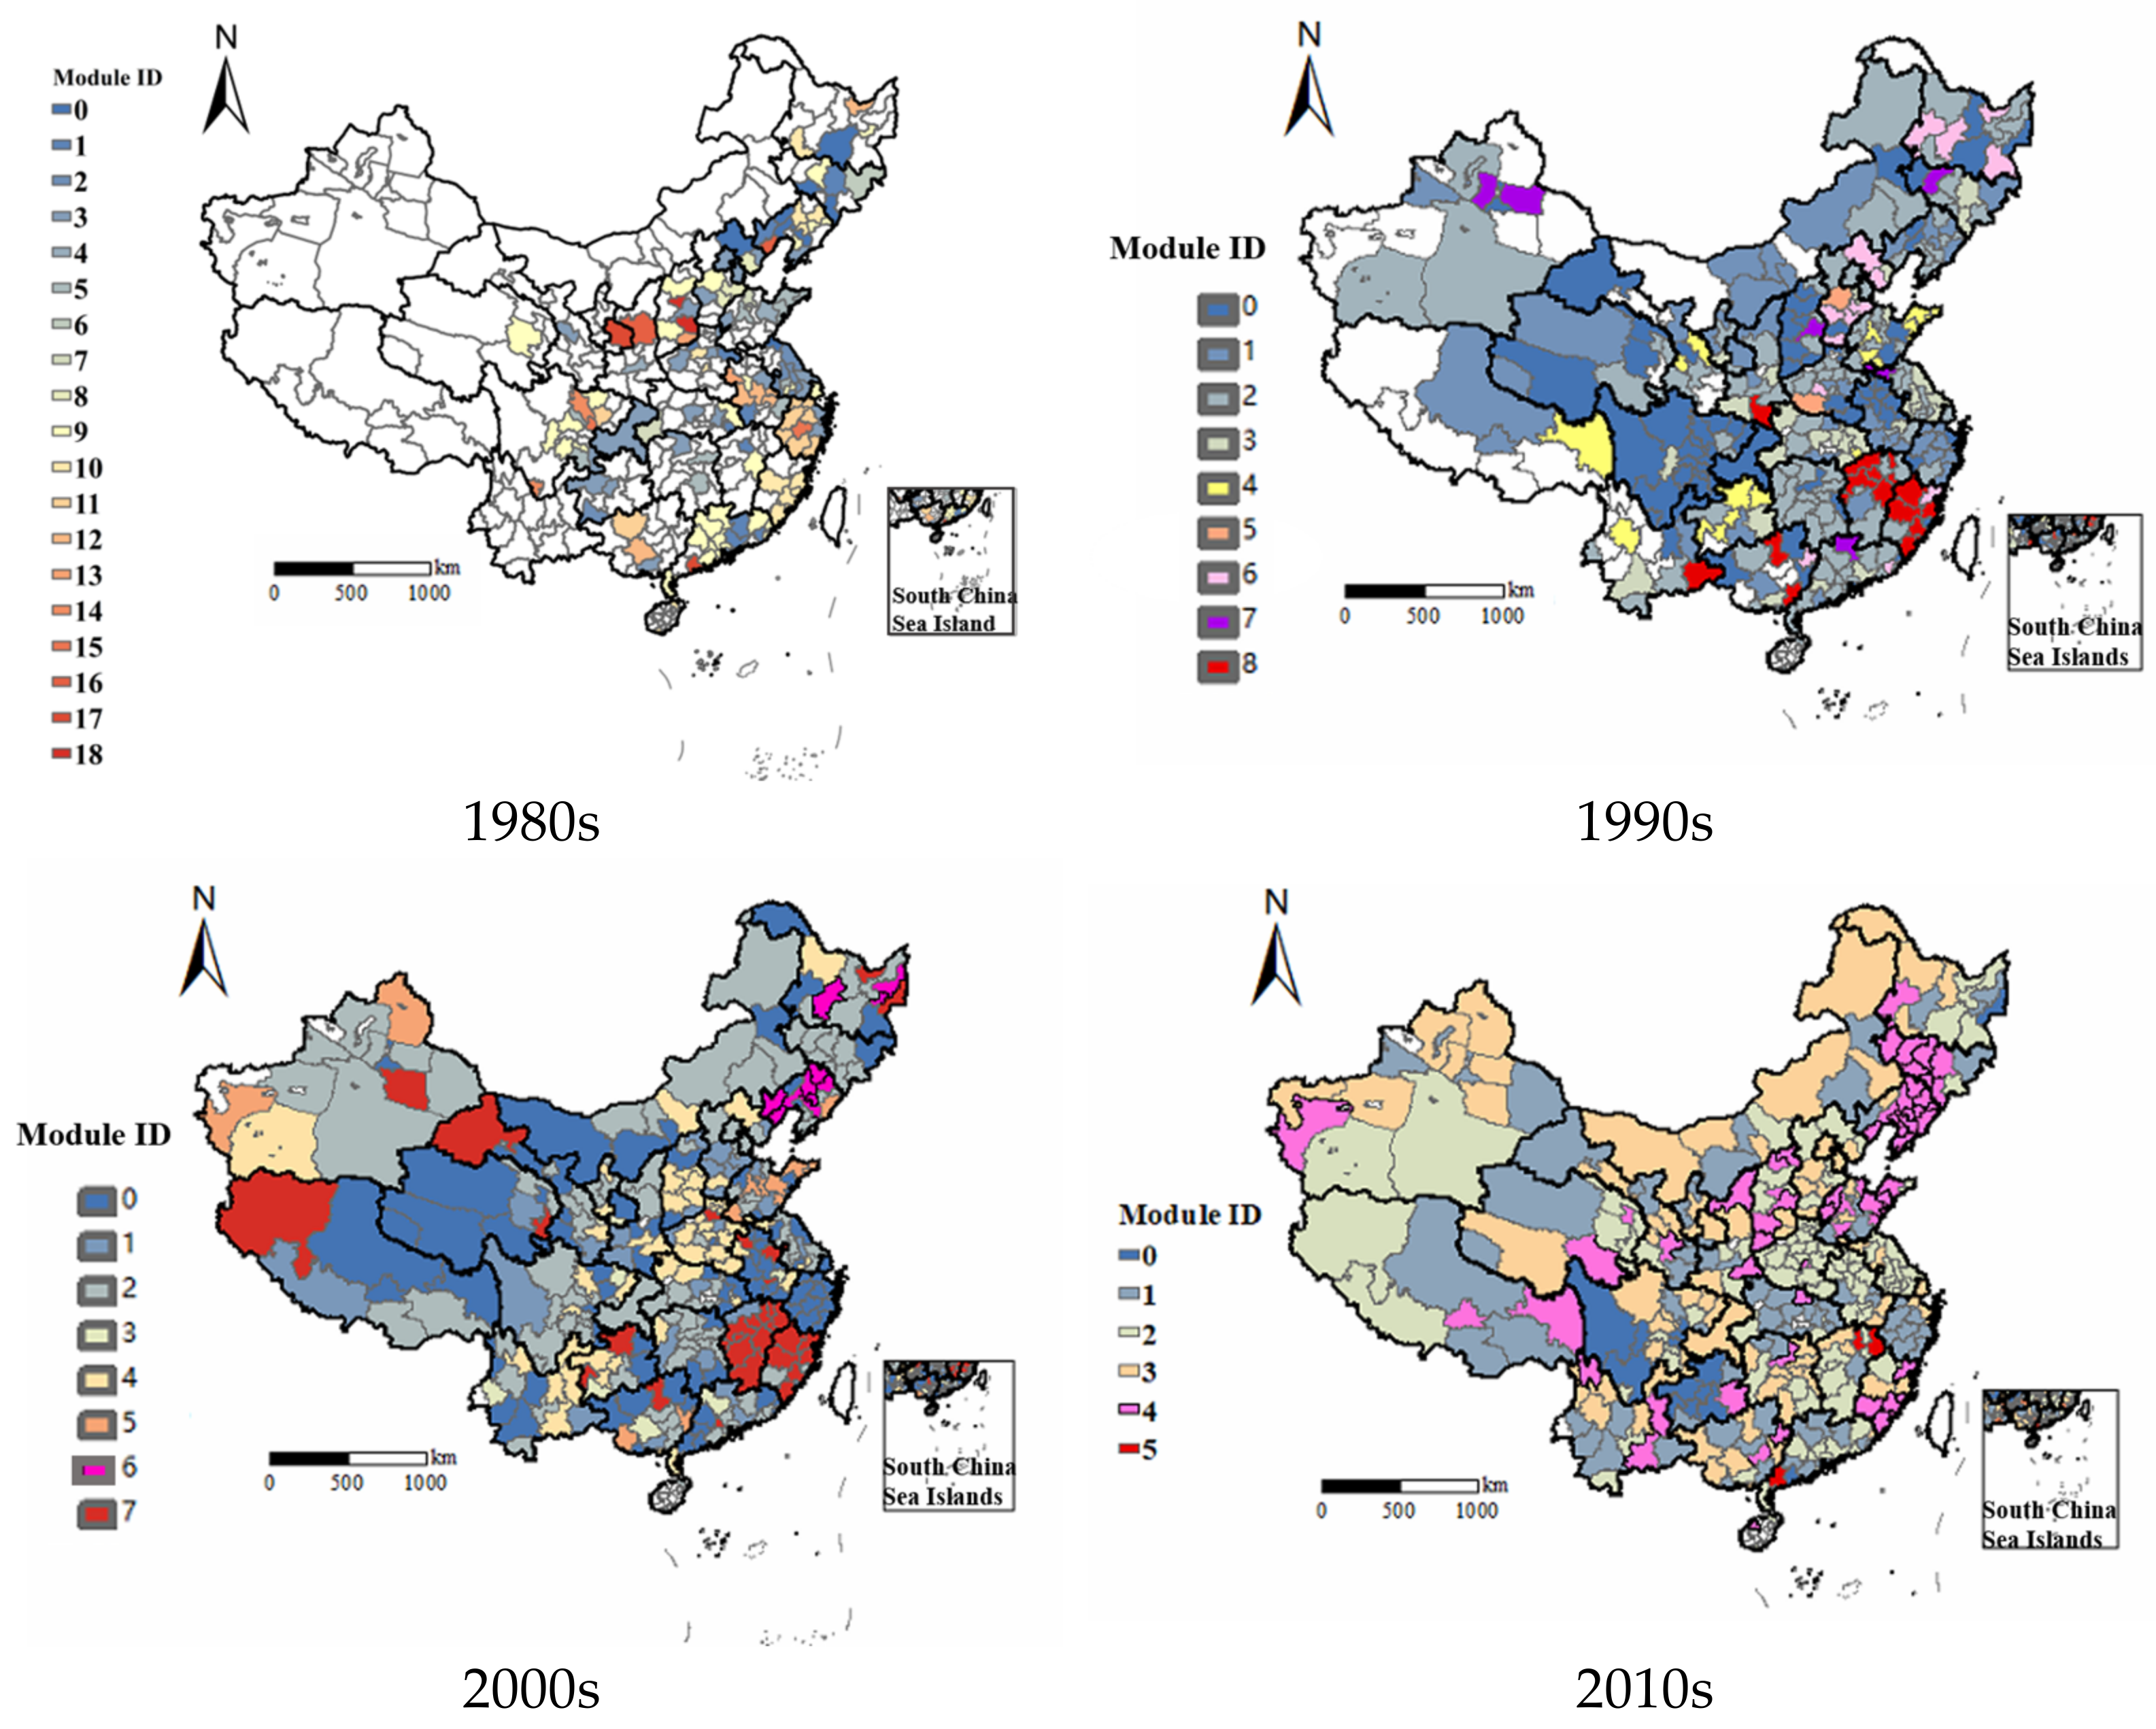
3.2.2. Module Evolution of Network

Modules divide areas where inter-city investment activities occur into different groups. Cities in the same module have stronger connections with each other, and a smaller number of modules reflects a more integrated network. From a macroscopic perspective, the module division of the Chinese corporate inter-city investment network presents a pattern of overall fragmentation and local agglomeration in space (Figure 6). Meanwhile, the number of modules decreases continually over time, which means that the number of areas belonging to the same module has increased, improving the overall regional integration of China. In addition, the distance of inter-city investment in space develops from the preference for neighboring provinces over long-distance investment.
The 1980s module division reflects four features: a relatively scattered distribution of modules, a large number of modules, the small scale of each module, and an insufficient scope of investment linkages. However, it is noteworthy that the prefecture-level cities of some provinces, such as Zhejiang province and Guangdong province, showed a strong preference for investing within the province.
In the 1990s, the total number of modules decreased and the scale of individual modules increased compared with the 1980s. In addition to frequent inter-city investment links within provinces, some neighboring provinces and cities began to form connections. This trend is more distinct in the southern region; for example, Chengdu–Chongqing, Guangdong province, and most prefecture-level cities in Hunan province are part of the same module.
During the 2000–2009 period, integration between neighboring provinces continued. For example, eastern Inner Mongolia in China is closely linked to Jilin and Heilongjiang. At the same time, some provinces reached their highest state of internal integration, such as Zhejiang province, where all prefecture-level cities belong to the same module. Similarly, Qinghai province, Fujian province, and most prefecture-level cities in Jiangxi province all increased their internal integration significantly compared to the previous decade. Moreover, Guangdong province began to diversify its investment destinations during this period. Intra-provincial capital flow is beneficial to avoid the constraints of policy barriers due to administrative factors. Also, it can reduce transaction costs, which has natural advantages. These reasons lead to the priority of intra-provincial investment over inter-provincial investment, and the provincial administrative boundaries become the division of corporate investment borders.
After 2010, the total number of modules decreased further, and inter-provincial integration became more integrated overall. The largest module contains the three bordering provinces: Henan, Anhui, and Jiangsu. Hubei province reached its highest level of internal integration in this period, while Zhejiang province remained strong in terms of internal integration. Jiangxi and Fujian are no longer part of the same module, while Guangdong province is further divided internally by modules. Compared to previous eras, the spatial distance range of heterogeneous investments increased as the phenomenon of neighboring provinces belonging to the same modules diminished. Throughout the timeline, the southeastern region is one step ahead of other regions in terms of overall integration as well as the diversification of investment destinations.

3.3. Spatio-Temporal Evolution Characteristics of Inter-City Investment Network Nodes

3.3.1. Nodes’ Positions in the Network

This paper uses betweenness centrality (BC) and closeness centrality (CC) to present the evolution of nodes’ positions in the network (seen in Section 2.2.1). Betweenness centrality reflects the transfer and connection capabilities of nodes; cities with a larger BC value have more power to control the flow of resources. Closeness centrality represents the spatial location advantages of nodes; cities with a larger CC value have more neighbor nodes and show stronger reachability in the network. In China, both indicators are administrative hierarchy- and economic development-oriented.
The top 30 city regions in four periods are selected for comparative analysis (Table 3, Table 4). The results indicate that the evolution of BC and CC values has the following typical features. First, BC values have evolved from a clear polarization phenomenon to a gradual balanced development, with the intermediary capacity of Beijing being gradually apportioned and weakened. Second, CC values have constantly increased, exhibiting a Beijing monopole pattern during the study period. Third, both BC and CC values have a clear economic and administrative hierarchical orientation. Fourth, the core–edge structure of the network has been weakened.
The distribution of the top 30 cities in BC value has evolved from the Beijing–Guangzhou and Beijing–Shanghai dual-core pattern in the 1980s and 1990s to a Beijing–Shanghai–Hangzhou one-pole, dual-core pattern after 2000. Beijing has been the largest resource center in China, and it has transferred and undertaken the largest investments. However, in terms of value, this ability of Beijing has been shared by other cities since 2010. This means that investment resources have become more mobile, and other regions are no longer absolutely dependent on Beijing to exchange information and capital. At the same time, the CC value has increased over the years, which illustrates that network accessibility continues to strengthen. Beijing has been the preferred neighbor node for other nodes in the network that occupy optimal network positions. Especially in the 2010s, Beijing had a CC value of 0.988, which is nearly 1. This means that it has established direct investment connections with nearly all the prefecture-level and above administrative regions in China in the inter-city investment network. Moreover, Shanghai and Shenzhen also have values above 0.9 at this stage, suggesting that more and more cities will reach the point of connecting with all other cities in the future.
In addition, more than half the top 30 cities in terms of BC value in each of the four decades are at the administrative level of provincial capitals or higher, especially after the 1990s, when the number exceeded 20. This indicates that the regional administrative level is hugely influential on investment connections. The remaining areas in the top 30 are primarily located in the eastern coastal provinces such as Jiangsu, Zhejiang, Guangdong, and Shandong, indicating that economic orientation also has a large impact on BC values. Meanwhile, the top 30 cities in terms of CC value have been largely fixed since the 1990s. In particular, it can be seen that the top 10 cities in the 2000s and 2010s are exactly the same, and they are all provincial capital and above cities. This indicates that the topmost structure of CC value in the network is fundamentally stable. Among the top 30 cities, the capitals of China’s five autonomous regions and the provincial capitals of Yunnan, Guizhou, Gansu, Qinghai, Heilongjiang, and Hainan provinces are never listed. The other cities above the sub-provincial level are generally in the top 30, while the remaining positions are occupied by economically developed southeastern coastal provinces, suggesting that the CC value is also influenced by both administrative rank and economy.
Moreover, the number of cities with the BC value of 0 continuously decreases from 93 in the 1980s to only 13 in the 2010s. This reflects that there are fewer node areas at the edge of the network, while more areas converge to the center of the investment network. The core–edge model of the whole network is gradually weakening.
Finally, it is anomalous that in the 1980s and 1990s, there are several cities with a CC value of 1 that nonetheless appear to be at the relative edge of the investment network, while the value of Beijing is smaller than 1. The reason for this phenomenon is that the node city and its directly connected neighbor nodes form an isolated “small world” that has no direct connection to the network’s other nodes. Thus, they themselves can be regarded as a completely linked small network. After verification, the cities with a CC value of 1 in the 1980s and 1990s all have only one investment record. Meanwhile, their neighbor nodes have no investment connection with the remaining node cities in the network. This phenomenon reveals that the inter-city investment network includes clear internal divisions and mutually fractured associations. Overall, the agglomeration effect of the network and its internal connectivity are poor in the last century. However, this problem improved in the 1990s; from then on, no more cities have CC values of 1, while the top 30 cities are all important nodes in line with expectations.

3.3.2. Nodes’ Potentials

This paper uses a modified Boston Matrix to classify nodes into four types and five growth stages in order to reflect the growth potentials of nodes in the network (see Section 3.2.2). From the quantitative statistics (Table 5), the proportion of the low–low and high–high types decreased over time, while the proportion of the low–high and high–low types increased. More than 70% of nodes belonged to the low–low type and high–high type before 2000, while the proportion of the four types of nodes tends to be balanced after that year. This indicates that the node development structure of Chinese enterprises’ inter-city investment network has stabilized.
Overall, the node types and development stages are stronger in the east than in the west (Figure 7). Apart from Beijing, Shenzhen, Hangzhou, and other nodes that were in the mature stage of the market from the beginning, most nodes developed in an orderly manner toward the next stage over time, while a few nodes exhibited declining development.
Nodes in the market maturity stage are mostly located in cities with high administrative levels, economically developed regions, and coastal areas. They represent leaders with a high status in the network that occupy stable market shares and have the ability to drive other regions’ development. Nodes in the rapid expansion stage migrated from the eastern coastal region to the central region in the 1990s, while their administrative levels also changed from provincial capital cities to ordinary low-level cities. Provincial capital city nodes are located in relatively economically underdeveloped provinces, such as Kunming, Lhasa, and Yinchuan. These types of nodes have great potential, and they are suitable for continued expansion to further develop into a mature market node. Moreover, most of the nodes in the high-speed growth stage are located in the western and northern regions, indicating that these regions have great market potential in the inter-city investment network. However, they are still at the edge of the network and are relatively lacking in competitiveness; as such, it is necessary to continue implementing national strategies such as western development to expand their market share. There are two development stages of low–low nodes: initial emergence and market decline. Their distribution was relatively scattered in the 1990s, but they have been more concentrated in the western and northeastern regions since 2000. Most of the nodes of this type were developing toward the later stage. However, in the 2010s, some areas in Inner Mongolia, the northeast, and Guangxi and Guangdong provinces showed signs of market decline and faced marginalization by the network.

4. Conclusions

This study focuses on the long-term spatio-temporal evolution of the inter-city corporate investment network from 1980–2017 in China. The findings of the paper are as follows:
(1)
Before 2000, Chinese corporate inter-city investment experienced an initial improvement, with a slight increase in the size and number of investments. Then, investments experienced steady progress from 2000 to 2013 and rapid development—with both more investments and larger investments—after 2013. The capital flow of producer service enterprises contributes most to the increase in investments. Spatially, the linkages of Chinese corporate inter-city investments gradually extended to the whole country, displaying a diamond shape structure whose vertices are Beijing, Shanghai, Shenzhen, and Chongqing.
(2)
The Chinese corporate inter-city investment network has become denser and more aggregated since the number of nodes has increased and the average distance between nodes has decreased. Meanwhile, the whole network has more accessibility and a higher degree of fusion. Spatially, the inter-city corporate investment network is composed of multiple modules whose number has continually decreased; this means that each module includes more areas and that regional integration has grown over time. The modules’ evolution presents a situation of overall fragmentation and partial agglomeration. The southeast region is one step ahead of the other regions in terms of regional integration and the diversification of investment destinations. Finally, the distance of inter-city investment in space reflects the preference for neighboring provinces over long-distance investment.
(3)
The nodal city’s ability to control resources underwent a transition from obvious polarization to gradual, balanced development. In particular, the Beijing–Guangzhou and Beijing–Shanghai dual-core pattern prevailed in the 1980s and 1990s, while the Beijing–Shanghai–Hangzhou one-pole, dual-core pattern dominated after 2000. Nodal reachability in the network followed the Beijing one-pole pattern during the study period. Both of the above two nodal abilities show strong orientation at administrative hierarchy and economic development, as the top 30 cities listed are mostly above the provincial capital level and are in developed areas along the eastern coast. Meanwhile, the core–edge pattern of the network has gradually weakened.
(4)
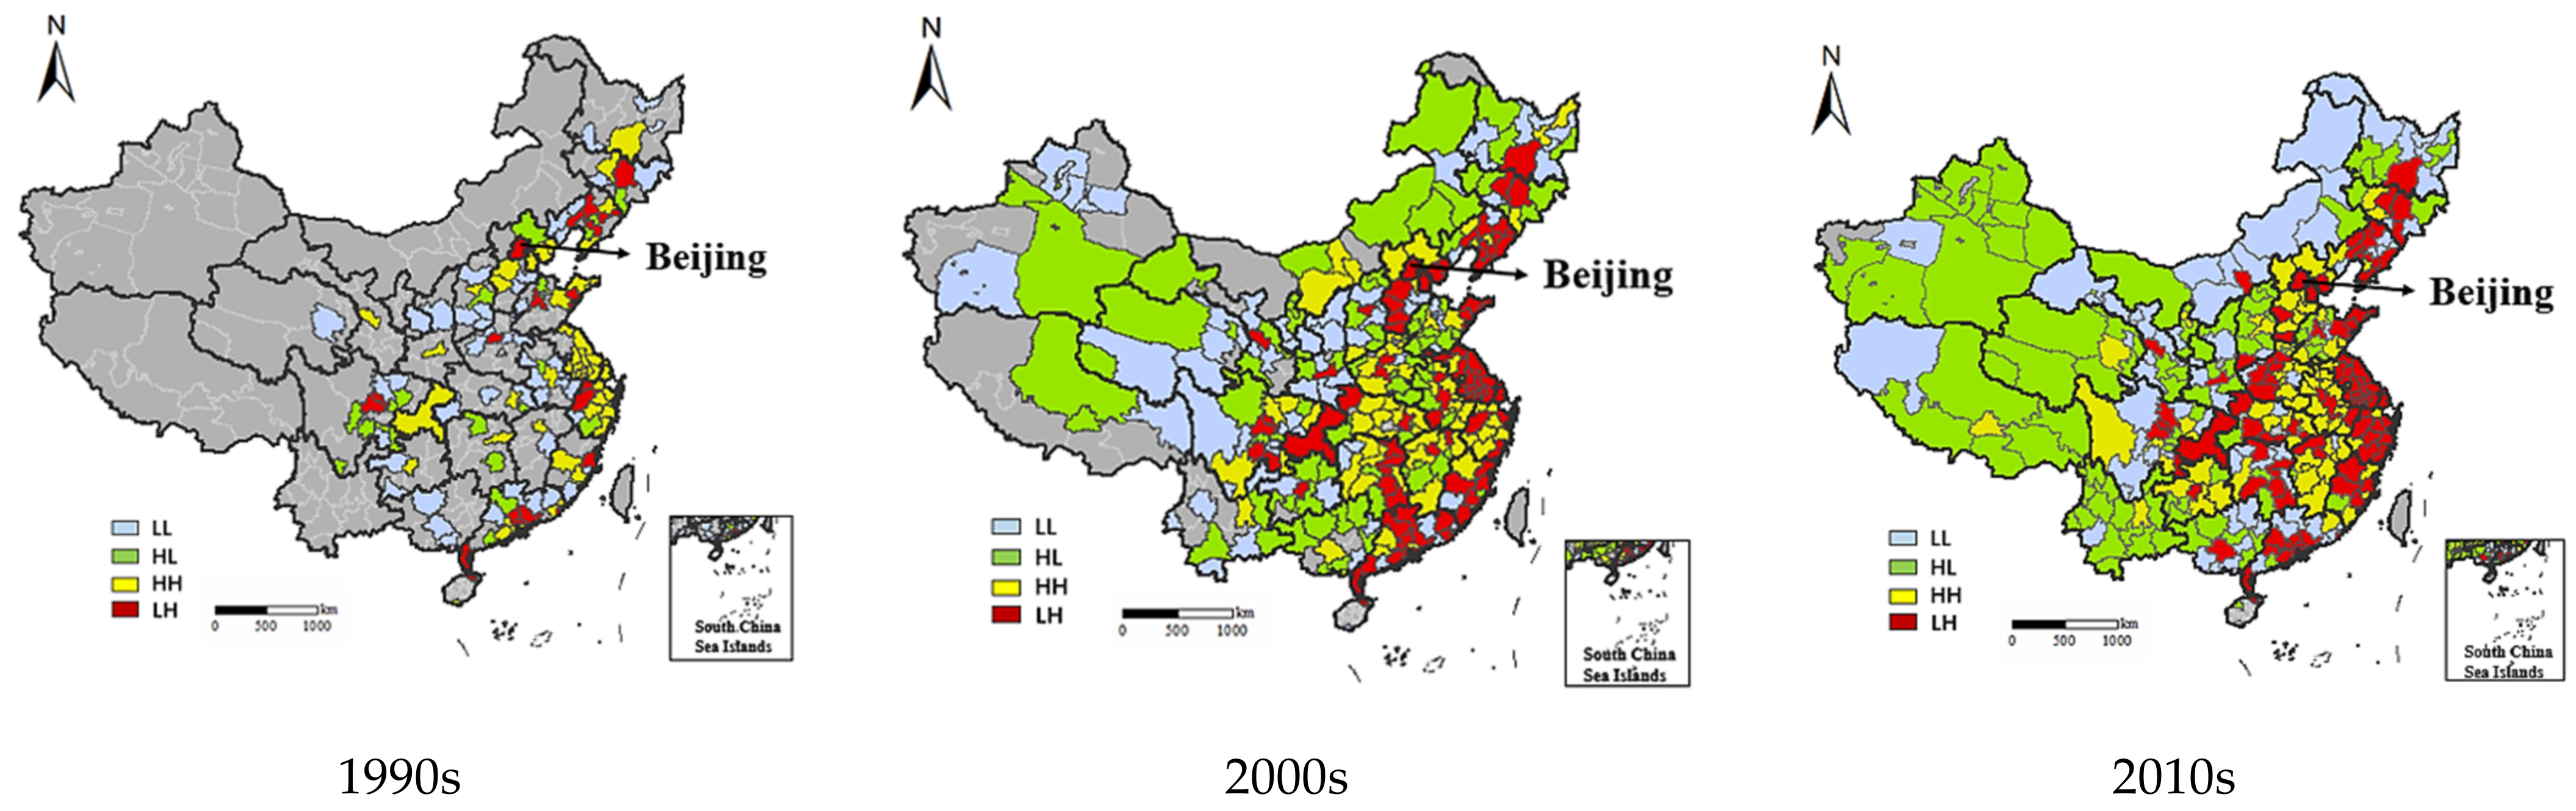
The node type structure of Chinese enterprises’ inter-city investment network has tended to develop steadily since 2000. Overall, node types and development stages are stronger in the east than in the west. Except for Beijing, Shenzhen, Hangzhou, and other nodes that were in the mature stage of the market from the beginning, most of the nodes developed in an orderly manner toward the next stage over time, while a few nodes were in the declining development stage.
Compared with most existing studies, which are interested in central cities, productive service industries, and the short-term evolution of urban networks since 2000, this paper focuses on long-term evolution and covers all city regions at the prefecture level and above, along with all types of enterprises. It thus completely characterizes the capital flow, network structure, module distribution, node status, and node types of Chinese enterprises’ inter-city investment using spatial distribution, statistics, and topological relationships. It reveals the changes of Chinese enterprises’ inter-city investment network and nodes in different periods in the dual context of administrative hierarchy and economic development.
These results have certain policy implications. This paper demonstrates the process by which inter-city enterprises’ connections have grown closer and their networks better developed. In the long run, the inter-city investment network will be further improved. Therefore, all city regions should actively strive to improve their positions, driving more regions to realize a coordinated regional development path established through investment linkages. In the network, their goals are to move closer to the key nodes or even eventually become the key nodes. This paper also identifies enterprise network patterns in different urban areas, providing a reference for different urban areas to develop their own strategies. Moreover, the government can stimulate enterprises in inactive regions to obtain startup capital by establishing a sound mechanism to quickly establish investment ties with other regions and revitalize local and foreign businesses. Areas with a high growth rate must further increase their investment partners and expand their influence in the market. Meanwhile, mature areas must play a leadership role by actively exploring more investment channels in order to drive the development of the other three types of areas. Finally, for areas of declining status, it is rational for enterprises to consider whether to continue to make additional investments or withdraw in a timely way. However, for the government, they should consider how to make regions develop well in the long term. Not only investments should be taken into consideration, but also making policies to promote innovation, bringing in talent, guaranteeing basic social welfare, etc.
This paper has two limitations that can motivate future studies. First, the industry of enterprises has not been subdivided. Different industries may have different investment preferences or paths, which will affect the overall network structure. Second, the mechanism of network evolution has not been revealed. Future studies could explore whether firms have path dependence or preference attachment mechanisms for inter-city investment.

Author Contributions

Conceptualization, S.X. and B.S.; methodology, S.X.; software, S.X.; writing—original draft preparation, S.X.; writing—review and editing, S.X. and B.S.; visualization, S.X.; supervision, B.S. All authors have read and agreed to the published version of the manuscript.

Funding

This research was funded by the National Natural Science Foundation of China No. 42071210 and the Fundamental Research Funds for the Central Universities No.2022ECNU-XWK-XK001.

Data Availability Statement

Not applicable.

Acknowledgments

The authors would like to acknowledge all of the reviewers and editors.

Conflicts of Interest

The authors declare no conflict of interest.

Notes

1
The relevant research report (https://www.risi-cpps.com/, accessed on 6 July 2021) shows that the regions with the largest number of listed companies in China since 1990 are Jiangsu, Zhejiang, Guangdong, as well as Beijing, Shanghai and Shenzhen. These regions are with high economic and administrative level.
2
We define market decline as a node that is of type LL in the current period and was of type HL, HH, or LH in the previous period.
3

References

  1. Christaller, W. References. In Die Zentralen Orte in Süddeutschland; Chang, Z., Wang, X., Eds.; The Commercial Press: Beijing, China, 2010; ISBN 9787100072434. [Google Scholar]
  2. Sun, W.; Liu, S. The Third Revolution of Science and Technology and the Historical Destiny of Socialism. Bridge Century 1999, 2, 27–29. [Google Scholar] [CrossRef]
  3. Graham, S.; Marvin, S. Splintering Urbanism: Networked Infrastructures, Technological Mobilities and the Urban Condition; Routledge: London, UK, 2001; ISBN 0-415-18964-0. [Google Scholar]
  4. Castell, M. The Rise of the Network Society; Wilety- Blackwell: Oxford, UK, 2001; ISBN 9780631221401. [Google Scholar]
  5. Batten, D.F. Network Cities: Creative Urban Agglomerations for the 21st Century. Urban Stud. 1995, 32, 313–327. [Google Scholar] [CrossRef]
  6. Indraprahasta, G.S.; Derudder, B. The geographically variegated connections of the Jakarta metropolitan area as produced by manufacturing firms. Growth Chang. 2019, 50, 705–724. [Google Scholar] [CrossRef]
  7. Jiao, J.; Wang, J.; Jin, F.; Wang, H. Impact of high-speed rail on inter-city network based on the passenger train network in China, 2003–2013. Acta Geogr. Sin. 2016, 71, 265–280. [Google Scholar] [CrossRef]
  8. Derudder, B.; Witlox, F. On the use of inadequate airline data in mappings of a global urban system. J. Air Transp. Manag. 2005, 11, 231–237. [Google Scholar] [CrossRef]
  9. Wang, L.; Hong, Y. Spatial structure of container port systems across the Taiwan Straits under the direct shipping policy: A complex network system approach. Acta Geogr. Sin. 2015, 71, 605–620. [Google Scholar] [CrossRef]
  10. Tranos, E.; Gillespie, A. The Urban Geography of Internet Backbone Networks in Europe: Roles and Relations. J. Urban Technol. 2011, 18, 378–392. [Google Scholar] [CrossRef]
  11. Friedmann, J. The world city hypothesis. Dev. Chang. 1986, 17, 69–83. [Google Scholar] [CrossRef]
  12. Alderson, A.S.; Beckfield, J. Power and position in the world city system. Am. J. Sociol. 2004, 109, 811–851. [Google Scholar] [CrossRef] [Green Version]
  13. Sassen, S. The Global City: New York, London, Tokyo, 1st ed.; Princeton University Press: New York, NY, USA, 1991; ISBN 9780691070636. [Google Scholar]
  14. Taylor, P.J. World City Network: A Global Urban Analysis; Routledge: London, UK, 2003; ISBN 9780203634059. [Google Scholar]
  15. Taylor, P.J.; Derudder, B.; Faulconbridge, J.; Hoyler, M.; Ni, P. Advanced producer service firms as strategic networks, global cities as strategic places. Econ. Geogr. 2014, 90, 267–291. [Google Scholar] [CrossRef]
  16. Meyer, D.R. Shenzhen in China’s Financial Center Networks. Growth Chang. 2016, 47, 572–595. [Google Scholar] [CrossRef]
  17. Godfrey, B.J.; Zhou, Y. Ranking world cities: Multinational corporations and the global urban hierarchy. Urban Geogr. 1999, 20, 268–281. [Google Scholar] [CrossRef]
  18. Coe, N.; Dicken, P.; Hess, M.; Yeung, H.C.W. Making connections: Global production networks and world city networks. Glob. Netw. 2010, 10, 138–149. [Google Scholar] [CrossRef]
  19. Mans, U. Understanding the position of end nodes in the world city network: Using peer city analysis to differentiate between non-hub cities. Glob. Netw. A J. Transnatl. Aff. 2013, 14, 188–209. [Google Scholar] [CrossRef]
  20. Taylor, P.J.; Ni, P.; Derudder, B.; Hoyler., M.; Huang, J.; Witlox, F. Global Urban Analysis: A Survey of Cities in Globalization; Earthscan: London, UK, 2011. [Google Scholar]
  21. Taylor, P.J.; Derudder, B.; Hoyler, M.; Ni, P.; Witlox, F. City-Dyad Analyses of China’s Integration into the World City Network. Urban Stud. 2013, 51, 868–882. [Google Scholar] [CrossRef] [Green Version]
  22. Wang, C.; Sheng, K.; Zhang, J. Dynamics and Determinants of the Core-Periphery Structure of Urban Network in China: A Study based on the Corporate Network of Manufacturing. J. Geo-Inf. Sci. 2022, 24, 141–152. [Google Scholar] [CrossRef]
  23. Wen, H.; Zhang, Q.; Su, X. Study on the city network based on value chain decision of Chinese film industry. Hum. Geogr. 2019, 34, 97–104. [Google Scholar] [CrossRef]
  24. Verbeek, T.; Mah, A. Integration and Isolation in the Global Petrochemical Industry: A Multiscalar Corporate Network Analysis. Econ. Geogr. 2020, 96, 363–387. [Google Scholar] [CrossRef]
  25. Liu, Z.; Shen, L.; Cui, Z. Network characteristics of Chinese cultural and creative industries: Based on investment links. Econ. Geogr. 2021, 41, 113–120. [Google Scholar] [CrossRef]
  26. Jin, X.; Hu, G.; Ding, H.; Ye, S.; Lu, Y.; Lin, J. Evolution of spatial structure patterns of city networks in the Yangtze River Economic Belt from the perspective of corporate pledge linkage. Growth Chang. 2020, 51, 833–851. [Google Scholar] [CrossRef]
  27. Wang, M.; Wei, Y.; Qiu, J. Spatial Agglomeration and Urban Network of Venture Capital Investment in China. J. Financ. Econ. 2014, 40, 117–131. [Google Scholar] [CrossRef]
  28. Pan, F.; Zhao, S.X.B.; Wojcik, D. The rise of venture capital centres in China: A spatial and network analysis. Geoforum 2016, 75, 148–158. [Google Scholar] [CrossRef] [Green Version]
  29. Cao, X.; Zeng, G.; Teng, T.; Si, Y. The best spatial scale of firm innovation networks: Evidence from Shanghai high-tech firms. Growth Chang. 2018, 49, 696–711. [Google Scholar] [CrossRef]
  30. Pan, F.; Bi, W.K.; Lenzer, J.; Zhao, S. Mapping urban networks through inter-firm service relationships: The case of China. Urban Stud. 2017, 54, 3639–3654. [Google Scholar] [CrossRef]
  31. Zhao, M.; Liu, X.; Derudder, B.; Zhong, Y.; Shen, W. Mapping producer services networks in mainland Chinese cities. Urban Stud. 2015, 52, 3018–3034. [Google Scholar] [CrossRef]
  32. Yeh, A.G.; Yang, F.; Wang, J. Producer service linkages and city connectivity in the mega-city region of China: A case study of the Pearl River Delta. Urban Stud. 2015, 52, 2458–2482. [Google Scholar] [CrossRef]
  33. Gao, P.; Ning, Y.; He, D. Spatial Evolution and Interaction Effects of Multi-scalar Urban Networks in the Yangtze River Delta. Sci. Geogr. Sin. 2022. Available online: https://kns.cnki.net/kcms/detail/22.1124.P.20221020.1644.002.html (accessed on 25 December 2022).
  34. Qian, X.; Sun, B. The spatial structures and organization patterns of China’s city network based on inter-city startup investments. Geogr. Res. 2021, 40, 419–430. [Google Scholar] [CrossRef]
  35. Sheng, K.; Yang, Y.; Sun, W. Determinants and mechanisms of degree centrality in the urban network in China: A study based on corporate networks of the largest 500 listed companies. Prog. Geogr. 2019, 38, 248–258. [Google Scholar] [CrossRef]
  36. Ning, Y. Some issues of urban network optimization under the conditions of market economy. Urban Probl. 1993, 3, 2–6. [Google Scholar]
  37. Gao, P.; He, D.; Ning, Y. Characterizing functionally integrated regions in the Central Yangtze River Megaregion from a city-network perspective. Growth Chang. 2020, 51, 1357–1379. [Google Scholar] [CrossRef]
  38. Jin, Y.; Wang, W.; Xi, Y. Structure and evolution of Venture Capital Network in China. J. Syst. Manag. 2021, 30, 40–53. [Google Scholar] [CrossRef]
  39. Zhao, J. Application of Boston Matrix analysis in real cases. China High-Tech Enterp. 2008, 8, 25. [Google Scholar] [CrossRef]
  40. Wang, J.; Wang, R. Analysis of Dynamical Evolution of Scientific Collaboration Networks Among Countries Along the “the Beltand Road Initiative” from 1996 to 2015. Libr. Inf. Serv. 2017, 61, 76–83. [Google Scholar] [CrossRef]
  41. He, B.; Wang, J.; Huang, S.; Wang, Y. Low-carbon product design for product life cycle. J. Eng. Des. 2015, 26, 321–339. [Google Scholar] [CrossRef]
Figure 1. Schematic diagram of Boston Matrix.
Land 12 00204 g001
Figure 2. Type and period classification of node cities 2.
Land 12 00204 g002
Figure 3. Chinese inter-city investment from 1979 to 2017.
Land 12 00204 g003
Figure 4. Spatial distribution of inter-city investment connections in four periods.
Land 12 00204 g004
Figure 5. Form of corporate inter-city investment network in the 1980s, 1990s, 2000s, and 2010s.
Land 12 00204 g005
Figure 6. Module division of the corporate inter-city investment network in the 1980s, 1990s, 2000s, and 2010s.
Land 12 00204 g006
Figure 7. The spatial distribution of Chinese inter-city network nodes’ potentials in the 1990s, 2000s, and 2010s.
Land 12 00204 g007
Table 1. An overview of social network analysis indicators.
IndexFormulaDefinitionFunction
Centrality degree (DC)
D C = i = 1 ; j = 1 ; i j N n i , j N 1
the sum of direct contacts sent and received by nodesreflects the status and radiation capacity of nodes
Betweenness centrality (BC)
B C = j = 1 ; k = 1 ; j k i N N j k i N j k  
the number of shortest paths through the node between all pairs of nodesreflects each node’s ability to transfer and control resource elements
Closeness centrality (CC)
C C = 1 i = 1 ; j = 1 ; i j N d i j
the sum of all shortest paths of any two nodes in the networkreflects location advantages of nodes in the network
Clustering coefficient
C i = 2 e i k i k i 1
the probability that the neighboring nodes of a node are also neighbors of each other reflects the internal aggregation capability of the network
Density
D = i = 1 N j = 1 N n i , j N N 1
ratio of the actual number of connections between nodes to the maximum number of possible connectionsreflects the development situation of the network
Diameter
D = max i j d i , j
maximum value of the distance between any two nodes in the networkreflects the transmission performance and efficiency of the network to resource elements
Shortest path lengths
L = 1 N N 1 i j d i j
average shortest distance between all pairs of nodes in the network
Modularity
Q = v = 1 n c [ l v M ( d v 2 M ) 2 ]
some nodes in the network are closely connected with each other but loosely connected with other nodes; nodes that gather together can be regarded as a modulereflects the status of module division within the network
Note: 1. For Formulas (1)–(7), N represents the total sum of nodes; n i , j   represents the number of connections between i and j; N j k represents the number of shortest paths between j and k; N j k I represents the number of shortest paths between nodes j and k via node i; d i j represents the shortest distance from i to j; d i , j represents the distance between i and j; e i   represents the number of direct connections with i; k i represents the number of edges owned by i. 2. In Formula (8), n c is the number of communities that need to be calculated in the investment network, M represents the number of edges in the entire investment network,   L v is the total number of edges in community v, and d v is the total investment of all cities in community v.
Table 2. Overall indicators of enterprise inter-city investment network.
1980–19891990–19992000–20092010–2017
Number of nodes140303335338
Edges2302233781417851
Average centrality degree1.6437.3723.32552.97
Density0.0120.0240.070.158
Diameter9643
Shortest path lengths3.3762.6982.1041.867
Average clustering coefficient0.0650.3320.450.562
Modularity 0.5660.5290.3640.311
Table 3. Betweenness centrality value of top 30 areas.
1980–19891990–19992000–20092010–2017
RankCityBCCityBCCityBCCityBC
1Beijing0.161Beijing0.236Beijing0.195Beijing0.089
2Guangzhou0.113Shanghai0.173Shanghai0.122Shanghai0.075
3Hangzhou0.042Chengdu0.079Hangzhou0.100Hangzhou0.073
4Shanghai0.041Hangzhou0.066Chengdu0.049Chengdu0.041
5Zhengzhou0.037Shenzhen0.049Nanjing0.044Shenzhen0.034
6Shenyang0.034Guangzhou0.046Chongqing0.031Tsingtao0.033
7Chengdu0.030Wuhan0.043Shaoxing0.020Nanjing0.033
8Zhuhai0.028Nanjing0.036Ningbo0.019Chongqing0.032
9Meizhou0.024Changchun0.033Wenzhou0.019Ningbo0.026
10Fuzhou0.022Hefei0.028Guangzhou0.018Shijiazhuang0.024
11Anshan0.021Zhengzhou0.028Wuhan0.017Wenzhou0.020
12Zhanjiang0.016Chongqing0.027Tsingtao0.016Hefei0.017
13Chongqing0.015Tsingtao0.024Shijiazhuang0.016Jinhua0.015
14Tsingtao0.015Ningbo0.023Shenzhen0.015Suzhou0.014
15Nanjing0.015Fuzhou0.022Changchun0.012Changchun0.013
16Hegang0.013Wenzhou0.022Wuxi0.012Jiaxing0.013
17Shenzhen0.013Changsha0.019Zhengzhou0.011Wuhan0.013
18Hefei0.013Shijiazhuang0.016Tai’zhou0.011Tianjin0.012
19Huzhou0.011Zhuhai0.015Jinhua0.011Shaoxing0.011
20Suzhou0.008Taiyuan0.015Hefei0.011Zhengzhou0.011
21Nanchang0.008Nanchang0.015Dalian0.010Changsha0.011
22Deyang0.008Guiyang0.014Tianjin0.009Wuxi0.010
23Qinzhou0.008Shenyang0.014Suzhou0.008Dalian0.008
24Xi’an0.007Suzhou0.014Yantai0.007Fuzhou0.008
25Siping0.006Tianjin0.013Foshan0.007Shenyang0.008
26Huludao0.005Quanzhou0.013Huzhou0.007Zhuhai0.008
27Mianyang0.005Tangshan0.012Shenyang0.007Yantai0.007
28Dongguan0.005Haikou0.012Changsha0.006Changzhou0.007
29Jinzhou0.005Changzhou0.011Changzhou0.006Guangzhou0.006
30Taizhou0.004Jinan0.010Guiyang0.006Nanchang0.006
Note: The top 30 rank numbers are sorted by betweenness centrality value from largest to smallest.
Table 4. Closeness centrality value of top 30 areas.
1980–19891990–19992000–20092010–2017
RankCityCCCityCCCityCCCityCC
1Huizhou1Liaocheng1Beijing0.880Beijing0.988
2Dalian1Fuyang1Shenzhen0.755Shanghai0.928
3Haikou1Beijing0.677Shanghai0.746Shenzhen0.908
4Shijiazhuang1Shanghai0.580Hangzhou 0.703Hangzhou 0.884
5Wenzhou1Shenzhen0.577Guangzhou0.667Guangzhou0.866
6Binzhou1Guangzhou0.535Nanjing0.634Nanjing0.818
7Fushun1Wuhan0.513Chengdu0.633Chengdu0.780
8Zhenjiang1Hangzhou 0.512Chongqing0.628Chongqing0.772
9HeYuan 1Nanjing0.507Wuhan0.614Wuhan0.771
10Jinzhou1Changchun0.495Xi’an0.592Xi’an0.755
11Jincheng1Chongqing0.495Fuzhou0.590Hefei0.743
12Lianyungang1Shenyang0.491Dalian0.589Tsingtao0.740
13Southwest Guizhou Autonomous Prefecture1Chengdu0.488Ningbo0.589Ningbo0.737
14Yantai1Fuzhou0.482Shaoxing0.586Shijiazhuang0.737
15Sui Ning1Huizhou0.481Zhengzhou0.586Wuxi0.719
16Xinzhou1Tianjin0.480Hefei0.581Fuzhou0.715
17Yangjiang1Zhengzhou0.476Tsingtao0.575Tianjin0.710
18Beijing0.470Tsingtao0.475Foshan0.572Dongguan0.710
19Chengdu0.411Wuxi0.474Tianjin0.569Suzhou0.704
20Guangzhou0.399Ningbo0.473Wuxi0.568Foshan0.701
21Shenzhen0.388Zhuhai 0.472Wenzhou0.562Zhengzhou0.694
22Hangzhou 0.387Dalian0.471Zhuhai 0.561Dalian0.686
23Chongqing0.369Xi’an0.471Shenyang0.560Jiaxing0.673
24Shanghai0.356Hefei0.470Nanchang0.558Nanchang0.669
25Tibetan Autonomous Prefecture of Hainan0.353Suzhou0.470Shijiazhuang0.556Changzhou0.668
26Zhengzhou0.345Taiyuan0.469Changchun0.555Zhuhai0.663
27Luoyang0.321Foshan0.466Jinhua0.554Changchun0.655
28Meizhou0.317Shijiazhuang0.464Yantai0.554Jinhua0.650
29Jilin0.311Wenzhou0.462Changzhou0.548Shaoxing0.650
30Zhuhai 0.302Nanchang0.461Dongguan0.544Wenzhou0.641
Note: The top 30 rank numbers are sorted by closeness centrality value from largest to smallest.
Table 5. Prevalence of the four types of node cities.
Type
Period
LLHLHHLH
NPNPNPNP
1990–19995035.7%2014.3%4935%2115%
2000–20097023.1%8528%6621.8%8227.1%
2010–20177422%9628.5%7121.1%9528.3%
Note: N = number of nodes; P = proportion of all nodes.
Disclaimer/Publisher’s Note: The statements, opinions and data contained in all publications are solely those of the individual author(s) and contributor(s) and not of MDPI and/or the editor(s). MDPI and/or the editor(s) disclaim responsibility for any injury to people or property resulting from any ideas, methods, instructions or products referred to in the content.

