Article

Evaluation and Prediction of Landscape Ecological Security Based on a CA-Markov Model in Overlapped Area of Crop and Coal Production

School of Surverying and Land Information Engineering, Henan Polytechnic University, Jiaozuo 456400, China
*
Author to whom correspondence should be addressed.
Land 2023, 12(1), 207; https://doi.org/10.3390/land12010207
Submission received: 21 December 2022 / Revised: 5 January 2023 / Accepted: 6 January 2023 / Published: 9 January 2023
(This article belongs to the Special Issue New Insights in Integrated Land Management)

Abstract

:
Overlapped areas of crop and coal production are responsible for national food security and mineral resource supply. However, long-term coal mining and urban and rural construction have continuously impacted the structure and functions of the original agricultural landscape ecosystem in the area and brought serious ecological security problems. On the basis of the results of remote sensing image classification of the Zhaogu mining area, this study explores the spatio-temporal variation characteristics of the landscape pattern and the evolution of ecological security and predicts the landscape ecological security status in 2029. Research results show that the evolution of the landscape pattern in the study area manifests obvious stage characteristics: from 2004 to 2014, the landscape pattern developed in the direction of fragmentation, irregularity, heterogeneity, and low connectivity; after 2014, the landscape pattern showed continuity, regularization, and high connectivity trends. By comparing the landscape ecological security of the study area from 2004 to 2019, a temporal change characteristic of first deteriorating and then gradually improving can be observed. By analyzing the changes in the distribution of the security status in the study area on a spatial scale, it can be found that the proportion of unsafe areas is significantly reduced in 2019 due to the influence of land remediation and reclamation. By constructing a CA-Markov prediction model with both spatial and quantitative advantages, the prediction results show that the degree of landscape fragmentation in the study area will be reduced, and the connectivity will be enhanced between 2019 and 2029. The shape of landscape patches tends to be regular, and the landscape heterogeneity will be enhanced. Overall, the landscape ecological security situation will continue to improve. The results could provide reference for ecological protection and related land reclamation planning of the mine area.

1. Introduction

The overlapped areas of crop and coal production undertake major responsibility for national food security and mineral resource supply [1,2]. However, the long-term coal mining activities have caused some resource, environmental, and social conflicts in this area. At the same time, coal mining activities have given rise to a series of impacts, such as land destruction (digging damage, subsidence, and occupation) [3], hydrological damage (drying up of rivers, subsidence water, and swamps), surface vegetation degradation, farmland degradation, and settlement relocation, which have severely disturbed regional landscape components and their structure. As the fragmentation of the original agricultural landscape increases, the stability of the landscape decreases, which has further affected the ecological security of the landscape in the region [4,5]. Therefore, it is of great theoretical significance and practical value to carry out research on the evaluation and prediction of the ecological safety of the landscape in the overlapped area of crop and coal production for the regional ecological management and to ensure the sustainable production of coal and grain.
Landscape ecological security is not only an important part of regional ecological security but is also related to the sustainable development of regional economy and society [6]. After years of development, the research history of landscape ecological safety and its related theories can be basically summarized as “the early stage focused on the qualitative exploration of related theoretical connotations [7,8], the middle stage focused on the description of the current situation and static evaluation of ecological safety [9,10], and the current focus on the simulation and prediction of landscape patterns [11], the dynamic evaluation [12,13], and early warning analysis of ecological safety [14,15]”. At present, studies on landscape ecological safety are based mainly on regional [16,17] and watershed scales [18], as well as key ecological areas, such as hotspots/sensitive areas [19,20], resource-based cities, and rapidly urbanizing areas [12,21]. These results provide important references as well as reference for the follow-up research on landscape ecological security evaluation in other regions. Coal mining activities can cause significant changes in regional landscape patches, thereby affecting the ecological effects and ecological security of regional agricultural landscapes. From the perspective of mining areas, many studies have used landscape ecology methods to analyze landscape ecological quality, risk, and evolution. For example, Zhang et al. [22] analyzed the granularity effect of landscape indices in the production phase of mining areas and screened representative landscape indices that have an impact on the landscape pattern. In addition, Gao et al. [23] used GIS and RS technologies and applied landscape ecology methods to study the changes in landscape patterns and their driving forces in typical coal mining areas. The limitation of the above research is that the regional landscape ecological quality and safety status are analyzed only from the perspective of the impact of coal mining on landscape pattern elements. As a complex ecosystem under the interaction of agricultural production and coal mining activities, the ecological condition of the landscape of the overlapped area of crop and coal production is continuously affected not only by mining activities but also by the cumulative impact of human activities, such as regional urban and rural construction, agricultural production, and land remediation and restoration in the mining area [24]. These activities have a more complex impact on the regional landscape ecological elements, landscape pattern, and landscape ecological quality and function, which, in turn, affect the regional landscape ecological security. In conclusion, the current research on the evaluation of landscape ecological safety in this special composite landscape area of the overlapped area of crop and coal production is relatively weak; in particular, the prediction of future trends in landscape ecological safety is lacking.
This study uses the theory of landscape ecology, remote sensing information processing, and GIS and geostatistical methods, selects the overlapped area of crop and coal production of the Zhaogu mining area of Henan Coking Coal Group as the research area, and discusses the impact of coal mining, urban and rural development, and agricultural production activities on the regional impact on landscape evolution. On the basis of four phases of Landsat series satellite remote sensing images in 2004, 2009, 2014, and 2019, the overall characteristics of landscape elements in the study area were quantitatively studied by analyzing land use type shifts and changes in landscape indices. At the same time, the spatial and temporal variation of landscape ecological safety from 2004 to 2019 is assessed in terms of landscape pressure, landscape structure, and landscape ecological effects. Finally, the spatial distribution of land-use landscape types in 2019 is simulated based on the CA-Markov model, and the accuracy of the simulation is verified by comparing it with the actual situation in order to ensure the reliability of the predicted landscape pattern in the study area in 2029 and then to evaluate and analyze the landscape ecological security in 2029. The results of the study can provide useful guidance for the decision-making and practice of improving the ecological function of the overlapped area of crop and coal production and the construction of green mining areas.

2. Materials and Methods

2.1. Study Area

Zhaogu coal mine, which belongs to Hui County, Henan Province (Figure 1), is located at the southern foot of the Taihang Mountains, in east of the Jiaozuo coalfield (35°23′~35°28′ N, 113°33′~113°57′ E), with a temperate continental monsoon climate. The mine area has a high surface dive level (1.5–2.0 m below the surface), a large mining depth (550–1000 m), a thick loose layer cover (360–808 m), a coal seam inclination of 2°~6°, a large mining thickness, and a near horizontal, stable thick coal seam. Both the Zhaogu I and II mines are underground mining areas. The coal mine covers an area of 18,547.85 hm2, including the seven townships of Jitun, Zhaogu, Yuhe, Zhancheng, Beiyunmen, Dakuai, and Mengzhuang and a street office (a total of 95 villages). With an average coal seam thickness of 6.27 m, recoverable reserves of 177 million tonnes, an annual design capacity of 2.4 million tonnes, and a service life of 56.9 years, the Zhaogu I mine commenced construction in June 2005 and was put into trial production in November 2008. With an average coal seam thickness of 6.16 m and recoverable reserves of 147 million tonnes, the Zhaogu II mine has an annual design capacity of 1.8 million tonnes and a service life of 55.5 years, and it was officially commissioned in April 2011. The study area belongs to the pre-mountain alluvial plain of the Taihang Mountains, and the main rivers in the area are the Qingshui River, the Wang Shimen River, the Huangshui River, and the Baiquan River, all of which are seasonal rivers. The soils in the study area are tidal and suitable for crops such as wheat and maize. Since 2013, land reclamation and ecological remediation has been carried out on some of the subsidence areas and abandoned village land, and the treatment works have exceeded 550 hm2. The reclaimed land is used mainly for agricultural production, and the remediated waters are used mainly for aquaculture and leisure tourism.

2.2. Data Sources and Processing

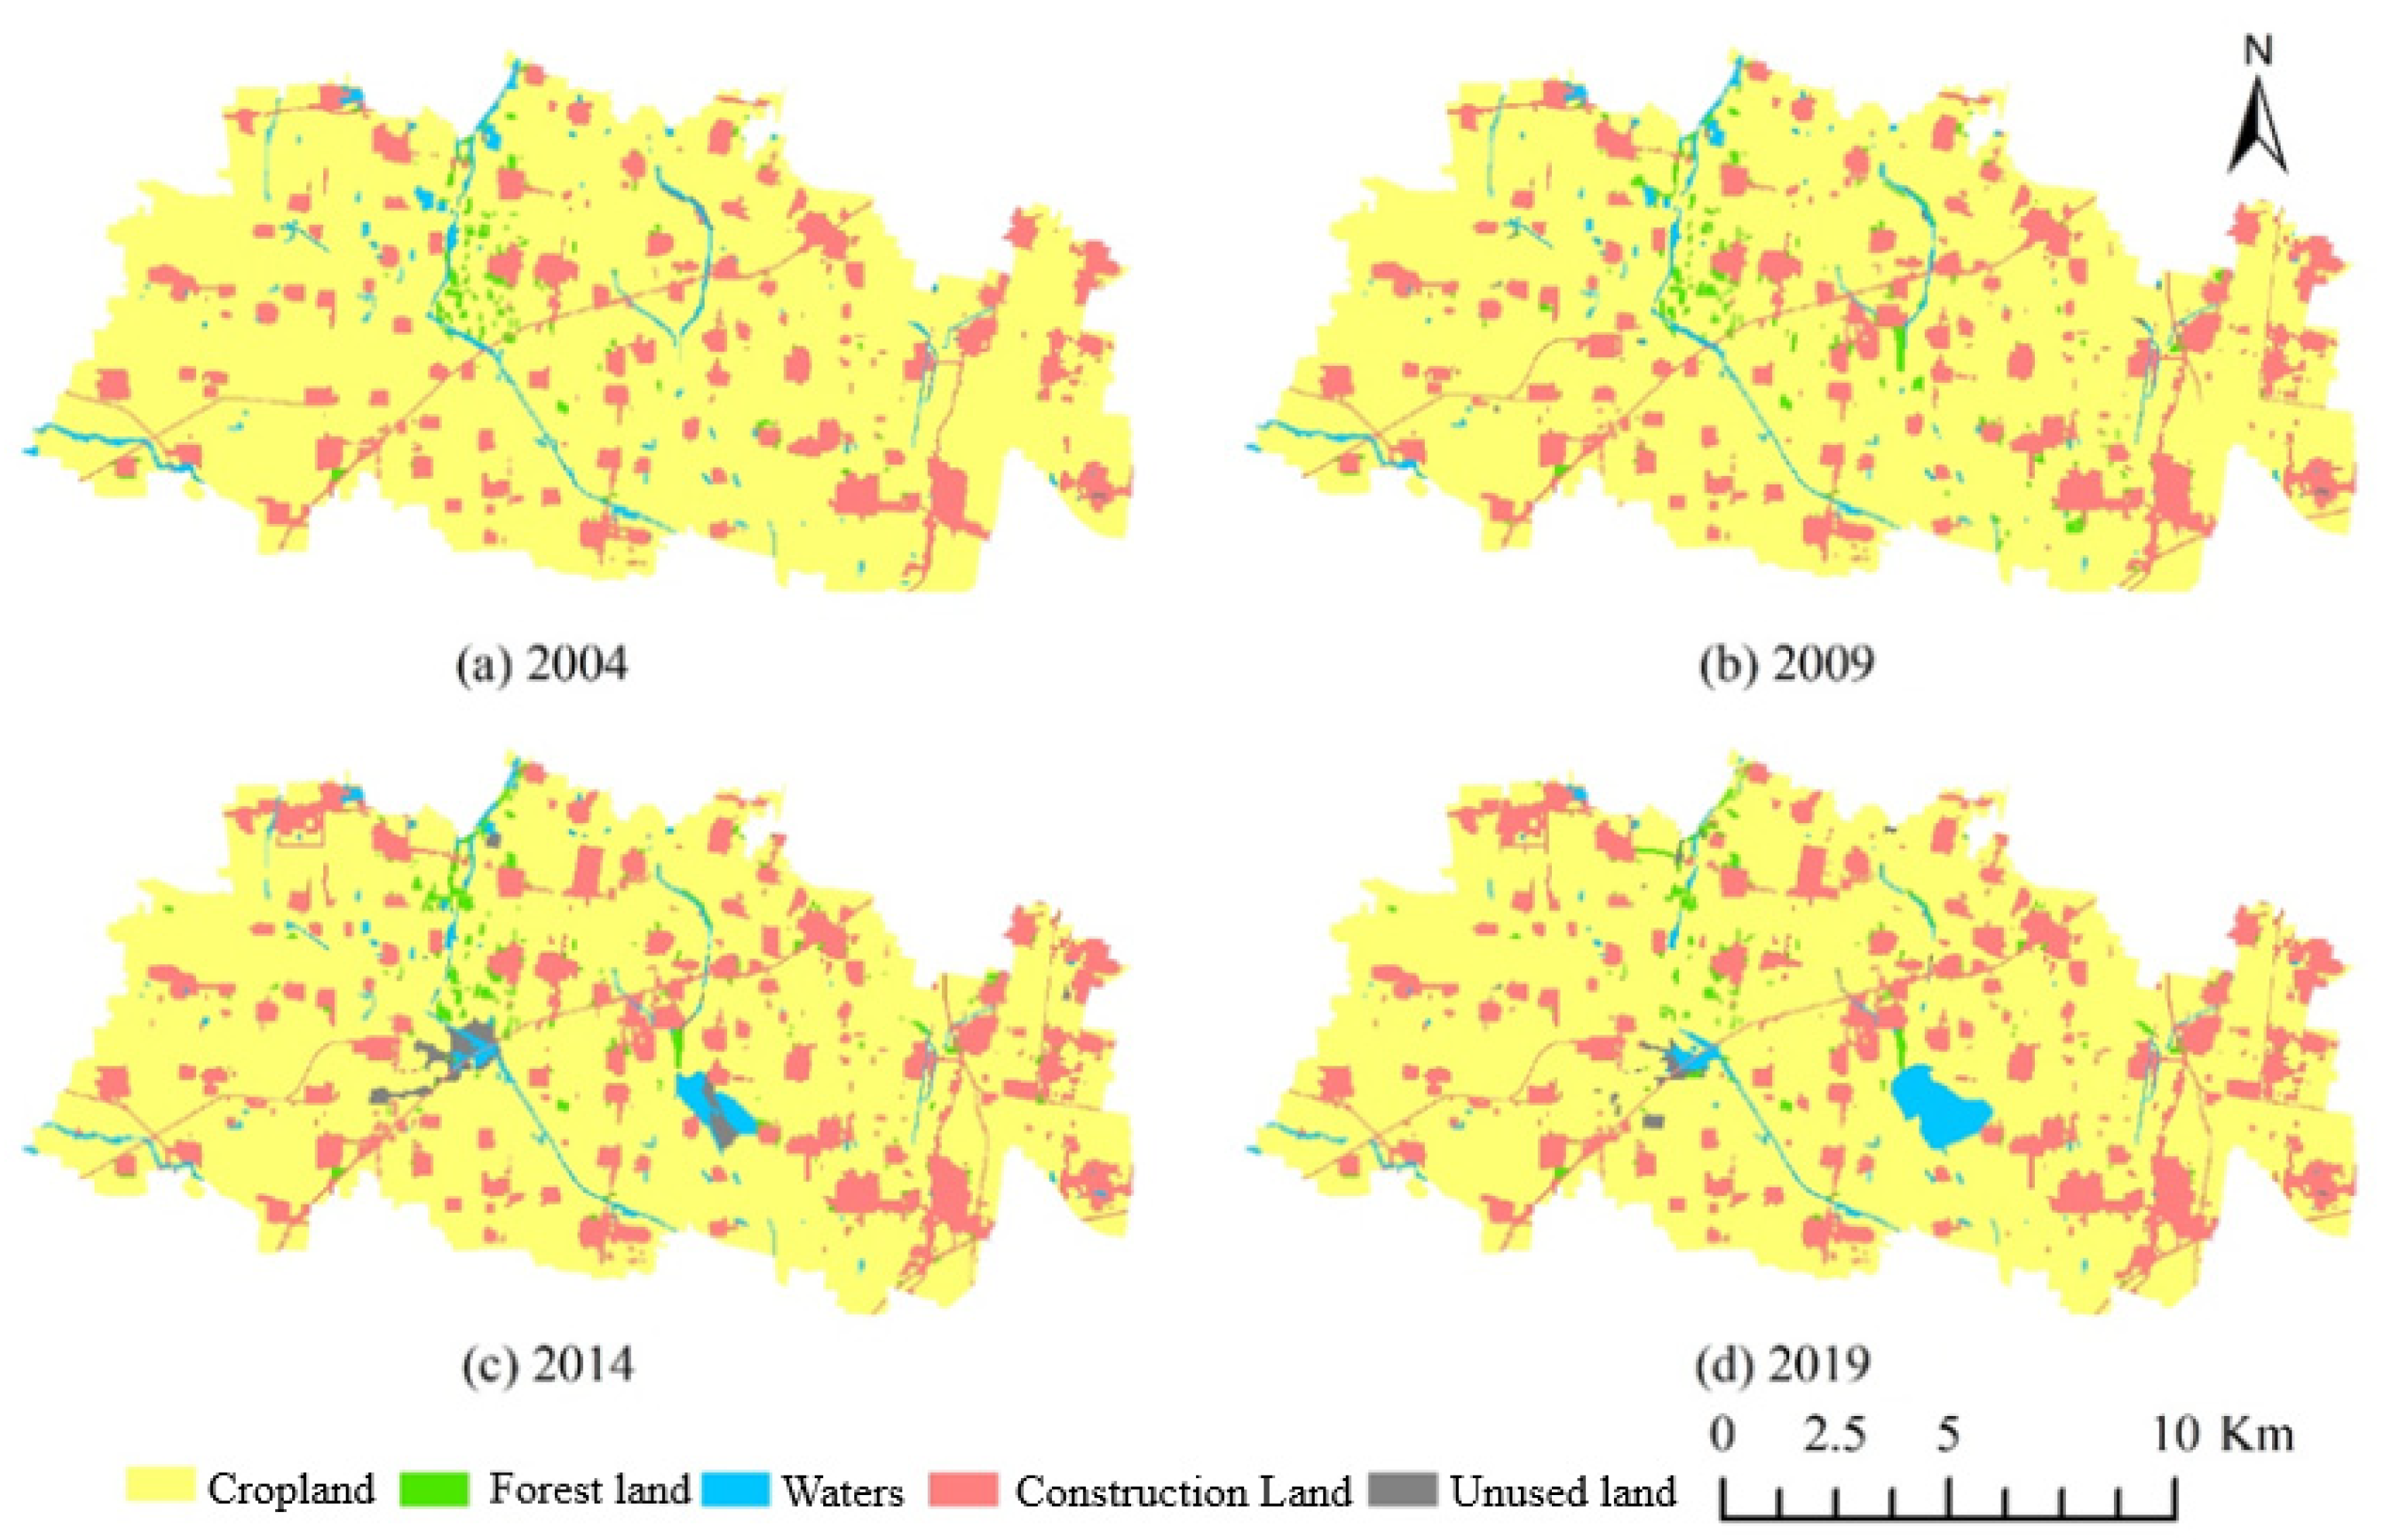
The classification of landscape types is the basis of landscape ecology research, and most scholars determine the classification system by pre-processing multi-temporal remote sensing images [25,26]. According to the mining time of the Zhaogu coal mine, the four phases of Landsat TM/OLI satellite images with orbit number 124/35 from 2004, 2009, 2014, and 2019, provided by the USGS website, were selected as the remote sensing data source in this study, with an image resolution of 30 m (Table 1). The images were pre-processed with radiometric calibration, atmospheric correction, and geometric correction in ENVI 5.1, and a supervised classification was used to classify the landscape types in the study area into five types, namely arable land, construction land, forest land, water area, and unused land (Figure 2). The results of the supervised classification were post-processed, and the classification results were checked by combining Google Earth historical images and the 2015 land use change survey data of Hui County. The overall accuracy and Kappa coefficient of the 4-phase remote sensing image classification were above 0.85, and the classification results meet the needs of the study.

2.3. Methods

2.3.1. Analysis of the Changing Landscape Pattern

Landscape pattern indices are indicators designed to quantitatively describe and analyze landscape patterns and their changing characteristics, reflecting certain aspects of landscape structural composition and spatial configuration [27]. There are many landscape pattern indices, and some of them are highly correlated. This study analyzes the change of landscape pattern in the study area from the four aspects of landscape fragmentation degree, shape complexity, heterogeneity, and connectivity. Combining the existing research results [28] and actual needs, this paper selects four indicators: average patch area (AREA_MN), landscape shape index (LSI), Shannon Diversity Index (SHDI), and contagion index (CONTAG); these representative indicators can objectively and accurately describe the evolution of regional landscape patterns. The formulas and ecological significance of each landscape pattern index can be found in other works in the literature [29]. On the basis of the land use landscape classification results (30 m × 30 m) of the four phases of remote sensing images, the various types of landscape pattern indexes in different years in the study area were calculated in Fragstats4.2 software.

2.3.2. Landscape Ecological Safety Evaluation Index System Construction

In order to spatially display the landscape ecological security index, this paper divides the research area into fishing nets with a grid size of 1 km × 1 km in ArcGIS 10.7 software, for a total of 223 evaluation units. The selection of evaluation units follows the principle that the evaluation unit is 2–5 times the average area of landscape patches [30,31]. By calculating the landscape ecological security value in each evaluation unit, the method of spatial interpolation is used to assign this value to the center point of the corresponding evaluation unit. This study follows the principles of comprehensiveness, convenience, operability, and adaptability to local conditions and combines the actual situation of the research area and related research results [17,20] to construct a landscape ecological security index system (Table 2) suitable for the typical area of overlapped areas of crop and coal production. In this paper, six indicators are selected from the three criterion layers of landscape pressure, landscape structure, and ecological effect, including intensity of development and use of building land, mining pressure, landscape structural safety index, biological richness, vegetation coverage, and landscape ecological service value. These indicators objectively and scientifically reflect the ecological characteristics of the regional landscape. The determination of index factor weights adopts a combination of subjective weighting (expert judgment method) and objective weighting (average variance method). Meanwhile, the quantification of indicators was carried out with reference to the literature [12], and the study area was divided into four levels according to the quantification of indicators: safety zone, basic safety zone, early warning zone, and unsafe zone and assigned values of 1, 0.8, 0.6, and 0.5, respectively, which achieves the conversion between landscape attribute scores and landscape ecological safety scores. The integrated index method is used to calculate the landscape ecological safety for each evaluation unit, and the calculation formula is shown below:
L S E S = n = 1 3 Q n × W n
where LSES is the landscape ecological safety index; Qn denotes the standardized landscape pressure, landscape structure, and landscape ecological effect values; and Wn is the weight corresponding to the three.

2.3.3. CA-Markov Models and Landscape Safety Prediction Methods

A cellular automata model is a dynamical model defined on a discrete space of discrete, finite state cells evolving in a discrete time dimension according to certain local transformation rules [35]. Its functional expression is given by.
S t + 1 = f S t , N
where S (t + 1) and S(t) denote the set of states of the tuple at moments t+1 and t, respectively; f denotes the state transfer function of the tuple; and N denotes the set of all tuples in a certain neighbourhood.
The Markov model is a prediction method for the probability of an event occurring, using the initial probabilities of the different states of the event and the transfer probabilities between states to predict the state in which the event will be at a future moment [36]. The key to applying the Markov model for prediction is to obtain the transfer probability matrix P between states; the calculation formulas are as follows:
S t + 1 = P i j S t
P i j = P 11 P 1 n P n 1 P n n and j = 1 n P i j = 1 i , j = 1 , 2 , , n
The IDRISI CA-Markov model enhances the ability to simulate spatial patterns through domain relationship analysis on the basis of the application of Markov chains in the accurate prediction of the quantitative structure of future land use [37]. The CA-Markov model has proven to have greater accuracy advantages over GIS-technology-based methods in land use change simulation [38,39].The study constructs a CA-Markov prediction model with both spatial and quantitative advantages, which can comprehensively and accurately capture the dynamic changes in the regional landscape [38,40].
In this study, the CA-Markov module in IDRISI software was used to firstly simulate the spatial distribution pattern of land-use landscape types in 2019 in the mining area of Zhaogu; the accuracy of the model was verified, and the prediction of the spatial distribution of landscape types in the mining area in 2029 could be finally realized. The specific operation is as follows: (1) Establishing conversion rules. The transformation rules in this paper include two parts: the landscape transition probability matrix that acts as a total constraint and the landscape suitability atlas that acts as a space constraint. ① Generation of transfer matrix: Through the overlay analysis of land use landscape classification results from the two phases in 2009 and 2014, the landscape transfer probability matrix was generated, and the 2014–2019 landscape transfer area matrix was calculated. ② Preparation of suitability atlas: On the basis of vector data such as the range of earth dams in subsidence waters, relocation, reclamation planning, etc., the multi-criteria evaluation (MCE) method was used to generate the suitability images of each landscape type in 2014. (2) Construct CA filter. Set the neighborhood space size and determine the change rules of the central metacell state. (3) Determination of base period data and cycle times. Taking the land use landscape types in 2014 as the base period data and setting the number of cycles as 5, combined with the conversion rules obtained from the above calculations, the spatial distribution pattern of landscape types in the study area in 2019 was simulated. (4) Validation of model accuracy. The 2019 landscape simulation map and the actual 2019 land use landscape classification map were input into the Crosstab module for overlay analysis to analyze and verify the model accuracy. (5) Prediction model run. On the basis of the advancing direction and speed of the mining working face and the reclamation planning of abandoned villages and subsidence areas, the above steps are repeated to obtain the landscape transfer area matrix from 2019 to 2029 and the landscape suitability atlas in 2019. Taking the land use landscape type in 2019 as the base period data, the number of cycles is set to 10 to realize the prediction of the landscape type distribution pattern in 2029.

3. Results

3.1. Land Use and Landscape Pattern Change in the Study Area

Coal mining activities not only destroy the arable land resources of the region but also cause serious disturbances to the regional land use structure. The change trend of the area of each land use type in different time periods is different (Table 3). Among them, the area of cultivated land shows a trend of decreasing and then increasing, reaching a minimum value in 2014 (at 14,892.39 hm2). In the later period (2014–2019), the cultivated land area increased slightly. The construction land area increased continuously, and the total area increased by 767.52 hm2 during the entire study period. This is reflected mainly in the increase of industrial and mining land, the construction of resident resettlement areas and supporting infrastructure, and the expansion of rural residential areas. During the period 2004–2009, the area of watershed decreased slightly. Since then, under the combined action of mining subsidence, atmospheric precipitation, surface runoff, and other factors, the water area of the subsidence area has increased year by year. The area of woodland and unused land shows a trend of increasing and then decreasing, with the area of unused land increasing rapidly and substantially between 2009 and 2014, but gradually decreasing in the later period (2014–2019) due to the impact of land reclamation and sinkhole water accumulation.
The construction and production process of the mine will not only change the original land use but will also have a direct or indirect impact on the regional landscape pattern. The landscape pattern index average patch area (AREA_MN) refers to the average area of all patches in the landscape and can be used to reflect the degree of regional landscape fragmentation. The smaller the value, the more serious the fragmentation of the landscape. The degree of spread (CONTAG) reflects the agglomeration degree or extension trend of patches in the landscape, and its value reflects the connectivity of the landscape. The average patch area (AREA_MN) and the spread (CONTAG) decreased first and then increased (Figure 3), which indicates that the construction of the mine site led to an increase in landscape fragmentation and a deterioration in landscape connectivity in the study area. After 2014, with the implementation of the ecological remediation project in the study area, the regional landscape fragmentation and landscape dispersion decreased and connectivity increased. As a result, the AREA_MN and CONTAG indices have increased again. The landscape shape index (LSI) is used to measure the shape complexity of patch types by the edge length. Landscape shape has a significant impact on species migration, material circulation, and energy flow within landscape elements and between different landscape elements. Generally speaking, the more complex the overall shape of the landscape, the stronger the edge effect and the worse its integrity. The LSI gradually increased from 2004 to 2014 (Figure 3), indicating that human activities have increasingly disturbed the landscape, leading to the development of complex and irregular landscape shapes. However, in the later period (2014–2019), the LSI showed a relatively obvious downward trend. The Shannon Diversity Index (SHDI) reflects the diversity and heterogeneity of the landscape. The higher its value, the richer the landscape type and the higher the complexity of the landscape system. The SHDI increased continuously from 2004 to 2014 (Figure 3), indicating an increase in landscape heterogeneity in the study area during this period. The SHDI decreased slightly after 2014, indicating a decrease in landscape heterogeneity. In conclusion, the evolution of the regional landscape pattern showed obvious stage characteristics during the study period: from 2004 to 2014, the landscape pattern developed towards fragmentation, irregularity, heterogeneity, and low connectivity; after 2014, it showed a trend of continuity, regularity, equalization, and high connectivity.

3.2. Spatial and Temporal Evolution of Landscape Ecological Safety in the Study Area

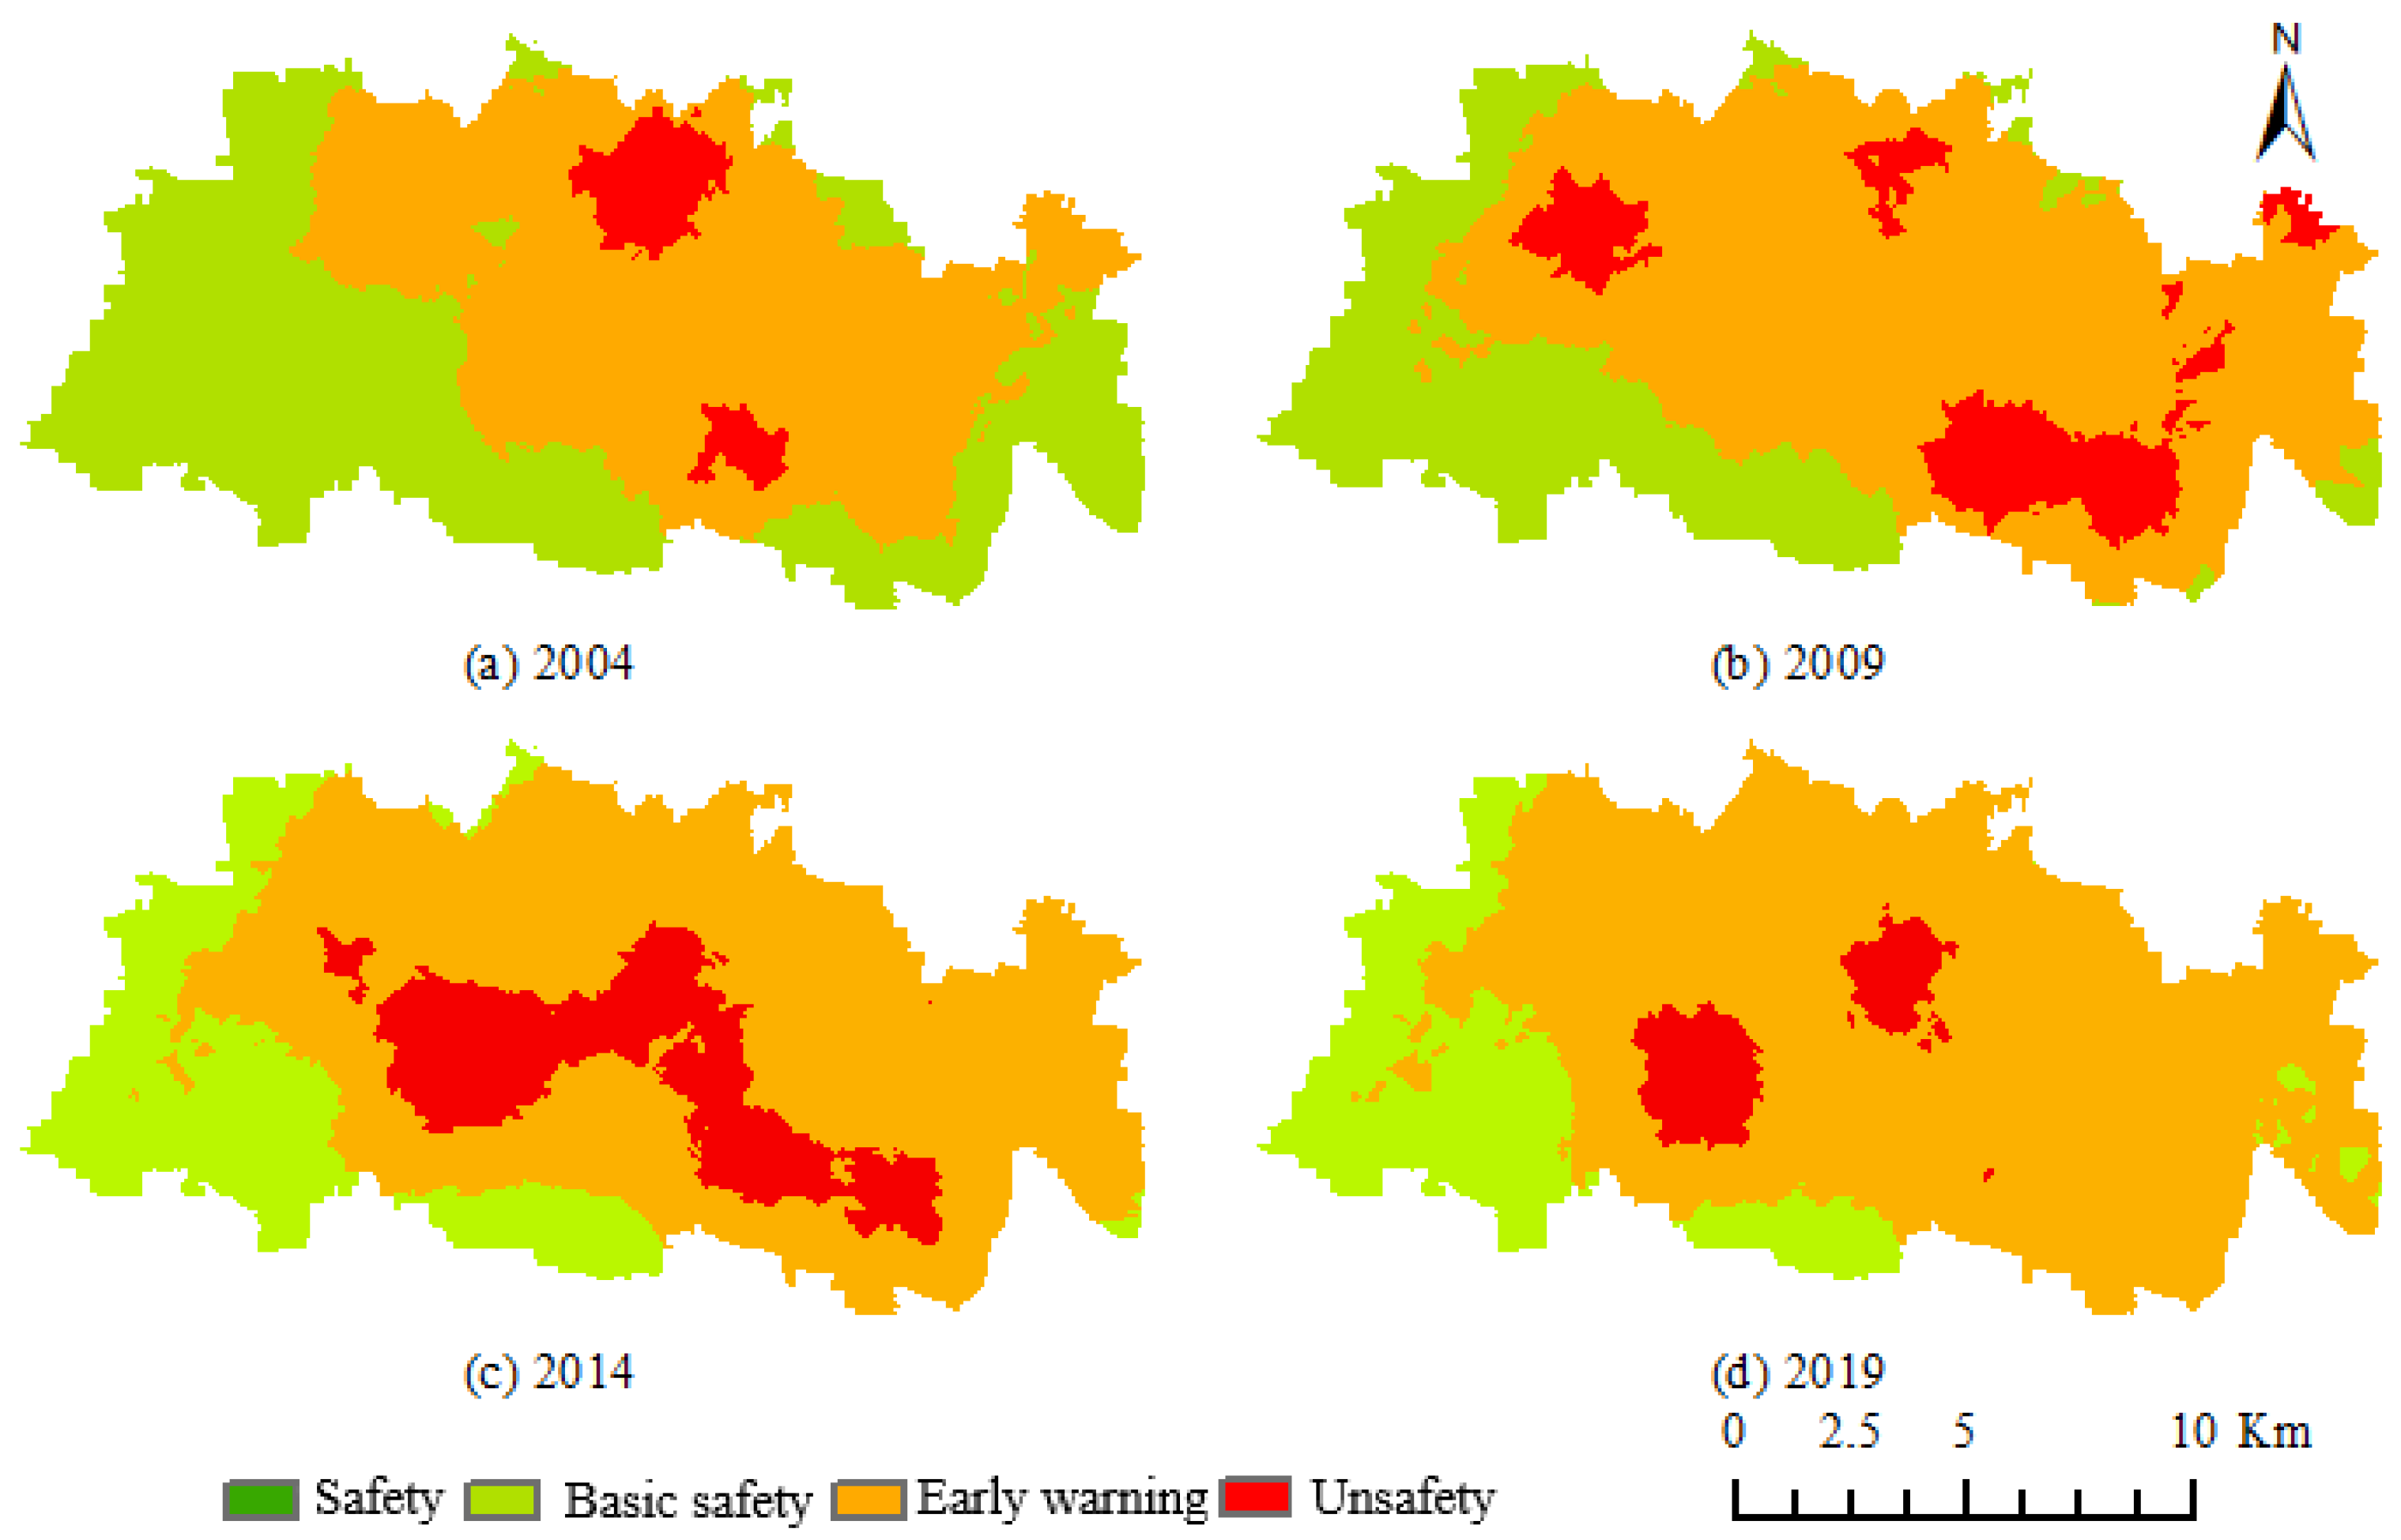
In order to analyze the spatio-temporal differentiation characteristics of landscape ecological security in the study area, this study calculated the landscape ecological security index of 223 evaluation units in the study area by a geostatistics method and obtained the landscape ecological security level map of the study area by the kriging spatial interpolation method (Figure 4 and Table 4). From 2004 to 2019, the overall landscape ecological security in the study area showed the change characteristics of first worsening and then gradually improving. During this period, the changes of landscape ecological security pattern were as follows: the area proportion of basic security area decreased continuously; the area proportion of early warning area increased continuously; and the proportion of the area of early warning area keeps increasing, while the proportion of unsafe areas increased first and then decreased, and 2014 was the turning point. In 2004, the basic safety area is distributed mainly in the western and southeastern edge of the study area; the unsafe area is located in the south and north of the study area; and the rest of the landscape ecological safety is in the early warning state. With the enhancement of mining activities and urban and rural construction activities, the scope of the warning area was greatly expanded outward, resulting in a serious reduction in the area of the basic safety area. In 2014, the spatial distribution of the unsafe area changed significantly. The central and south–central part of the study area became the unsafe area, namely the mining subsidence area of the Zhaogu I and II mines and nearby disturbed areas. In 2019, the unsafe area ratio was reduced significantly, and the reduced area was distributed mainly in the central and south–central part of the study area. The main reason is that the local government carried out land consolidation and reclamation for part of the damaged land in this area. At the same time, the increase of the area of sunken water and ecological management also improved the ecological quality of the landscape.

3.3. Model Accuracy Validation and Landscape Pattern Evolution Prediction

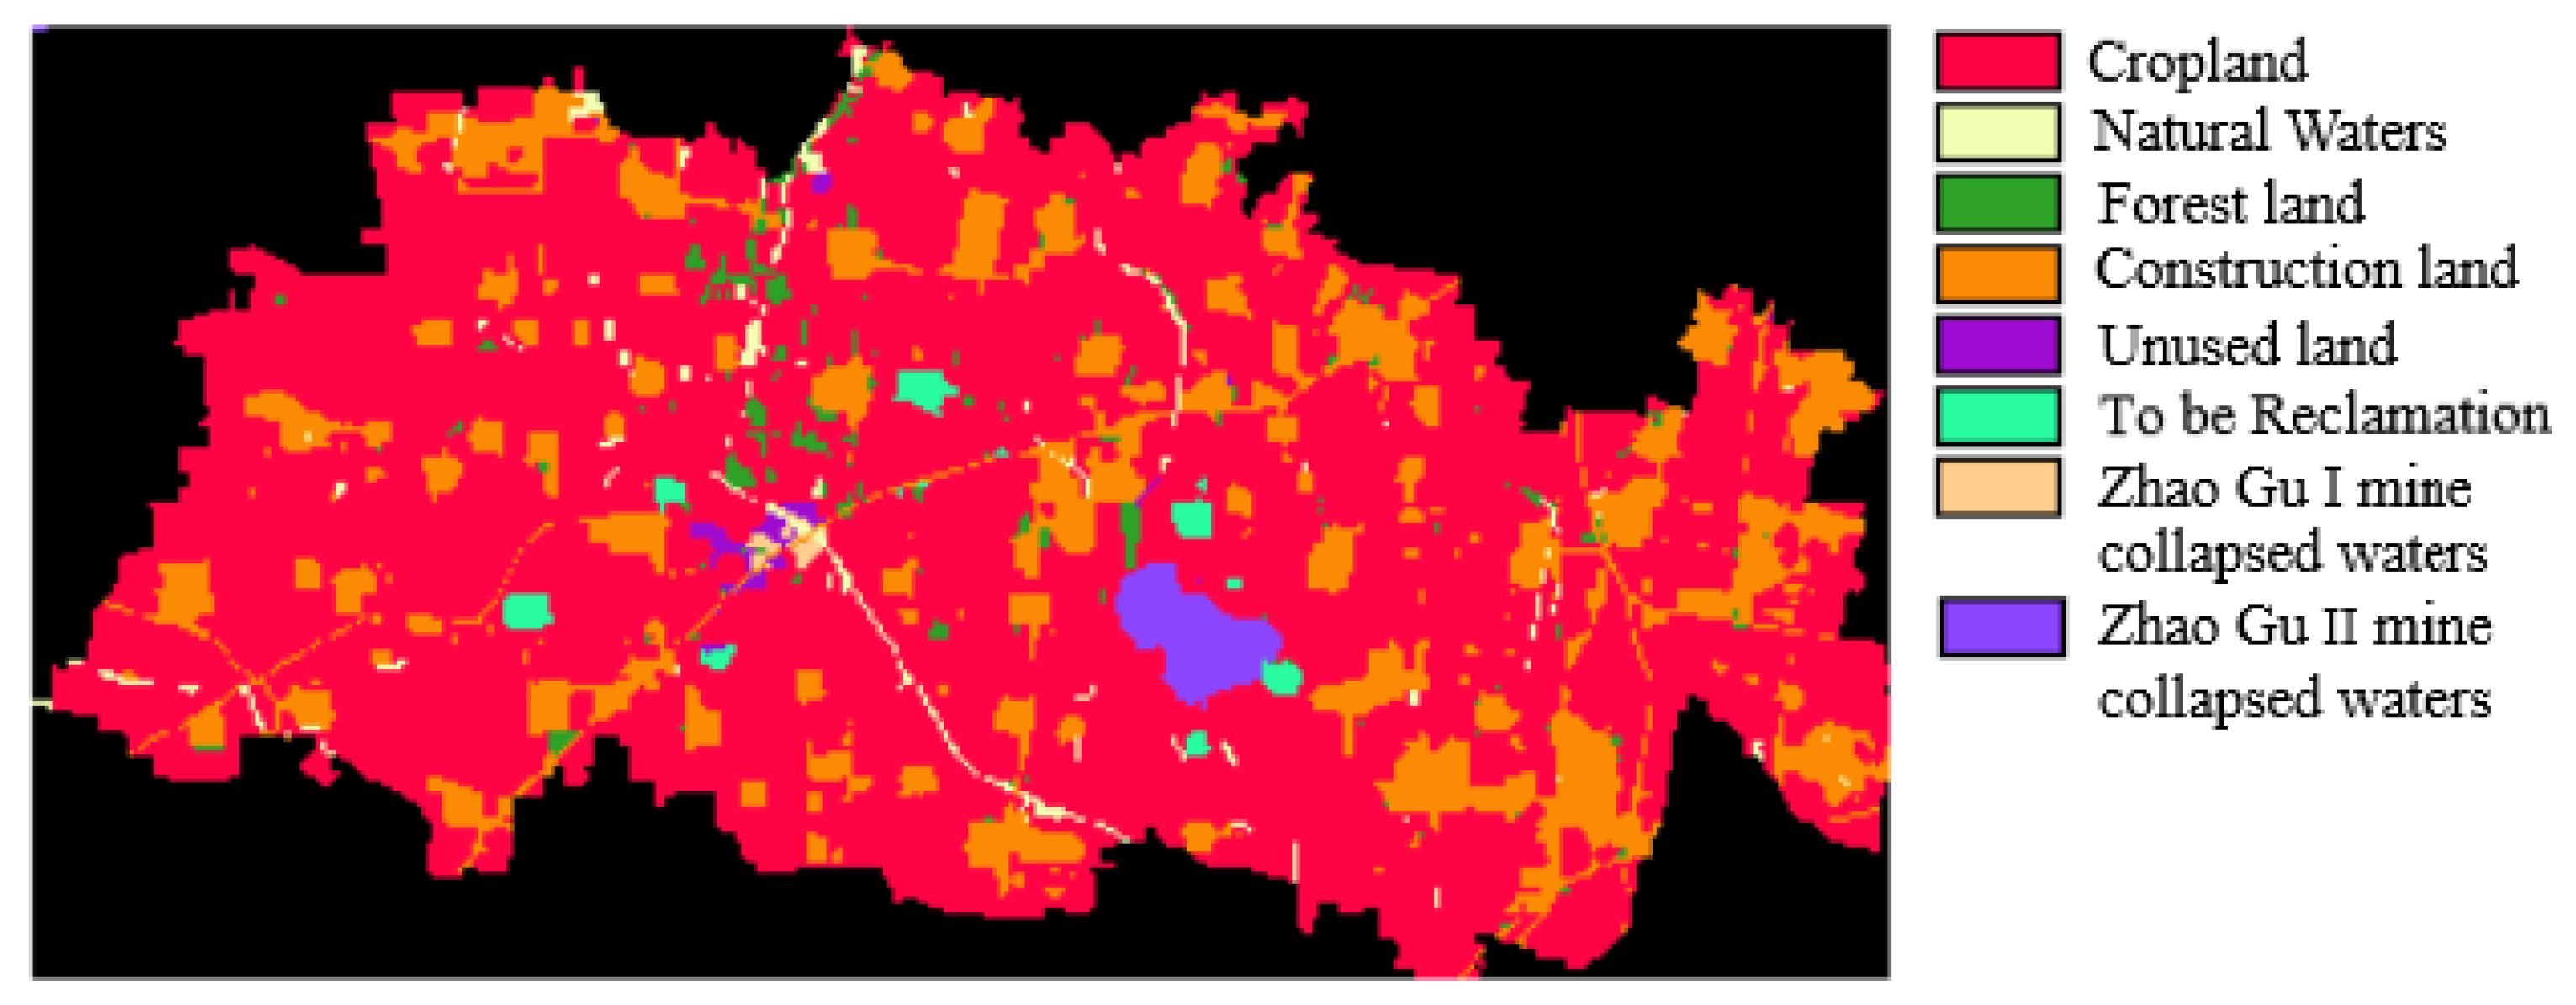
Taking the land use landscape type in the study area in 2014 as the base period data and considering the influence of mining subsidence, land reclamation, and urban–rural construction on the landscape type, the spatial distribution pattern of the landscape type in the mining area in 2019 was simulated. The actual 2019 land use landscape classification map of the study area (Figure 2) and the 2019 landscape simulation map (Figure 5) were input into the Crosstab module for overlay analysis to analyze and verify the model accuracy. Importing data—such as damaged land (mining occupation, land for village relocation, and subsidence cultivated land), the boundary of the maximum impact area of subsidence, subsidence water accumulation area, and scope of reclamation responsibility (village relocation abandoned land and destroyed cultivated land to be reclaimed)—is conducive to the generation of the atlas of suitability for landscape transfer and the simulation accuracy, and it lays the foundation for the subsequent prediction of the landscape type in 2029. The results show that the Kappa coefficient of the CA-Markov model simulation results is 0.9676, which meets the application requirements.
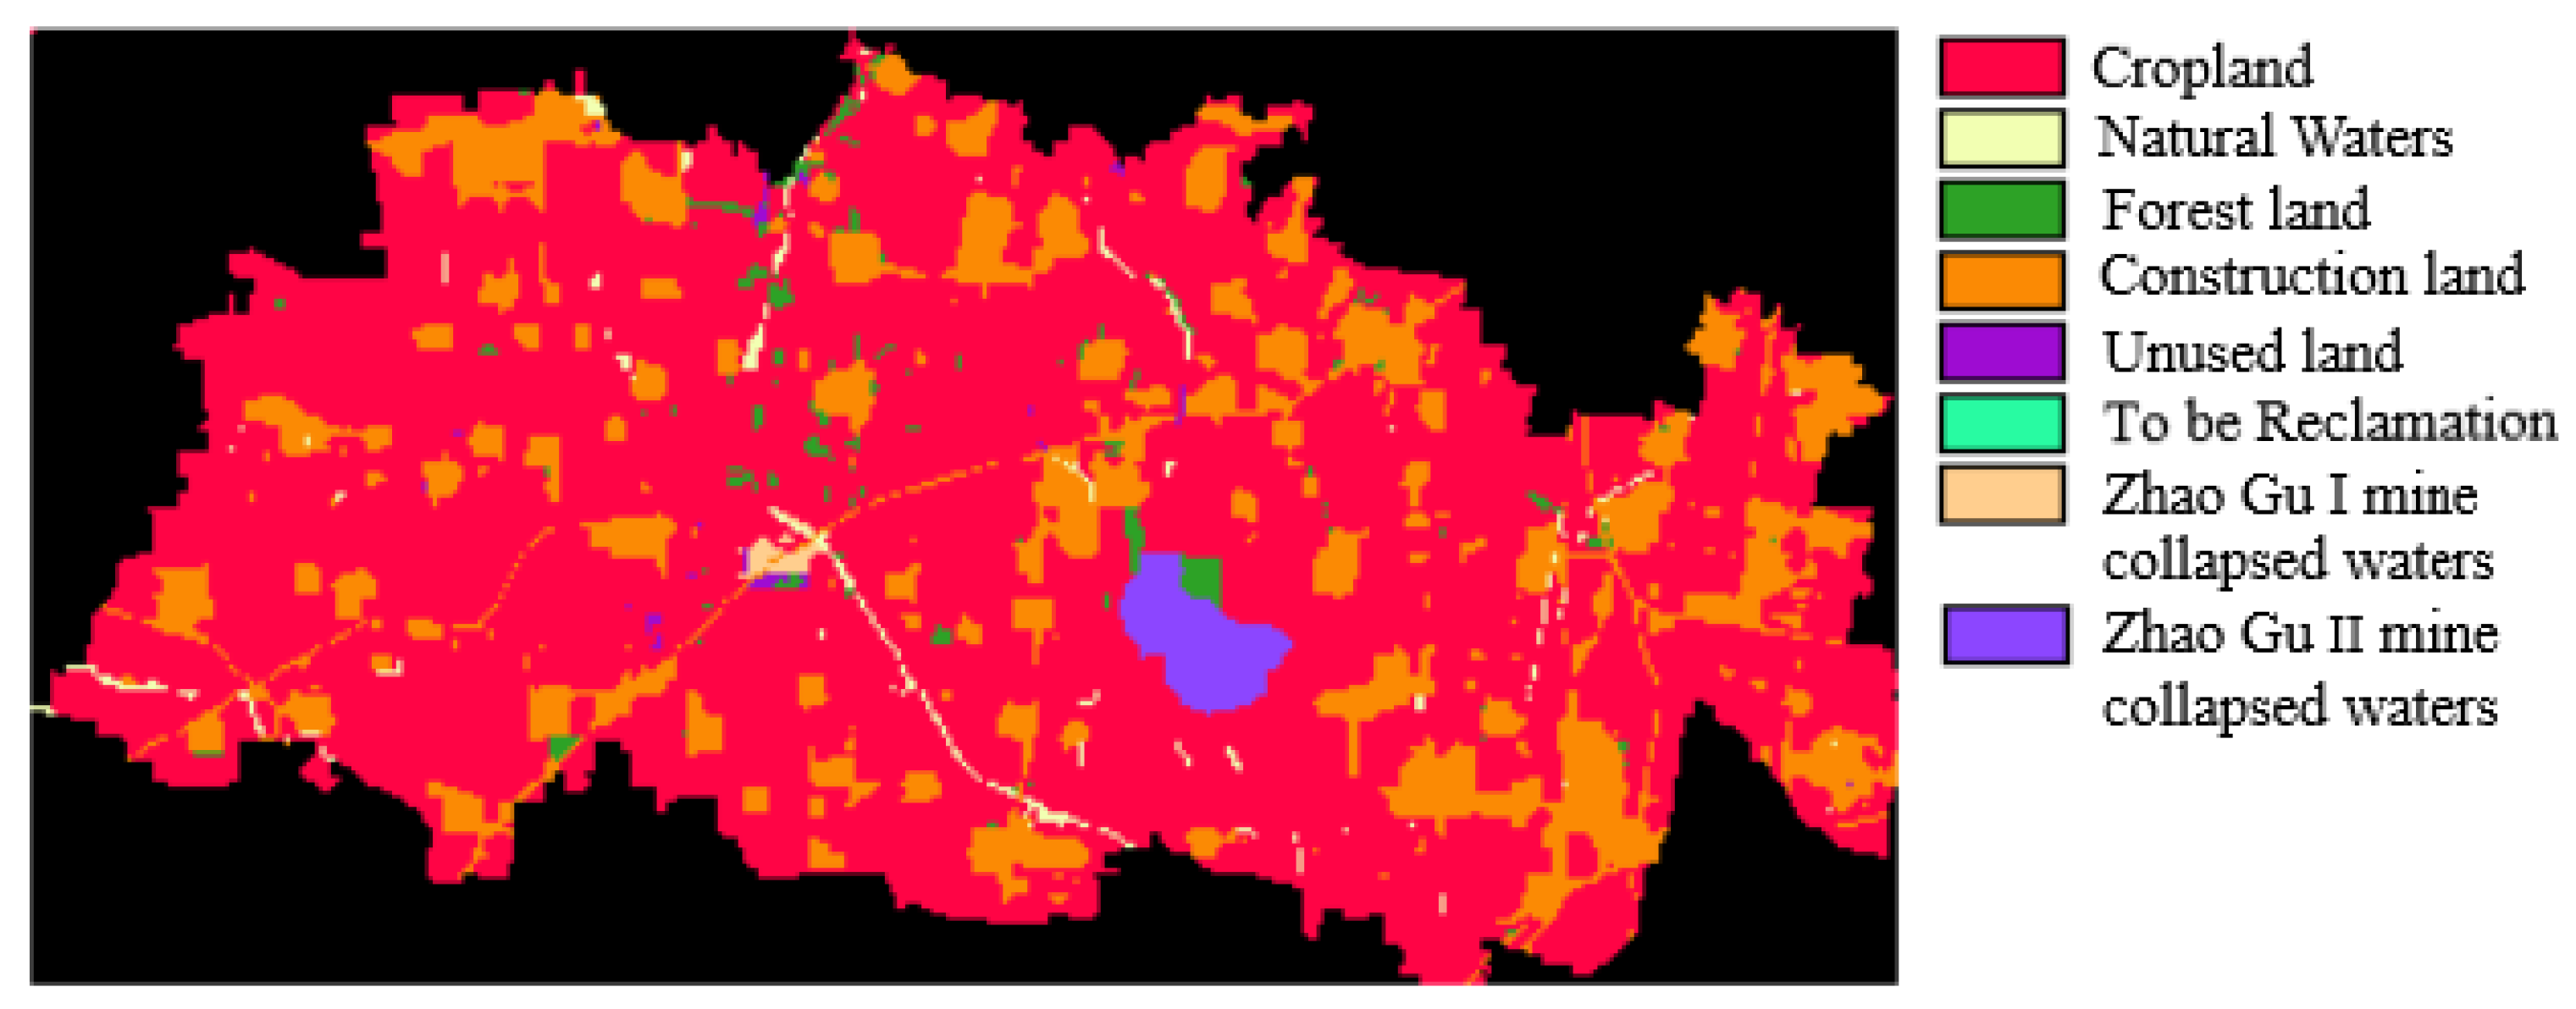
As the Zhaogu I and II mines are production mines, the land damage caused by future mining subsidence must be considered when making predictions about future ecological safety. On the basis of the relevant prediction parameters provided by the Jiaozuo Coal Group, such as coal seam mining thickness, mining depth, mining plan, working face advancement direction, and speed and surface movement parameters of each place, the area of mining subsidence and area of subsidence water accumulation in the Zhaogu I and II mines from 2019 to 2029 were predicted by coal seam and pan area using MSCS subsidence prediction software to provide a basis for the subsequent ecological safety prediction. On this basis, using the data of land use landscape types in 2019 as the base period and analyzing the impact of future mining subsidence, land reclamation, and urban–rural construction on regional landscape elements, the spatial distribution map of landscape types in 2029 was obtained (Figure 6). The landscape prediction map in 2029 was converted into tif format by ArcGIS software and then imported into Fragstats software to calculate AREA_MN, LSI, SHDI, CONTAG, and other indexes (Table 5), which finally help analyze the characteristics of landscape pattern changes in the study area from 2019 to 2029. The results show that AREA_MN, LSI, SHDI, and CONTAG of the study area in 2029 are 48.4307, 12.3496, 0.6611, and 73.4161, respectively. Compared with 2019, AREA_MN, SHDI, and CONTAG will increase, while LSI will decrease. This indicates that the landscape fragmentation in the study area will be reduced, the connectivity will be enhanced, and the shape of landscape patches will tend to be regular, but the landscape heterogeneity will be enhanced. In summary, the landscape pattern of the study area shows a continuous optimization trend.

3.4. Forecast of Landscape Ecological Security in the Study Area

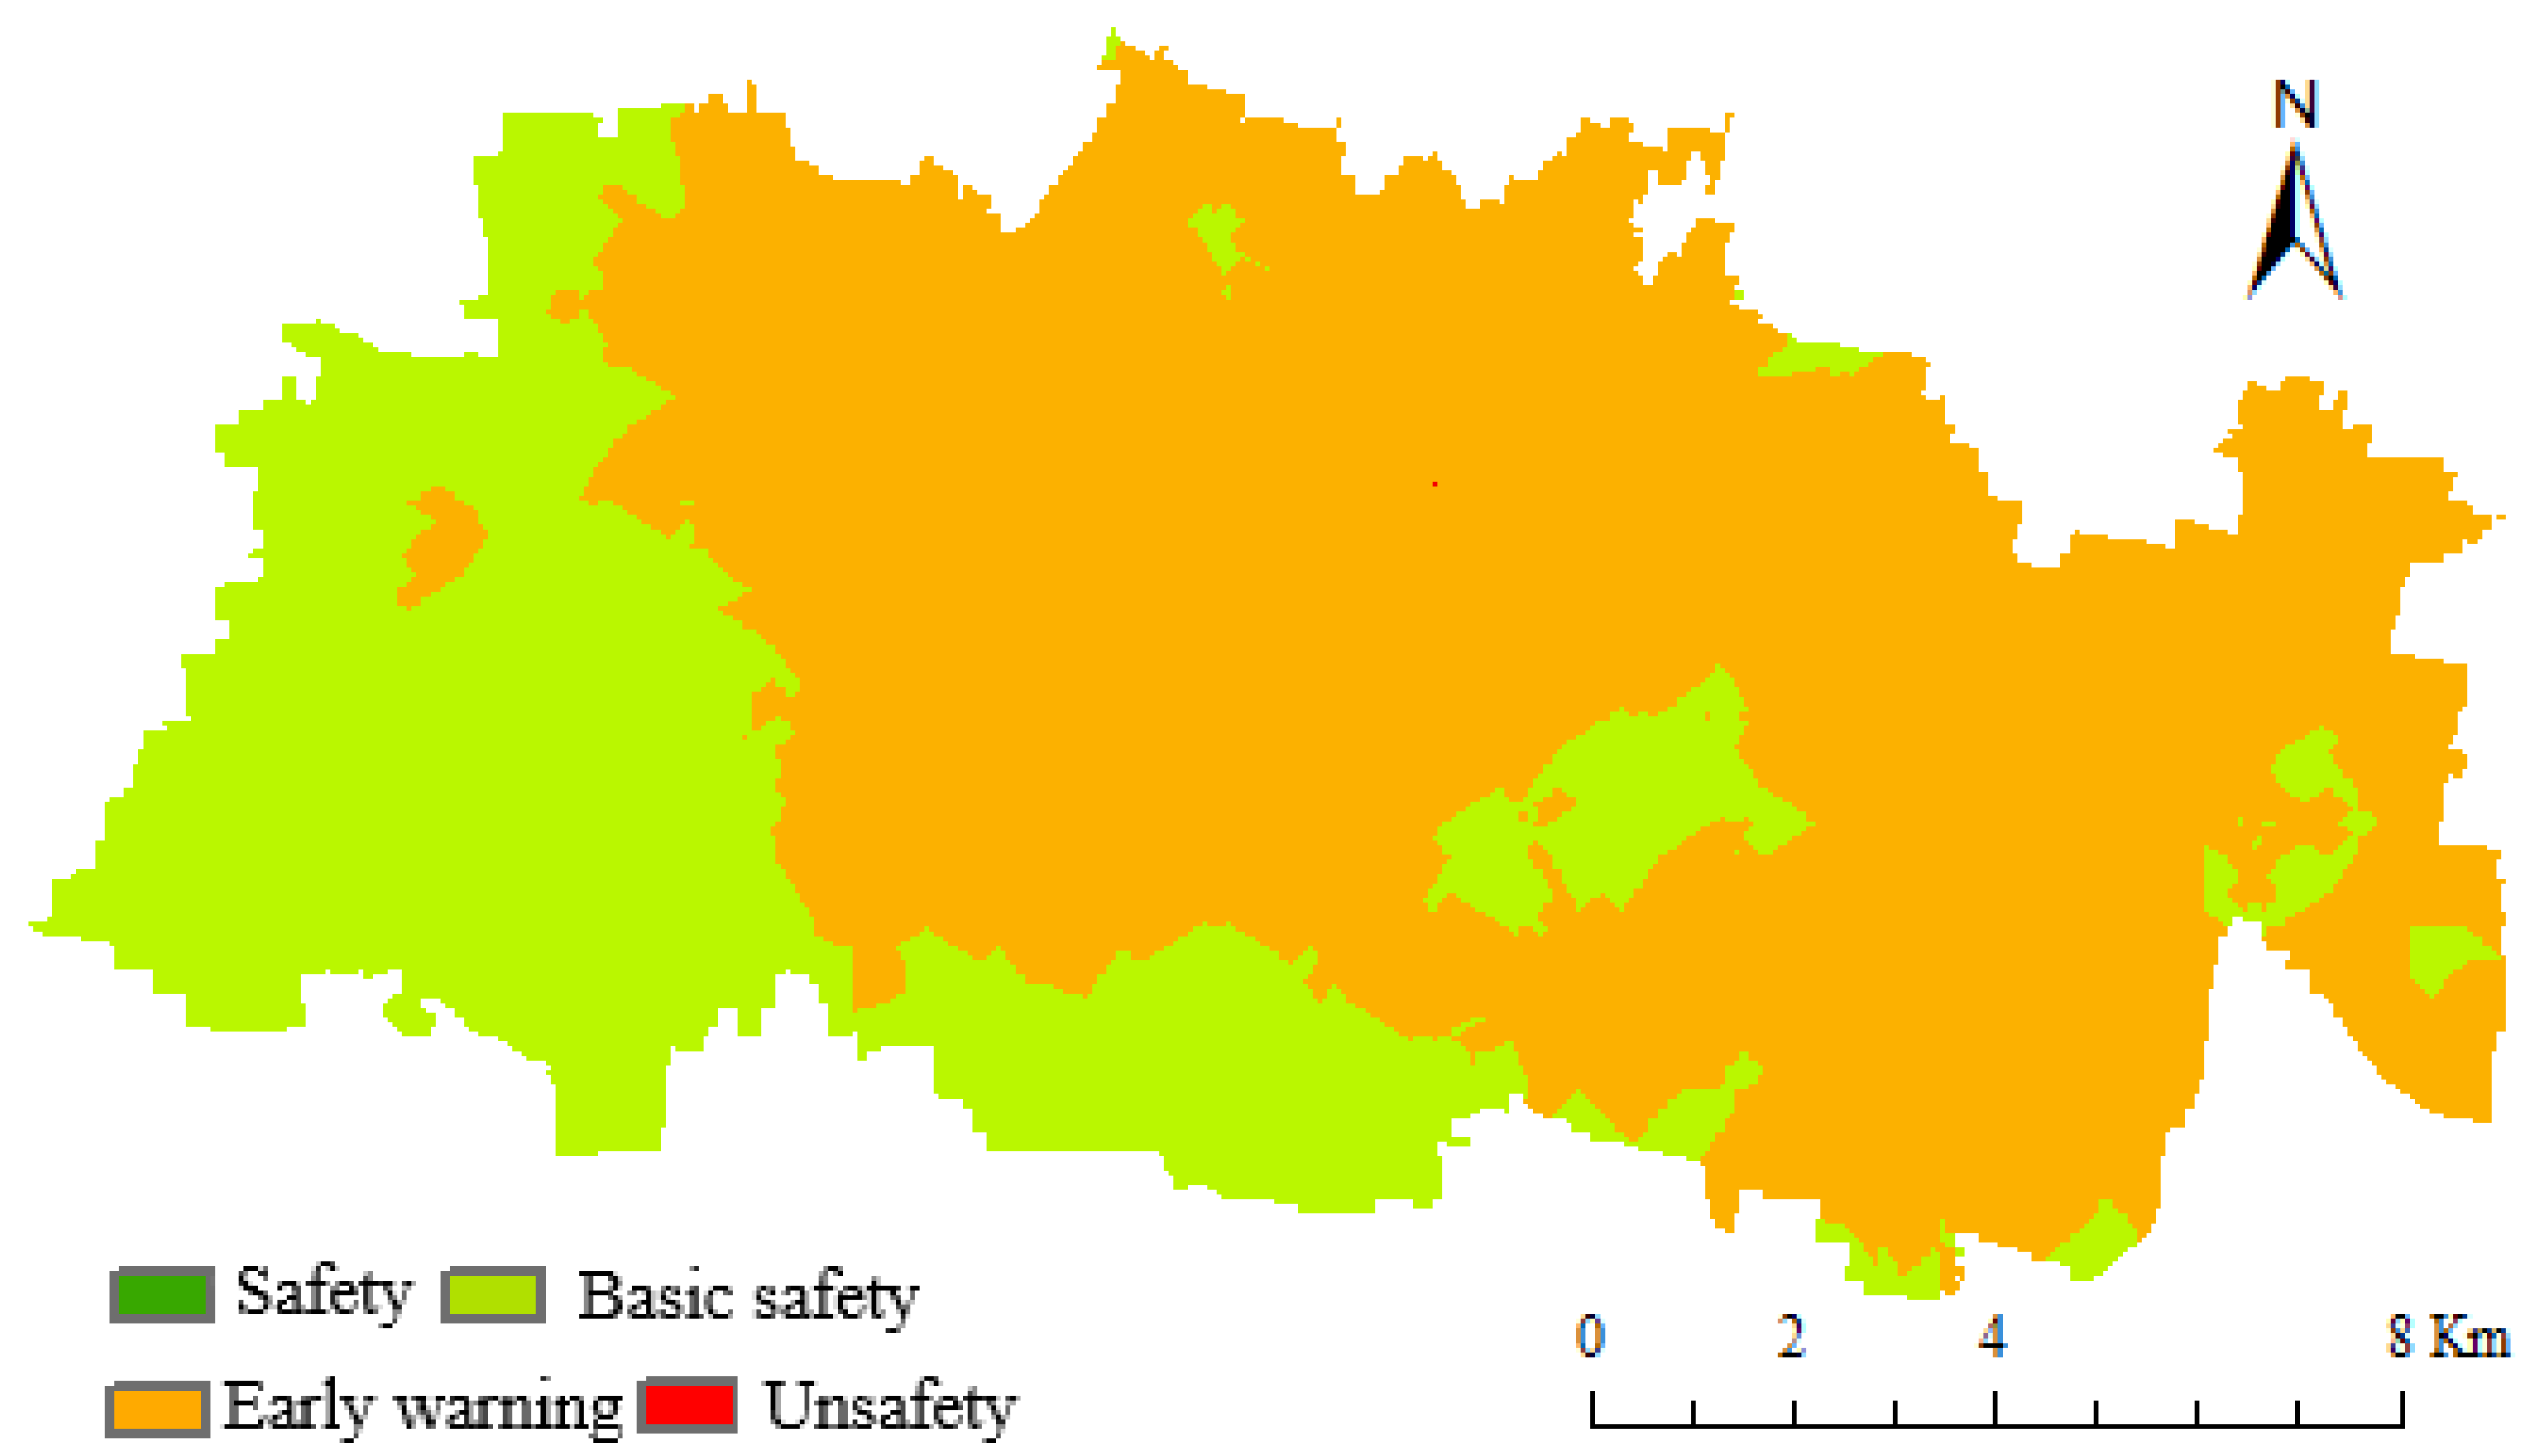
Using the Reclass tool in the IDRISI software, referring to the previously determined classification system, the reclassification results of the landscape forecast in 2029 can be obtained. Then, on the basis of the reclassification results, the landscape ecological security level distribution map of the study area in 2029 (Figure 7) can be obtained by using the constructed landscape ecological security evaluation model and spatial analysis method. The results show that the landscape ecology of the study area in 2029 will be mainly in two levels: basic safety and early warning. Among them, the area of the basic safety zone will be 5999.40 hm2, accounting for 31.28% of the total area of the region, distributed mainly in the west and south–central of the study area; the rest is the early warning area, with an area of 13,179.06 hm2, accounting for 68.72% of the total area of the region. Compared with 2019, the landscape ecological safety of the study area will show a turnaround, in which the area of the basic safety zone will increase by 11.52%, and the early warning zone and the unsafe zone will decrease by 5.83% and 5.69%, respectively. The turnaround areas will be distributed mainly in the surrounding land remediation and reclamation areas and collapse water accumulation areas of the Zhaogu I and II mines. Through reasonable planning and land remediation, it will help the transition to a safer landscape ecological environment.

4. Discussion

4.1. Landscape Ecological Safety Pattern

In the overlapped area of crop and coal production, the dynamic changes between land use types and their degree of conversion are at a high level under the disturbance of anthropogenic activities, such as coal mining, urban and rural construction, land reclamation, and ecological remediation [41]. In landscapes where human activities play a dominant role, land use is a major determinant of the spatial pattern of the landscape [42]. Changes in land use types lead to changes in the structure of regional ecosystems and their components, which, in turn, affect the spatial pattern of the regional landscape [43]. Previous studies have shown that coal mining has increased the fragmentation of mining landscapes by influencing land use changes, severely affecting the landscape pattern of mining areas and, thus, increasing the ecological risk of the region [44,45]. The results of this study also indicate that the construction of industrial and mining sites, the expansion and relocation of settlements, and the subsidence of coal mining at the early stage of coal mining led to the suppression and destruction of arable land, resulting in a gradual decrease in the area of arable land, while the dominance of industrial, mining, and construction sites continued to increase, resulting in the replacement and cutting of the original surface landscape, thus leading to an increase in the fragmentation of the landscape in the study area, the deterioration of landscape connectivity, and the development of the landscape shape in the direction of complexity and irregularity. Therefore, the landscape pattern indices AREA_MN and CONTAG gradually decreased and the landscape shape index (LSI) gradually increased in the early stage of the study. SHDI correlates with the degree of heterogeneity at the landscape level [46]; for 2004–2014, SHDI has been increasing, indicating that the area of cultivated land in the dominant landscape type has decreased, the difference in land area ratio between landscape types has decreased, and landscape heterogeneity in the study area has increased during this period as arable land has been destroyed and occupied by production and construction in mining areas [47]. High landscape heterogeneity is conducive to biodiversity conservation and improvement of ecological functions, but excessively fragmented habitats will lead to high landscape heterogeneity, which is not conducive to the migration and reproduction of wild animals and brings certain ecological risks [48]. Although coal mining activities bring ecological risks to the region, the landscape pattern of the mining area can be continually optimized through reasonable planning and management, thus improving the landscape ecology of the region [49]. In this study, the AREA_MN and CONTAG indices increased again in the late study period, while LSI and SHDI showed a more obvious downward trend. This indicates that the implementation of remediation and reclamation projects for abandoned village land and sunken land in the later part of the study (after 2014) has led to a small increase in the area of cultivated land in the study area and a regularization of the shape of the regional landscape boundaries, as well as a rising and concentrated distribution of water areas due to the mining of sunken water, a decrease in landscape fragmentation and landscape dispersion, and an increase in the function of material and energy exchange between landscapes [50]. Mining subsidence areas are properly integrated into the surrounding landscape or transformed into wetlands [51], resulting in a continuous increase in the concentration of the landscape, reduced landscape heterogeneity, enhanced connectivity, and optimized landscape patterns, thereby helping to reduce the impact of coal mining and ecological risk.

4.2. Spatial and Temporal Variation in Landscape Ecological Safety in the Study Area

Large-scale, long-duration coal mining in the overlapped area of crop and coal production has caused serious damage to the original agro-ecological landscape, resulting in a series of serious ecological and environmental problems. A timely and scientific ecological risk assessment study of the regional ecology can help provide a theoretical basis and technical support for subsequent ecological management work. As the overlapped area of crop and coal production is a complex ecosystem centered on human agricultural production and mining activities, the emergence, development, and demise of the system is not only influenced by human will but also by the natural environment and socio-economic constraints, resulting in complex and variable regional ecological problems. Therefore, the selection of a suitable evaluation method is the key to regional ecological safety evaluation research. The landscape is a suitable scale for studying the impact of human activities on the ecological environment and is also the basic unit for regional ecological safety management [52]. In landscapes dominated by human activities, different land use patterns and intensities will have cumulative impacts on the structure and function of regional ecosystems and may affect the stability of ecosystems and ecological security. Some scholars have analyzed the spatial and temporal dynamics of ecological security in different regions by selecting representative landscape mosaic indices [16,53]; these research results provide an important reference for this study to evaluate regional landscape ecological security. Therefore, on the basis of the dynamic changes of land use and landscape patterns, this study analyzed the spatio-temporal evolution characteristics of regional landscape ecological security combined with spatial statistics. The results of the study show that in the temporal dimension, the overall landscape ecological safety in the study area shows a change characteristic of first deteriorating and then gradually improving. In the spatial dimension, coal mining and urban and rural construction activities have led to an increasing ratio in the area of the early warning zone and a decreasing ratio in the area of the basic safety zone, but the ratio of the area of the unsafe zone shows a characteristic of first increasing and then decreasing. Any pressure from coal mining operations, residential production, and natural erosion in mining areas cannot be ignored, and the continuous increase in unsafe areas is concentrated in the areas surrounding the expansion of mining production, especially in the mining subsidence areas and the disturbed areas nearby [45,54]. Although large-scale coal mining subsidence can affect the ecological safety of the region, reclamation and treatment works for the subsidence areas can lead to substantial improvements in the landscape ecological condition of the mining area [4,44], and the increased water area also contributes to the improvement of the landscape ecological safety level as mining activities continue and the extent of mining subsidence expands [55]. This study also showed that the proportion of unsafe area decreased significantly by the later stage (2019), which was due mainly to the fact that the land in the area underwent land ecological remediation and reclamation to improve the ecological quality of the cultivated landscape, and the reclaimed area was converted into a safe area. In addition, the increasing and concentrated distribution of waterlogged areas in the sinkhole and the ecological management of sinkhole areas have improved the ecological quality of the regional landscape, which has also transformed the area into a safe area. It can be seen that although coal mining poses certain ecological risks to the area, the implementation of reasonable land ecological remediation projects can play a certain role in mitigating the ecological risks to the area [56].

4.3. Landscape Ecological Safety Predictions

As a complex ecosystem under the interaction between humans and nature, the overlapped area of crop and coal production is continuously affected by the cumulative impact of human activities, such as mining activities and artificial restoration, urban and rural construction, and agricultural production, and its safety status is in a dynamic state of change, showing a trend of gradual deterioration as well as the possibility of development towards improvement [57]. Dynamic forecasting of the impact of future production and construction on regional ecological safety in the study area allows us to keep abreast of the ecological safety situation and trends in the mining area and provides a reference for decision-making on regional ecological environmental protection and the sustainable development of coal and food production. Landscape ecological safety prediction models not only need to reasonably predict the future land quantity but also require an accurate grasp of the dynamic changes in the regional landscape [58]. Considering the special characteristics of the overlapped area of crop and coal production, the CA-Markov model, which has the advantages of both predicting quantity and spatial distribution, was selected for this study. In this model, the determination of the transformation rules is the focus of the application of the model for landscape change simulation and prediction [59,60]. On the basis of field research on the actual situation of land use changes in different periods and the possible damage to the surface landscape caused by future coal mining activities, combined with the relocation arrangements of villages in the mining area and the reclamation plan for the remediation of damaged land, a conversion rule was formulated that is more in line with the actual characteristics of the landscape evolution in the mining area. It has been verified that the conversion rule achieves high simulation accuracy in landscape evolution simulation and prediction. On the basis of the analysis of the impact of future mining subsidence, land reclamation, and urban–rural construction on regional landscape elements, the model uses the land use landscape type in 2019 as the base period data to predict the landscape security status in 2029. The prediction results show that in 2029, the unsafe area around the subsidence waters in the study area will disappear, and its safety level will be turned into a “warning” state. The ecological security level of the subsidence water accumulation area and its surroundings in the Zhaogu II mine will be raised from “warning” to “basic safety”. The ecological safety of the study area’s landscape has gradually improved, restoring the ecological function of the land in the collapse zone, thanks mainly to rational land remediation planning and management [61]. Therefore, by analyzing the current situation of landscape ecological safety in the study area and predicting the future safety condition, identifying the distribution of landscape ecological insecurity zones and early warning zones, and formulating multi-level ecological restoration strategies according to the different “zones” [62], the theoretical basis and technical support can be provided for the subsequent development of ecological environmental management work.
By analyzing the spatio-temporal evolution characteristics of landscape ecological security in the Zhaogu mining area and predicting the future landscape security status, this study completes the systematic integration and deepening of previous studies. The division of landscape types is the basis of landscape ecology research. Due to the limitation of the spatial resolution of images, the landscape types cannot be further subdivided. The construction of evaluation indicators is a key link in the evaluation of landscape ecological security, and the indicator system needs to be further supplemented and improved. In addition, in order to improve the scientificity of the landscape prediction results, other prediction models should be added to the subsequent study for comparative simulation, thus providing scientific guidance for the sustainable development of the mining ecosystem.

5. Conclusions

On the basis of four periods of remote sensing images during 2004–2019, the spatial and temporal variation characteristics of regional landscape ecological safety were studied by analyzing the spatial and temporal changes of landscape elements and patterns in the study area, and the CA-Markov model was used to predict the landscape pattern and the trend of ecological safety changes in the study area in 2029. The results showed the following:
(1)
During the study period, the landscape pattern of the study area shows obvious stage characteristics: from 2004 to 2014, the landscape pattern develops in the direction of fragmentation, irregularity, heterogeneity, and low connectivity; after 2014, it shows the trend of continuous, regular, balanced, and high connectivity changes.
(2)
The ecological safety of the landscape in the study area shows obvious spatial and temporal changes. In the time dimension, the overall ecological safety of the landscape in the study area from 2004 to 2019 shows a change characteristic of first becoming worse and then gradually improving. The area of the basic safety zone keeps decreasing, the area of the warning zone keeps increasing, while the area of the unsafe zone shows the characteristic of first increasing and then decreasing; on the spatial scale, the unsafe zone in 2004 is distributed mainly in the south and north of the study area. By 2019, the area of the unsafe zone in the study area was significantly reduced by the influence of land remediation and reclamation.
(3)
Using the 2019 land-use landscape type as the base period data, the regional landscape security status in 2029 is predicted. The study found that the degree of landscape fragmentation in the study area will tend to decrease and the landscape connectivity will increase between 2019 and 2029. The shape of landscape patches tended to be regular, and the landscape heterogeneity will be enhanced. The landscape ecological security in the study area shows a trend of improvement.

Author Contributions

Conceptualization, Q.Y.; methodology, Q.Y. and F.X.; software, F.X. and H.Z.; validation, H.Z., Q.Y. and S.M.; data curation, F.X.; writing—original draft preparation, Q.Y.; writing—review and editing, S.M. and H.Z.; visualization, F.X.; funding acquisition, S.M., H.Z. and Q.Y. All authors have read and agreed to the published version of the manuscript.

Funding

This research was funded by the National Natural Science Foundations of China (grant number U21A20108; 31871553) and the Natural Resources Science and Technology Project of Henan Provincial Department of Natural Resources (grant number Yu Zheng Cai (2) 20190450-7).

Data Availability Statement

The data presented in this study are available on request from the corresponding author.

Conflicts of Interest

The authors declare no conflict of interest.

References

  1. He, T.; Xiao, W.; Zhao, Y.; Chen, W.; Deng, X.; Zhang, J. Continues Monitoring of Subsidence Water in Mining Area from the Eastern Plain in China from 1986 to 2018 Using Landsat Imagery and Google Earth Engine. J. Clean. Prod. 2021, 279, 123610. [Google Scholar] [CrossRef]
  2. Hu, Z. The 30 Years Land Reclamation and Ecological Restoration in China: Review, Rethinking and Prospect. Coal Sci. Technol 2019, 47, 25–35. [Google Scholar] [CrossRef]
  3. Chen, Z.; Yang, Y.; Zhou, L.; Hou, H.; Zhang, Y.; Liang, J.; Zhang, S. Ecological Restoration in Mining Areas in the Context of the Belt and Road Initiative: Capability and Challenges. Environ. Impact Assess. Rev. 2022, 95, 106767. [Google Scholar] [CrossRef]
  4. Xu, J.; Li, G.; Chen, G.; Zhao, H.; Qu, J. Changes of Landscape Ecological Quality for Land Reclamation in Mining Area. Trans. Chin. Soc. Agric. Eng. 2013, 29, 232–239. [Google Scholar]
  5. Bian, Z.; Lei, S.; Jin, D.; Wang, L. Several Basic Scientific Issues Related to Mined Land Remediation. J. China Coal Soc. 2018, 43, 190–197. [Google Scholar] [CrossRef]
  6. Gao, Y.; Huang, H.; Wu, Z. Landscape Ecological Security Assessment Based on Projection Pursuit: A Case Study of Nine Cities in the Pearl River Delta. Acta Ecol. Sin. 2010, 30, 5894–5903. [Google Scholar]
  7. Xiao, D.; Chen, W. On the Basic Concepts and Contents of Ecological Security. J. Appl. Ecol. 2002, 13, 354–358. [Google Scholar] [CrossRef]
  8. Kullenberg, G. Regional Co-Development and Security: A Comprehensive Approach. Ocean Coast. Manag. 2002, 45, 761–776. [Google Scholar] [CrossRef]
  9. Wang, G.; Wu, W. Regional Ecological Security Mechanism and Impact Factors Indicator System. China Saf. Sci. J. 2006, 16, 11–15. [Google Scholar] [CrossRef]
  10. Zuo, W.; Zhou, H.; Wang, Q. Conceptual Framework for Selection of an Indicator System for Assessment of Regional Ecological Safety. Soils 2003, 35, 2–7. [Google Scholar] [CrossRef]
  11. Zhang, X.C.; Ma, C.; Zhan, S.F.; Chen, W.P. Evaluation and Simulation for Ecological Risk Based on Emergy Analysis and Pressure-State-Response Model in a Coastal City, China. Procedia Environ. Sci. 2012, 13, 221–231. [Google Scholar] [CrossRef] [Green Version]
  12. Liang, P.; Liming, D.; Guijie, Y. Ecological Security Assessment of Beijing Based on PSR Model. Procedia Environ. Sci. 2010, 2, 832–841. [Google Scholar] [CrossRef]
  13. Du, P.; Xia, J.; Du, Q.; Luo, Y.; Tan, K. Evaluation of the Spatio-Temporal Pattern of Urban Ecological Security Using Remote Sensing and GIS. Int. J. Remote Sens. 2013, 34, 848–863. [Google Scholar] [CrossRef]
  14. Ma, S.-Q.; Cao, H.; Wang, J.; Lin, S. Study on Eco-Safety Early-Warning and Assessment Index System of Hainan Province. In Ecosystem Assessment and Fuzzy Systems Management; Cao, B.-Y., Ma, S.-Q., Cao, H., Eds.; Advances in Intelligent Systems and Computing; Springer International Publishing: Cham, Switzerland, 2014; Volume 254, pp. 33–43. ISBN 978-3-319-03448-5. [Google Scholar]
  15. Chen, Y.; Wang, J. Ecological Security Early-Warning in Central Yunnan Province, China, Based on the Gray Model. Ecol. Indic. 2020, 111, 106000. [Google Scholar] [CrossRef]
  16. Wang, Q.; Jin, X.; Zhou, Y. Dynamic Analysis of Coastal Region Cultivated Land Landscape Ecological Security and Its Driving Factors in Jiangsu. Acta Ecol. Sin. 2011, 31, 5903–5909. [Google Scholar]
  17. Yu, X.; Wu, K.; Yun, W.; Wei, H.; Liu, L.; Song, Y.; Gao, X. Analysis on Temporal and Spatial Variation of Landscape Ecological Security in Modern Agricultural Area. Trans. Chin. Soc. Agric. Eng. 2016, 32, 253–259. [Google Scholar] [CrossRef]
  18. XIE, Y.; GONG, J.; ZHANG, L. Dynamics of Landscape Ecological Security Based on PSR Model in Bailongjiang River Watershed. Sci. Geogra Sin. 2015, 35, 790–797. [Google Scholar] [CrossRef]
  19. Gao, Y.; Wu, Z.; Lou, Q.; Huang, H.; Cheng, J.; Chen, Z. Landscape Ecological Security Assessment Based on Projection Pursuit in Pearl River Delta. Environ. Monit. Assess. 2012, 184, 2307–2319. [Google Scholar] [CrossRef]
  20. Yu, J.; Tang, B.; Chen, Y.; Zhang, L.; Nie, Y.; Deng, W. Landscape Ecological Risk Assessment and Ecological Security Pattern Construction in Landscape Resource-Based City: A Case Study of Zhangjiajie City. Acta Ecol. Sin. 2022, 42, 1290–1299. [Google Scholar] [CrossRef]
  21. Li, Y.; Sun, X.; Zhu, X.; Cao, H. An Early Warning Method of Landscape Ecological Security in Rapid Urbanizing Coastal Areas and Its Application in Xiamen, China. Ecol. Model. 2010, 221, 2251–2260. [Google Scholar] [CrossRef]
  22. ZHANG, L.; ZHANG, S.; YE HC, H.Y. Landscape Indices of Land Damage and Land Reclamation in an Opencast Coal Mine. Resour. Sci. 2014, 36, 55. [Google Scholar]
  23. Gao, X.; Cai, X.; Wang, J.; Mu, Y. Analysis of Landscape Pattern Change and Its Driving Forces in Typical Mining Area of Guizhou Province during 10 Years. Environ. Sci. Technol. 2013, 36, 168–174. [Google Scholar]
  24. Ma, S.; Xie, F.; Ding, C.; Zhang, H. Spatio-Temporal Change of Landscape Ecological Quality and Influencing Factors Based on Four-Quadrant Model in Overlapped Area of Cropland and Coal Production. Trans. Chin. Soc. Agric. Eng. 2019, 36, 259–268. [Google Scholar] [CrossRef]
  25. Vivekananda, G.; Swathi, R.; Sujith, A. Multi-Temporal Image Analysis for LULC Classification and Change Detection. Eur. J. Remote Sens. 2021, 54, 189–199. [Google Scholar] [CrossRef]
  26. Duan, Y.; Wang, X.; Wei, Y. Land Use Change Analysis of Daishan Island Using Multi-Temporal Remote Sensing Imagery. Arab. J. Geosci. 2020, 13, 741. [Google Scholar] [CrossRef]
  27. Fu, G.; Wang, W.; Li, J.; Xiao, N.; Qi, Y. Prediction and Selection of Appropriate Landscape Metrics and Optimal Scale Ranges Based on Multi-Scale Interaction Analysis. Land 2021, 10, 1192. [Google Scholar] [CrossRef]
  28. Li, B.; Gu, H.; Ji, Y. Evaluation of Landscape Pattern Changes and Ecological Effects in Land Reclamation Project of Mining Area. Trans. Chin. Soc. Agric. Eng. 2012, 28, 251–256. [Google Scholar] [CrossRef]
  29. Wu, J.; Yu, X. Landscape Ecology, Patterns, Processes, Scales and Grades. Beijing High. Educ. Press 2007, 4, 106–120. [Google Scholar]
  30. Qing, F.T.; Peng, Y. Temporal and Spatial Characteristics of Ecological Risk in Shunyi, Beijing, China Based on Landscape Structure. Chin. J. Appl. Ecol. 2016, 27, 1585–1593. [Google Scholar] [CrossRef]
  31. Liu, P.; Zhang, X.; Ma, C.; Zhang, H.; Han, R.; Lu, X. Ecological Security Assessment Based on Remote Sensing and Landscape Ecology Model. J. Sens. 2021, 2021, 6684435. [Google Scholar] [CrossRef]
  32. Gkyer, E. Understanding Landscape Structure Using Landscape Metrics. In Advances in Landscape Architecture; Ozyavuz, M., Ed.; InTech: London, UK, 2013; ISBN 978-953-51-1167-2. [Google Scholar]
  33. Ji, D.Q.; Wen, Y.; Wei, J.B.; Wu, Z.F.; Cheng, J.; Liu, Q. Dynamic Trend of Land Use Landscape Ecological Security in Liuxihe Watershed. Trop. Geogr. 2013, 33, 299–306. [Google Scholar] [CrossRef]
  34. Xie, G.; Zhen, L.; Lu, C.-X.; Xiao, Y.; Chen, C. Expert Knowledge Based Valuation Method of Ecosystem Services in China. J. Nat. Resour 2008, 23, 911–919. [Google Scholar]
  35. Wang, Y.; Yu, X.; He, K.; Li, Q.; Zhang, Y.; Song, S. Dynamic Simulation of Land Use Change in Jihe Watershed Based on CA-Markov Model. Trans. Chin. Soc. Agric. Eng. 2011, 27, 330–336. [Google Scholar] [CrossRef]
  36. Guan, D.; Li, H.; Inohae, T.; Su, W.; Nagaie, T.; Hokao, K. Modeling Urban Land Use Change by the Integration of Cellular Automaton and Markov Model. Ecol. Model. 2011, 222, 3761–3772. [Google Scholar] [CrossRef]
  37. Ye, B.; Bai, Z. Simulating Land Use/Cover Changes of Nenjiang County Based on CA-Markov Model; Springer: Berlin/Heidelberg, Germany, 2007; pp. 321–329. [Google Scholar]
  38. Sang, L.; Zhang, C.; Yang, J.; Zhu, D.; Yun, W. Simulation of Land Use Spatial Pattern of Towns and Villages Based on CA–Markov Model. Math. Comput. Model. 2011, 54, 938–943. [Google Scholar] [CrossRef]
  39. Hishe, S.; Bewket, W.; Nyssen, J.; Lyimo, J. Analysing Past Land Use Land Cover Change and CA-Markov-Based Future Modelling in the Middle Suluh Valley, Northern Ethiopia. Geocarto Int. 2020, 35, 225–255. [Google Scholar] [CrossRef]
  40. Zhou, L.; Dang, X.; Sun, Q.; Wang, S. Multi-Scenario Simulation of Urban Land Change in Shanghai by Random Forest and CA-Markov Model. Sustain. Cities Soc. 2020, 55, 102045. [Google Scholar] [CrossRef]
  41. Zhang, M.; Wang, J.; Li, S.; Feng, D.; Cao, E. Dynamic Changes in Landscape Pattern in a Large-Scale Opencast Coal Mine Area from 1986 to 2015: A Complex Network Approach. Catena 2020, 194, 104738. [Google Scholar] [CrossRef]
  42. Peng, B.; Chen, D.; Li, W.; Wang, Y. Stability of Landscape Pattern of Land Use: A Case Study of Changde. Sci. Geogr. Sin. 2013, 33, 1484–1488. [Google Scholar]
  43. Zongming, W.; Bai, Z.; Shuqing, Z. Study on the Effects of Land Use Change on Ecosystem Service Values of Jilin Province. J. Nat. Resour. 2004, 19, 55–61. [Google Scholar]
  44. Chang, X.; Li, X.; Li, X.; Guo, P.; Gao, F. Spatial-Temporal Heterogeneity of Ecological Risk of Land Use in Mining Areas. Acta Ecol. Sin. 2019, 39, 3075–3088. [Google Scholar]
  45. Wu, J.; Zhu, Q.; Qiao, N.; Wang, Z.; Sha, W.; Luo, K.; Wang, H.; Feng, Z. Ecological Risk Assessment of Coal Mine Area Based on “Source-Sink” Landscape Theory—A Case Study of Pingshuo Mining Area. J. Clean. Prod. 2021, 295, 126371. [Google Scholar] [CrossRef]
  46. Zhang, L.; Zhou, Y.; Men, M.; Xu, H.; Wang, S. Land Use Scenario Simulation with Different Types of Ecological Security. Trans. Chin. Soc. Agric. Eng. 2015, 31, 308–316. [Google Scholar] [CrossRef]
  47. Feng, J.; Dong, G.; Guo, L.; Wen, Q. Ecological Responses to Changing Landscape Patterns in Yushenfu Mining Area. Arid Zone Res. 2014, 31, 1141–1146. [Google Scholar] [CrossRef]
  48. WANG, M.; LIU, X. Ecological Risk Assessment of Hong He County in Yunnan Province Based on Landscape Heterogeneity. J. Gansu Agric. Univ. 2016, 51, 101–107. [Google Scholar] [CrossRef]
  49. Xu, J.; Zhao, H.; Li, G.; Wu, L.; Fu, J. Land Ecological Assessment and Its Spatial Variation in Coal Mining Area. J. China Univ. Min. Technol. 2017, 46, 192–200. [Google Scholar]
  50. Yang, H.; Zhong, X.; Deng, S.; Nie, S. Impact of LUCC on Landscape Pattern in the Yangtze River Basin during 2001–2019. Ecol. Inform. 2022, 69, 101631. [Google Scholar] [CrossRef]
  51. Xu, J.; Zhao, H.; Yin, P.; Bu, N.; Li, G. Impact of Underground Coal Mining on RegionalLandscape Pattern Change Based on Life Cycle:A Case Study in Peixian, China. Pol. J. Environ. Stud. 2019, 28, 4455–4465. [Google Scholar] [CrossRef]
  52. Wang, J.; Cui, B.; Liu, J.; Yao, H.; Zhai, H. The Effect of Land Use and Its Change on Ecological Risk in the Lancang River Watershed of Yunnan Province at the Landscape Scale. Acta Sci. Circumstantiae 2008, 28, 269–277. [Google Scholar] [CrossRef]
  53. Jinrui, L.; Zongzhu, C.; Yiqing, C.; Xiaohua, C.; Yuanling, L.; Tingtian, W. Dynamic Analysis of Wetland Landscape Ecological Security Pattern of Hainan Island in 1990–2018. Ecol. Environ. 2020, 29, 293. [Google Scholar] [CrossRef]
  54. Feng, H.; Zhou, J.; Zhou, A.; Xu, H.; Su, D.; Han, X. Spatiotemporal Variation Indicators for Vegetation Landscape Stability and Processes Monitoring of Semiarid Grassland Coal Mine Areas. Land Degrad. Dev. 2022, 33, 3–17. [Google Scholar] [CrossRef]
  55. Zhou, S. Study on the Evaluation and Forewarning of Wetland Landscape Ecological Security for the Coal Resource-Based Cities Based on Scenario Simulation. Ph.D. Thesis, China University of Mining and Technology, Beijing, China, 2020. [Google Scholar]
  56. Wang, D.; Ji, X.; Li, C.; Gong, Y. Spatiotemporal Variations of Landscape Ecological Risks in a Resource-Based City under Transformation. Sustainability 2021, 13, 5297. [Google Scholar] [CrossRef]
  57. Li, S.; Xiao, W.; Zhao, Y.; Lv, X. Incorporating Ecological Risk Index in the Multi-Process MCRE Model to Optimize the Ecological Security Pattern in a Semi-Arid Area with Intensive Coal Mining: A Case Study in Northern China. J. Clean. Prod. 2020, 247, 119143. [Google Scholar] [CrossRef]
  58. Meng, X.; Ren, Z.; Dai, R. Ecological Security Evaluation and Its Forecast Analysis of Baoji City Using Pressure- State-Response Model. Bull. Soil Water Conserv. 2012, 32, 231–235. [Google Scholar] [CrossRef]
  59. Guan, D.; Zhao, Z.; Tan, J. Dynamic Simulation of Land Use Change Based on Logistic-CA-Markov and WLC-CA-Markov Models: A Case Study in Three Gorges Reservoir Area of Chongqing, China. Environ. Sci. Pollut Res. 2019, 26, 20669–20688. [Google Scholar] [CrossRef] [PubMed]
  60. Mansour, S.; Al-Belushi, M.; Al-Awadhi, T. Monitoring Land Use and Land Cover Changes in the Mountainous Cities of Oman Using GIS and CA-Markov Modelling Techniques. Land Use Policy 2020, 91, 104414. [Google Scholar] [CrossRef]
  61. Tao, X.; Zhu, J. Analysis of Early-Warning Evaluation of Ecological Safety and Driving Force in Mining Area Based on Scenario Prediction A Case of Yima Coal-Mining Area. Resour. Dev. Mark. 2016, 32, 298–303. [Google Scholar] [CrossRef]
  62. Qu, Y.; Zong, H.; Su, D.; Ping, Z.; Guan, M. Land Use Change and Its Impact on Landscape Ecological Risk in Typical Areas of the Yellow River Basin in China. Int. J. Environ. Res. Public Health 2021, 18, 11301. [Google Scholar] [CrossRef]
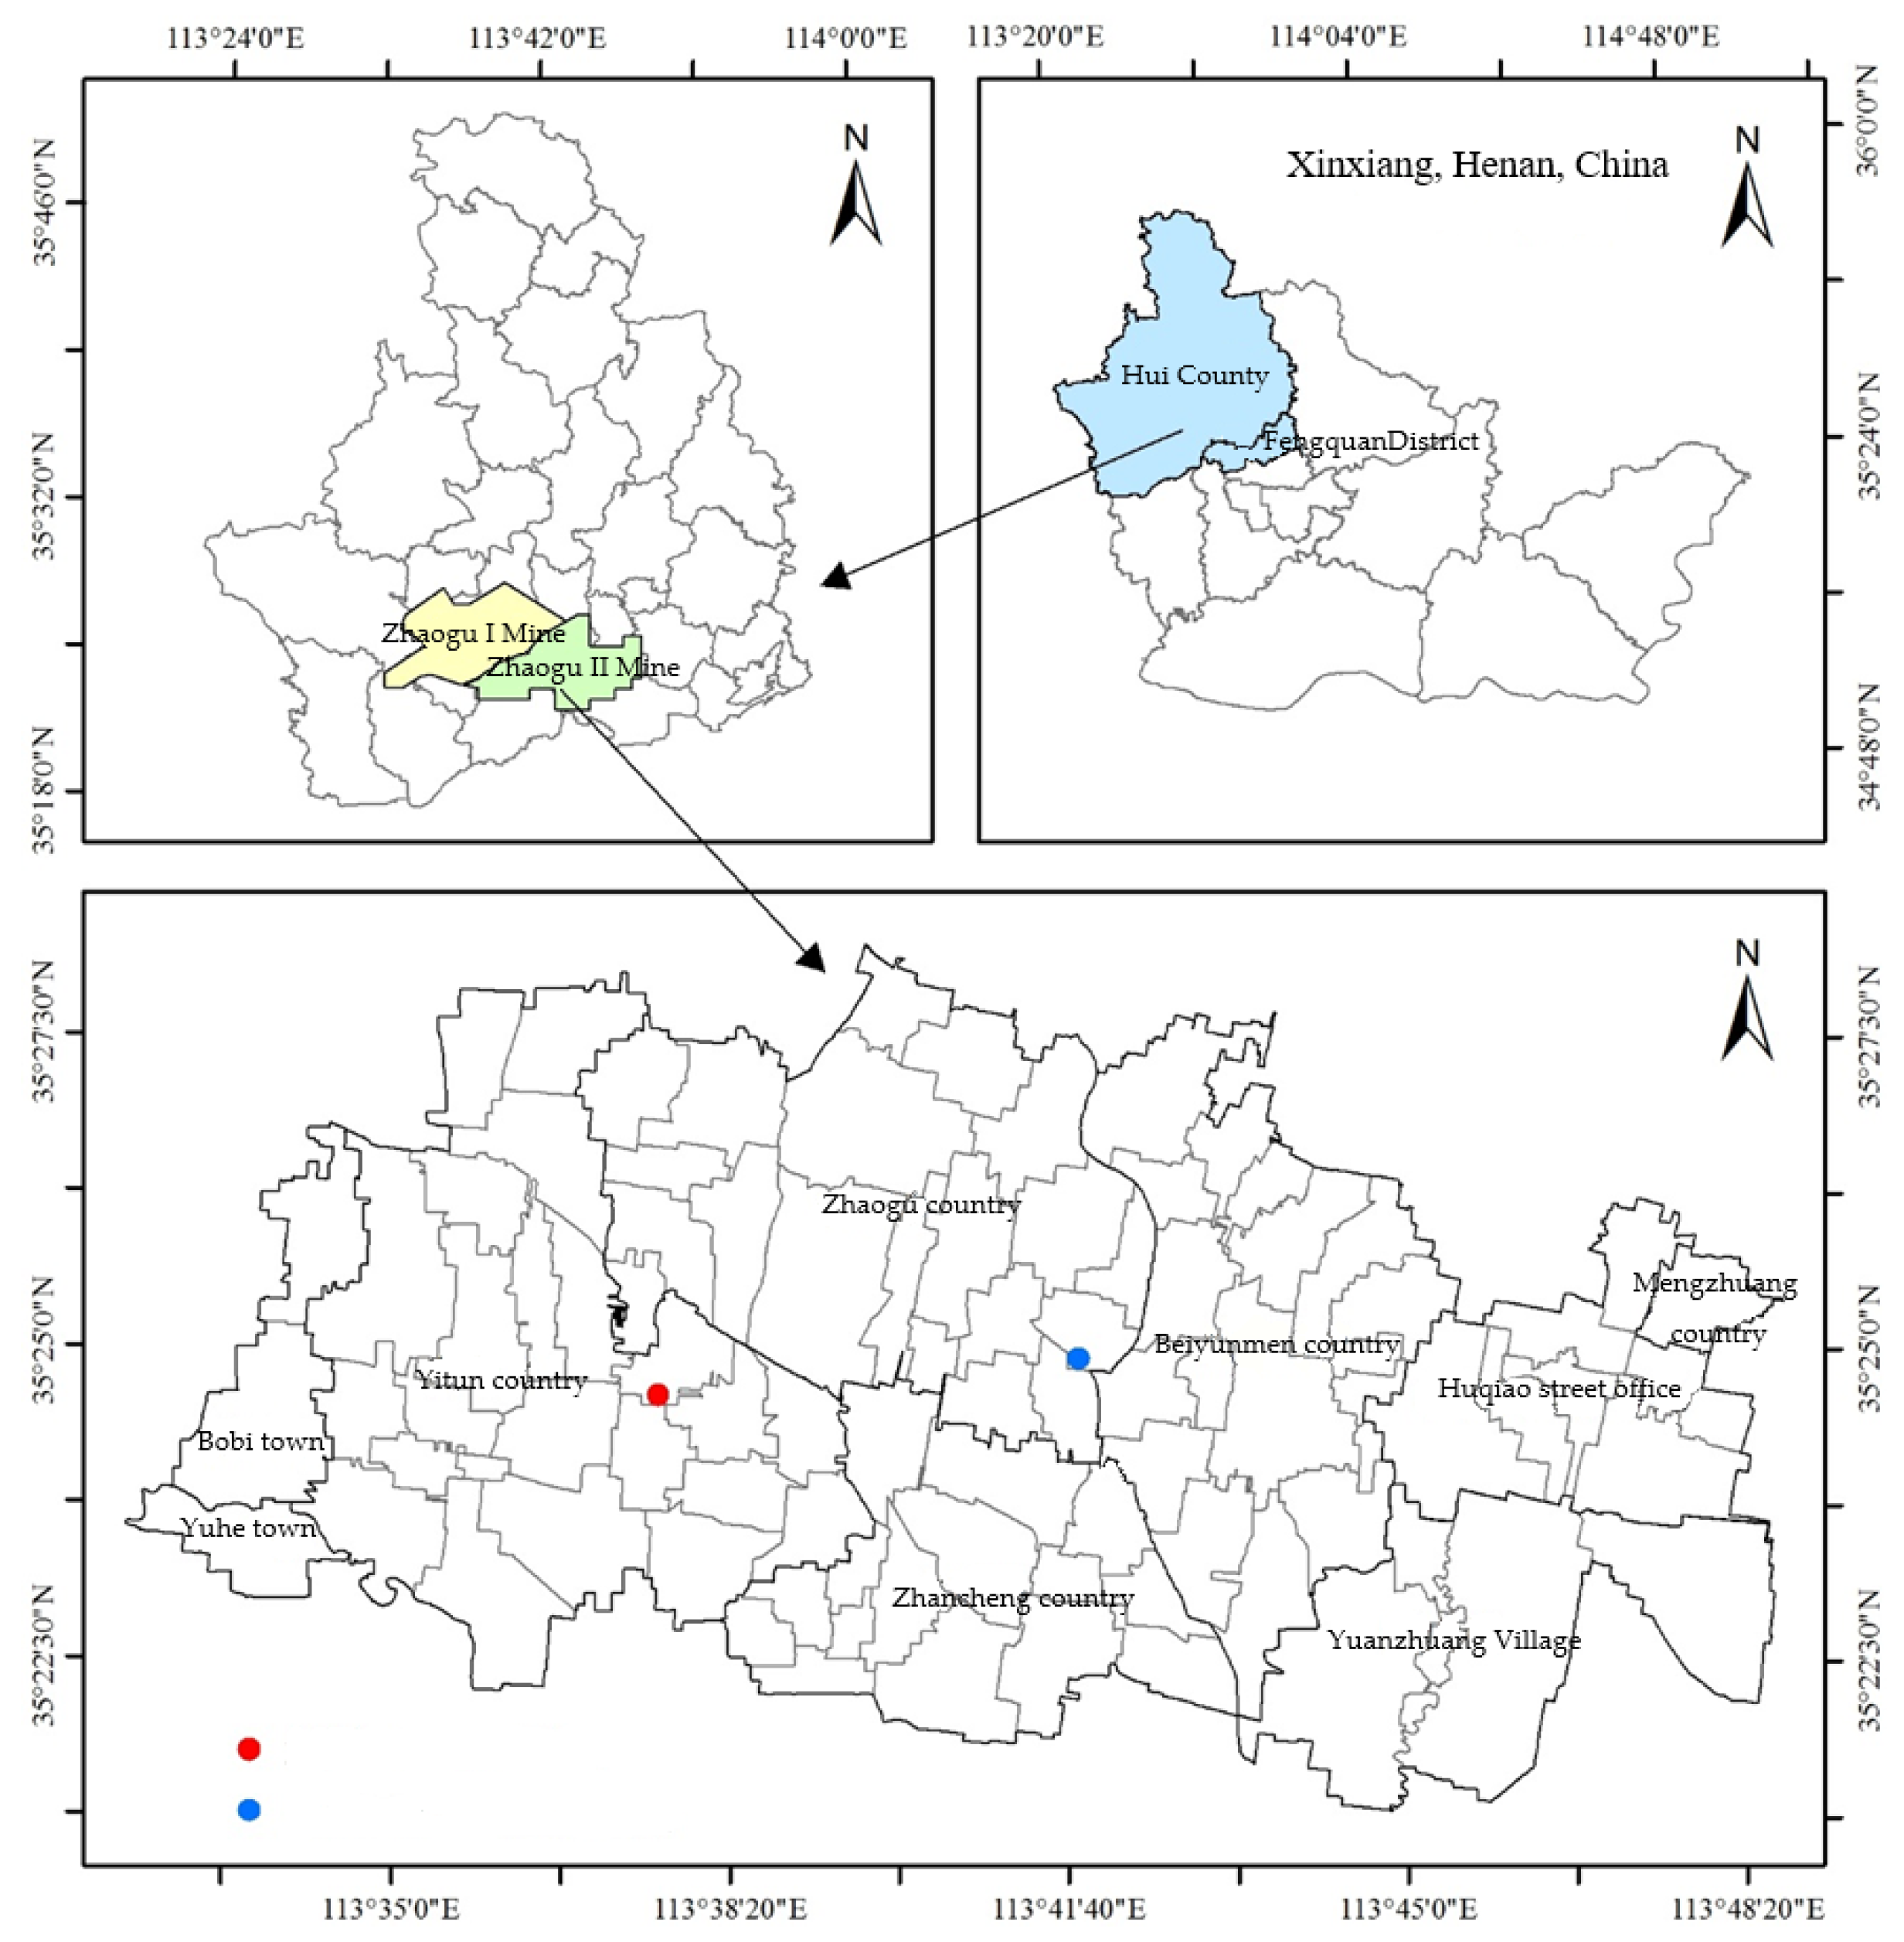
Figure 1. Geographical location map of the study area.
Land 12 00207 g001
Figure 2. Distribution of land use landscape types in Zhaogu mining area, 2004–2019.
Land 12 00207 g002
Figure 3. The change of landscape pattern during 2004–2019.
Land 12 00207 g003
Figure 4. The gradation map of landscape ecological security of Zhaogu mining area during 2004–2019.
Land 12 00207 g004
Figure 5. Simulation map of the spatial distribution pattern of landscape types in 2019.
Land 12 00207 g005
Figure 6. Prediction map of the spatial distribution pattern of landscape types in 2029.
Land 12 00207 g006
Figure 7. Predicted map of landscape ecological security in 2029.
Land 12 00207 g007
Table 1. Basic information of the research data.
Data NameTimeData sourcesUsage
Landsat5 TM30 August 2004–12 August 2009USGS Web Site: https://www.usgs.gov/ (accessed on 20 July 2021)Extraction of land use landscape type in mining area
Landsat8 OLI10 August 2014–25 September 2019
Land Use Change Survey Data for Hui County and Fengquan District2015Xinxiang City Bureau of Land and ResourcesExtraction of the extent of the study area; verification of classification accuracy
Zhaogu I and II mine boundaries2019Jiaozuo Coal Industry Group
Village relocation data2005–2030Establishment of land use landscape type conversion rules
Ecological reclamation data
Table 2. Evaluation index system and corresponding index weights of landscape ecological security in Zhaogu mining area.
IndexFormulaExplanationWeight
Landscape pressureIntensity of development and use of building land
(CD)
C D k = D k T A k Reflects the degree to which the landscape ecosystems in the study area can withstand the pressures and stresses caused by human construction activities.0.36
Mining pressure
(CM)
C M k = U k + W k T A k Measuring the extent to which surface subsidence caused by underground mining at a mine site has damaged its surrounding landscape.0.64
Landscape structureLandscape Structural Safety Index
(LPS)
L P S = i = 1 5 C A i T A × 1 10 × E i × F i
E i = a C i × b N i × c D
C i = N P i C A i
N i = 1 2 N P i T A × T A C A i
D i = H max + i = 1 5 P i × ln P i
The disturbance index E and the vulnerability index F are used to construct the landscape pattern security index.
E reflects the extent to which different landscape ecosystems are affected by natural or human activities, and can be obtained by superimposing weights on the landscape fragmentation index C, separation index N, and dominance index D [32].
The landscape fragility index F indicates the resistance of different landscape types to external stresses or disturbances [33].
Ecological effect of landscapeBiological richness
(BAI)
B A I = A b i o i = 1 5 C A i × S i T A Reflects the differences in the number of organisms per unit area in areas of different landscape types.0.27
Vegetation cover
(VCI)
V C I = i = 1 5 C A i × W i T A Reflects the evaluation of the strengths and weaknesses of regional ecosystems and environments.0.25
Landscape Ecological Service Value
(ESV)
E S V = i = 1 5 j = 1 9 C A i × V C i j T A Refers to the material goods, ecological environment, and landscape culture provided directly or indirectly for human survival and development through the structure and function of ecosystems and their ecological processes. Refer to the table of ecological service value equivalents per unit area of ecosystems in China (2007 version) [34].0.48
Table 3. Composition changes of landscape types during 2004–2019.
Landscape Type2004200920142019
Area
(hm2)
Ratio
(%)
Area
(hm2)
Ratio
(%)
Area
(hm2)
Ratio
(%)
Area
(hm2)
Ratio
(%)
Cultivated land15,960.1583.2215,502.7780.8314,892.3977.6515,028.2078.36
Construction land2661.3013.883046.1415.883423.0617.853428.8217.88
Water area379.081.98340.561.78412.112.15456.212.38
Forest land163.890.85271.441.42266.221.39189.180.99
Unutilized land14.040.0717.550.09184.680.9676.050.40
Table 4. Area proportion and change rate of each landscape ecological security grade in Zhaogu mining area during 2004–2019.
Landscape Ecological Security Grade20042004–200920092009–201420142014–20192019
Area
(hm2)
Ratio
(%)
Change Rate
(%)
Area
(hm2)
Ratio
(%)
Change Rate
(%)
Area
(hm2)
Ratio
(%)
Change Rate
(%)
Area
(hm2)
Ratio
(%)
Safety0.000.000.00%0.000.000.00%0.000.000.00%0.000.00
Basic safety8708.4045.41−18.60%5140.6226.80−5.94%4001.4020.86−1.11%3789.4519.76
Early warning9550.6249.8012.82%12,010.2362.621.22%12,244.5963.8510.70%14,296.8674.55
Unsafe919.444.795.78%2027.6110.574.72%2932.4715.29−9.60%1092.155.69
Table 5. Trend of landscape level index change during 2019–2029.
YearsAREA_MNLSISHDICONTAG
201944.190013.63370.655373.0470
202948.430712.34960.661173.4161
Disclaimer/Publisher’s Note: The statements, opinions and data contained in all publications are solely those of the individual author(s) and contributor(s) and not of MDPI and/or the editor(s). MDPI and/or the editor(s) disclaim responsibility for any injury to people or property resulting from any ideas, methods, instructions or products referred to in the content.