
Dynamic of Soil Porosity and Water Content under Tillage during Summer Fallow in the Dryland Wheat Fields of the Loess Plateau in China
 ,
, 
Abstract
:1. Introduction
2. Materials and Methods
2.1. Experimental Site Description
2.2. Experimental Design
2.3. Sampling and Determination Methods
2.4. Statistical Analysis
3. Results
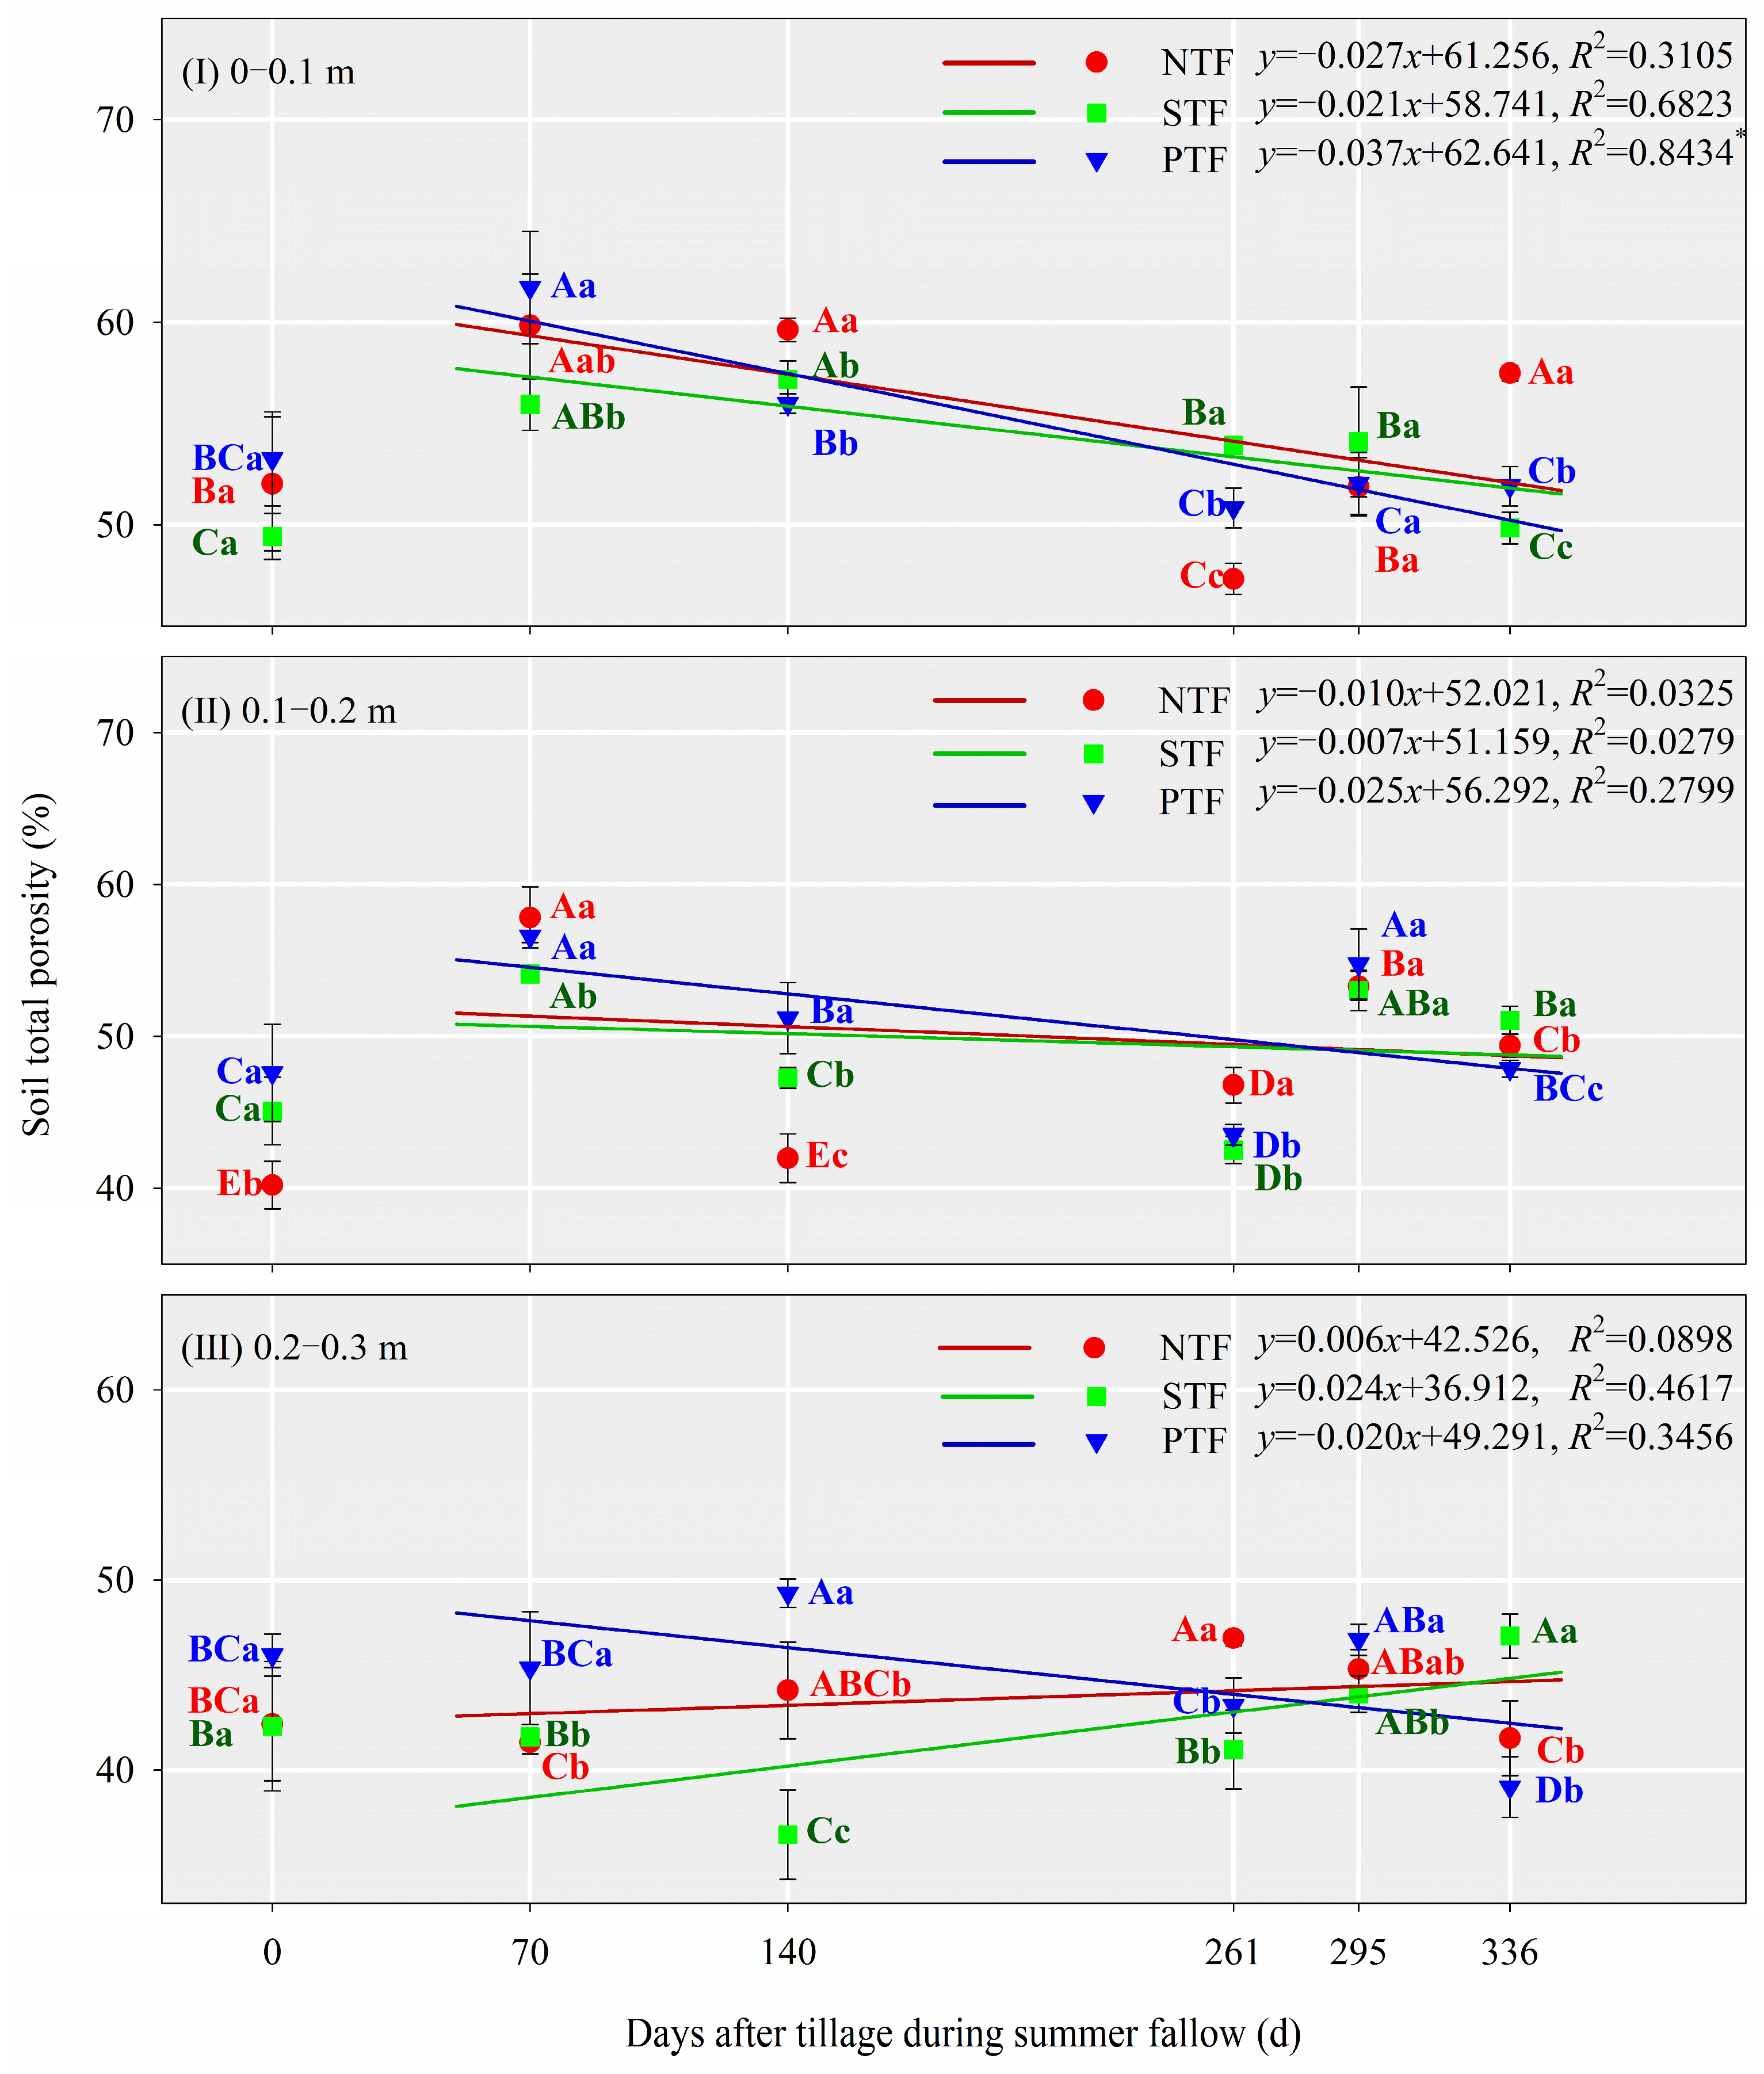
3.1. Total Porosity
3.2. Aeration Porosity
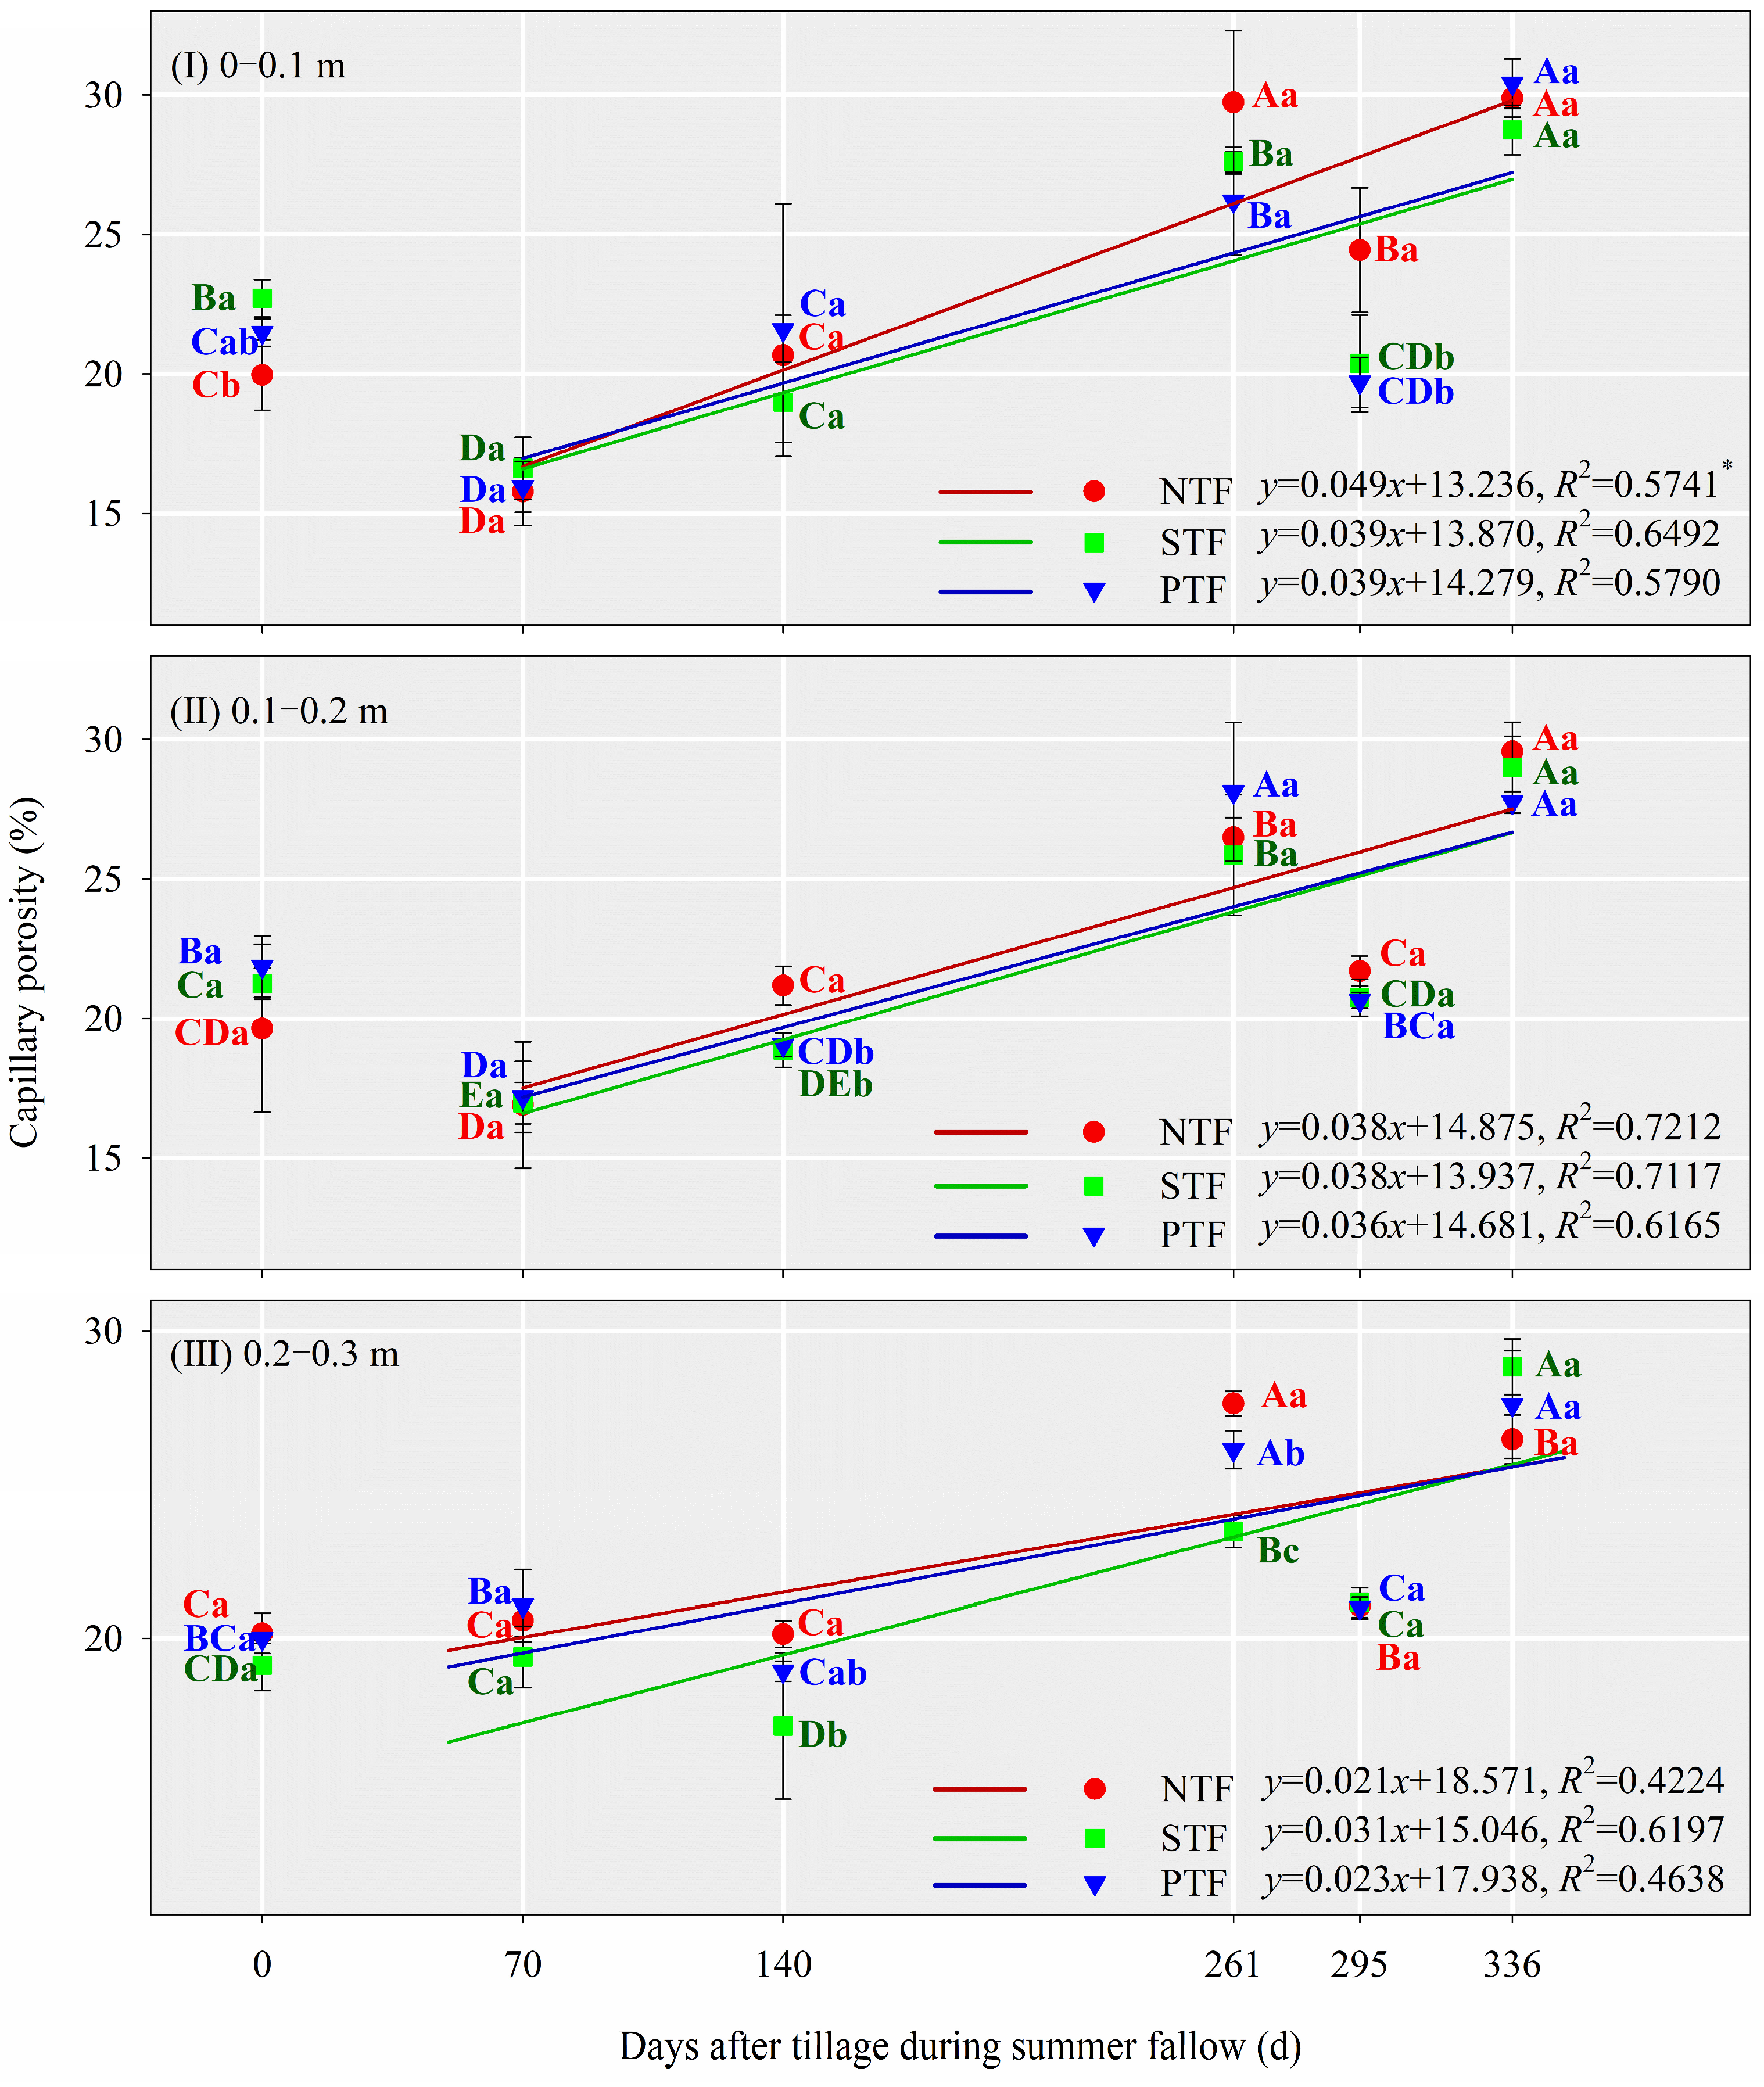
3.3. Capillary Porosity
3.4. Soil Water Content and Water Storage
4. Discussion
4.1. Effect of Tillage during Summer Fallow on Soil Porosity
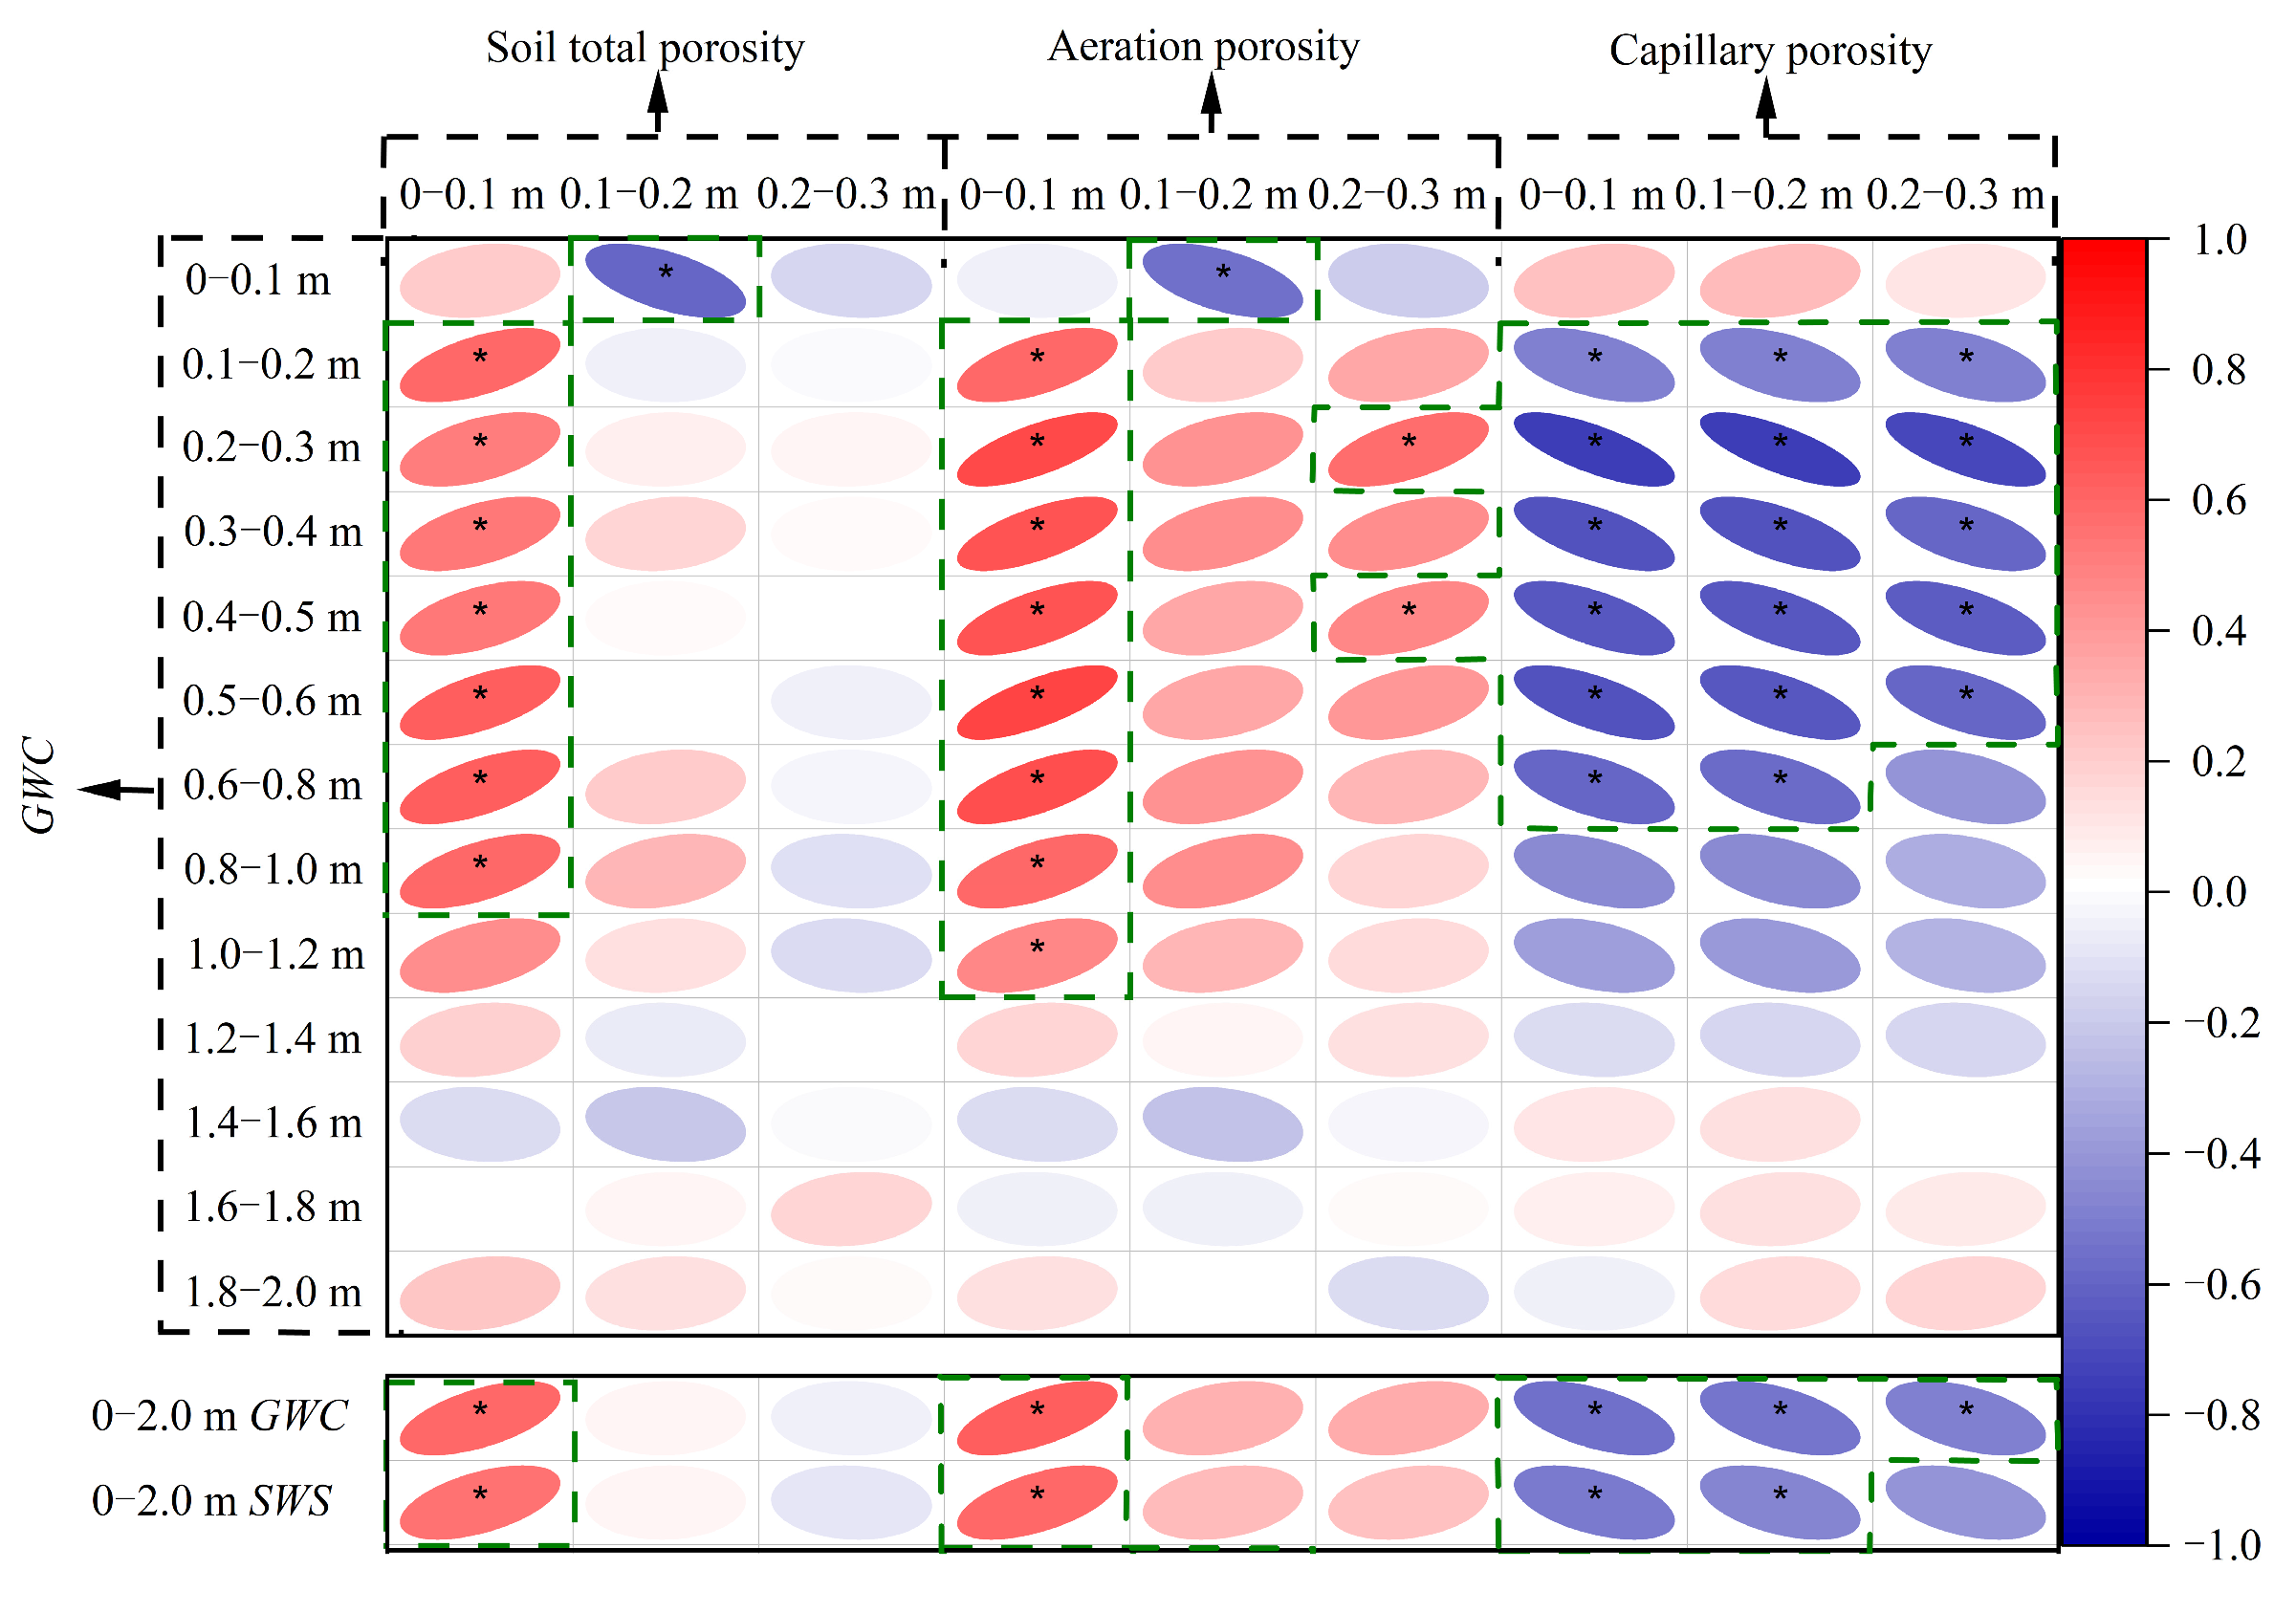
4.2. Relationship between Soil Porosity and Soil Water
4.3. Limitations and Prospects
5. Conclusions
Author Contributions
Funding
Institutional Review Board Statement
Informed Consent Statement
Data Availability Statement
Conflicts of Interest
References
- Lal, R. Carbon Cycling in Global Drylands. Curr. Clim. Chang. Rep. 2019, 5, 221–232. [Google Scholar] [CrossRef]
- Li, Y.; Chen, Y.; Li, Z. Dry/wet pattern changes in global dryland areas over the past six decades. Glob. Planet. Chang. 2019, 178, 184–192. [Google Scholar] [CrossRef]
- Huang, J.; Yu, H.; Guan, X.; Wang, G.; Guo, R. Accelerated dryland expansion under climate change. Nat. Clim. Chang. 2015, 6, 166–171. [Google Scholar] [CrossRef]
- National Bureau of Statistics of China. China Statistical Yearbook 2021; China Statistics Press: Beijing, China, 2021. (In Chinese) [Google Scholar]
- Galdos, M.; Pires, L.; Cooper, H.; Calonego, J.; Rosolem, C.; Mooney, S. Assessing the long-term effects of zero-tillage on the macroporosity of Brazilian soils using X-ray Computed Tomography. Geoderma 2018, 337, 1126–1135. [Google Scholar] [CrossRef] [PubMed]
- Seguel, O.; Díaz, D.; Acevedo, E.; Silva, P.; Homer, I.; Seitz, S. Hydraulic Conductivity in a Soil Cultivated with Wheat-Rapeseed Rotation Under Two Tillage Systems. J. Soil Sci. Plant Nutr. 2020, 20, 2304–2315. [Google Scholar] [CrossRef]
- Pires, L.; Roque, W.; Rosa, J.; Mooney, S. 3D analysis of the soil porous architecture under long term contrasting management systems by X-ray computed tomography. Soil Tillage Res. 2019, 191, 197–206. [Google Scholar] [CrossRef]
- Zaraee, M.; Afzalinia, S. Effect of Conservation Tillage on the Physical and Mechanical Properties of Silty-Clay Loam Soil. Int. J. Plant Soil Sci. 2016, 12, 17. [Google Scholar] [CrossRef]
- Talukder, R.; Plaza-Bonilla, D.; Cantero-Martínez, C.; Wendroth, O.; Castel, J.L. Soil gas diffusivity and pore continuity dynamics under different tillage and crop sequences in an irrigated Mediterranean area. Soil Tillage Res. 2022, 221, 351–362. [Google Scholar] [CrossRef]
- Kay, B.; VandenBygaart, A. Conservation tillage and depth stratification of porosity and soil organic matter. Soil Tillage Res. 2002, 66, 107–118. [Google Scholar] [CrossRef]
- Yang, Y.; Wu, J.; Zhao, S.; Mao, Y.; Zhang, J.; Pan, X.; He, F.; van der Ploeg, M. Impact of long-term sub-soiling tillage on soil porosity and soil physical properties in the soil profile. Land Degrad. Dev. 2021, 32, 2892–2905. [Google Scholar] [CrossRef]
- Gao, L.; Wang, B.; Li, S.; Wu, H.; Wu, X.; Liang, G.; Gong, D.; Zhang, X.; Cai, D.; Degré, A. Soil wet aggregate distribution and pore size distribution under different tillage systems after 16 years in the Loess Plateau of China. Catena 2018, 173, 38–47. [Google Scholar] [CrossRef]
- de Moraes, M.T.; Debiasi, H.; Carlesso, R.; Franchini, J.C.; da Silva, V.R.; da Luz, F.B. Soil physical quality on tillage and cropping systems after two decades in the subtropical region of Brazil. Soil Tillage Res. 2016, 155, 351–362. [Google Scholar] [CrossRef]
- Villarreal, R.; Lozano, L.A.; Salazar, M.P.; Bellora, G.L.; Melani, E.M.; Polich, N.; Soracco, C.G. Pore system configuration and hydraulic properties. Temporal variation during the crop cycle in different soil types of Argentinean Pampas Region. Soil Tillage Res. 2019, 198, 104528. [Google Scholar] [CrossRef]
- Jirků, V.; Kodešová, R.; Nikodem, A.; Mühlhanselová, M.; Žigová, A. Temporal variability of structure and hydraulic properties of topsoil of three soil types. Geoderma 2013, 204–205, 43–58. [Google Scholar] [CrossRef]
- Soracco, C.G.; Lozano, L.A.; Villarreal, R.; Melani, E.; Sarli, G.O. Temporal Variation of Soil Physical Quality under Conventional and No-Till Systems. Rev. Bras. Ciênc. Solo 2018, 42, e0170408. [Google Scholar] [CrossRef] [Green Version]
- Haruna, S.I.; Anderson, S.H.; Nkongolo, N.V.; Zaibon, S. Soil Hydraulic Properties: Influence of Tillage and Cover Crops. Pedosphere 2018, 28, 430–442. [Google Scholar] [CrossRef]
- Shanxi Provincial Bureau of Statistics, Survey Office of the National Bureau of Statistics in Shanxi. Shanxi Statistical Yearbook 2021; China Statistics Press: Beijing, China, 2022. (In Chinese) [Google Scholar]
- Li, T.-L.; Xie, Y.-H.; Hong, J.-P.; Feng, Q.; Sun, C.-H.; Wang, Z.-W. Effects of Nitrogen Application Rate on Photosynthetic Characteristics, Yield, and Nitrogen Utilization in Rainfed Winter Wheat in Southern Shanxi. Acta Agron. Sin. 2013, 39, 704–711. [Google Scholar] [CrossRef]
- Xue, L.; Khan, S.; Sun, M.; Anwar, S.; Ren, A.; Gao, Z.; Lin, W.; Xue, J.; Yang, Z.; Deng, Y. Effects of tillage practices on water consumption and grain yield of dryland winter wheat under different precipitation distribution in the loess plateau of China. Soil Tillage Res. 2019, 191, 66–74. [Google Scholar] [CrossRef]
- Sun, M.; Ren, A.-X.; Gao, Z.-Q.; Wang, P.-R.; Mo, F.; Xue, L.-Z.; Lei, M.-M. Long-term evaluation of tillage methods in fallow season for soil water storage, wheat yield and water use efficiency in semiarid southeast of the Loess Plateau. Field Crop. Res. 2018, 218, 24–32. [Google Scholar] [CrossRef]
- Lao, J.C. Handbook of Soil Agrochemical Analysis; Agricultural Press: Beijing, China, 1988. (In Chinese) [Google Scholar]
- Zou, W.; Han, X.; Yan, J.; Chen, X.; Lu, X.; Qiu, C.; Hao, X. Effects of incorporation depth of tillage and straw returning on soil physical properties of black soil in Northeast China. Trans. Chin. Soc. Agric. Eng. 2020, 36, 9–18, (In Chinese with English Abstract). [Google Scholar]
- Danielson, R.E.; Sutherland, P.L. Porosity. In Methods of Soil Analysis. Part 1. Physical and Mineralogical Methods; Cassel, D., Klute, A., Eds.; American Society of Agronomy-Soil Science Society: Madison, WI, USA, 1986; pp. 443–661. [Google Scholar]
- Yi, Y.L. Method of Soil Physics Research; Peking University Press: Beijing, China, 2009; pp. 88–91. (In Chinese) [Google Scholar]
- Ge, J.; Fan, J.; Yuan, H.; Yang, X.; Jin, M.; Wang, S. Soil water depletion and restoration under inter-conversion of food crop and alfalfa with three consecutive wet years. J. Hydrol. 2020, 585, 124851. [Google Scholar] [CrossRef]
- Ferro, N.D.; Sartori, L.; Simonetti, G.; Berti, A.; Morari, F. Soil macro- and microstructure as affected by different tillage systems and their effects on maize root growth. Soil Tillage Res. 2014, 140, 55–65. [Google Scholar] [CrossRef]
- Garbout, A.; Munkholm, L.; Hansen, S. Tillage effects on topsoil structural quality assessed using X-ray CT, soil cores and visual soil evaluation. Soil Tillage Res. 2013, 128, 104–109. [Google Scholar] [CrossRef]
- Zhao, L.L.; Li, L.S.; Cai, H.J.; Shi, X.H.; Xue, S.P. Comprehensive effects of organic materials incorporation on soil hydraulic conductivity and air permeability. Sci. Agric. Sin. 2019, 52, 1045–1057, (In Chinese with English Abstract). [Google Scholar]
- Qiu, C.; Han, X.Z.; Chen, X.; Lu, X.; Yan, J.; Feng, Y.; Gan, J.; Zou, W.; Liu, G. Effects of organic amendment depths on black soil pore structure using CT scanning technology. Trans. Chin. Soc. Agric. Eng. 2021, 37, 98–107, (In Chinese with English Abstract). [Google Scholar]
- Luiz, F.P.; Jaqueline, A.R.B.; Jadir, A.R.; Cooper, M.; Heck, R.J.; Passoni, S.; Roquee, W.L. Soil structure changes induced by tillage systems. Soil Tillage Res. 2017, 165, 66–79. [Google Scholar]
- Schneider, F.; Don, A.; Hennings, I.; Schmittmann, O.; Seidelc, S.J. The effect of deep tillage on crop yield—What do we really know? Soil Tillage Res. 2017, 174, 193–204. [Google Scholar] [CrossRef]
- Ferro, N.D.; Delmas, P.; Duwig, C.; Simonetti, G.; Morari, F. Coupling X-ray microtomography and mercury intrusion porosimetry to quantify aggregate structures of a cambisol under different fertilisation treatments. Soil Tillage Res. 2012, 119, 13–21. [Google Scholar] [CrossRef]
- Colombi, T.; Braun, S.; Keller, T.; Walter, A. Artificial macropores attract crop roots and enhance plant productivity on compacted soils. Sci. Total Environ. 2017, 574, 1283–1293. [Google Scholar] [CrossRef] [PubMed] [Green Version]
- Gill, J.; Sale, P.; Peries, R.; Tang, C. Changes in soil physical properties and crop root growth in dense sodic subsoil following incorporation of organic amendments. Field Crop. Res. 2009, 114, 137–146. [Google Scholar] [CrossRef]
- Ren, A.; Zhao, W.; Sumera, A.; Lin, W.; Ding, P.; Hao, R.; Wang, P.; Zhong, R.; Tong, J.; Gao, Z.; et al. Effects of tillage and seasonal variation of rainfall on soil water content and root growth distribution of winter wheat under rainfed conditions of the Loess Plateau, China. Agric. Water Manag. 2022, 268, 107533. [Google Scholar]
- Çelik, I.; Günal, H.; Acar, M.; Acir, N.; Barut, Z.B.; Budak, M. Strategic tillage may sustain the benefits of long-term no-till in a Vertisol under Mediterranean climate. Soil Tillage Res. 2018, 185, 17–28. [Google Scholar] [CrossRef]
- Schleuß, U.; Müller, F. Requirements for soil sampling in the context of ecosystem research. Sci. Total Environ. 2001, 264, 193–197. [Google Scholar] [CrossRef]
- Liu, X.; Zhang, X.; Chen, S.; Sun, H.; Shao, L. Subsoil compaction and irrigation regimes affect the root–shoot relation and grain yield of winter wheat. Agric. Water Manag. 2015, 154, 59–67. [Google Scholar] [CrossRef]
- Greve, A.; Andersen, M.; Acworth, R. Monitoring the transition from preferential to matrix flow in cracking clay soil through changes in electrical anisotropy. Geoderma 2012, 179–180, 46–52. [Google Scholar] [CrossRef]
- Zhang, Z.; Peng, X.; Zhou, H.; Lin, H.; Sun, H. Characterizing preferential flow in cracked paddy soils using computed tomography and breakthrough curve. Soil Tillage Res. 2014, 146, 53–65. [Google Scholar] [CrossRef]
- Xue, J.-F.; Ren, A.-X.; Li, H.; Gao, Z.-Q.; Du, T.-Q. Soil physical properties response to tillage practices during summer fallow of dryland winter wheat field on the Loess Plateau. Environ. Sci. Pollut. Res. 2017, 25, 1070–1078. [Google Scholar] [CrossRef] [PubMed]
- Sun, M.; Wen, F.-F.; Gao, Z.-Q.; Ren, A.-X.; Deng, Y.; Zhao, W.-F.; Zhao, H.-M.; Yang, Z.-P.; Hao, X.-Y.; Miao, G.-Y. Effects of Farming Practice during Fallow Period on Soil Water Storage and Yield of Dryland Wheat in Different Rainfall Years. Acta Agron. Sin. 2014, 40, 1459–1469. [Google Scholar] [CrossRef]
- Houlbrooke, D.; Laurenson, S. Effect of sheep and cattle treading damage on soil microporosity and soil water holding capacity. Agric. Water Manag. 2013, 121, 81–84. [Google Scholar] [CrossRef]
- Dhaliwal, J.K.; Kumar, S. 3D-visualization and quantification of soil porous structure using X-ray micro-tomography scanning under native pasture and crop-livestock systems. Soil Tillage Res. 2022, 218, 105305. [Google Scholar] [CrossRef]
- Budhathoki, S.; Lamba, J.; Srivastava, P.; Malhotra, K.; Way, T.R.; Katuwal, S. Using X-ray computed tomography to quantify variability in soil macropore characteristics in pastures. Soil Tillage Res. 2021, 215, 105194. [Google Scholar] [CrossRef]
- Menon, M.; Jia, X.; Lair, G.; Faraj, P.; Blaud, A. Analysing the impact of compaction of soil aggregates using X-ray microtomography and water flow simulations. Soil Tillage Res. 2015, 150, 147–157. [Google Scholar] [CrossRef]
- Tian, M.; Qin, S.; Whalley, W.R.; Zhou, H.; Ren, T.; Gao, W. Changes of soil structure under different tillage management assessed by bulk density, penetrometer resistance, water retention curve, least limiting water range and X-ray computed tomography. Soil Tillage Res. 2022, 221, 105420. [Google Scholar] [CrossRef]
- Zhou, H.; Peng, X.; Perfect, E.; Xiao, T.; Peng, G. Effects of organic and inorganic fertilization on soil aggregation in an Ultisol as characterized by synchrotron based X-ray micro-computed tomography. Geoderma 2013, 195–196, 23–30. [Google Scholar] [CrossRef]
- Qian, Y.; Xiong, P.; Wang, Y.; Zhang, Z.; Guo, Z.; Shao, F.; Peng, X. Effect of tillage practices on soilpore structure characteristics in Shajiang Black Soil. Acta Pedol. Sin. 2022. (In Chinese with English Abstract). [Google Scholar] [CrossRef]
- Yang, Y.H.; Wu, J.C.; Mao, Y.P.; He, F.; Zhang, J.M.; Gao, C.M.; Pan, X.Y.; Wang, Y. Effect of no-tillage on pore distribution in soil profile. Chin. J. Eco-Agric. 2018, 26, 1019–1028, (In Chinese with English Abstract). [Google Scholar]
- Guo, Y.; Fan, R.; Zhang, X.; Zhang, Y.; Wu, D.; McLaughlin, N.; Zhang, S.; Chen, X.; Jia, S.; Liang, A. Tillage-induced effects on SOC through changes in aggregate stability and soil pore structure. Sci. Total Environ. 2019, 703, 134617. [Google Scholar] [CrossRef]


Disclaimer/Publisher’s Note: The statements, opinions and data contained in all publications are solely those of the individual author(s) and contributor(s) and not of MDPI and/or the editor(s). MDPI and/or the editor(s) disclaim responsibility for any injury to people or property resulting from any ideas, methods, instructions or products referred to in the content. |
© 2023 by the authors. Licensee MDPI, Basel, Switzerland. This article is an open access article distributed under the terms and conditions of the Creative Commons Attribution (CC BY) license (https://creativecommons.org/licenses/by/4.0/).
Share and Cite
Xue, J.-F.; Qi, Z.-W.; Chen, J.-L.; Cui, W.-H.; Lin, W.; Gao, Z.-Q. Dynamic of Soil Porosity and Water Content under Tillage during Summer Fallow in the Dryland Wheat Fields of the Loess Plateau in China. Land 2023, 12, 230. https://doi.org/10.3390/land12010230
Xue J-F, Qi Z-W, Chen J-L, Cui W-H, Lin W, Gao Z-Q. Dynamic of Soil Porosity and Water Content under Tillage during Summer Fallow in the Dryland Wheat Fields of the Loess Plateau in China. Land. 2023; 12(1):230. https://doi.org/10.3390/land12010230
Chicago/Turabian StyleXue, Jian-Fu, Ze-Wei Qi, Jin-Lei Chen, Wei-Hua Cui, Wen Lin, and Zhi-Qiang Gao. 2023. "Dynamic of Soil Porosity and Water Content under Tillage during Summer Fallow in the Dryland Wheat Fields of the Loess Plateau in China" Land 12, no. 1: 230. https://doi.org/10.3390/land12010230