Abstract
It is crucial to study ecological footprint production intensity (EFPI) in the ecological compensation strategy of designated industries and to delineate high-polluting industries. Environment-extended input-output (EE-IO) tables are suitable for analyzing embodied pollution or land occupation among its economic sectors. The ecological footprint (EF) and input-output tables (IOTs) were used to analyze China’s EFPI and its (net) flow among sectors in 2005, 2010, and 2015. With the environment-extended matrix and Leontief inverse matrix of EE-IO analysis, the direct pollution coefficient (DPC) and total pollution coefficient (TPC) of China’s EF were studied. The (net) embodied EFPI flows between any two sectors were decomposed and demonstrated in detail. The key embodied EFPI component transfer paths among sectors were tracked and analyzed. The results for China’s EFPI in 2005, 2010, and 2015 show that the averages of the TPC component and net embodied EFPI transfer components showed a downward trend from 2005 to 2015. The sector of electricity, heat, gas, and water (S11) and the sector of Agriculture (S1) provided larger component values of both TPCs and net embodied EFPI transfers. From the analysis of the three transfer levels of EFPI, high-value transfer paths were further marked for key governance. Imposing an ecological tax and controlling high-EFPI industries were recommended as optimizations from the production and consumption ends. Additionally, this paper provides a reference for the division of ecological responsibility among Chinese sectors.
1. Introduction
Global ecological sustainable development is facing more and more severe challenges, especially in land overuse [1,2] and high carbon emission [3], leading to global bio-capacity being increasingly unable to support global consumption [4]. More than 56% of the global bio-capacity was overused in 2020 [5], which would threaten biodiversity, the greenhouse effect, and land ecological security. With the global economy increasing, the threats are getting more and more severe, especially from the production cycle, which brings economic growth but also brings significant ecological threats. Meanwhile, low-carbon and sustainable land use are necessary for global sustainable development. Since the impact of human activities on ecology mainly occurs in production links, how to reduce the intensity of ecological pollution per unit of production is the key to decoupling the environmental impact and economic development. At the same time, due to the hidden pollution in the production process, how to divide ecological responsibility is particularly important. Research on ecological responsibility also has attracted increasing attention [6]. Ecological responsibility can be divided into two pillars: consumer responsibility and producer responsibility [7]. As a traditional concept, polluter-pays principles (PPP) are related to producer responsibility, while tracking the embodied pollution behind production processes is related to consumer responsibility. The study of embodied pollution is also a bridge for analyzing the relationship between consumer and producer responsibility studies in ecology. Embodied pollution is a concept referring to carbon emissions [8], PM2.5 emissions [9], and land use and ecology [10] in the middle phase of a product’s production process.
As a consumption-based ecological occupation tracking tool, the ecological footprint (EF) [11,12,13] is suitable for research on embodied pollution. Compared with pure carbon emission research, there are two aspects of advantages. (1) EF quantitatively measures the pressure of human activities on the ecological environment in a unified global land unit (gha) with six types of land use, i.e., arable land, forestland, grazing land, fishing land, built-up land and carbon-uptaking land, which can more fully reflect the impact of economic and social activities on the ecological environment. (2) It provides a threshold indicator (biocapacity) on the ecological supply side. Accounting through National Footprint and Biocapacity Accounts (NFA) [11] has been applied in economics, ecology, thermodynamics, and other disciplines and has also gradually been applied to different geographic scales and industries [14]. In particular, the embodied EF could be more associated with life cycle assessment (LCA) [15] and environment-extended input–output (EE-IO) models. LCA is applied mainly to concrete industrial products from a micro perspective, while EE-IO models easily track embodied EFs among regions and industrial sectors from a macro perspective. Moreover, the EF model plays an increasingly important role in assessing ecologically sustainable development and ecological policy implementation frameworks [16], such as the role of EF in ecological compensation design [17,18]. The combination of EF analysis and other contents can provide a reference for formulating regional sustainable development [19,20,21]. i.e., EF has long-term and permanent effects of policy shocks in the USA [20], helpful in designing city-level sustainability policies [21]. Many studies showed that the increasing GDP is one of the major factors that significantly affects the EF’s growth [22,23,24], and it is essential to explore policies for optimizing the relationship between ecological footprint and sustainable development of economic growth [25]. The lower intensity of EF could decouple GDP and EF [26], and the relationships have been decoupled in a few counties [27]. Based on the above analysis, it is vital to study the ecological footprint of the production link and its related intensity to increase the eco-efficiency of EF. Kissinger et al. [28] analyzed the impact of different residues on Pulp production’s ecology (land and energy) and from the perspective of production’s EF. Cerutti, A.K. et al. studied the ecological footprint of nectarine orchard production at six stages in the production process [29], and the research shows that most of the ecological footprints are at full production plays. What’s more, the research in the production process presents in other various applications, such as EF in production processes, including waste production [30]. The agricultural processing industry was also included, e.g., Brazilian broiler feed production [31].
The essence of the EF also lies in tracking the ecological occupancy of consumer products in detail. In fact, the EF of a product can be decomposed into the amount of EF directly occupied by the production of the product and the amount of EF of all intermediate products used indirectly to produce the product [32]. As analyzed by Wiedmann et al. [33], because the general accounting method for EFs makes it difficult to distinguish between local and foreign footprints, the accuracy of the results is low. Compared with the general accounting method for EFs, the EF accounting model based on the input–output method more easily tracks the hidden EF within the product and the internal and external EF flows, thereby tracking the internal transfer flow of the footprint [34].
Input–output models are a connection between the consumption system and the production system [35]. EE-IO models are widely used to analyze various hidden pollution problems of terminal products, such as carbon emissions [8,36,37], land ecology [10], and air pollution [38]. In the study of EF structure and relationships, this method has also gradually been applied to the measurement of embodied EFs, interregional EF flows, and foreign trade EFs.
For physical input–output tables (IOTs) in EF accounting, it has been asserted that due to the correlation between land use and physical logistics, physical tables are more suitable than monetary tables for studying land occupation issues [39]. Due to the availability and unified unit of IOTs, more studies employ mainly monetary IOTs in footprint accounting [32]. Through the footprint environment-extended matrix and Leontief inverse matrix with monetary IOTs, the hidden EF and monetary EF intensity can be easily identified. Earlier studies that employed monetary IOTs to study the EF included the steps of reallocating production EF into final consumption [40] and comparing producer and consumer responsibility with input-output analysis (IOA) [7] and internationally traded EF with IOA [41]. In terms of the region-quantity types of IOTs, some studies have used single-region input-output (SRIO) tables to analyze the EF within a single region. In contrast, others have used multiregional input-output (MRIO) for interregional research on hidden EF [42]. Due to the substantial availability of IOA data and the short time lag, EF research based on SRIO is easier to study in a single area. MRIO is suitable for analyzing interregional EF flow research; however, MRIO tables are scarce, and the data lag period is typically long. In addition to EF with IOA, other types of footprints have also been studied: Carballo Penela and Sebastián Villasante [43] used physical IOTs to analyze the energy EF of Galicia and highlighted the seriousness of high-pollution industries. Moreover, IOA has also been used to explore the regional footprint family by extending the type of ecological content in EFs [34]. As discussed by [44], a hybrid EE-MRIO (monetary MRIO table and physical biomass products) would show high accuracy in EF accounting.
From the literature review analysis, the following was revealed. (1) Most existing research focuses on the embodied EF of the final product, while there are few studies on the EF transfer paths among economic sectors (industries). The research on the EF of industries has generally focused on a single industry, and there are few studies that compare industries. (2) Most studies have focused on the situation of a single year, and there were few comparisons of multiple years, thus, resulting in less effective significance in ecologically sustainable development. (3) Most of the work has focused mainly on the quantity of EF and less on the EF per unit of currency, which is essential in studying industrial EF because it has a high effect on study efficiency [45], as ecological compensation has a very high effect on generating ecological policy [17,18,46,47].
China is facing carbon neutrality and land protection, and reducing carbon emission intensity and improving land use efficiency are ones of important issues for China’s sustainable development too. Moreover, China is experiencing embodied pollution transfer among economic sectors, e.g., carbon emissions and land use are facing governance issues in highly polluting industries. This paper tries to improve the IOA in analyzing embodied EF for the issues mentioned above. Therefore, it will analyze the embodied EF per monetary production among economic sectors with China as an example. The main highlighted points of this study are as follows:
- (1)
- This study builds an embodied EF accounting framework with an EE-IO model, which can clarify the relationship between production-based and consumption-based EF. Further tracking the content of the embodied EF in the final product provides a basis for dividing ecological and environmental protection responsibilities from the perspective of consumption, comparing ecological impact from the perspective of EF production flow and consumption flow.
- (2)
- This study provides a new perspective for subsequent research on various types of hidden pollution problems, especially the hidden pollution transfer paths among economic sectors. In this study, it is possible to track the flow of footprints among sectors (industries) and provide a basis for locating the source of embodied EFs. In addition, it provides a reference for optimizing efficient ecological production.
- (3)
- The analysis of the key footprint transfer paths among sectors (industries) helps locate the source of important EFs and provides a reference for ecological compensation among the sectors. This content provides a reference for implementing better policy strategies, optimizing or restraining key EF transfer paths, and promoting eco-green development among industries. This study provides a reference for the industrial green development of China.
2. Data and Method
2.1. Data Source
Based on the comparative role of research, data availability, and timeliness, 2005, 2010, and 2015 were selected as study years. The data for accounting for China’s EF with IOTs include the direct occupation of arable land, forest land and grazing land, fishing land, and built-up land on the production side, as well as direct carbon emissions from various economic sectors. Due to data unavailability, the EF accounting in this study did not account for some regions of China, including Tibet, Hong Kong, Taiwan, and Macao. The main data sources were the “China Energy Statistical Yearbook,” “China Agricultural Statistical Yearbook,” and “China Statistical Yearbook.” To unify the data with the energy data source, the IOT was divided into 39 industries for the three studied years, as shown in Table A1.
2.2. Ecological Footprint Accounting and Its Production Intensity
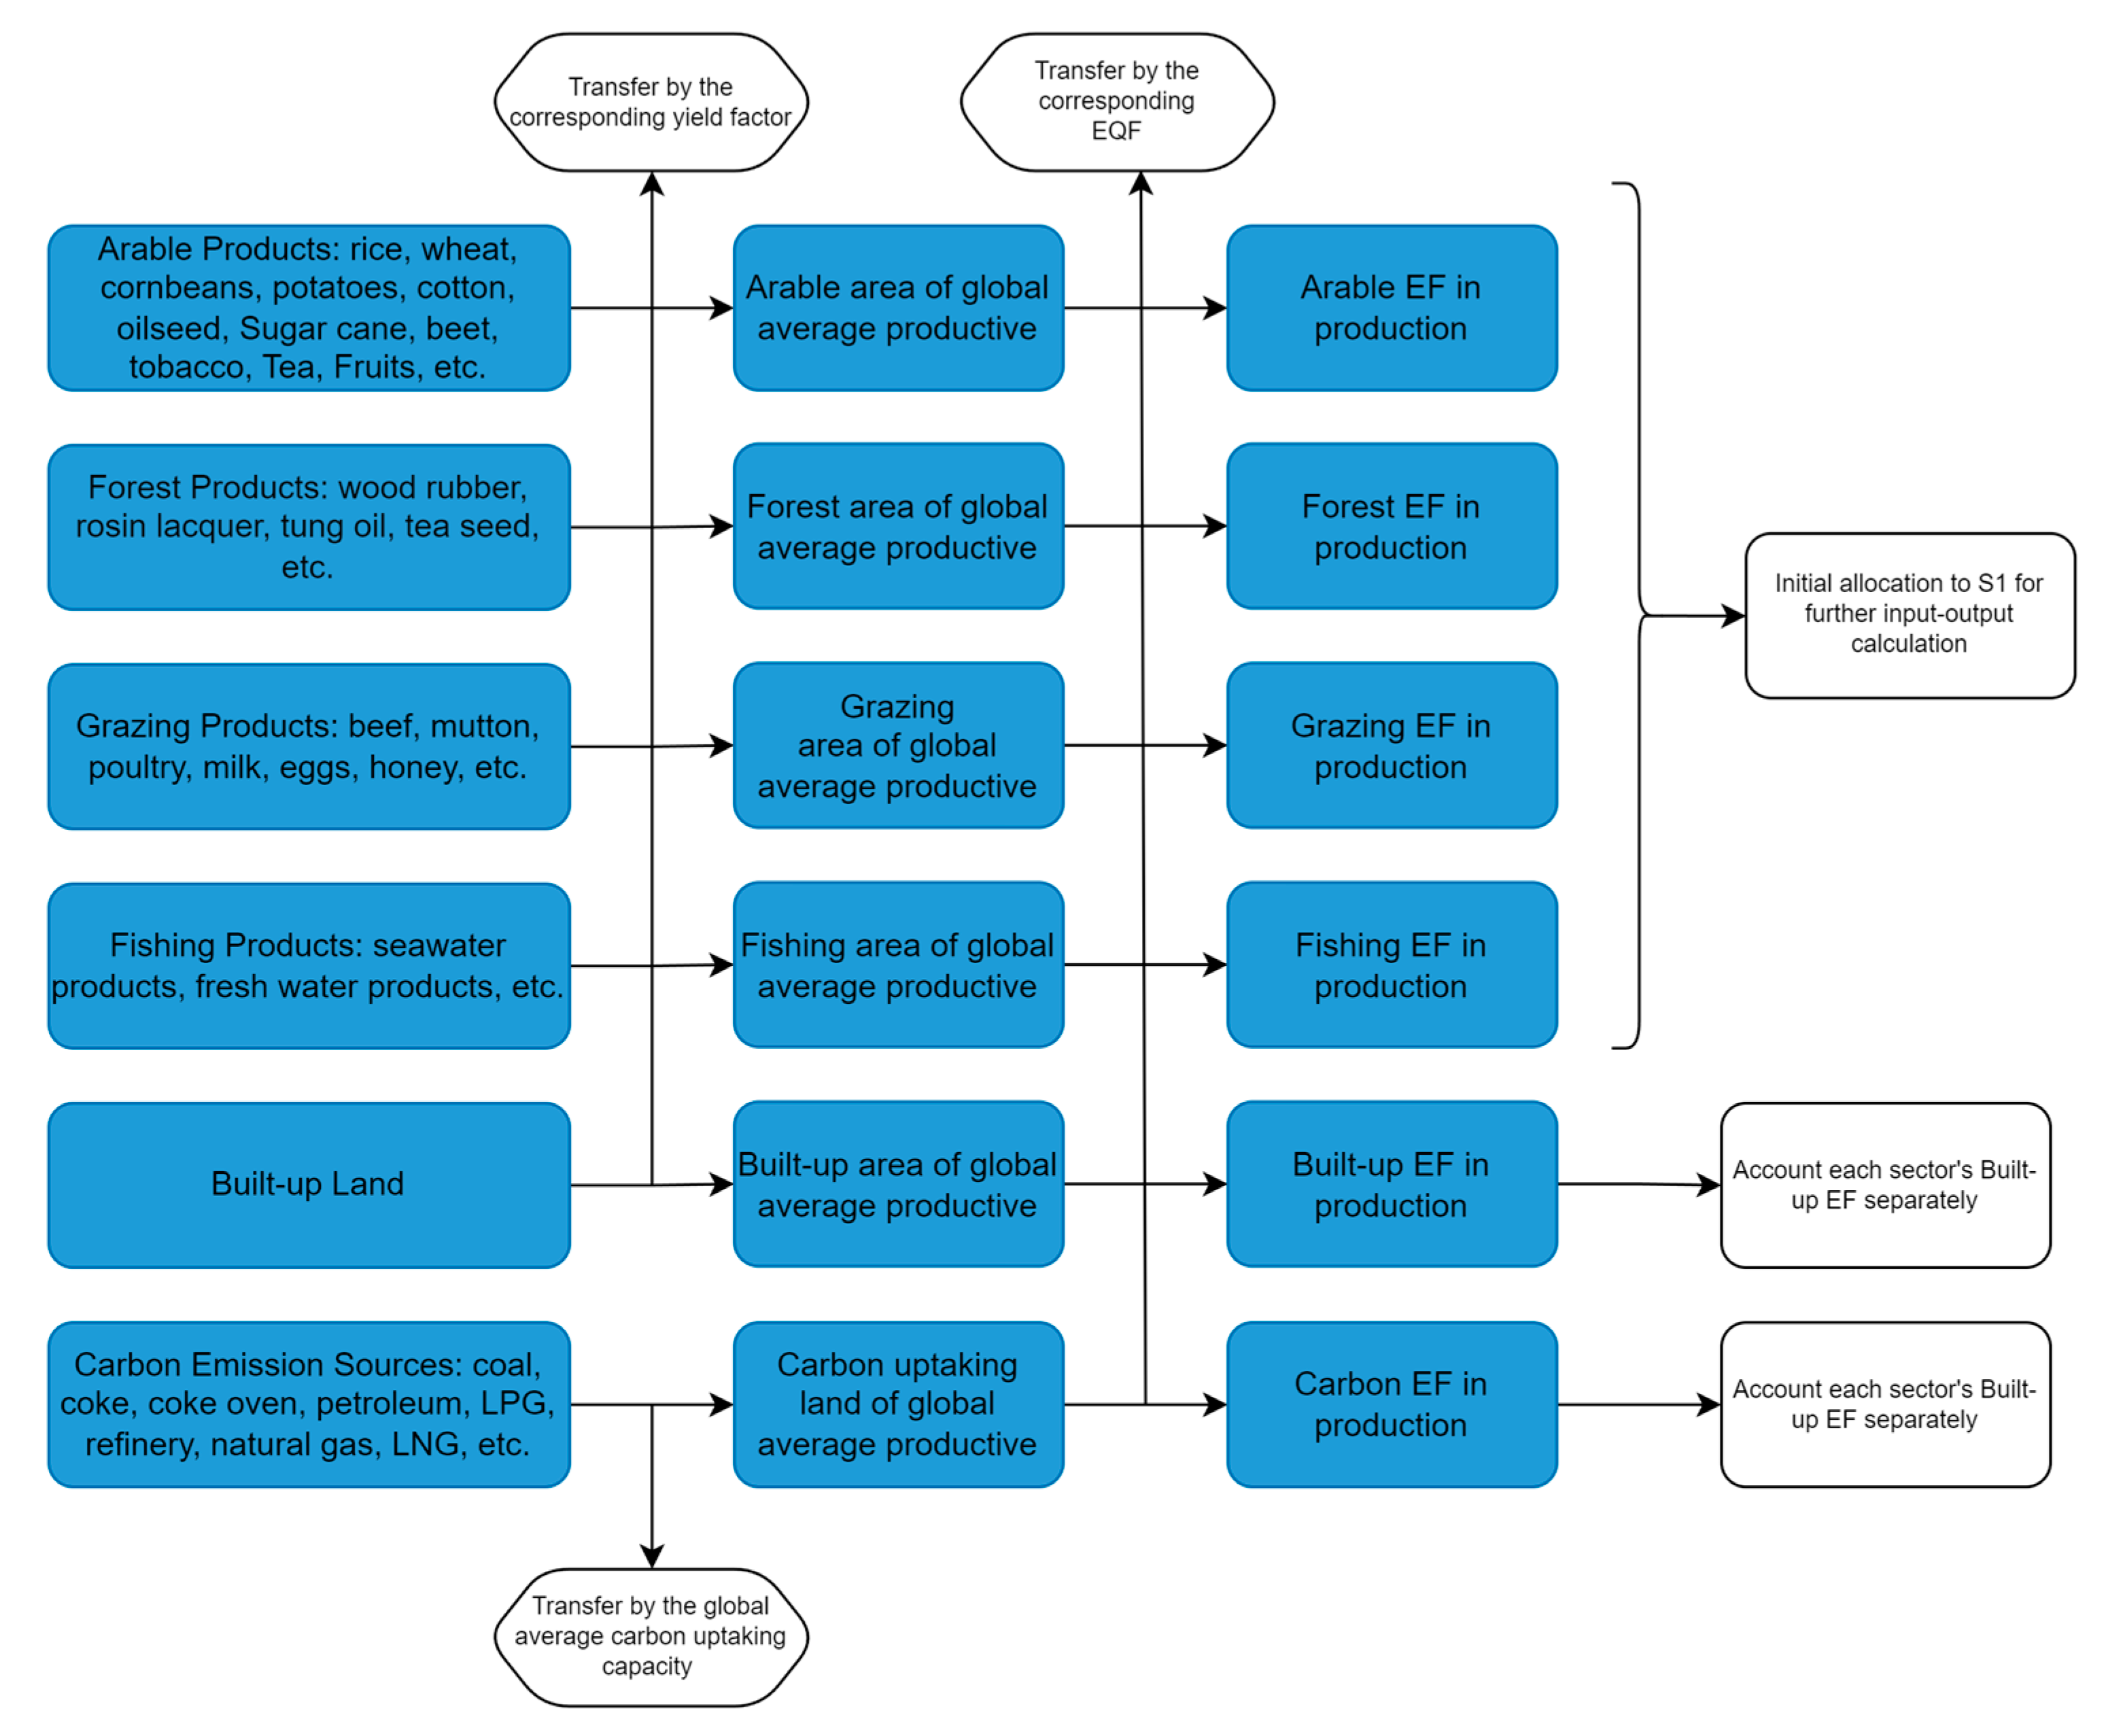
The calculation of the input-output EF requires analysis from the production side. The statistical methods for these directly occupied ecological data are based mainly on the statistics of ecological land consumption and direct carbon emissions from the production side. The product types of production-EF accounting refer to the global footprint network (GFN). As several introductions to the calculation of the EF in many studies have indicated, there are six EF land types: arable land, forestland, grazing land, fishing land, built-up land, and carbon-uptaking land. Data collocation from the production side is easier than that from consumption land in macrodata statistical studies. Figure 1. demonstrates the EF accounting of six types of land from a production perspective.
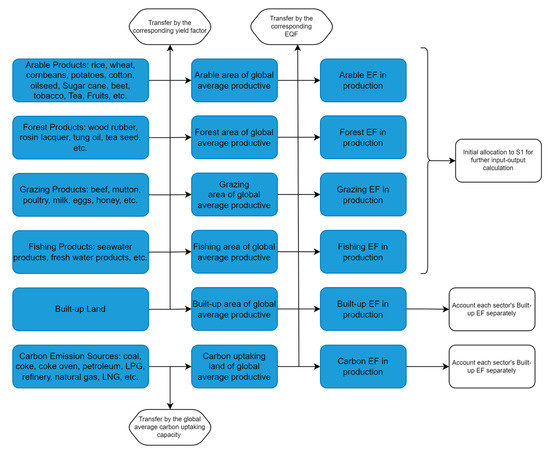
Figure 1.
The diagram of EF accounting in production.
The biological productive footprint (including arable land, forest, grazing land, and fishing land) is the S1 sector corresponding to this study. According to the product output of various land types in China in the study year and the global average output (FAO [48]), the yield factor is the average land area required to convert a local product into such a product. This is calculated as the area converted by the average output of various land types. Equivalence factor (EQF) is required to convert the area converted from the global average yield of each type of land to the global unified land area unit (gha) [11]; since the EF research is finally converted into a global unified area unit, the calculation of EQF needs to consider the situation of various land areas at the global scale by accounting suitability indexes from the Global Agro-Ecological Zones model. As most studies refer to GFN’s EQFs, this study also uses the results of GFN [49].
where , , , and indicate the production amount, local yield, yield factor, equivalence factor and global yield for product , respectively. As GFN’s Built-up land EF was calculated by directly actual land multiple arable, the actual land area was directly converted to EF units as shown in the following equation. Each sector’s built-up EF could be calculated separately for IOA analysis in the following.
where is the actual built-up area, and are the yield factor and equivalence factor. The following equation accounts for the carbon EF in production.
where is the total carbon emission, which was accounted for by energy used in production converted by emission factors with IPCC [50]. is the average carbon up-taking capacity per unit area, and is the equivalence factor for carbon EF. is the percent of carbon up-taking by the global ocean.
Normally, the ecological footprint intensity (EFI) refers to the EF to GDP relationship, corresponding with the concept of carbon intensity [51]. To echo the total production value and production value flows in the IOT, ecological footprint production intensity (EFPI) in this paper refers to the EF and its corresponding production monetary value, i.e., EF per 10,000 yuan of production in this study.
2.3. Ecological Footprint Extended Input–Output Tables
The structure of the EE-IO table is shown in Table 1. Let be the row index and be the column index, and is the index of EF land type in the following context. In the table, Z represents the intermediate matrix, where represents the intermediate demand for the products of sector produced by sector . is the final demand matrix, and is the total output vector. represents the environment expansion matrix, where indicates the direct pollution or land occupation of EF type for sector .

Table 1.
Structure of the extended input–output table.
Let:
where represents the intermediate demand for the products of sector produced by sector for one monetary unit. is the matrix of direct consumption coefficients as follows:
According to the matrix relationships in IOTs, the equation among , , and is established [40].
is the Leontief inverse matrix. The direct pollution coefficient (DPC) of a type of pollution (e.g., a type of EF) is k for section j. Direct pollution is the actual pollution that occurs in the area, i.e., actual land use and carbon dioxide emissions.
et
where is the total pollution coefficient (TPC) for pollution type k of sector j. TPC denotes direct and all external embodied pollution for one monetary unit of production of a sector.
2.4. Total EFPI Flows between Any Two Sectors
To determine the key paths among sectors, it is necessary to decompose the source of embodied pollution,
Let represent the EF for type k of sector j from sector i for one monetary unit of production, i.e., the EFPI component from sector of , which represents all direct and indirect EFs, including all EF flows from other sectors for one monetary unit of production of sector , called the total pollution coefficient component (TPCC).
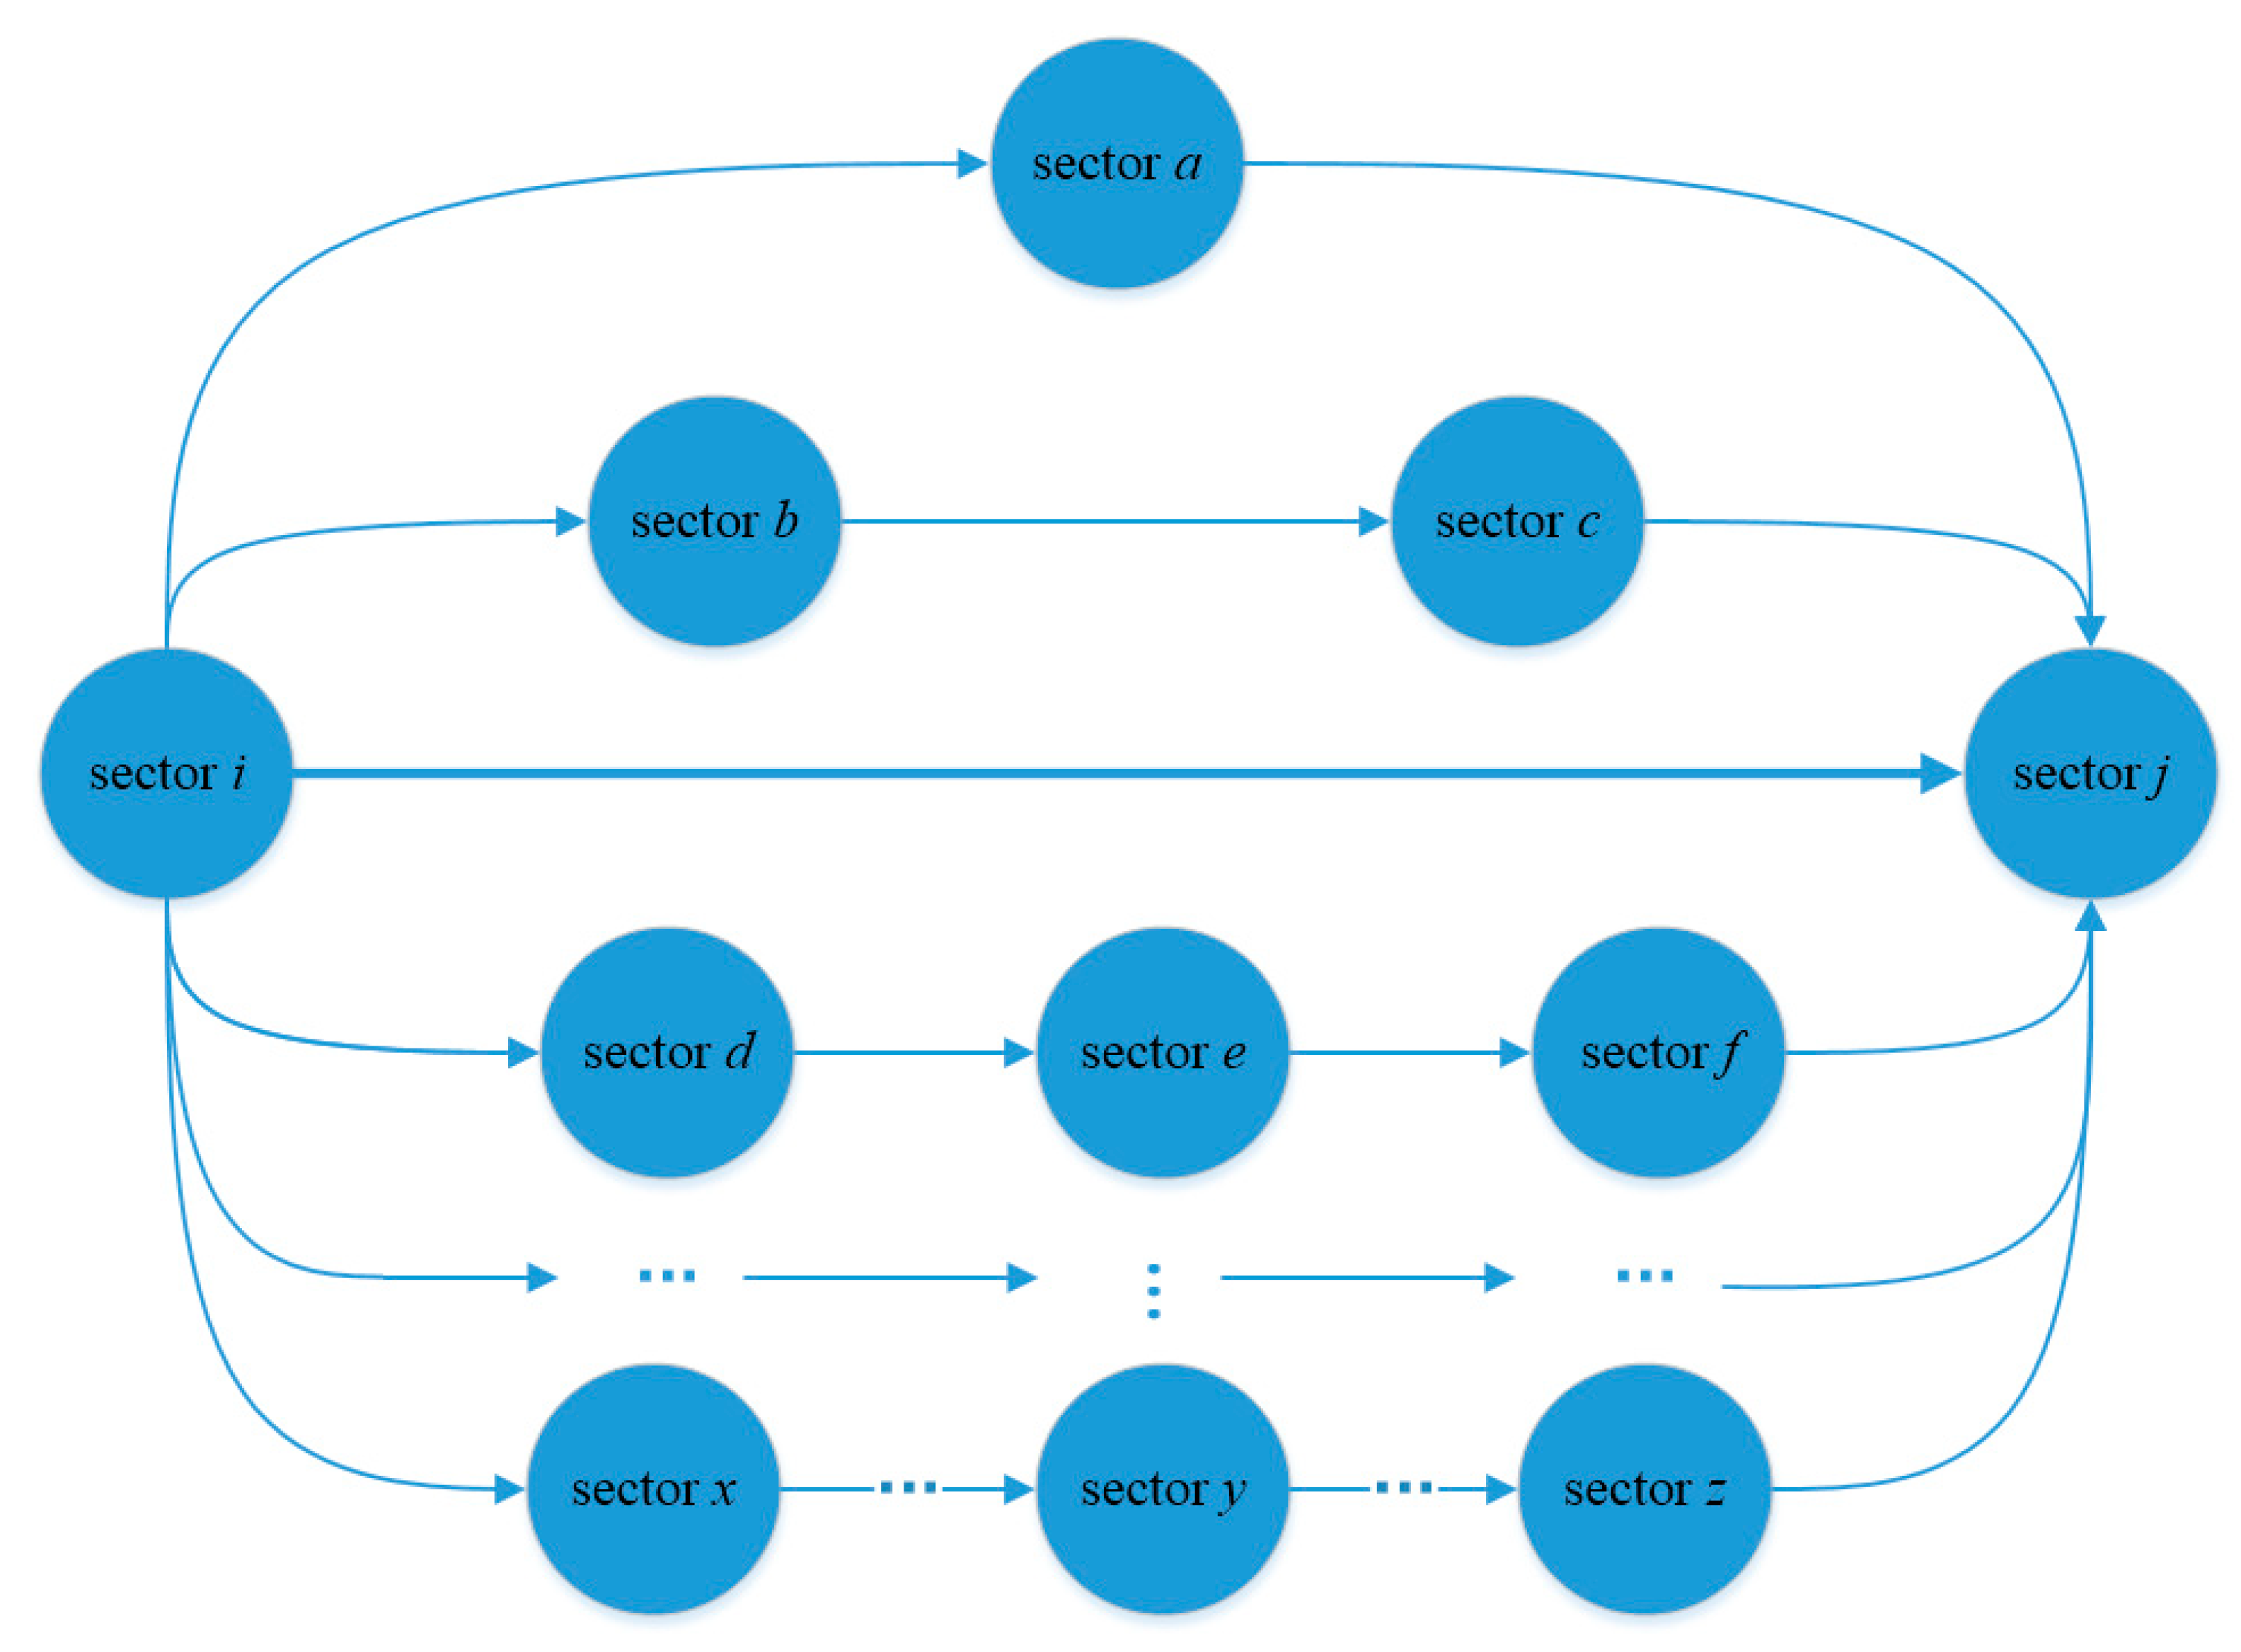
As shown in Figure 2, the direct footprint transfer from to is represented by the bold line in Figure 2. There are also indirect transfers, including single-layer, two-layer indirect, and multilayer indirect embodied EF transfers. These embodied footprints form the total transferred EF from to , denoted as . Taking of S1 as an example, it is more than , indicating that there are other embodied EFs from other sectors that are ultimately tracked from S1 itself.
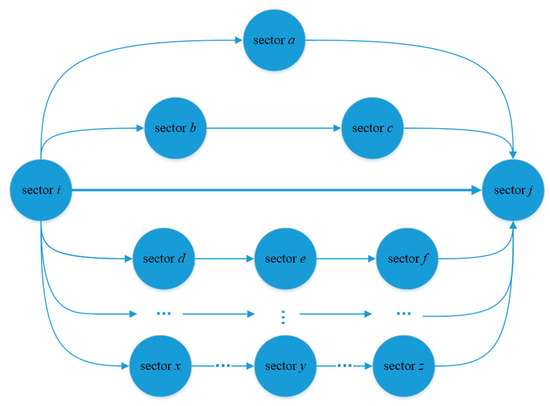
Figure 2.
Illustration of total EF flows from i to sector j.
2.5. Decomposition of Sector EFPI
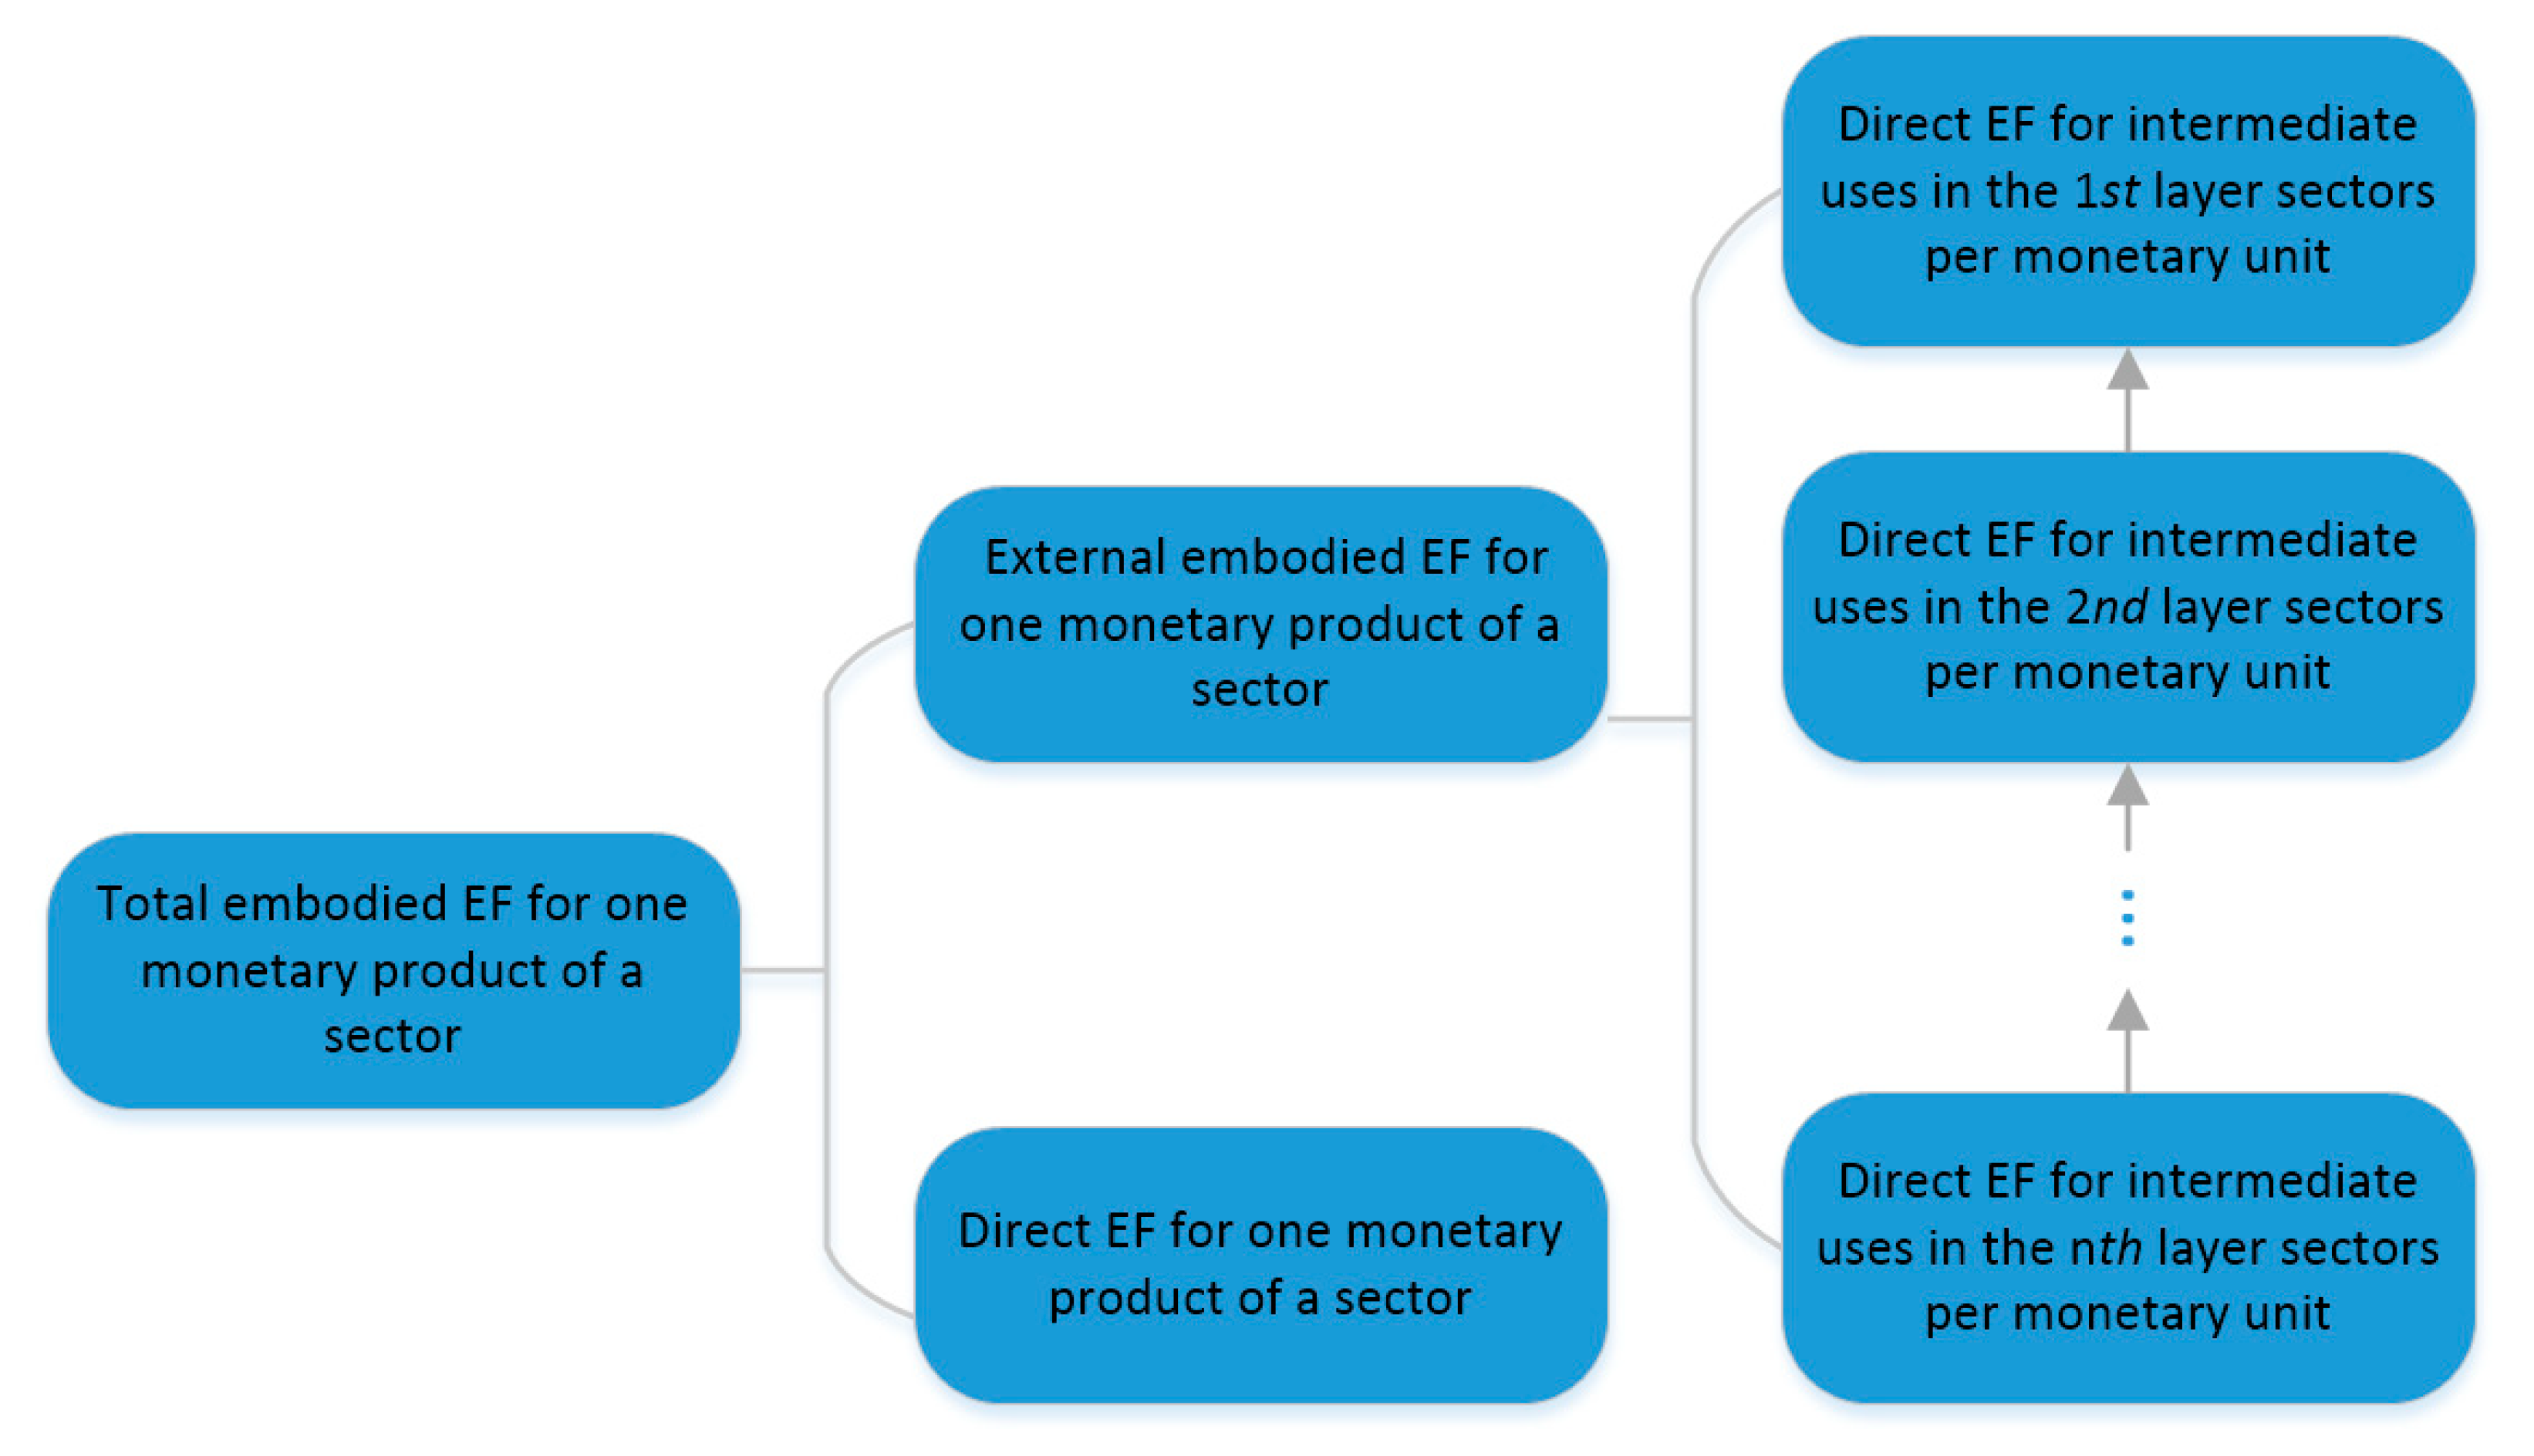
As demonstrated in Figure 3, for one monetary product of a sector, the total embodied EFPI is consistent with the direct EFPI component in the production process and the external embodied EFPI component from other sectors. From the perspective of EFPI, the type of EFPI component is transferred from sector to sector . is expressed as the size of the -type EFPI component indirectly generated from sector at the first level for one unit of currency produced by sector .
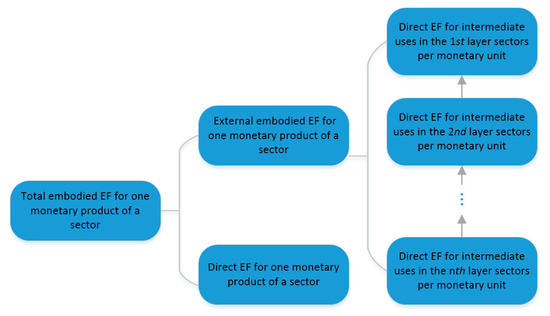
Figure 3.
Decomposition of a sector’s EFPI.
Recursively speaking, sector will also indirectly cause other sectors to generate the EFPI component in production. Accordingly, if the recursive tracing continues layer by layer, there will be many layers. The further back it is traced, the weaker the relationship with the first layer sector will be. The multilayer indirect emissions from to are as follows:
For the convenience of analysis, Table 2. lists the abbreviations and meanings.

Table 2.
Abbreviations and Meanings.
3. Results and Analysis
3.1. Analysis of the Total Pollution Coefficient Component
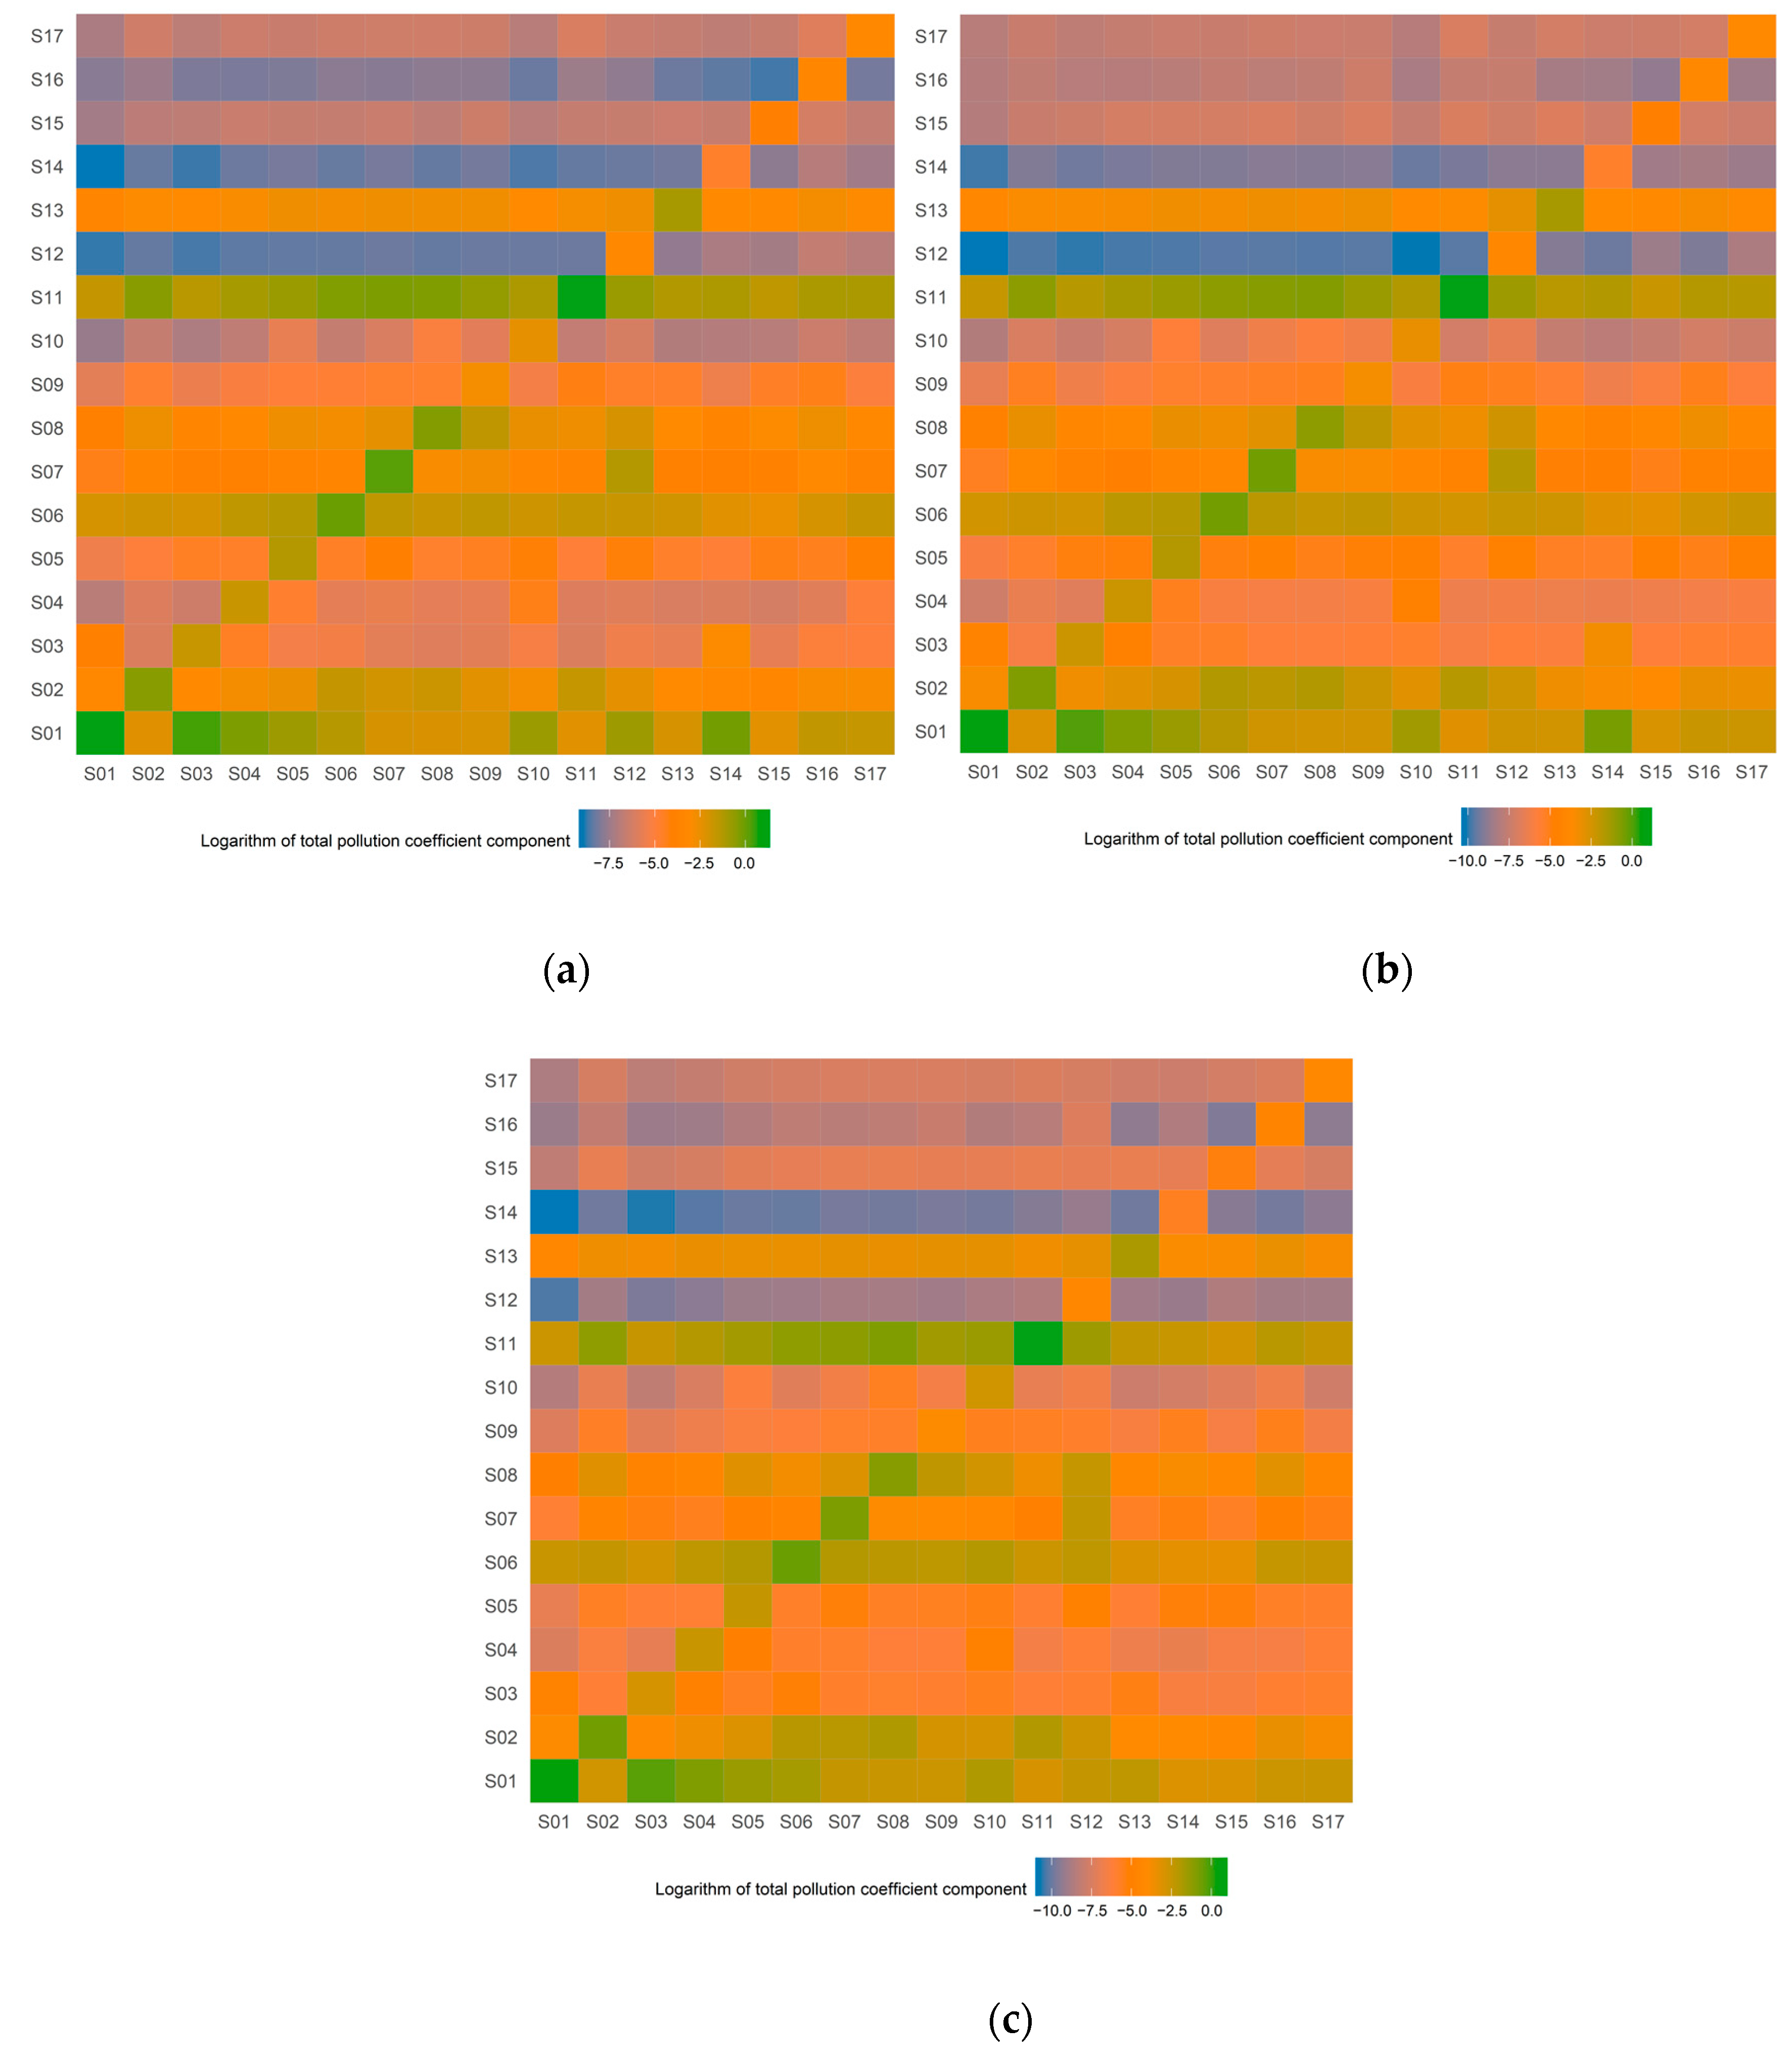
Due to the high deviation and extreme outliers of the TPCC values, the logarithm form of the TPCC was depicted for highly distinct values, as shown in Figure 4. The matrices of TPCC for 2005, 2010, and 2015 are depicted with different colors and negative values.
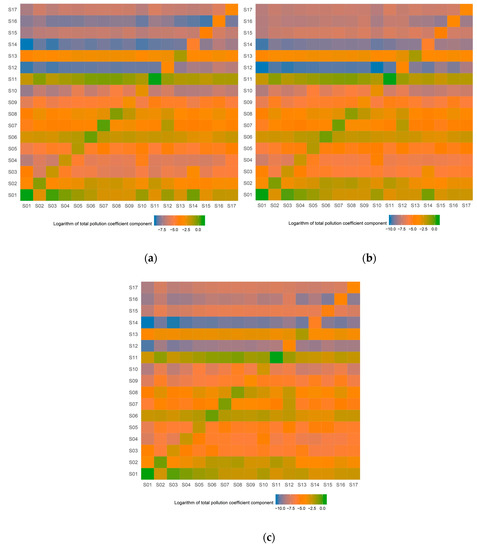
Figure 4.
The logarithm of China’s TPCC matrix of the EF in 2005 (a), 2010 (b), and 2015 (c).
The distribution patterns of the TPCC values exhibited some of the same characteristics in the study years: The low values were focused on the input (supply) sides of S12, S14, S15, S16, and S17, while the high values were focused on the input (supply) sides of S1, S2, S6, and S11. From the perspective of the output sides, the TPCC values varied, and some TPCCs shifted considerably across the years.
As decomposed in Section 2.4 above, the TPCC matrix clearly demonstrated the embodied EF components of any sector per unit of production. Analysis and decomposition of the TPCC matrix were used to obtain the details of embodied EFPI component transfers.
For ease of expression, the arrow symbol (→) was used to indicate embodied EF-related transfer paths among sectors in the following text, e.g., S1→S2 means from sector S1 to sector S2. As indicated by the statistical chart, in 2005, the maximum TPCCs were 3.85 (S11→S11, unit: gha/10,000 Yuan, and the same unit hereinafter) and 3.27 (S1→S1), which originated, respectively, from the sectors of the power industry and agriculture, with low EF efficiency. From the data of the embodied EFPI component among different sectors, the relatively large numerical relationships were 1.47 (S1→S3), 0.86 (S1→S14), 0.74 (S11→S7), and 0.73 (S1→S4).
The TPCC values among the most highly ranked sectors originated mainly from S1 and S11, followed by the two sectors with the largest TPCC supply source, with the following TPCCs: 0.27 (S7→S12), 0.25 (S6→S5), 0.22 (S6→S7), 0.22 (S6→S4), 0.21 (S6→S9) and 0.21 (S8→S9).
Judging from the changes in TPCCs in 2010, the maximum value was slightly lower than that in 2005. The maximum value was once again from S11 to itself, at 3.28, followed by the TPCC of S1 to itself, at 1.97, which was significantly lower than in 2005. The largest value among different sectors remained the exporting TPCCs of S1 and S11 to other sectors, which decreased somewhat compared to 2005. In addition, there were values of 0.169 (S2→S11), 0.167 (S6→S5), 0.160 (S7→S12), and 0.152 (S2→S7), with the TPCC output by S2 being highlighted.
In 2015, the two largest TPCC values remained the self-transfers of S11 (2.72) and S1 (1.42), which were both lower than in 2010. Among the TPCC data between different sectors, the largest value was the transfer from S1 to S3 (0.73), followed by the transfer from S11 to S8 (0.4). The top 13 transfers generally involved the transfer of S11 and S1 on the output side, except for the transfer between S11 and S1. In addition, the main TPCCs were 0.15 (S2→S8), 0.14 (S2→S11), 0.13 (S6→S7), 0.13(S6→S10), 0.13 (S6→S5) and 0.12 (S2→S6). Compared with 2010, the transfer volume of industry S6 in 2015 was highlighted, while the S7 transfer impact was reduced.
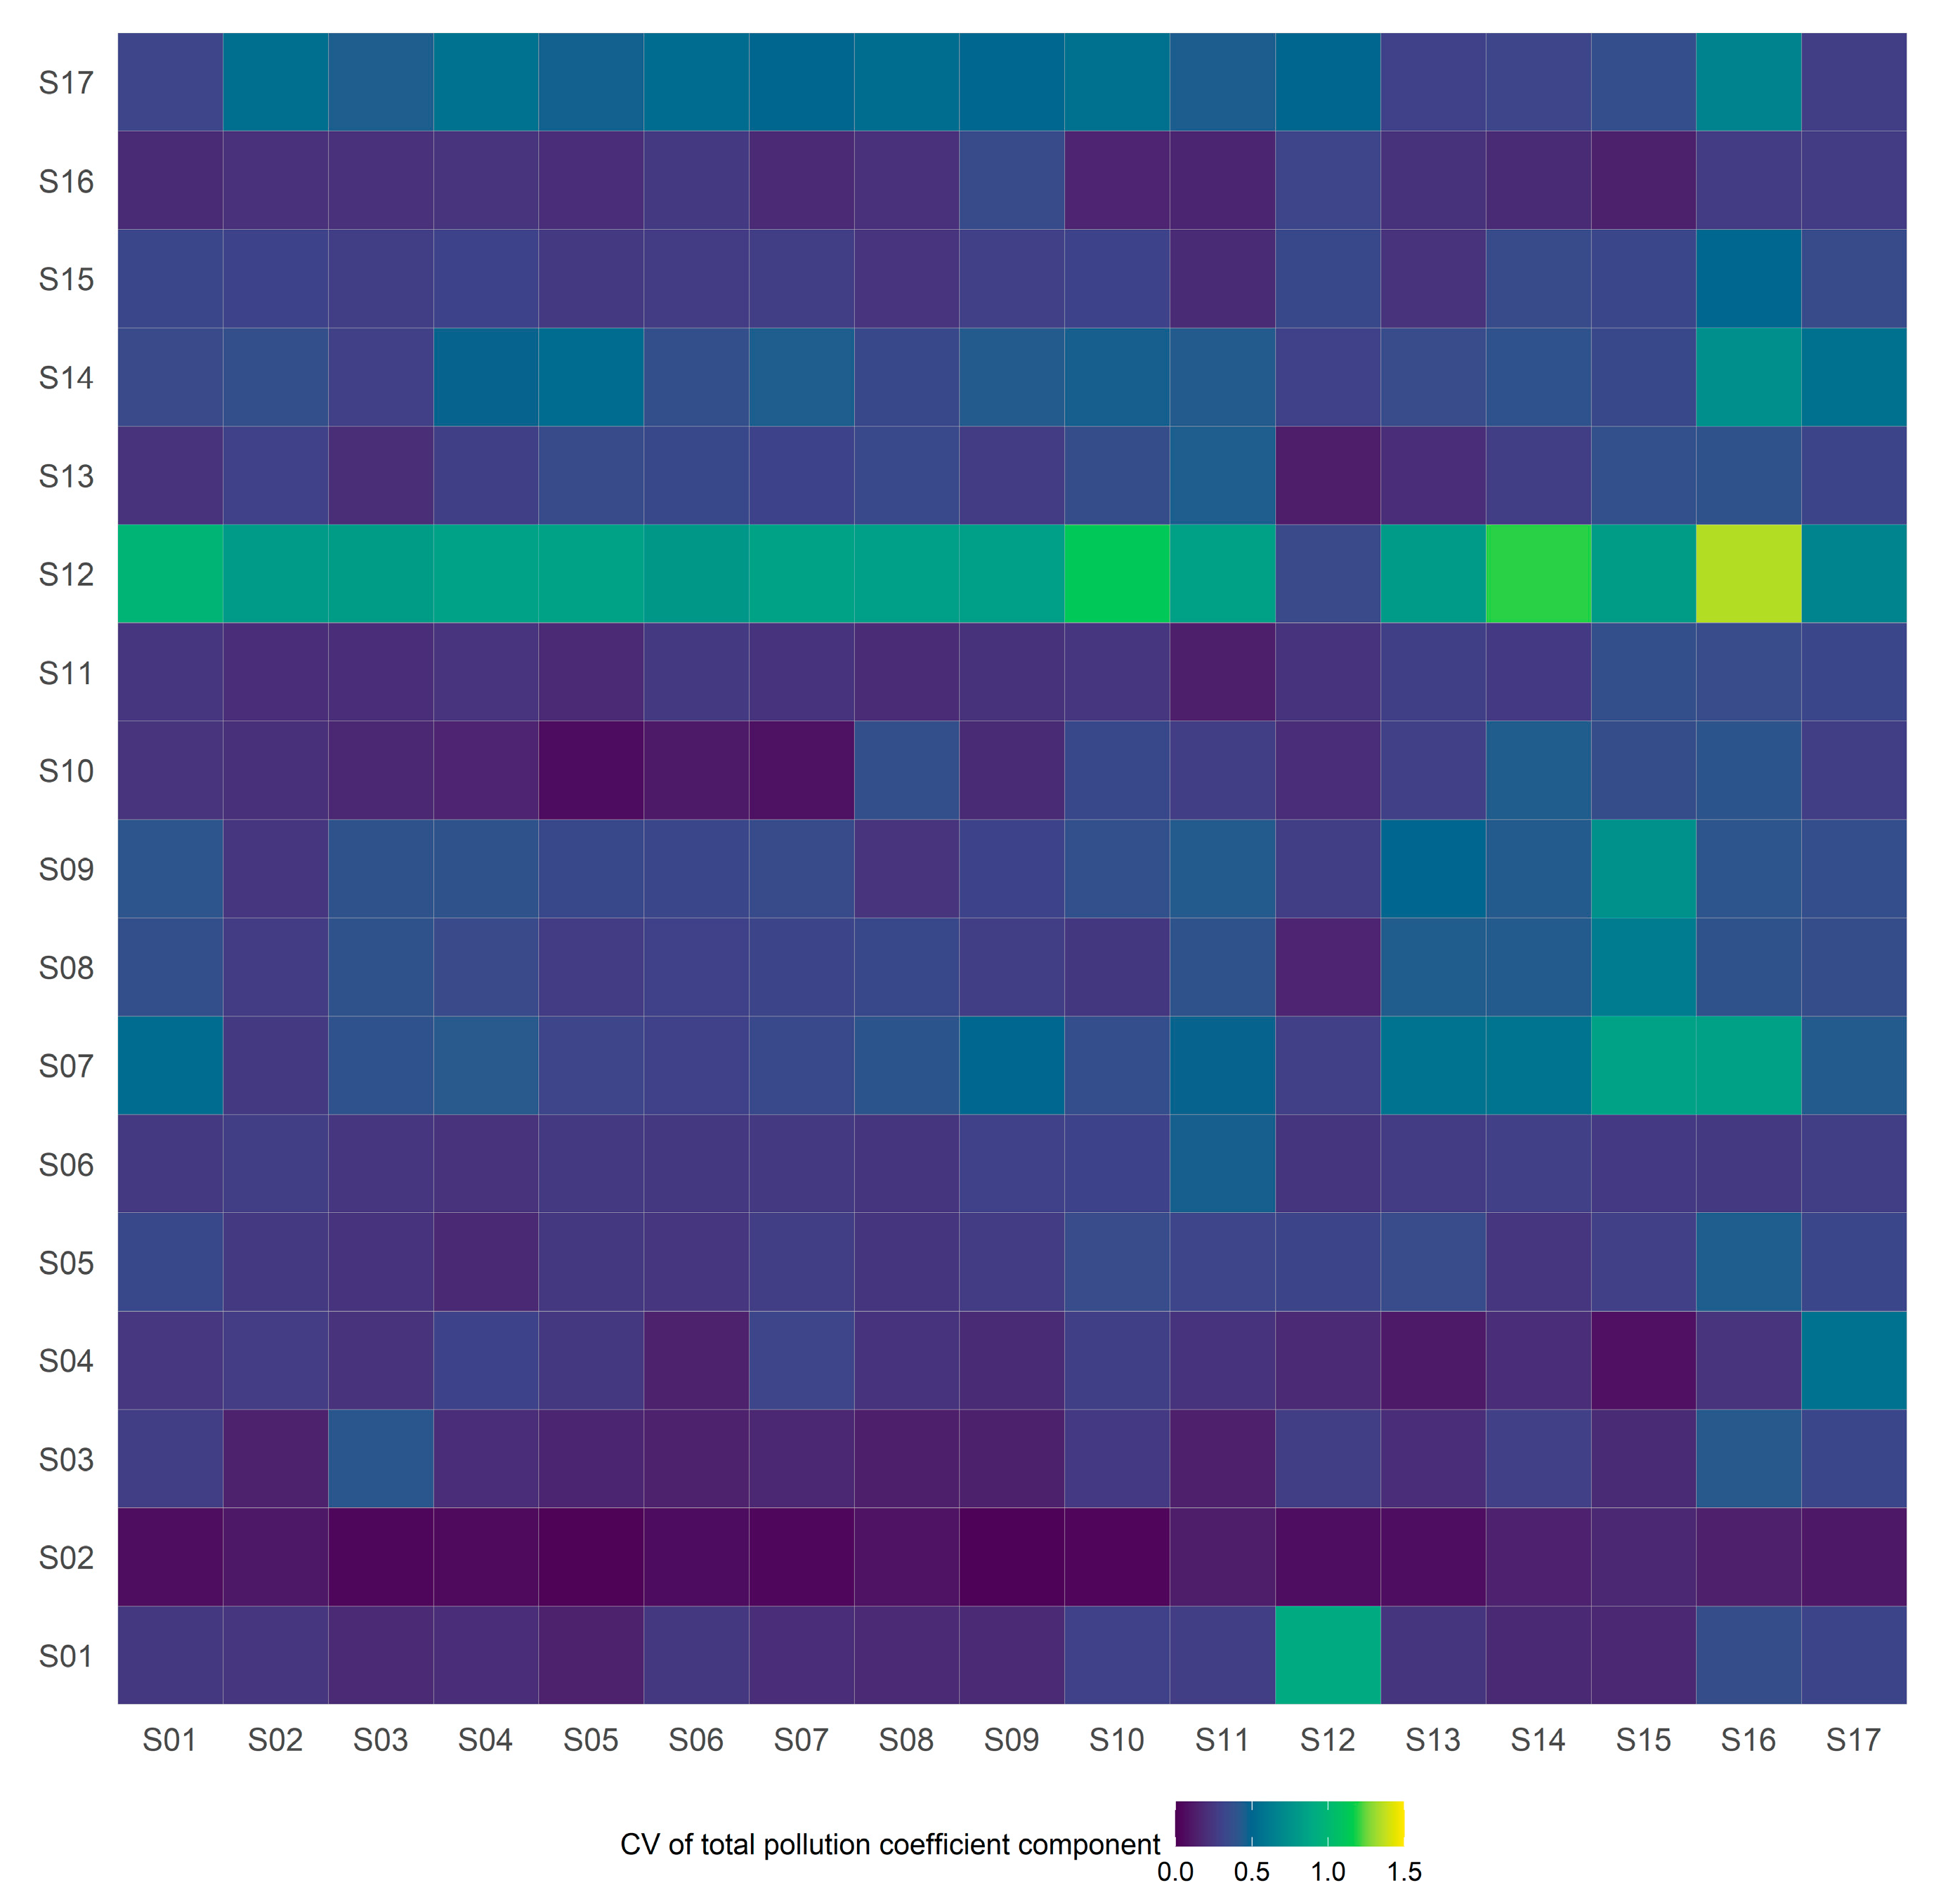
Within the three-year study period, the average TPCCs showed a downward trend, from 0.109 in 2005 to 0.072 in 2010 and then to 0.054 in 2015. It could be explained that the economic growth rate was faster than the EF growth rate. The overall TPCC values of the same sectors were significantly higher than those of different sectors. It could be explained that the direct and indirect consumption of the sectors themself were high. Moreover, it could be found that the distributional pattern among sectors seldom changed, indicating the overall EF transfer and economic relationships among sectors were relatively stable. From the year’s change of each sector, the coefficient of variation (CV) highlighted the variation in TPCCs among the studied years, as shown in Figure A1. The largest variation came from S12 and the smallest from S2, indicating that the construction industry sector shifted the most, and the mining industry stayed relatively stable in the study year. There were extreme variations in several sectors, such as S1→S12, S7→S15, and S7→S16. Most of the variations came from the significant proportion decrease in TPCCs, e.g., The TPCC value of S7→S15 was changed from 0.023 in 2005 to 0.006 in 2010 and then to 0.003 in 2015. In addition, TPCC values among parts of sectors increased in the study year. In 2005-2010, it mainly existed in the TPCCs of S2, S3, and S16 as the input side, while in 2010-2015, it primarily changed in S4, S10, S12, and S15, reflecting the differences between industries in different periods. Even though these added changes were small, it also showed that the unit EF consumption had not been reduced, and eco-efficiency has not been increased with economic growth for those sectors.
For any two sectors, the transfer TPCC between them is not necessarily the same. There will be a specific difference between the two. That is the net EF transfer value of the unit currency. The analysis of ecological responsibility has more practical significance, and the following will analyze the net transfer.
3.2. Analysis of the Net Embodied EFPI Component Transfer among Sectors
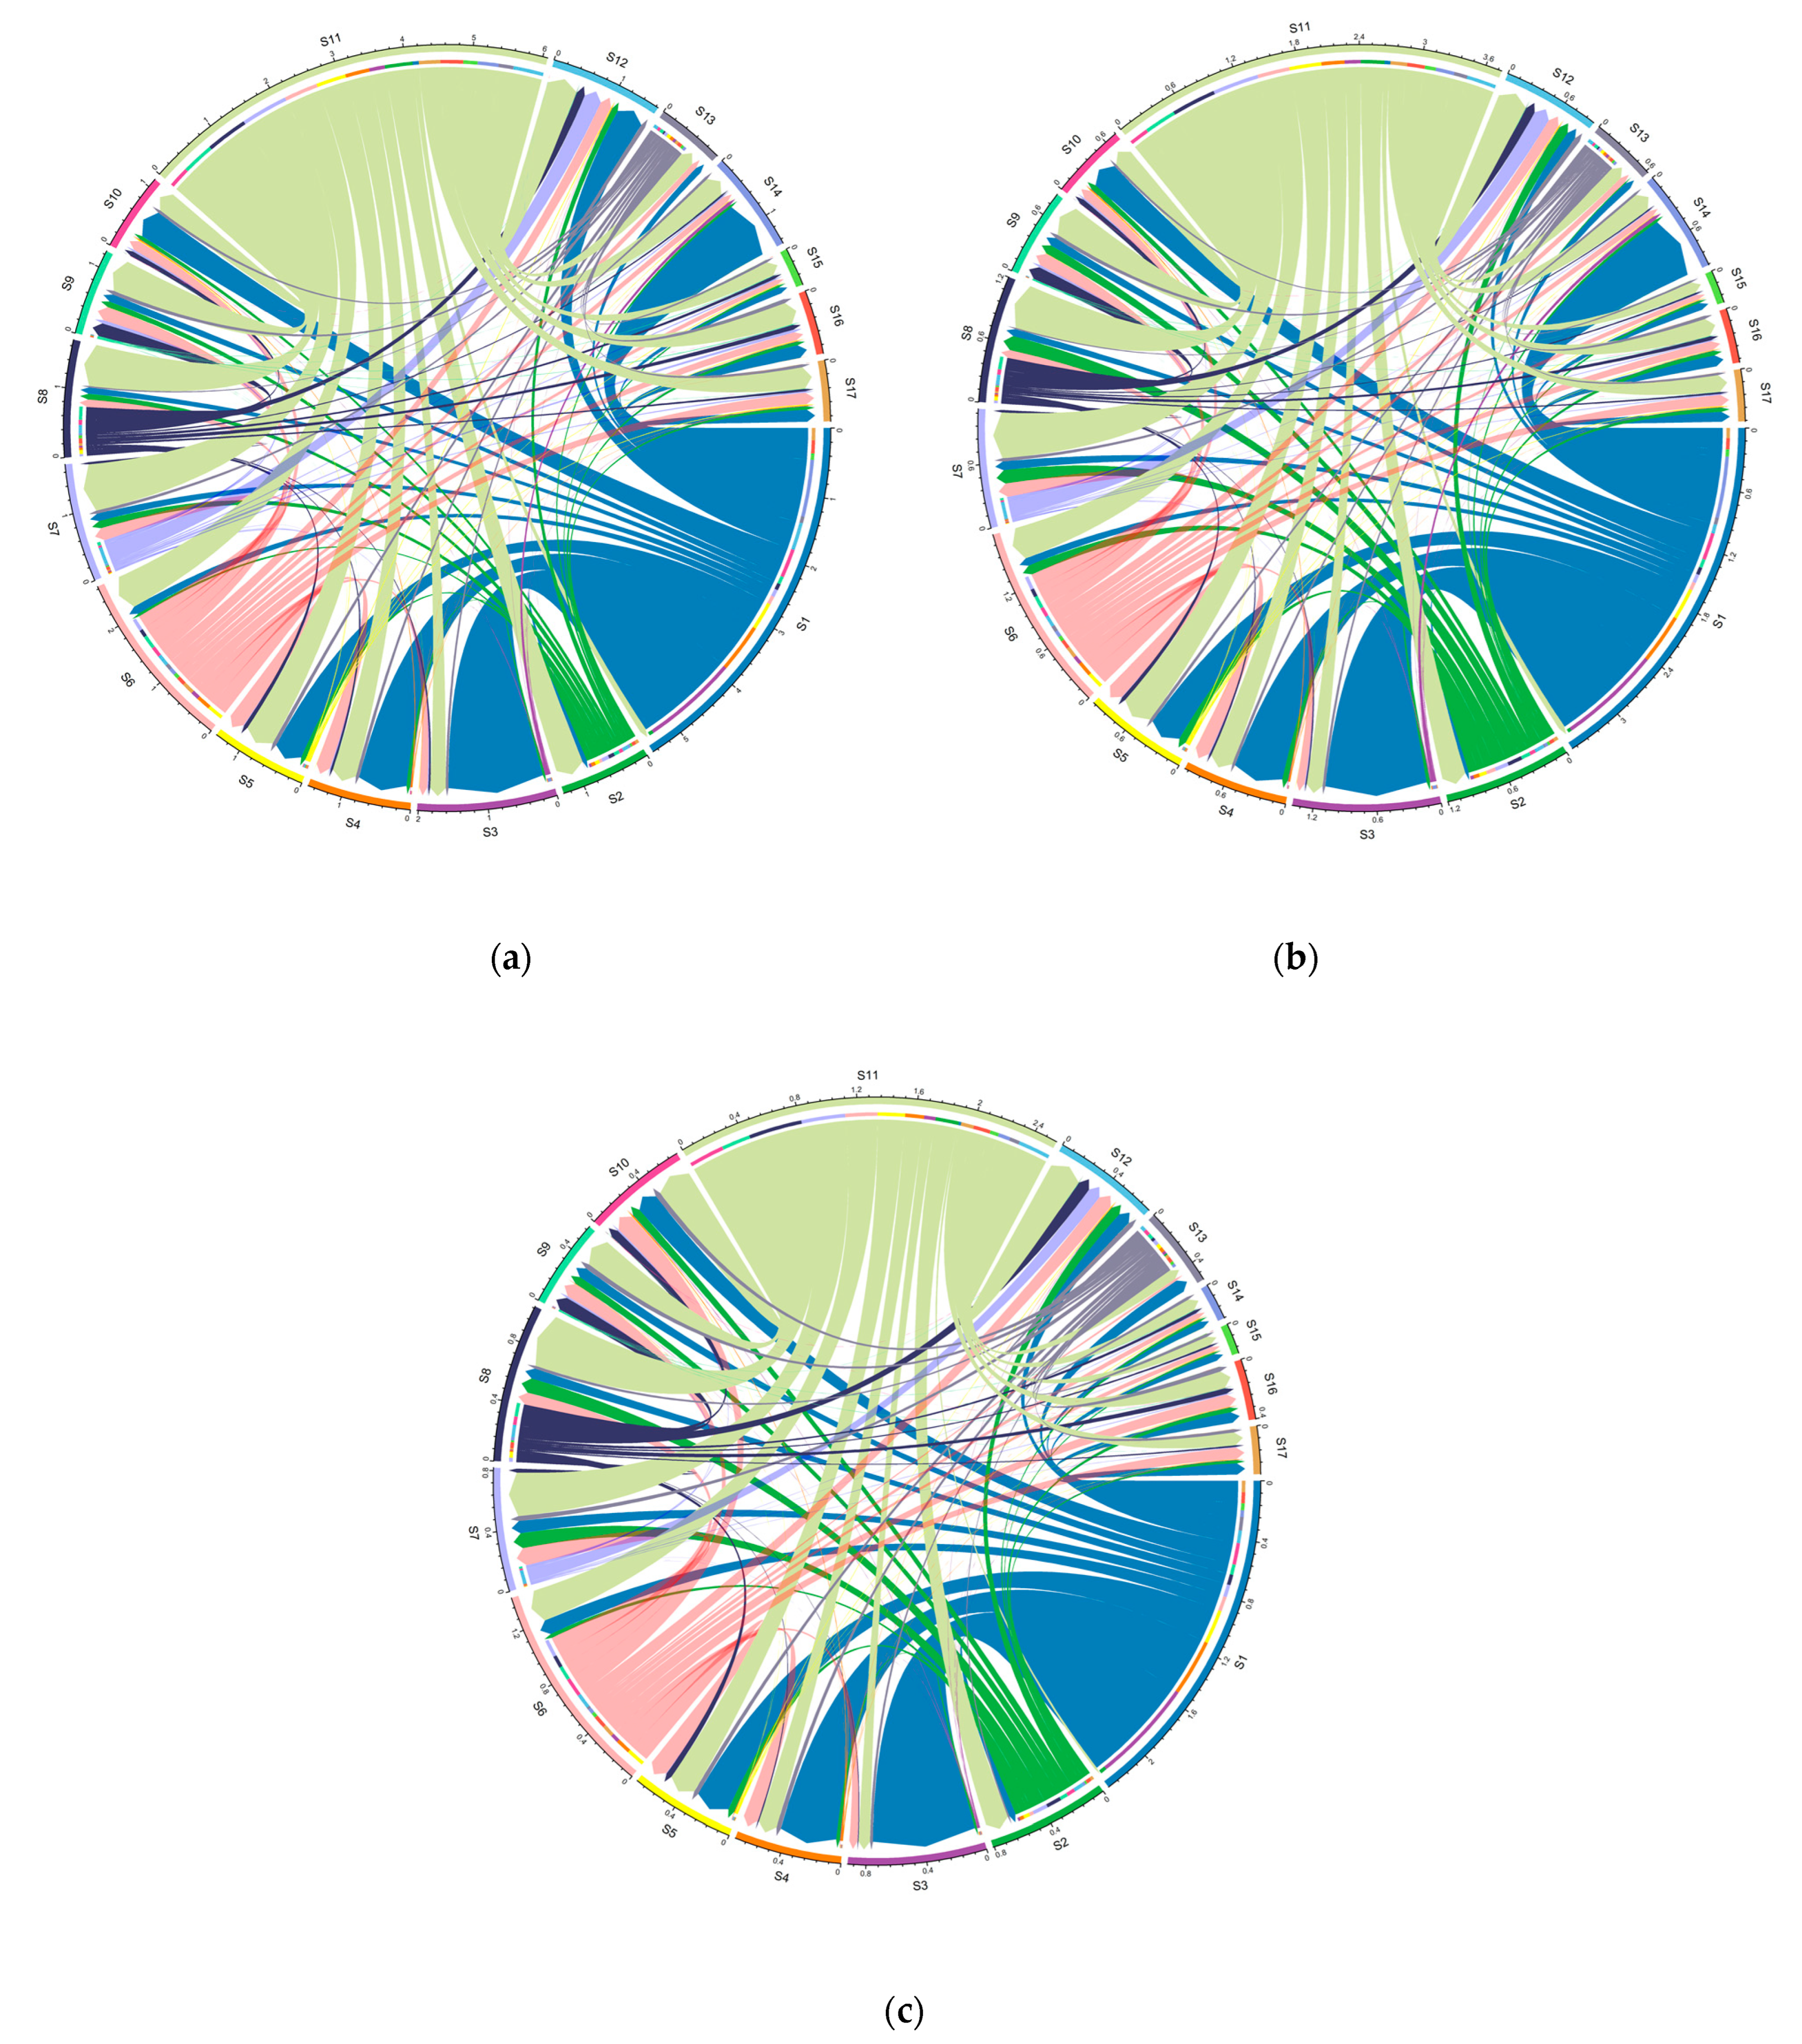
Figure 5 depicts China’s net embodied EF transfer links of per-monetary-unit production for 2005, 2010, and 2015 with chord diagrams. In addition, Table A2 listed the top 30 net EFPI component transfers between different sectors for each studied year. The arrows indicate the EF net flow directions, calculated by the inflow (+) and outflow (-) of EF per monetary unit production between any two sectors. The width of each sector in the chord diagrams represents the net embodied EF transfer volume per monetary unit production.
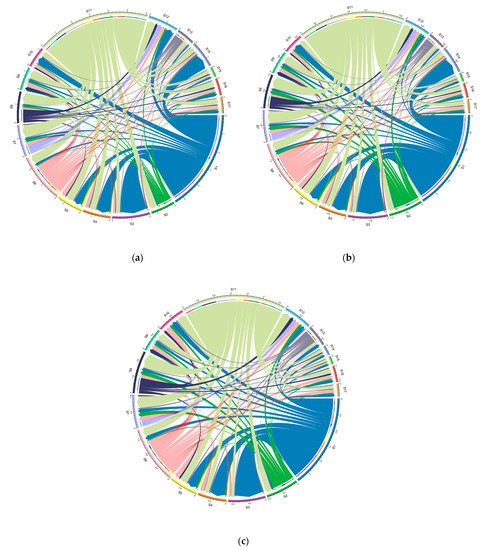
Figure 5.
EF transfer flows among economic sectors for one monetary unit in 2005 (a), 2010 (b), and 2015 (c).
Figure 5a demonstrates that S11 was the largest net embodied EFPI component exporter in 2005, with a net EF outflow per monetary unit of more than 6. S11 was the net embodied EFPI component exporter for all other sectors, while S16 was the net embodied EF importer for all other sectors in 2005. In addition, S11 was also a large net embodied EF exporter. S3 was the largest net embodied EF importer, with an inflow EF size close to 2.
Most economic sectors were mainly as EFPI component importers, such as S3, S4, S9, S10, S12, S14, S15, S16, and S17. The other sectors were both significant EFPI component exporters and importers, such as S6, S7, S8, and S13. For the 136 relationships among the 17 sectors, the average value was 0.12 in 2005. The top transfer links were S1→S3 (1.447), S1→S14 (0.855), S1→S4 (0.729), S11→S7 (0.71), S11→S8 (0.632), S11→S6 (0.507), S11→S9 (0.487), S11→S12 (0.457), S11→S5 (0.45), and S1→S10 (0.432).
As shown in Figure 5b, 2010′s net embodied EFPI component transfer links changed considerably compared with the corresponding data in 2005. In total, the net embodied EFPI component data declined considerably. The mean value dropped to 0.078, and the largest net EFPI component transfer link was still S1→S3 (1.01). S1 and S11 remained the main origination points of the transfer paths, and S2, S6, and S7 also had a large proportion of output. A few sectors were almost net input industries with very little output, such as S9, S14, S15, S16, S17, and S12. The largest transfer links were as follows: S1→S3 (1.008), S1→S14 (0.602), S1→S4 (0.489), S11→S7 (0.454), S11→S8 (0.438), S11→S6 (0.317), S11→S9 (0.316), S1→S5 (0.314), S11→S5 (0.313), and S11→S12 (0.292).
In 2015 (Figure 5c), the maximum net EFPI component transfer was still S1→S3 (0.718), although the average value shrank to 0.055. This year, the main EFPI component transfer exporters were primarily S1, S11, S6, and S2, while the net EFPI component exporter importance of S7 decreased. The largest net EF transfer links included S1→S3 (0.718), S1→S4 (0.391), S11→S8 (0.369), S11→S7 (0.303), S11→S10 (0.243), S1→S5 (0.236), S11→S12 (0.223), S11→S6 (0.221), S11→S9 (0.2), and S11→S5 (0.189). The net input sector became S14, while some other industries had only a small proportion of the output and were primarily input-dominated.
As shown by the three-year analysis, in terms of unit currency production, the input and output of all sectors decreased year by year, indicating that the net EF of unit currency production to other sectors declined. The three-chord diagrams show that the overall structures of inflows and outflows across the three years did not change considerably. In all three years, the main EFPI export sectors were S1 and S11; the main import sectors were S3, S4, S5, S9, S10, S12, S14, S15, S16, and S17; and the sectors with partial import and export of net embodied EFPI were S2, S6, S7, S8, and S13.
3.3. Analysis of the Change in EFPI Component Transfer Paths
The above analysis of the net transfer amount of EF per unit currency is analyzed only from the perspective of the accumulation of embodied EF. Identifying and positioning the transfer paths of the EF and EFPI components, especially key transfer paths with high amounts, is helpful in determining the key transfers, which provides a basis for reducing the sector development of EFPI in green ecology.
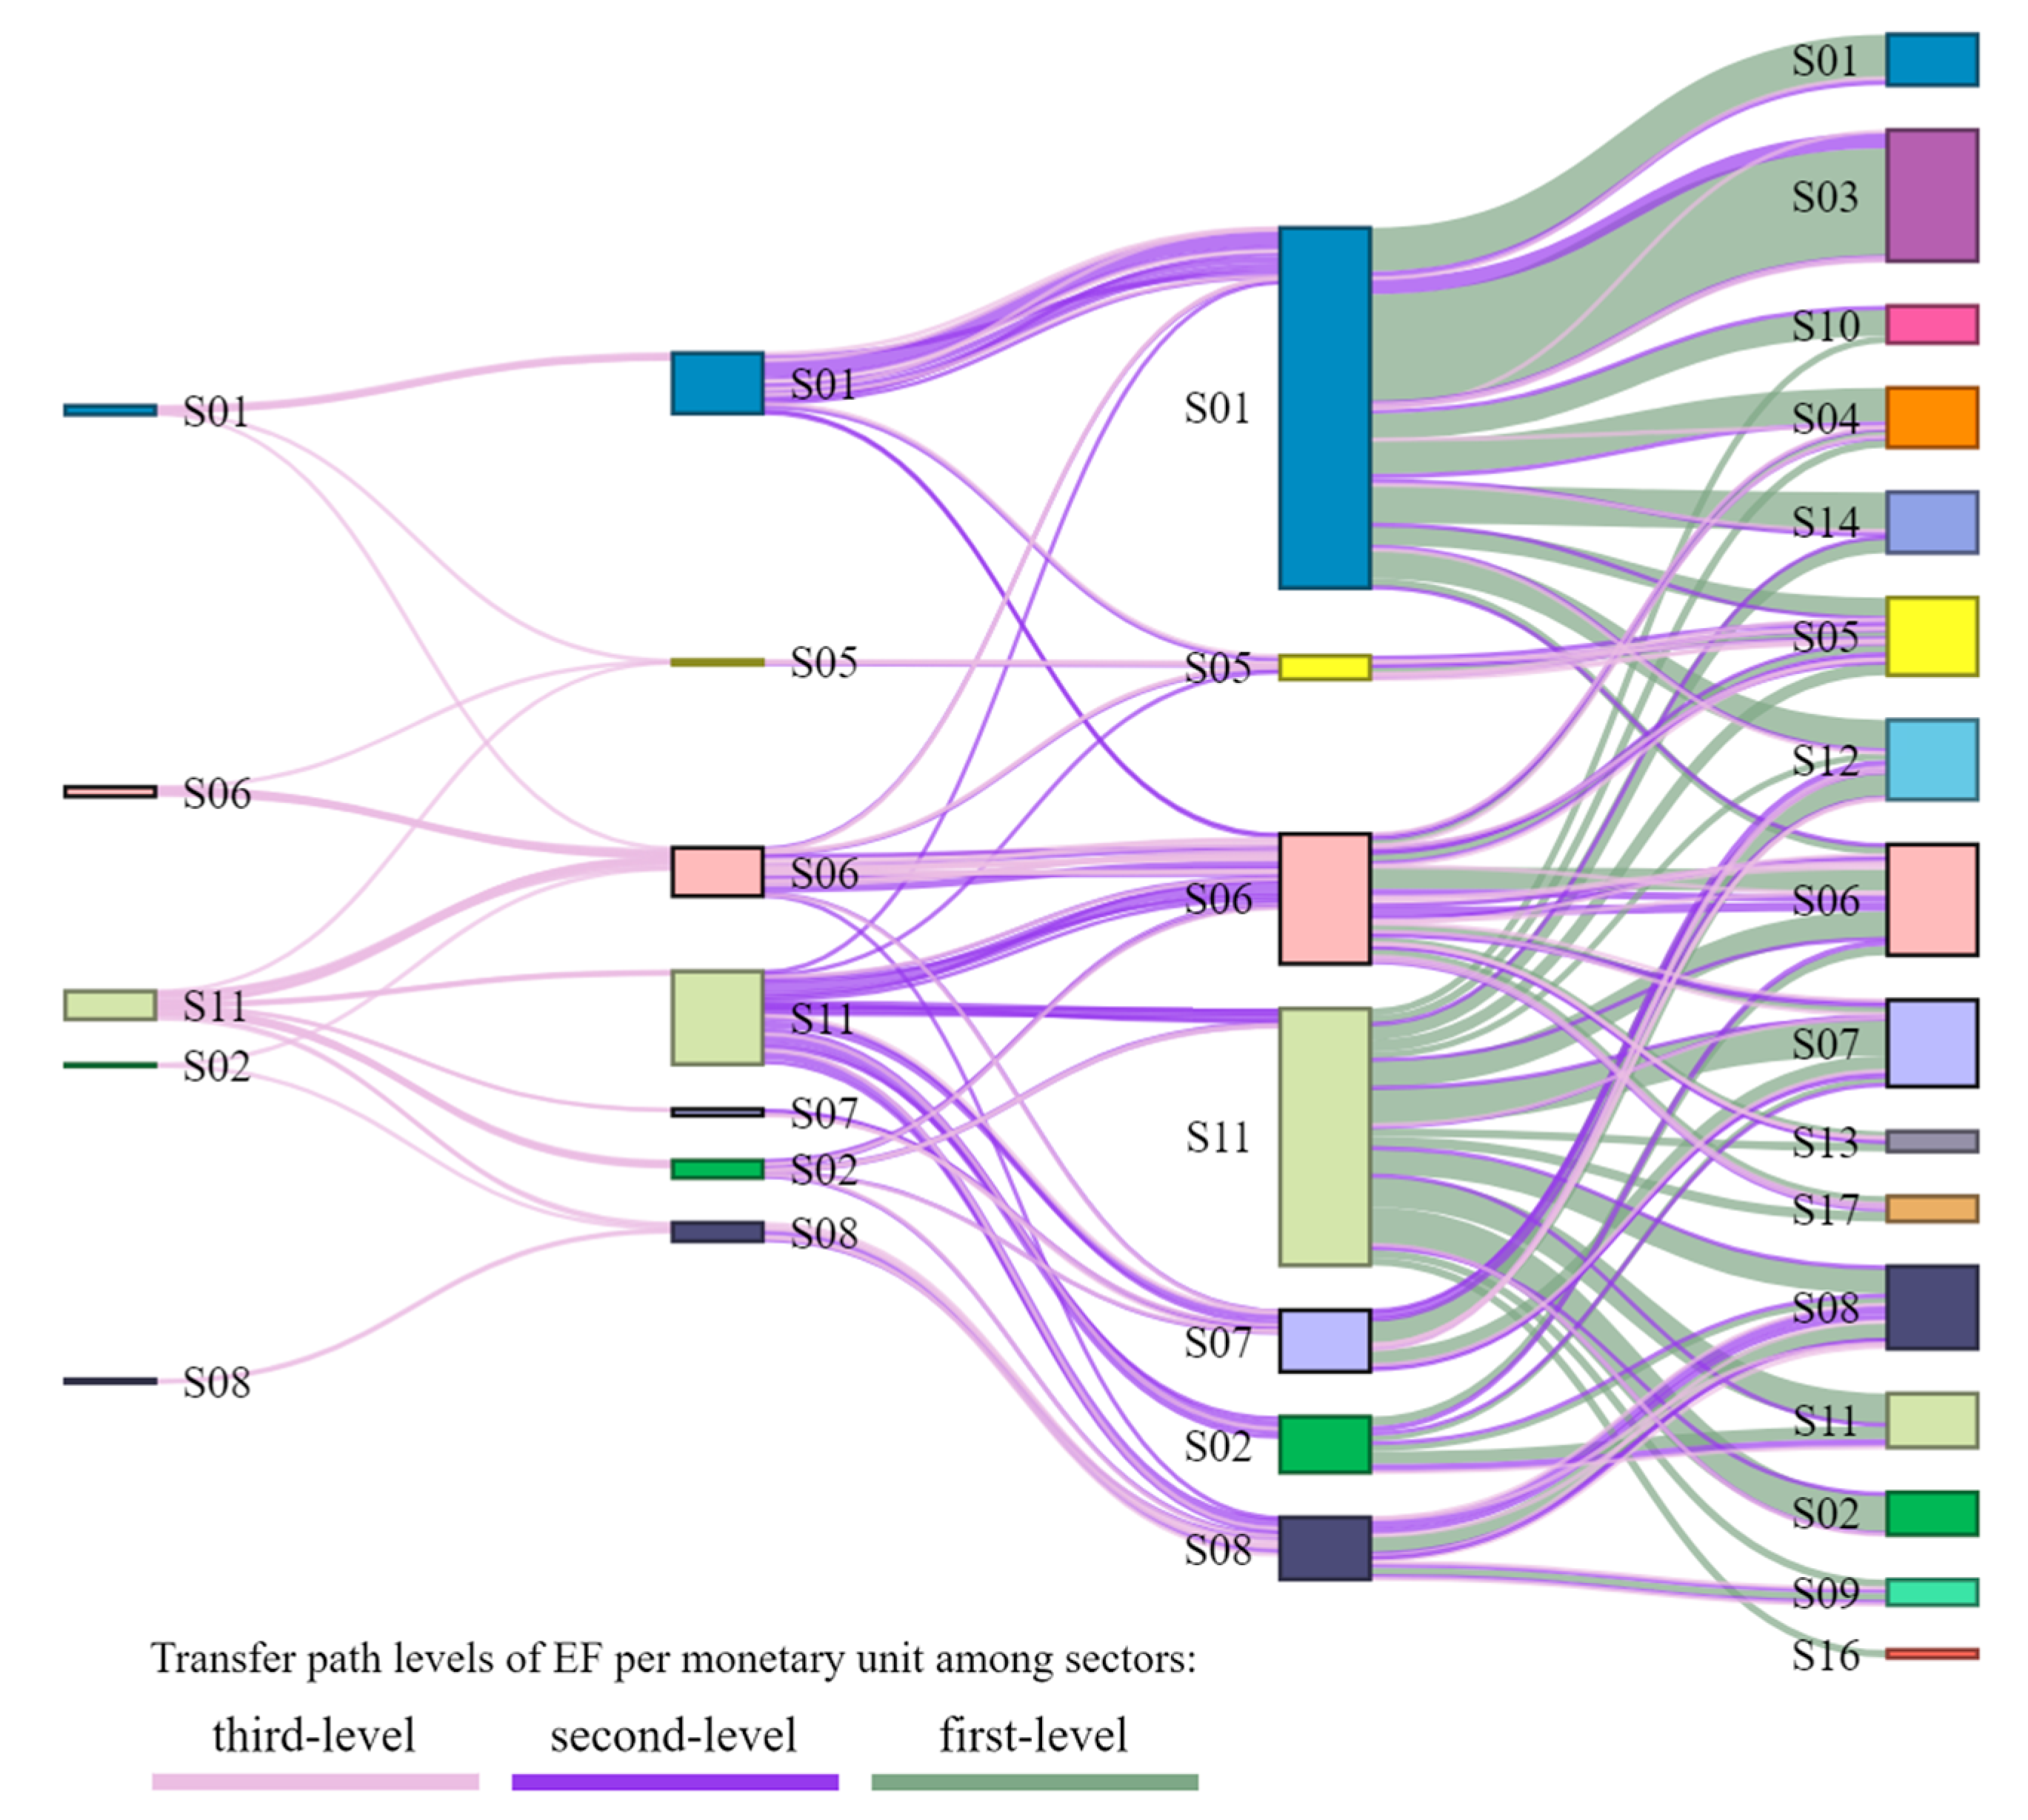
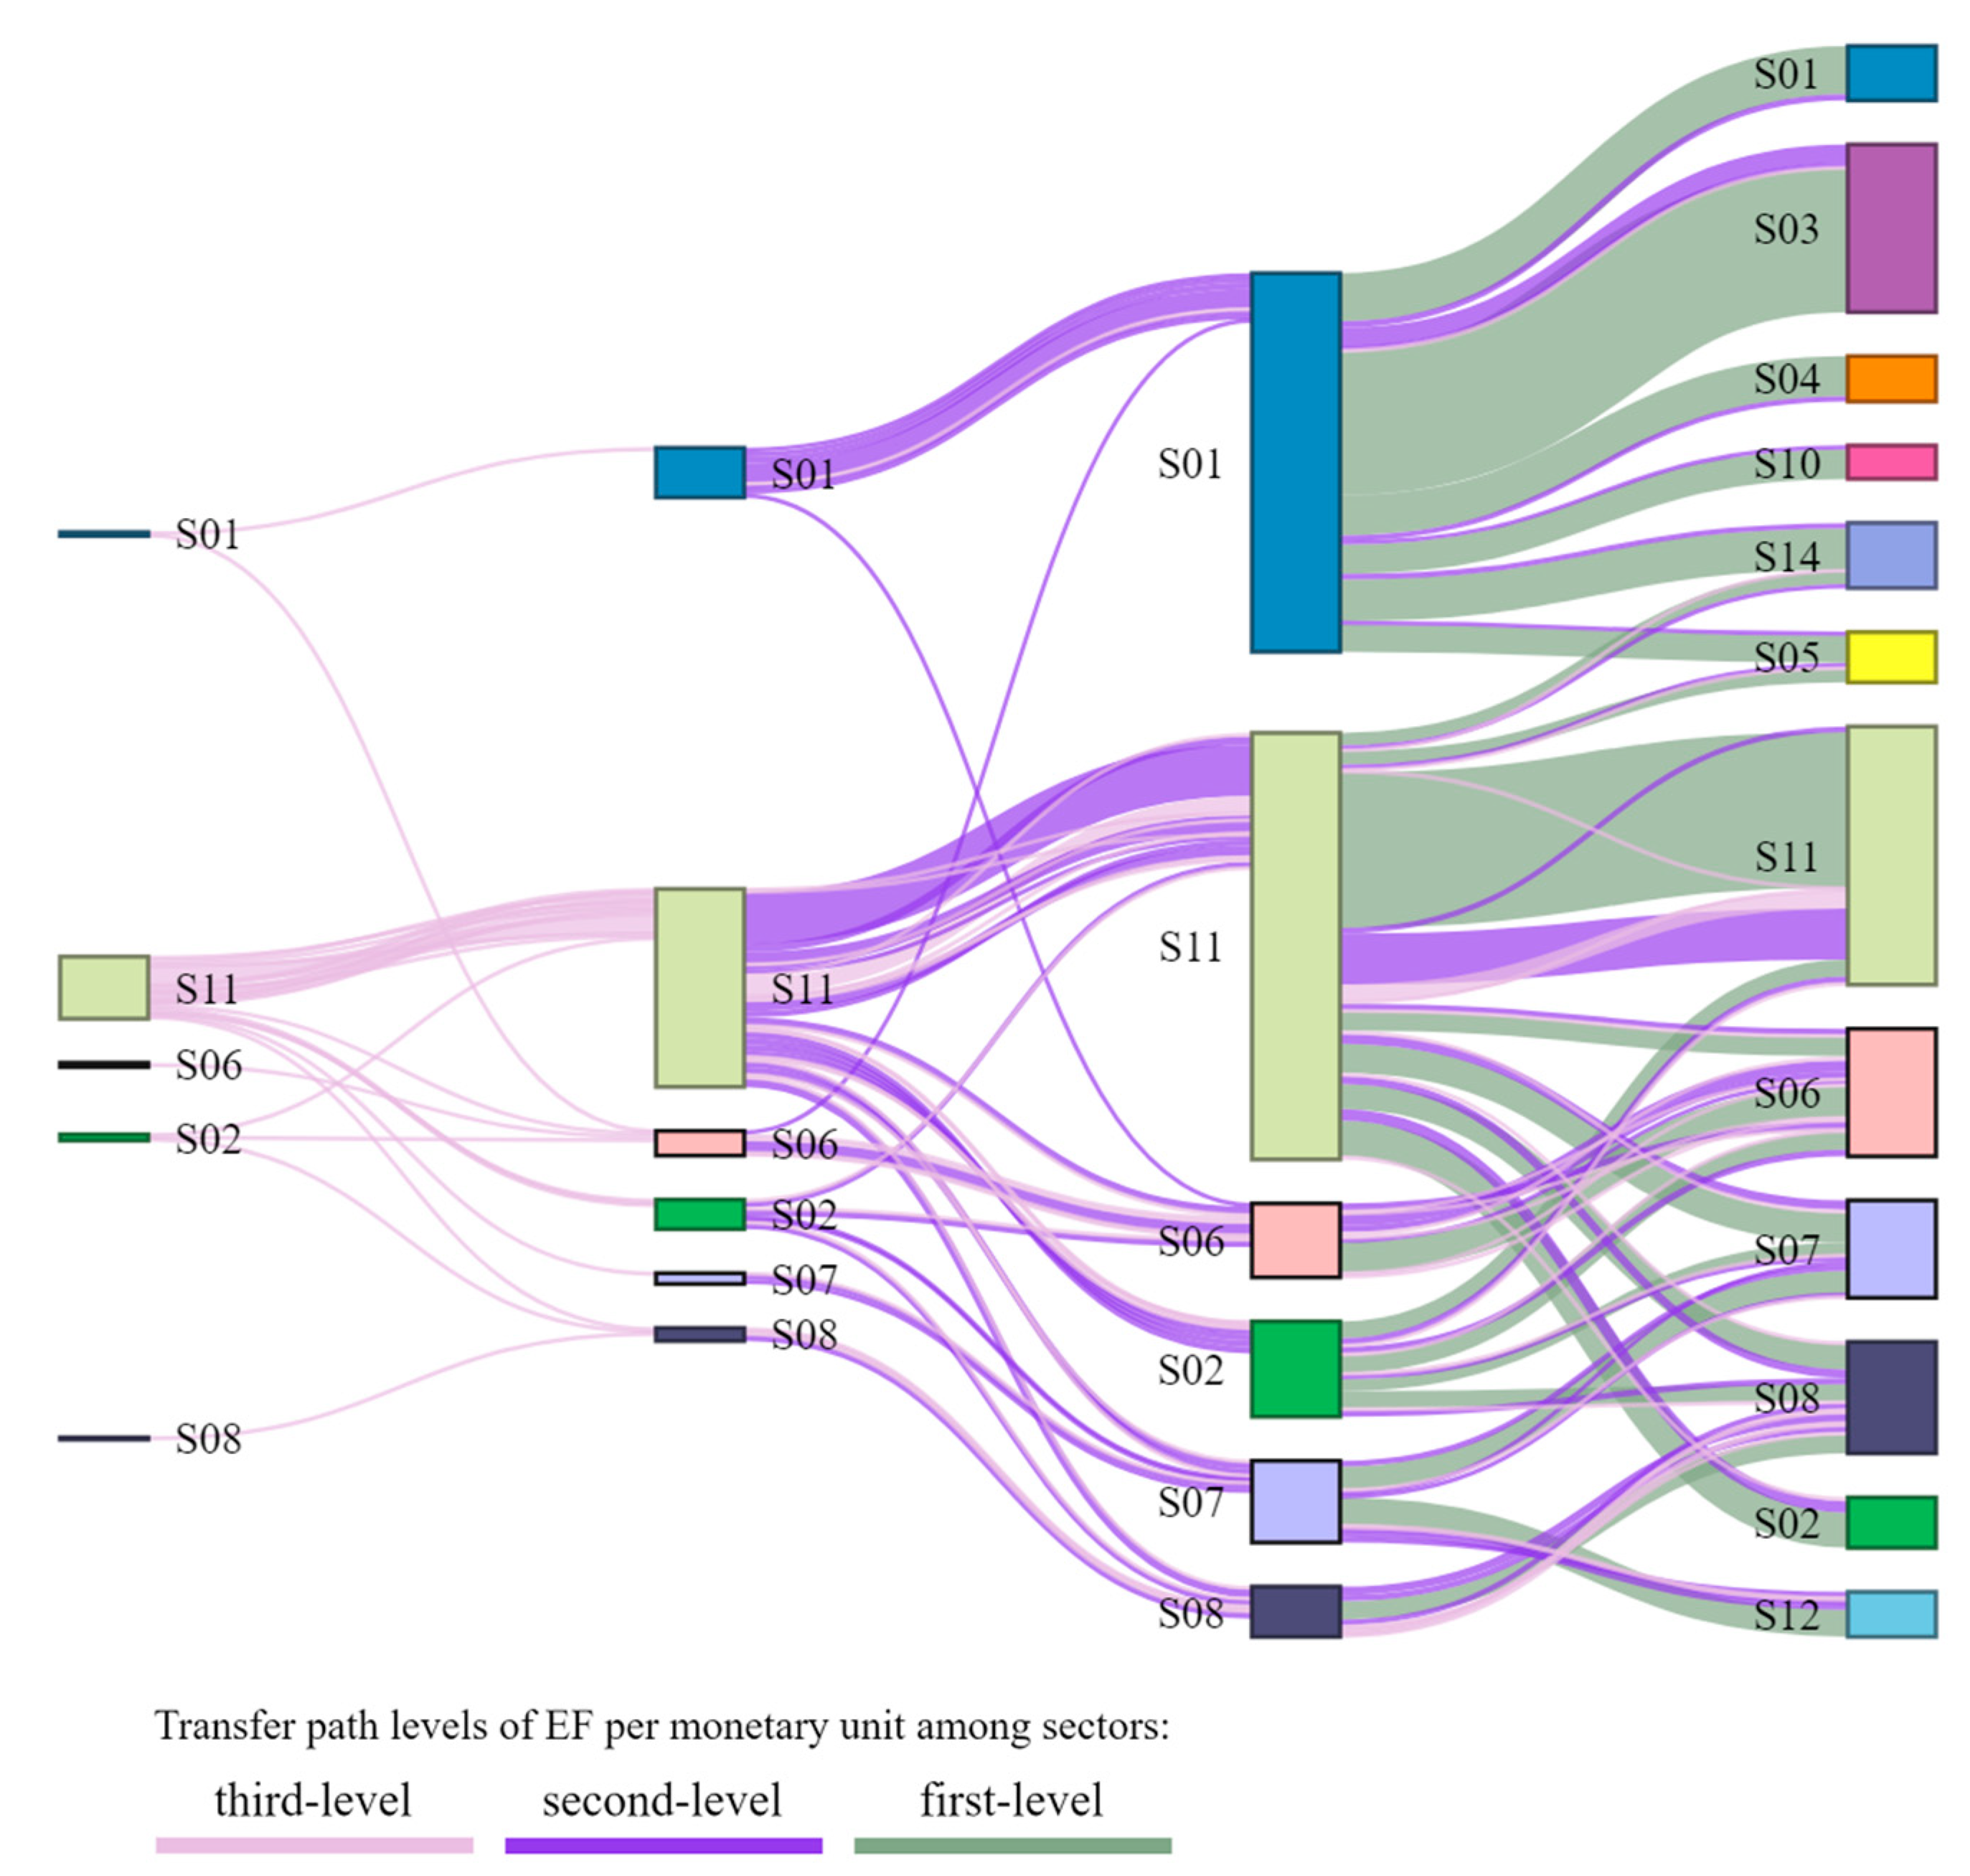
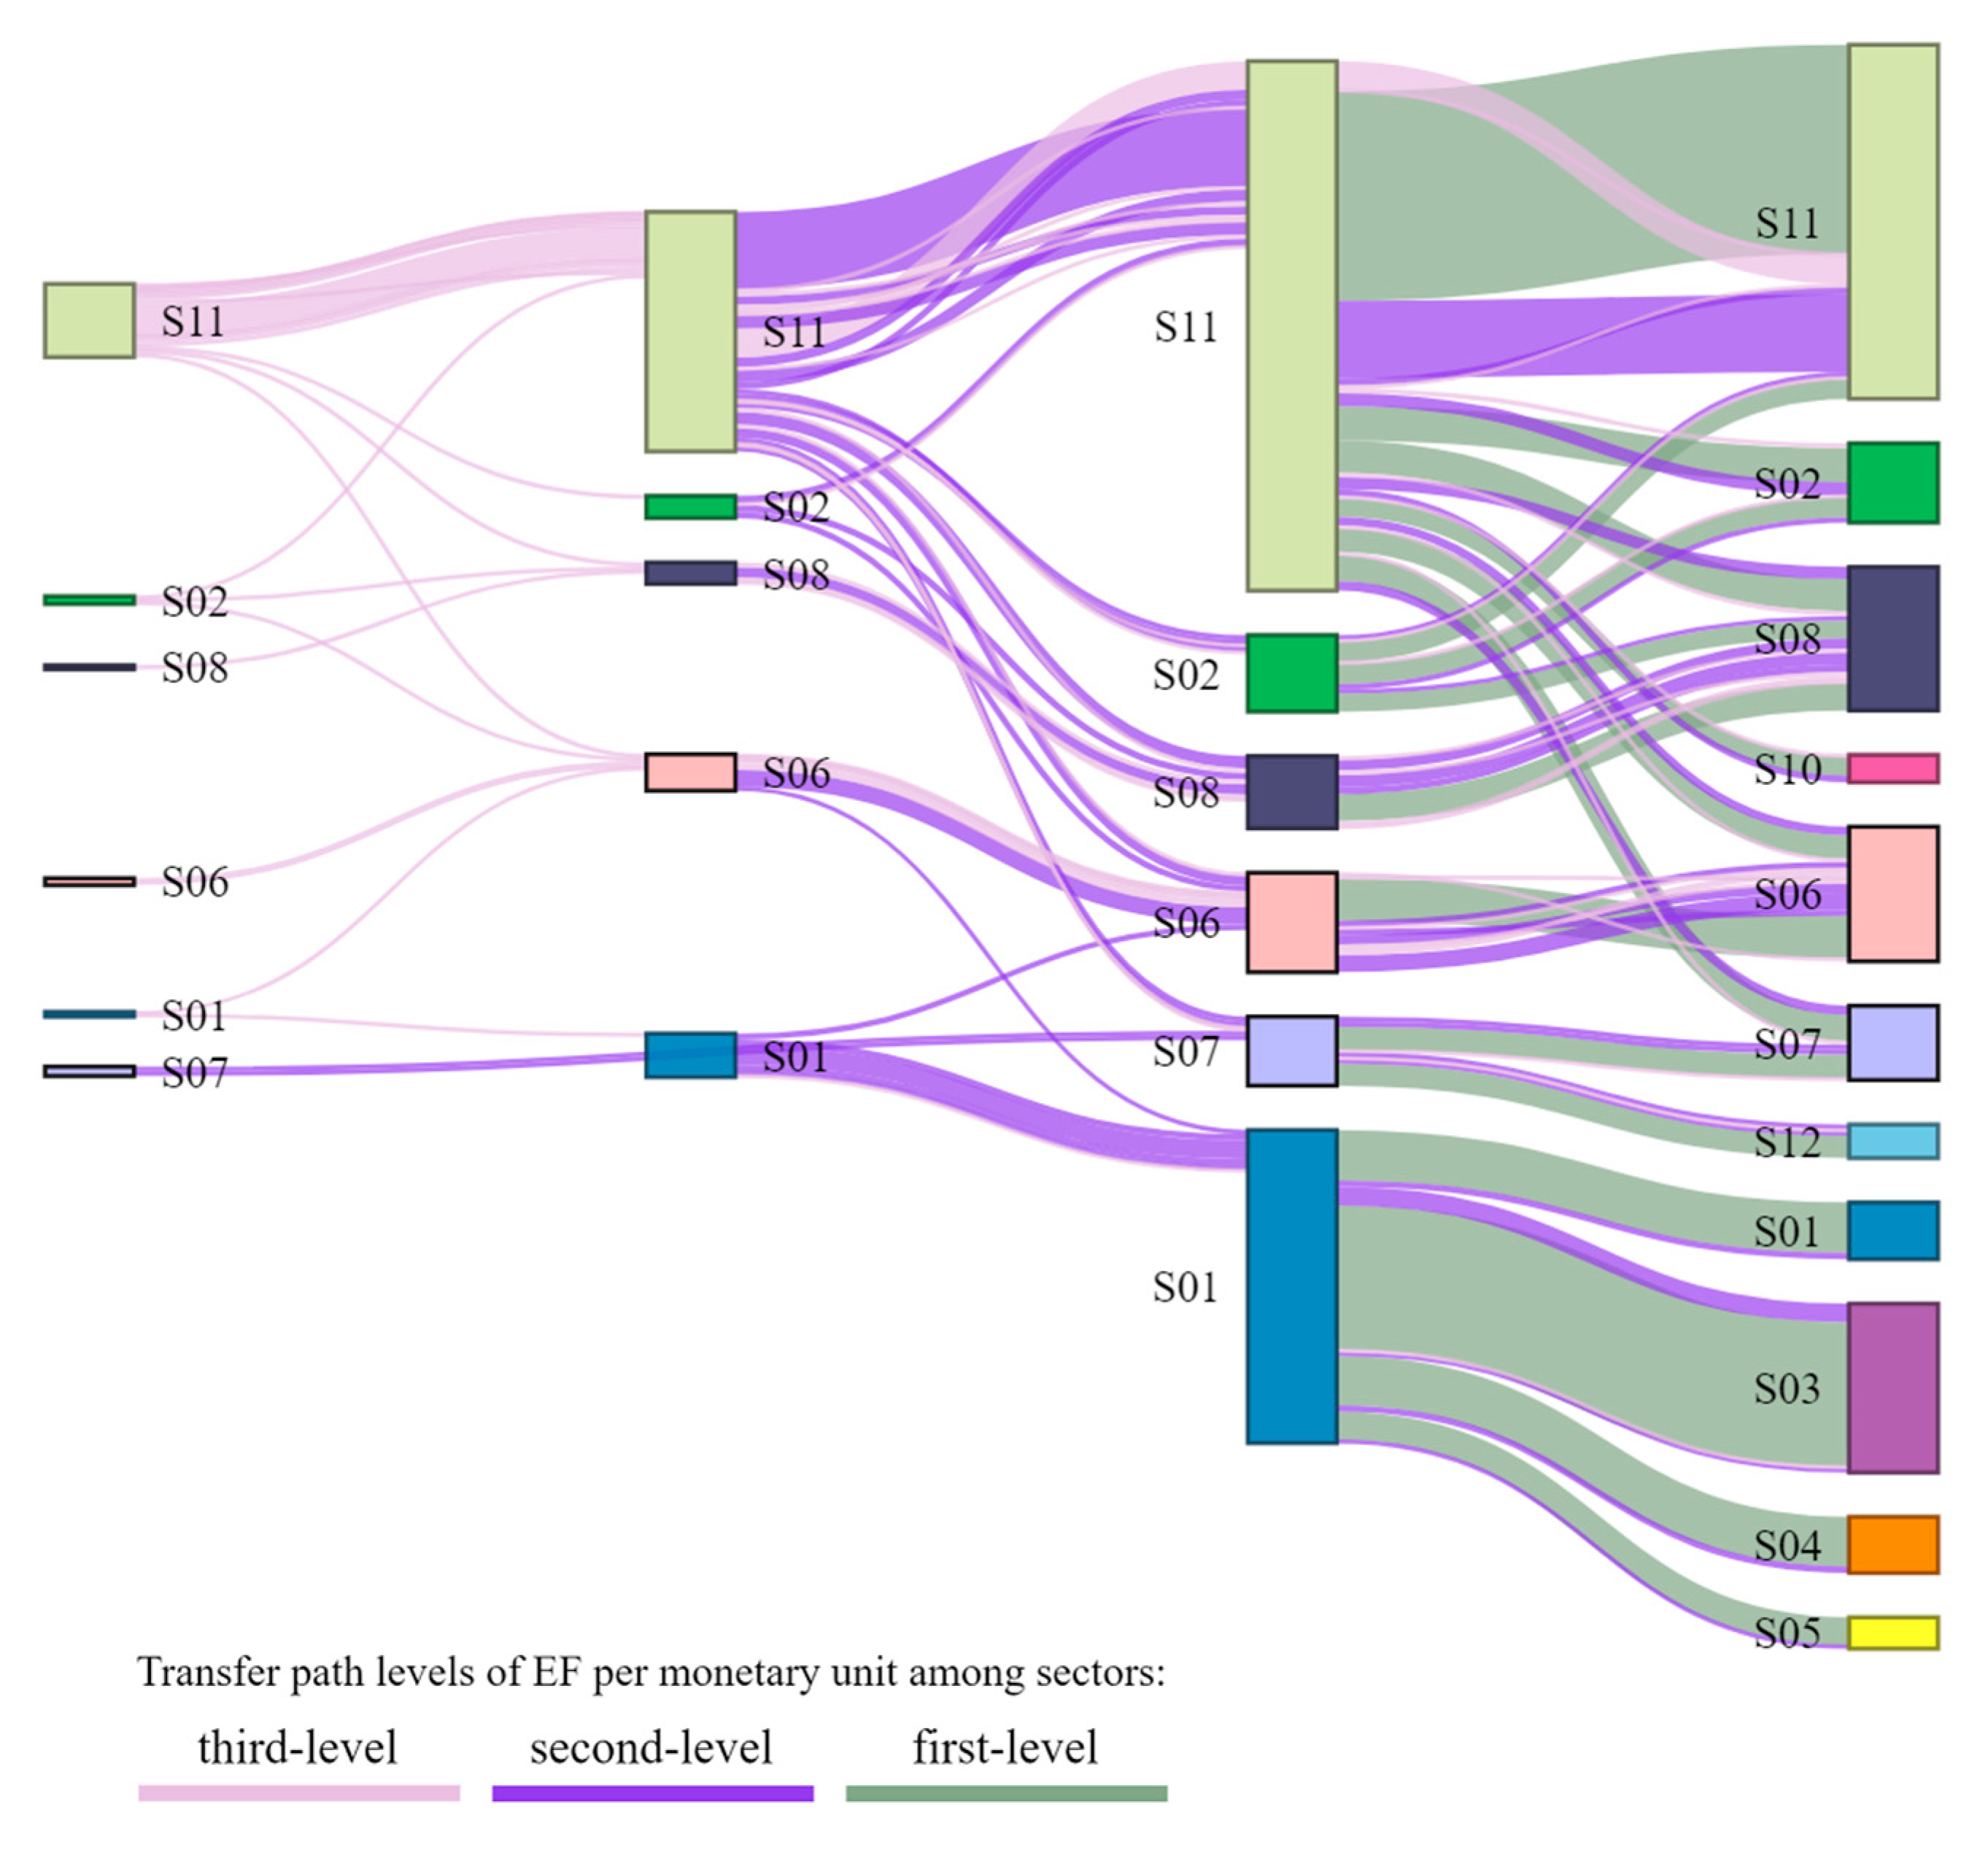
Considering the capacity and importance of data display and the location of essential points closer to the terminal, the following decomposes and displays the embodied EF transfer paths among 4-layer sectors. The key EF transfer paths per monetary unit of 2005, 2010, and 2015 are demonstrated in Figure 6, Figure 7 and Figure 8, respectively. The stream width indicates the size of the EFPI component transfer. The multilayer transfer decomposition is large, and this paper selects 0.05, 0.01, and 0.005 as the minimum thresholds for each transfer level. The different levels of the transfer path are marked in different colors. The transfer direction of all Sankey diagrams is left to right. The rightmost nodes represent the ending sectors of the embodied EFPI component from the left sectors. The transfer paths between the second and first layers, called the first-level transfer path, are shown in gray-green. Transfer paths from the third layer to the second and then to the first layer, called the second-level transfer path, are in purple. Transfer paths from the fourth layer to the third layer to the second layer and then to the first layer, referred to as the third-level transfer path, are in pink.
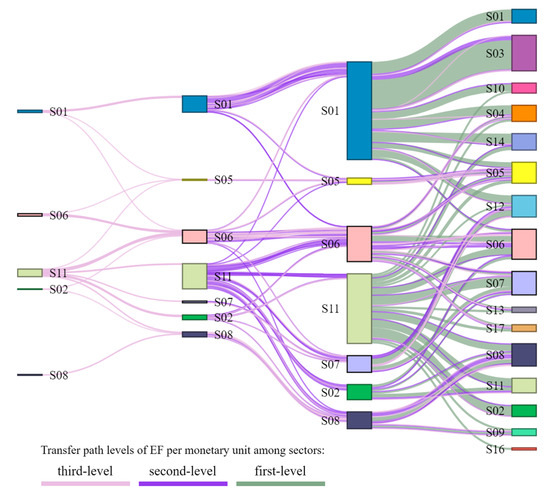
Figure 6.
The key transfer paths of China’s EF per monetary unit among sectors in 2005.
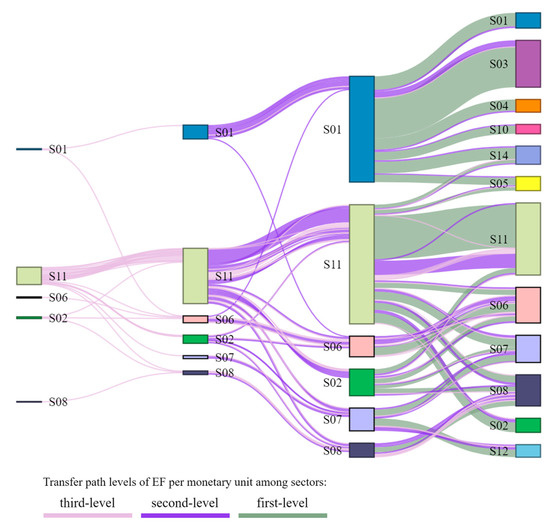
Figure 7.
The key transfer path of China’s EF per monetary unit among sectors in 2010.
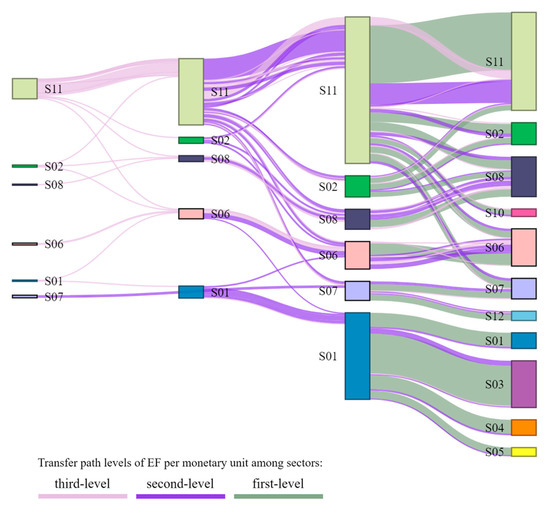
Figure 8.
The key transfer path of China’s EF per monetary unit among sectors in 2015.
In 2005, there were 37 first-level transfer paths with an EFPI flow value greater than 0.05. The largest was S1→S3 (0.959). The other transfers were primarily from S1 and S11: S1→S1 (0.387), S1→S14 (0.34), S11→S2 (0.332), S11→S7 (0.323), S1→S4 (0.3), S11→S11 (0.269), S1→S12 (0.252), S11→S6 (0.235), S1→S10 (0.232), and S11→S8 (0.226). The next most important transfer was S7→S12 (0.212). In addition, it can be seen that during this period, although S1 and S11 were the largest outputs, their input is indeed small (obvious imbalance); in contrast, S5, S7, and S8 had the characteristics with higher input than output.
There were 54 second-level transfer paths in 2005, the majority (37 in total) of which included the self-transfer of two or single sectors, e.g., S1→S1→S3 (0.141), S11→S8→S8 (0.084), S11→S6→S6 (0.084), S6→S6→S6 (0.07), S1→S1→S1 (0.057), S8→S8→S8 (0.055), S1→S1→S4 (0.05), and S11→S2→S11 (0.07). Another higher-value area was the transfer among different sectors (17 in total), e.g., S11→S7→S12 (0.066), S11→S2→S6 (0.052), and S11→S8→S9 (0.039). It’s shown that the high values mainly were of a certain self-transfer. And this is because the same industry has closer production relationships, and the following research also has similar characteristics.
For the third-level transfer paths in 2005, paths with four layers of different sectors included S11→S6→S1→S3(0.007), S11→S2→S6→S5 (0.007), S11→S2→S7→S12 (0.006), and S11→S6→S7→S12 (0.005). Of the 20 transfers with three self-transfers containing the same sectors, the main ones were S11→S8→S8→S8 (0.032), S11→S6→S6→S6 (0.03), S1→S1→S1→S3 (0.021), S1→S5→S5→S5 (0.013), and S2→S6→S6→S6 (0.011). Some had two self-transfers (18 in total) in the same sectors, such as S11→S2→S6→S6 (0.018), S11→S8→S8→S9 (0.015), S11→S2→S8→S8 (0.013), and S11→S6→S6→S5 (0.011). There were three transfers entirely within the same sector: S6→S6→S6→S6 (0.025), S8→S8→S8→S8 (0.02), and S1→S1→S1→S1 (0.008). This layer in this period showed a characteristic that the larger values all indicated a certain degree of self-transfer, and the main end sectors were concentrated in S5, S6, S7, and S8. Moreover, S6 and S8 served as the most median layers, reflecting the close relationship between the two sectors and other sectors.
In 2010, the situation changed slightly, with 21 transfer paths with a first-level transfer path value greater than 0.05. The largest values still involved the transfer from S1 and S11 to other sectors, including S11→S11 (0.682), S1→S3 (0.628), S1→S1 (0.211), S1→S14 (0.182), S1→S4 (0.175), S11→S2 (0.154), S11→S7 (0.129), S1→S10 (0.129), S1→S5 (0.119), and S11→S8 (0.11). The overall ratio and annual value decreased from 2005. Furthermore, high-value transfer paths also included S6→S6 (0.132), S7→S7 (0.1), and S7→S12 (0.118). It’s found that although S1 and S11 were the main output, the difference between them mainly was that S1 was only a supply-side accounted for a relatively high proportion, and S11 occupies a high proportion on both supply and demand sides
In 2010, there were 32 transfer paths with second-level transfer paths greater than 0.01. Compared with 2005, the proportion of top-ranked transfers originating from S11 increased. Meanwhile, the value proportion of EFPI transfer ended with S11 also increased, and S6, S7, and S8 served most of the transfer link ends. The transfer path involving the same industry in one self-transfer and then moving to other sectors became more obvious, such as S11→S11→S1 (0.224), S1→S1→S3 (0.084), S11→S11→S2 (0.051), S6→S6→S6 (0.05), S11→S11→S7 (0.042), and S11→S11→S8 (0.036). Transfer paths with different sectors in all three layers included S11→S2→S6 (0.03), S11→S7→S12 (0.029), and S11→S2→S8 (0.028). Those with exclusively self-transfers included S11→S11→S11 (0.224), S6→S6→S6 (0.05), S1→S1→S1 (0.028), S8→S8→S8 (0.027), and S7→S7→S7 (0.019).
There were 28 third-level transfer paths in 2010 with a value greater than 0.005, with the following characteristics. Self-transfer characteristics were more evident than those in 2005, and the proportion of S11 as the departure layer further increased. There was no transfer path in which the four layers involved unique sectors, indicating, to a certain extent, that the transfer intensity of the embodied EF per unit of currency between different sectors had decreased. There were 19 transfers between two sectors, with the top paths as follows: S11→S11→S11→S2 (0.017), S11→S11→S11→S7 (0.014), S11→S8→S8→S8 (0.012), S11→S11→S8→S8 (0.012), S11→S11→S11→S8 (0.012), S11→S6→S6→S6 (0.012), S1→S1→S1→S3 (0.011).
In 2015, there were 17 first-level transfer paths with values greater than 0.05. Overall values were lower than those in 2010. S1 and S11 were the primary transfer paths of output sectors, including S11→S11 (0.606), S11→S2 (0.1), S11→S8 (0.094), S11→S6 (0.068), S1→S3 (0.417), S1→S1 (0.146), S1→S4 (0.144), S1→S5 (0.08), and S11→S7 (0.075). In addition to S6→S6 (0.122), S7→S7 (0.068), and S7→S12 (0.064), S2 and S8 began to be highlighted as output layers: S2→S2 (0.059), S2→S11 (0.058), S2→S8 (0.052), and S8→S8 (0.079). It was shown that the transfer paths at this level were more concentrated among sectors compared to 2005 and 2010.
There were 26 second-level transfer path values greater than 0.01 in 2015: 5 self-transfers in the same industry, S11→S11→S11 (0.225), S6→S6→S6 (0.049), S8→S8→S8 (0.03), S1→S1→S1 (0.019), and S7→S7→S7 (0.014); 3 self-transfers among different industries, S11→S7→S12 (0.015), S11→S2→S8 (0.013), and S6→S1→S3 (0.011); and 18 self-transmissions between two industries, including S1→S1→S3 (0.054), S11→S11→S2 (0.037), S11→S8→S8 (0.035), S11→S11→S8 (0.035), S11→S11→S7 (0.028), and S11→S6→S6 (0.027). The end sectors were primarily S6, S7, S8, and S11. It was found that S11, as the starting end, plays more and more proportion of EFPI transfer values, and the primary public supply of electricity, heat, gas, and water from S11 indeed related to all sectors more and more.
There were 22 third-level transfer paths with values greater than 0.005 in 2015, showing a further reduction from 2010. These included primarily self-circulating transfer paths, including S11→S11→S11→S11 (0.083), S6→S6→S6→S6 (0.02), and S8→S8→S8→S8 (0.011). Only one cycle occurred within three different sectors, S11→S11→S7→S12 (0.005), while there was no transfer path with sectors of its four layers all different. There were 18 self-transfer paths involving two different sectors, including S11→S11→S11→S2 (0.014), S11→S8→S8→S8 (0.013), S11→S11→S11→S8 (0.013), S11→S11→S8→S8 (0.013), and S11→S6→S6→S6 (0.011). All of the above showed more significant characteristics of self-circulation transfer than those in 2010. The main end sectors were S6, S8 and S11. The characteristics further indicated the close EFPI relationship in the same sectors in this period and highlighted the importance of S11 in this transfer level.
As evidenced by the changes in 2005, 2010, and 2015, the number of transfer paths at all levels decreased over time when taking the set threshold as the standard calculation. This result shows that the transfer embodied in the EFPI component generally reduced year by year, and ecological efficiency gradually improved. The end sectors also gradually decreased, from 16 in 2005 to 12 in 2010 and to 11 in 2015. There were also certain changes in the main input and output sectors. The input end of the first-level transfer showed little change; S1, S2, S6, S7, S8, and S11 were dominant in all three years, and S5 had a small EFPI flow occurring exclusively in 2005. Since the self-circulation EFPI flow accounts for a relatively high proportion, the sectors of the second and third layers were essentially the same as those of the fourth layer in each year, except that there was no S5 in the fourth layer in 2005. The embodied EFPI flows involved primarily self-circulation between S1, S2, S6, S7, S8, S11, and other sectors.
4. Discussion
4.1. GFN EF and IOA Accounting EF
Discussion on the comparison between methods of EF accounting with IO and standard GFN accounting in most studies [44]. GFN’s per capita EF, with the unit of gha/capita, indicates a person’s average overall consumption of a year converted into the global average land area required in terms of land productivity in a year, i.e., global hector (gha).
The research in this paper highlights that the analysis is carried out under the unit framework of ecological footprint gha, and more attention is paid to the research on the EF relationship between various departments in the production links, which reflects the embodied EF consumed and occupied by each intermediate link in each unit of monetary goods produced,
GFN studies the evaluation of global, national, or regional sustainable development from the macro perspective, while this study focuses more on the tracking and positioning of the embodied ecological footprint of monetary unit output value in the industrial production process, thus, serving to improve the efficiency of ecological utilization of output value from the production link, and further helps to enhance the level of sustainable development at the macro level.
4.2. EF, Production, and Consumption
The theory of EF on production and consumption could be original from the basic ecological footprint theory [5] and embodied pollution with IOA. The ecological footprint itself can be used as the footprint theory to track the process of converting personal consumption into global hectares. The products and contents of consumption involve the production process related to six types of land products. Therefore, EF research involves both consumptions based and production-based issues. Production and consumption have a significant impact on the evolution of EF. Consumption will directly affect the ecological footprint, such as the choice of green energy (the consumption of recyclable energy will help reduce the size of the national ecological footprint [52] and help the relationship between decoupling GDP and EF [53]), consumer behavior would affect regional EF [42] and the impact of public transportation on the ecological footprint [54]. At the same time, the consumption driving force will further promote the EF. The produced product determines the ecological footprint contained in the unit product. From the perspective of production, it can be seen that most direct EF comes from direct production, while the proportion of EF directly generated by personal consumption is low [32].
As analyzed in the introduction, IOA is great at tracking embodied pollution. Compared with other research on China’s EF with IOA, there were many differences, e.g., Zhou and Imura [42] analyzed China’s EF with MRIO. And their results focused on the EF accounting values by EF land types and the influencing effect from consumer behavior, i.e., from the EF land types too. However, this paper argues that consumption behavior could be broadened with a new ecological significance from the perspective of economic sectors. What’s more, the detailed ecological significance of EF flows among regions and industries could be better reflected through MRIO by analyzing economic sectors. Compared with the study of Wu and Liu [32], the EF flows shifted from regions to sectors, and the EFPI could better reflect the flow changes in the production environment than EFI. From most of the research results analysis about EF with IOA, most of the research focused on the final EF analysis [40]. However, the information IOA and embodied EF would be hidden this way. This paper focused on TPCC and the direct transfer network paths of DPC to deeply analyze the EF from production.
4.3. Three Aspects of Embodied EF
The following three aspects of discussion and results have their unique significance. The subsections of Section 3 presented the content of embodied EF from different perspectives. Section 3.1 presented the embodied EFPI component for any two sectors in China’s 17 economic sectors, including a sector’s embodied EFPI component directly from other sectors, which is indirectly embodied by other sectors and then passed to the sector itself, and, of course, also includes the EFPI component that occurs directly by itself and then returns to its own embodied EF through indirect transfers. In contrast, other studies have primarily accounted for the consumer-side EF of the end-use sector production. Section 3.2 provided a numerical reference for ecological compensation in the interindustry production process by specifying the net value (positive and negative offset), while Section 3.3 focused on analyzing the multilayer transfer path relationship among sectors and providing a more specific interpretation embodied in the EFPI component multilayer recursive transfer process. The above analysis from the unit currency volume is helpful in finding problems and countermeasures in providing production ecological efficiency. The above issues can also be calculated and analyzed from the perspective of total EF. For the convenience of analysis, however, this paper did not show the relationships among the 39 sectors in detail, as these represent a more complex relationship, but the analytical framework is the same as the model.
5. Conclusions and Policy Implications
5.1. Conclusions
This paper reveals the EFPI flow relationships, ecological occupation transfer relationships, and ecological responsibility relationships of China’s industrial sectors. This study focuses on the decomposition of embodied EFPI and its transfer flows. The embodied EFPI components in China in 2005, 2010, and 2015 were accounted for and analyzed to highlight pollution economic sectors and to offer suggestions for ecological compensation among sectors. The main conclusions of this study are as follows:
- (1)
- Decomposition of the TPC and DPC with IOA could be used to track the embodied EF flows and transfer path. The decomposition model and procedures of the IOA may also be applied to track other types of environmental pollution, e.g., water footprint, carbon emissions, land use, and PM2.5.
- (2)
- China’s 2005, 2010, and 2015 TPCCs showed a downward trend overall due to the faster economic speed. The main embodied transfer flows of EFPI were S1→S12, S7→S15, and S7→S16. High TPCC values from the supply side involved S1, S2, S6, and S11. S12 varied greatly, illustrating the case of a larger EFPI input. The transfer links in the chord diagrams showed that the overall inflow-outflow structures of net embodied TPCC remained almost unchanged, with main export sectors being S1, S11; main import sectors, S3–S5, S9, S10, S12, and S14–S17; and sectors with partial imports and exports of net embodied EFPI being S2, S6–S8, and S13.
- (3)
- The transfer EFPIs of critical transfer paths showed a downward trend in the study years. There was a large number of self-transferred EFPIs, and their value was relatively high, concentrated in sectors S6, S8, S11, and S1. The receiving end sectors became increasingly concentrated, while the input sectors experienced little change. These critical transfer paths highlighted the EF key governance and ecological compensation path.
- (4)
- Based on the result analysis and discussion, policy implications, including reducing the EFPI on both the supply and demand sides, optimizing ecological tax, and implementing ecological compensation among economic sectors, were ultimately recommended.
5.2. Policy Implications
To achieve the ecological and economic aim of “low energy consumption, low pollution, high output,” reducing the EF per unit of production is an effective means to reduce the total EF. The sectors with high embodied EFPI (equivalent to TPC) should be controlled preferentially. The above analysis shows that each sector is both an exporter and importer of embodied EF in production activities. Thus, solutions for constraining embodied EFPI could begin with both the EF exporters (supply side) and EF importers (demand side).
On the supply side, the following policies could be implemented: (1) optimizing carbon tax [55] and land use tax, in addition to the EF tax, which could be considerable and should consider the embodied carbon footprint in tax collection; and (2) optimizing production capacity, such as the supply-side structural reforms in China in recent years to optimize overcapacity in parts of highly polluting industries (e.g., coal, iron, and steel sectors) [56].
On the demand side, ecological compensation should be provided among sectors for their ecological responsibility. The EF consumer should pay a corresponding tax (ecological consumption tax) for ecological governance. As shown in Table A3, S1, S2, S6, S11, and S13 (mainly public primary input industries, including Agriculture, Mining, Refining, Electricity, transportation, etc.) were the main net exporters of EF transfers in the study year. At the same time, S3–5, S7–10, S12, and S14–17 are the main consumers of net embodied EF who need to be responsible for ecological responsibility. The latter sectors need to bear some ecological consumption tax, and the proportion of unit production can be carried out according to the corresponding ratios. The former sectors can receive appropriate compensation and cooperate with the public sections for ecological restoration. Therefore, positive values in the brackets in Table A3 mean the net embodied EF inflow, which also could be used to represent the specific proportion of responsibilities. It can be seen that the proportion of S3, S4, S5, S9, and S10 is relatively large, and the change was not significantly different in the study years. Ecological restoration is mainly concentrated in S1 and S11. The use of tax does not transfer to these areas but through multi-party cooperation to carry out the specific ecological restoration.
In addition to the 17 sector classifications, more relationships could be detailed with 39 sector classifications or more. For example, the relationship with the main sector S11 would be more detailed with the inclusion of its subsectors: production and supply of electricity (SS22), heat gas production and supply (SS23), and water production and supply (SS24). Industry compensation is also locally specific; for example, excise tax or special expenses on highly polluting products (interindustry) have been recommended. The division of ecological responsibility is based on the flow of net EF in Section 3.2, and a 50%-50% division of EF ecological responsibility among producers and consumers could be considered [7] for net embodied EF flow. Based on the results of this study, flows with high TPCC should be considered, as highlighted in Section 3.1, especially paths originating from S1 and S11. Moreover, the key transfer path should be tracked, and low-EFPI intermediate products should be identified and used as substitutes.
5.3. Limitations of the Study
Limitations are as follows: (1) The impact of foreign EF on the transfer paths of domestic EF was not considered. (2) A decomposition study of the transfer pathway drivers, such as SDA, could be used to study these drivers further. (3) Discussing the flows, net flows, and key transfers of total EF with a similar analytical framework is also significant. Due to the analogs and similarities leading to analytical redundancy, the total EF analysis results were not given in this paper.
Author Contributions
Conceptualization, D.W.; methodology, D.W.; validation, D.W., G.W., and H.Y.; data curation, D.W.; writing—original draft preparation: D.W.; writing—review and editing, D.W., H.Y., and G.W.; All authors have read and agreed to the published version of the manuscript.
Funding
This research was funded by the National Social Science Foundation of China, grant number 21CGL060, and Philosophy and Social Science Research Project in Jiangsu Province, Grant Number 2020SJA1028.
Data Availability Statement
Not applicable.
Conflicts of Interest
The authors declare no conflict of interest.
Appendix A

Table A1.
39 Economic sectors and 17 sectors of China for this study.
Table A1.
39 Economic sectors and 17 sectors of China for this study.
| Sector ID | Sector Name | Sub Sector ID of | Sector Name |
|---|---|---|---|
| S1 | Agriculture | SS1 | Agriculture, forestry, animal husbandry, and fishery |
| S2 | Mining products | SS2 | Mining and washing of coal |
| SS3 | Extraction of petroleum and natural Gas | ||
| SS4 | Mining and processing of metal ores | ||
| SS5 | Mining and processing of nonmetal and other ores | ||
| S3 | Food and tobacco | SS6 | Foods and tobacco |
| S4 | Textiles, clothing, shoes, and leather-down products | SS7 | Textile |
| SS8 | Textile and apparel shoes and hats leather down and its products | ||
| S5 | Woodworking, furniture, paper, and crafts supplies | SS9 | Wood products and furniture |
| SS10 | Papermaking, printing, cultural, educational, and sporting goods | ||
| S6 | Refining, coking, and chemical products | SS11 | Petroleum, coking products, and nuclear fuel processed products |
| SS12 | chemical product | ||
| S7 | Non-metallic mineral products | SS13 | Non-metallic mineral products |
| S8 | Metal industries | SS14 | Metal smelting and rolling products |
| SS15 | made from metal | ||
| S9 | Equipment of Machinery, transportation, and electronics | SS16 | General equipment Special equipment |
| SS17 | Transportation equipment | ||
| SS18 | Electrical machinery and equipment | ||
| SS19 | Communication equipment, computers, and other electronic equipment | ||
| SS20 | Instrumentation, | ||
| S10 | Other various manufacturing products | SS21 | Repair services for other manufactured products, scrap, metal products, machinery, and equipment |
| S11 | Electricity, heat, gas, and water | SS22 | Production and supply of electricity and heat |
| SS23 | Gas production and supply | ||
| SS24 | Water production and supply | ||
| S12 | Construction industry | SS25 | building |
| S13 | Wholesale, retail, transportation, warehousing, and post | SS26 | Wholesale and retail |
| SS27 | Transportation, storage, and post | ||
| SS28 | Accommodation and dining | ||
| S14 | Information industry | SS29 | Information transmission, software, and information technology services |
| S15 | Finance and real estate | SS30 | financial |
| SS31 | real estate | ||
| SS32 | Rental and business services | ||
| S16 | Scientific research and technical services | SS33 | Scientific research and technical services |
| S17 | Other public services | SS34 | Water conservancy, environment, and public facilities management |
| SS35 | Resident services, repairs, and other services | ||
| SS36 | education | ||
| SS37 | Health and social work | ||
| SS38 | Culture, sports, and entertainment | ||
| SS39 | Public management, social security, and social organization |

Table A2.
The top 30 net EFPI component transfers between different sectors in 2005, 2010, and 2015.
Table A2.
The top 30 net EFPI component transfers between different sectors in 2005, 2010, and 2015.
| 2005 | 2010 | 2015 | ||||||
|---|---|---|---|---|---|---|---|---|
| Input Sector | Output Sector | Value (gha) | Input Sector | Output Sector | Value (gha) | Input Sector | Output Sector | Value (gha) |
| S1 | S3 | 1.45 | S1 | S3 | 1.01 | S1 | S3 | 0.72 |
| S1 | S14 | 0.86 | S1 | S14 | 0.60 | S1 | S4 | 0.39 |
| S1 | S4 | 0.73 | S1 | S4 | 0.49 | S11 | S8 | 0.37 |
| S11 | S7 | 0.71 | S11 | S7 | 0.45 | S11 | S7 | 0.30 |
| S11 | S8 | 0.63 | S11 | S8 | 0.44 | S11 | S10 | 0.24 |
| S11 | S6 | 0.51 | S11 | S6 | 0.32 | S1 | S5 | 0.24 |
| S11 | S9 | 0.49 | S11 | S9 | 0.32 | S11 | S12 | 0.22 |
| S11 | S12 | 0.46 | S1 | S5 | 0.31 | S11 | S6 | 0.22 |
| S11 | S5 | 0.45 | S11 | S5 | 0.31 | S11 | S9 | 0.20 |
| S1 | S10 | 0.43 | S11 | S12 | 0.29 | S11 | S5 | 0.19 |
| S1 | S5 | 0.42 | S1 | S10 | 0.27 | S11 | S2 | 0.16 |
| S11 | S2 | 0.42 | S11 | S2 | 0.23 | S1 | S10 | 0.15 |
| S1 | S12 | 0.42 | S11 | S4 | 0.23 | S6 | S10 | 0.13 |
| S11 | S4 | 0.36 | S11 | S10 | 0.19 | S11 | S4 | 0.13 |
| S11 | S16 | 0.34 | S11 | S14 | 0.18 | S6 | S5 | 0.13 |
| S11 | S17 | 0.32 | S11 | S16 | 0.17 | S6 | S7 | 0.12 |
| S11 | S14 | 0.32 | S11 | S17 | 0.17 | S11 | S16 | 0.12 |
| S11 | S10 | 0.31 | S7 | S12 | 0.16 | S2 | S7 | 0.10 |
| S7 | S12 | 0.27 | S6 | S5 | 0.16 | S2 | S8 | 0.10 |
| S6 | S5 | 0.24 | S11 | S3 | 0.16 | S6 | S12 | 0.10 |
| S11 | S3 | 0.24 | S2 | S8 | 0.14 | S1 | S6 | 0.10 |
| S11 | S13 | 0.22 | S6 | S4 | 0.14 | S6 | S4 | 0.10 |
| S11 | S15 | 0.22 | S2 | S7 | 0.13 | S6 | S9 | 0.10 |
| S6 | S4 | 0.21 | S6 | S7 | 0.13 | S8 | S9 | 0.09 |
| S6 | S9 | 0.20 | S11 | S13 | 0.13 | S1 | S13 | 0.09 |
| S8 | S9 | 0.20 | S6 | S9 | 0.13 | S7 | S12 | 0.09 |
| S1 | S16 | 0.19 | S8 | S9 | 0.13 | S11 | S17 | 0.09 |
| S6 | S7 | 0.19 | S6 | S12 | 0.11 | S1 | S12 | 0.09 |
| S1 | S17 | 0.18 | S6 | S17 | 0.11 | S6 | S16 | 0.09 |
| S6 | S17 | 0.18 | S1 | S16 | 0.11 | S1 | S7 | 0.09 |

Table A3.
List of related sectors on ecological consumption tax in 2005, 2010, and 2015.
Table A3.
List of related sectors on ecological consumption tax in 2005, 2010, and 2015.
| 2005 | 2010 | 2015 | |||
|---|---|---|---|---|---|
| Tax-Paying Sectors | Benefit Sectors | Tax-Paying Sectors | Benefit Sectors | Tax-Paying Sectors | Benefit Sectors |
| S3 (14.06%), S4 (10.99%), S5 (9.31%), S7 (5.36%), S8 (1.57%), S9 (8.84%), S10 (8.56%), S12 (12.37%), S14 (11.10%), S15 (4.18%), S16 (7.04%), S17 (6.62%) | S1 (−40.19%), S2 (−2.54%), S6 (−9.80%), S11 (−46.07%), S13 (−1.40%) | S3 (15.17%), S4 (11.33%), S5 (9.71%), S7 (6.91%), S8 (3.77%), S9 (8.59%), S10 (7.46%), S12(10.90%), S14(11.22%), S15 (3.28%), S16 (5.28%), S17 (6.38%) | S1 (−38.11%), S2 (−4.80%), S6 (−6.05%) S11 (−50.11%), S13 (−0.92%) | S3 (14.54%), S4 (11.03%), S5 (10.18%), S7 (6.96%), S8 (3.30%), S9 (9.10%), S10 (8.20%), S12 (10.57%), S14 (11.10%), S15 (3.55%), S16 (5.91%), S17 (5.58%) | S1 (−39.14%), S2 (−7.64%), S6 (−9.24%) S11 (−42.98%), S13 (−0.99%) |
The percentages in parentheses indicate the proportion of net embodied EF transfer per unit production, with positive as input and negative as output.
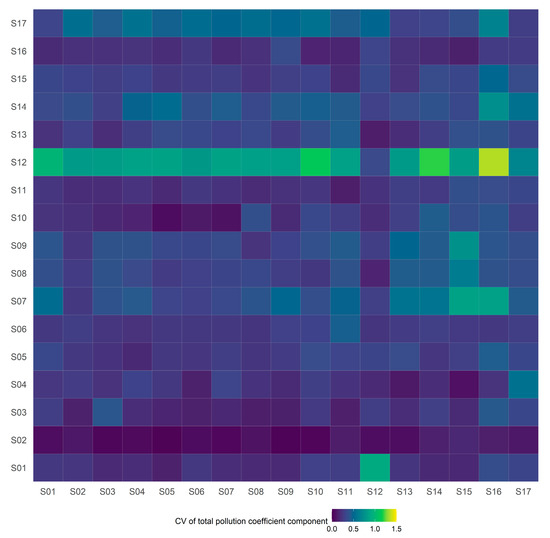
Figure A1.
The CV of China’s TPCC matrix of the EF in 2005, 2010, and 2015.
Figure A1.
The CV of China’s TPCC matrix of the EF in 2005, 2010, and 2015.
References
- Folke, C.; Biggs, R.; Norström, A.V.; Reyers, B.; Rockström, J. Social-Ecological Resilience and Biosphere-Based Sustainability Science. ES 2016, 21, art41. [Google Scholar] [CrossRef]
- Liu, C.; Li, W.; Xu, J.; Zhou, H.; Li, C.; Wang, W. Global Trends and Characteristics of Ecological Security Research in the Early 21st Century: A Literature Review and Bibliometric Analysis. Ecol. Indic. 2022, 137, 108734. [Google Scholar] [CrossRef]
- Chen, B.; Zhang, H.; Li, W.; Du, H.; Huang, H.; Wu, Y.; Liu, S. Research on Provincial Carbon Quota Allocation under the Background of Carbon Neutralization. Energy Rep. 2022, 8, 903–915. [Google Scholar] [CrossRef]
- Steffen, W.; Richardson, K.; Rockström, J.; Cornell, S.E.; Fetzer, I.; Bennett, E.M.; Biggs, R.; Carpenter, S.R.; de Vries, W.; de Wit, C.A.; et al. Planetary Boundaries: Guiding Human Development on a Changing Planet. Science 2015, 347, 1259855. [Google Scholar] [CrossRef]
- Wackernagel, M.; Hanscom, L.; Jayasinghe, P.; Lin, D.; Murthy, A.; Neill, E.; Raven, P. The Importance of Resource Security for Poverty Eradication. Nat. Sustain. 2021, 4, 731–738. [Google Scholar] [CrossRef]
- Lei, H.; Fang, L.; Qian, Z.; Xu, C.; Deng, M.; Liu, X. The Quantitative Analysis of Ecological Compensation Responsibility in Watershed. Energy Procedia 2012, 16, 1324–1331. [Google Scholar] [CrossRef][Green Version]
- Lenzen, M.; Murray, J.; Sack, F.; Wiedmann, T. Shared Producer and Consumer Responsibility—Theory and Practice. Ecol. Econ. 2007, 61, 27–42. [Google Scholar] [CrossRef]
- Cabeza, L.F.; Boquera, L.; Chàfer, M.; Vérez, D. Embodied Energy and Embodied Carbon of Structural Building Materials: Worldwide Progress and Barriers through Literature Map Analysis. Energy Build. 2021, 231, 110612. [Google Scholar] [CrossRef]
- Yang, X.; Zhang, W.; Fan, J.; Yu, J.; Zhao, H. Transfers of Embodied PM2.5 Emissions from and to the North China Region Based on a Multiregional Input-Output Model. Environ. Pollut. 2018, 235, 381–393. [Google Scholar] [CrossRef] [PubMed]
- Infante-Amate, J.; Aguilera, E.; Palmeri, F.; Guzmán, G.; Soto, D.; García-Ruiz, R.; de Molina, M.G. Land Embodied in Spain’s Biomass Trade and Consumption (1900–2008): Historical Changes, Drivers and Impacts. Land Use Policy 2018, 78, 493–502. [Google Scholar] [CrossRef]
- Borucke, M.; Moore, D.; Cranston, G.; Gracey, K.; Iha, K.; Larson, J.; Lazarus, E.; Morales, J.C.; Wackernagel, M.; Galli, A. Accounting for Demand and Supply of the Biosphere’s Regenerative Capacity: The National Footprint Accounts’ Underlying Methodology and Framework. Ecol. Indic. 2013, 24, 518–533. [Google Scholar] [CrossRef]
- Rees, W.E. Ecological Footprints and Appropriated Carrying Capacity: What Urban Economics Leaves Out. Environ. Urban. 1992, 4, 121–130. [Google Scholar] [CrossRef]
- Wackernagel, M.; Onisto, L.; Bello, P.; Callejas Linares, A.; Susana López Falfán, I.; Méndez García, J.; Isabel Suárez Guerrero, A.; Guadalupe Suárez Guerrero, M. National Natural Capital Accounting with the Ecological Footprint Concept. Ecol. Econ. 1999, 29, 375–390. [Google Scholar] [CrossRef]
- Musikavong, C.; Gheewala, S.H. Assessing Ecological Footprints of Products from the Rubber Industry and Palm Oil Mills in Thailand. J. Clean. Prod. 2017, 142, 1148–1157. [Google Scholar] [CrossRef]
- Murakami, S.; Takasu, T.; Islam, K.; Yamasue, E.; Adachi, T. Ecological Footprint and Total Material Requirement as Environmental Indicators of Mining Activities: Case Studies of Copper Mines. Environ. Sustain. Indic. 2020, 8, 100082. [Google Scholar] [CrossRef]
- Galli, A. On the Rationale and Policy Usefulness of Ecological Footprint Accounting: The Case of Morocco. Environ. Sci. Policy 2015, 48, 210–224. [Google Scholar] [CrossRef]
- Xiong, Z.; Li, H. Ecological Deficit Tax: A Tax Design and Simulation of Compensation for Ecosystem Service Value Based on Ecological Footprint in China. J. Clean. Prod. 2019, 230, 1128–1137. [Google Scholar] [CrossRef]
- Wei, Y.; Song, B.; Wang, Y. Designing Cross-Region Ecological Compensation Scheme by Integrating Habitat Maintenance Services Production and Consumption—A Case Study of Jing-Jin-Ji Region. J. Environ. Manag. 2022, 311, 114820. [Google Scholar] [CrossRef]
- Rudolph, A.; Figge, L. Determinants of Ecological Footprints: What Is the Role of Globalization? Ecol. Indic. 2017, 81, 348–361. [Google Scholar] [CrossRef]
- Ulucak, R.; Lin, D. Persistence of Policy Shocks to Ecological Footprint of the USA. Ecol. Indic. 2017, 80, 337–343. [Google Scholar] [CrossRef]
- Baabou, W.; Grunewald, N.; Ouellet-Plamondon, C.; Gressot, M.; Galli, A. The Ecological Footprint of Mediterranean Cities: Awareness Creation and Policy Implications. Environ. Sci. Policy 2017, 69, 94–104. [Google Scholar] [CrossRef]
- Wu, Y.; Zhang, T.; Zhang, H.; Pan, T.; Ni, X.; Grydehøj, A.; Zhang, J. Factors Influencing the Ecological Security of Island Cities: A Neighborhood-Scale Study of Zhoushan Island, China. Sustain. Cities Soc. 2020, 55, 102029. [Google Scholar] [CrossRef]
- Ahmed, Z.; Asghar, M.M.; Malik, M.N.; Nawaz, K. Moving towards a Sustainable Environment: The Dynamic Linkage between Natural Resources, Human Capital, Urbanization, Economic Growth, and Ecological Footprint in China. Resour. Policy 2020, 67, 101677. [Google Scholar] [CrossRef]
- Marrero, M.; Puerto, M.; Rivero-Camacho, C.; Freire-Guerrero, A.; Solís-Guzmán, J. Assessing the Economic Impact and Ecological Footprint of Construction and Demolition Waste during the Urbanization of Rural Land. Resour. Conserv. Recycl. 2017, 117, 160–174. [Google Scholar] [CrossRef]
- Udemba, E.N. A Sustainable Study of Economic Growth and Development amidst Ecological Footprint: New Insight from Nigerian Perspective. Sci. Total Environ. 2020, 732, 139270. [Google Scholar] [CrossRef] [PubMed]
- Duro, J.A.; Teixidó-Figueras, J. Ecological Footprint Inequality across Countries: The Role of Environment Intensity, Income and Interaction Effects. Ecol. Econ. 2013, 93, 34–41. [Google Scholar] [CrossRef]
- Szigeti, C.; Toth, G.; Szabo, D.R. Decoupling—Shifts in Ecological Footprint Intensity of Nations in the Last Decade. Ecol. Indic. 2017, 72, 111–117. [Google Scholar] [CrossRef]
- Kissinger, M.; Fix, J.; Rees, W.E. Wood and Non-Wood Pulp Production: Comparative Ecological Footprinting on the Canadian Prairies. Ecol. Econ. 2007, 62, 552–558. [Google Scholar] [CrossRef]
- Cerutti, A.K.; Bagliani, M.; Beccaro, G.L.; Bounous, G. Application of Ecological Footprint Analysis on Nectarine Production: Methodological Issues and Results from a Case Study in Italy. J. Clean. Prod. 2010, 18, 771–776. [Google Scholar] [CrossRef]
- Herva, M.; García-Diéguez, C.; Franco-Uría, A.; Roca, E. New Insights on Ecological Footprinting as Environmental Indicator for Production Processes. Ecol. Indic. 2012, 16, 84–90. [Google Scholar] [CrossRef]
- de Alvarenga, R.A.F.; da Silva Júnior, V.P.; Soares, S.R. Comparison of the Ecological Footprint and a Life Cycle Impact Assessment Method for a Case Study on Brazilian Broiler Feed Production. J. Clean. Prod. 2012, 28, 25–32. [Google Scholar] [CrossRef]
- Wu, D.; Liu, J. Multi-Regional Input-Output (MRIO) Study of the Provincial Ecological Footprints and Domestic Embodied Footprints Traded among China’s 30 Provinces. Sustainability 2016, 8, 1345. [Google Scholar] [CrossRef]
- Wiedmann, T. A First Empirical Comparison of Energy Footprints Embodied in Trade—MRIO versus PLUM. Ecol. Econ. 2009, 68, 1975–1990. [Google Scholar] [CrossRef]
- Galli, A.; Weinzettel, J.; Cranston, G.; Ercin, E. A Footprint Family Extended MRIO Model to Support Europe’s Transition to a One Planet Economy. Sci. Total Environ. 2013, 461–462, 813–818. [Google Scholar] [CrossRef] [PubMed]
- Peters, G.P. Opportunities and Challenges for Environmental MRIO Modelling: Illustrations with the GTAP Database. In Proceedings of the 16th International Input-Output Conference of the International Input-Output Association (IIOA), Istanbul, Turkey, 2–6 July 2007; pp. 1–26. [Google Scholar]
- Fang, D.; Chen, B. Inequality of Air Pollution and Carbon Emission Embodied in Inter-Regional Transport. Energy Procedia 2019, 158, 3833–3839. [Google Scholar] [CrossRef]
- Lan, J.; Malik, A.; Lenzen, M.; McBain, D.; Kanemoto, K. A Structural Decomposition Analysis of Global Energy Footprints. Appl. Energy 2016, 163, 436–451. [Google Scholar] [CrossRef]
- Zheng, H.; Xu, L. Production and Consumption-Based Primary PM2.5 Emissions: Empirical Analysis from China’s Interprovincial Trade. Resour. Conserv. Recycl. 2020, 155, 104661. [Google Scholar] [CrossRef]
- Hubacek, K.; Giljum, S. Applying Physical InputÁ/Output Analysis to Estimate Land Appropriation (Ecological Footprints) of International Trade Activities. Ecol. Econ. 2003, 44, 137–151. [Google Scholar] [CrossRef]
- Wiedmann, T.; Minx, J.; Barrett, J.; Wackernagel, M. Allocating Ecological Footprints to Final Consumption Categories with Input–Output Analysis. Ecol. Econ. 2006, 56, 28–48. [Google Scholar] [CrossRef]
- Turner, K.; Lenzen, M.; Wiedmann, T.; Barrett, J. Examining the Global Environmental Impact of Regional Consumption Activities—Part 1: A Technical Note on Combining Input–Output and Ecological Footprint Analysis. Ecol. Econ. 2007, 62, 37–44. [Google Scholar] [CrossRef]
- Zhou, X.; Imura, H. How Does Consumer Behavior Influence Regional Ecological Footprints? An Empirical Analysis for Chinese Regions Based on the Multi-Region Input–Output Model. Ecol. Econ. 2011, 71, 171–179. [Google Scholar] [CrossRef]
- Carballo Penela, A.; Sebastián Villasante, C. Applying Physical Input–Output Tables of Energy to Estimate the Energy Ecological Footprint (EEF) of Galicia (NW Spain). Energy Policy 2008, 36, 1148–1163. [Google Scholar] [CrossRef]
- Weinzettel, J.; Steen-Olsen, K.; Hertwich, E.G.; Borucke, M.; Galli, A. Ecological Footprint of Nations: Comparison of Process Analysis, and Standard and Hybrid Multiregional Input–Output Analysis. Ecol. Econ. 2014, 101, 115–126. [Google Scholar] [CrossRef]
- Marti, L.; Puertas, R. Analysis of the Efficiency of African Countries through Their Ecological Footprint and Biocapacity. Sci. Total Environ. 2020, 722, 137504. [Google Scholar] [CrossRef]
- Ding, Z.; Yao, S. Theory and Valuation of Cross-Regional Ecological Compensation for Cultivated Land: A Case Study of Shanxi Province, China. Ecol. Indic. 2022, 136, 108609. [Google Scholar] [CrossRef]
- Cao, Y.; Dallimer, M.; Stringer, L.C.; Bai, Z.; Siu, Y.L. Land Expropriation Compensation among Multiple Stakeholders in a Mining Area: Explaining “Skeleton House” Compensation. Land Use Policy 2018, 74, 97–110. [Google Scholar] [CrossRef]
- Food and Agriculture Organization of the United Nations. Available online: https://www.fao.org/ (accessed on 16 August 2022).
- GFN National Footprint and Biocapacity Accounts Public Data Package. Available online: https://www.footprintnetwork.org/licenses/public-data-package-free/ (accessed on 16 August 2022).
- IPCC 2006 IPCC Guidelines for National Greenhouse Gas Inventories. Available online: https://www.ipcc.ch/report/2006-ipcc-guidelines-for-national-greenhouse-gas-inventories/ (accessed on 16 August 2022).
- Salman, M.; Long, X.; Dauda, L.; Mensah, C.; Muhammad, S. Different Impacts of Export and Import on Carbon Emissions across 7 ASEAN Countries: A Panel Quantile Regression Approach. Sci. Total Environ. 2019, 686, 1019–1029. [Google Scholar] [CrossRef]
- Abid, M.; Sakrafi, H.; Gheraia, Z.; Abdelli, H. Does Renewable Energy Consumption Affect Ecological Footprints in Saudi Arabia? A Bootstrap Causality Test. Renew. Energy 2022, 189, 813–821. [Google Scholar] [CrossRef]
- Wang, Q.; Zhang, F.; Li, R.; Li, L. The Impact of Renewable Energy on Decoupling Economic Growth from Ecological Footprint—An Empirical Analysis of 166 Countries. J. Clean. Prod. 2022, 354, 131706. [Google Scholar] [CrossRef]
- Gassner, A.; Lederer, J.; Kanitschar, G.; Ossberger, M.; Fellner, J. Extended Ecological Footprint for Different Modes of Urban Public Transport: The Case of Vienna, Austria. Land Use Policy 2018, 72, 85–99. [Google Scholar] [CrossRef]
- Tong, J.; Yue, T.; Xue, J. Carbon Taxes and a Guidance-Oriented Green Finance Approach in China: Path to Carbon Peak. J. Clean. Prod. 2022, 367, 133050. [Google Scholar] [CrossRef]
- Zhang, W.; Zhang, L.; Li, Y.; Tian, Y.; Li, X.; Zhang, X.; Mol, A.P.J.; Sonnenfeld, D.A.; Liu, J.; Ping, Z.; et al. Neglected Environmental Health Impacts of China’s Supply-Side Structural Reform. Environ. Int. 2018, 115, 97–103. [Google Scholar] [CrossRef] [PubMed]
Disclaimer/Publisher’s Note: The statements, opinions and data contained in all publications are solely those of the individual author(s) and contributor(s) and not of MDPI and/or the editor(s). MDPI and/or the editor(s) disclaim responsibility for any injury to people or property resulting from any ideas, methods, instructions or products referred to in the content. |
© 2022 by the authors. Licensee MDPI, Basel, Switzerland. This article is an open access article distributed under the terms and conditions of the Creative Commons Attribution (CC BY) license (https://creativecommons.org/licenses/by/4.0/).

