Article

Exploring the Impact of Industrial Land Price Distortion on Carbon Emission Intensity: Evidence from China

1
School of Management Science and Engineering, Central University of Finance and Economics, Beijing 100081, China
2
School of Government, Central University of Finance and Economics, Beijing 100081, China
*
Author to whom correspondence should be addressed.
Land 2023, 12(1), 92; https://doi.org/10.3390/land12010092
Submission received: 31 October 2022 / Revised: 18 December 2022 / Accepted: 21 December 2022 / Published: 27 December 2022

Abstract

:
In the context of tax sharing reform and land reform during the 1990s, local governments in China relied heavily on land finance. Local governments have fierce competition in attracting investment, omitting the development of green economy. Based on the data of industrial land sales and carbon dioxide emissions, this study constructed the panel data of 196 cities in China from 2007 to 2017 and analyzed the spatial and temporal evolution characteristics of urban industrial land price distortion and carbon emission intensity. Furthermore, a multiple linear regression model was constructed from the aspects of scale effect to empirically analyze the overall impact and differential impact of urban industrial land price distortion on carbon emission intensity. With the help of the mediating effect model, the mechanism of urban industrial land price distortion on carbon emission intensity was investigated from the perspective of industrial structure upgrading. The results showed that (1) the higher the price distortion of industrial land is, the more detrimental it is to the development of green and low-carbon economy. (2) The regional heterogeneity test showed that the impact of industrial land price distortion on carbon emission intensity is most significant in the central region, medium cities, and cities with low fiscal self-sufficiency rates, respectively. (3) The higher the distortion degree of industrial land price, the greater the restriction on the upgrading of industrial structure, further increasing the carbon emission intensity. This paper provides policy implications for the market-oriented reform of land factors and the realization of the “double carbon” goal.

1. Introduction

In September 2020, Chinese President Xi Jinping made a solemn commitment at the 75th General Assembly of the United Nations that China would strive to realize the carbon peaking goal before 2030 and achieve the carbon neutrality goal before 2060. As a major country in carbon dioxide emissions, China assumes the significant responsibility for emission reduction. The achievement of carbon peaking and carbon neutrality goals will also promote the high-quality development of China’s economy.
Carbon emissions are closely related to industrial production. The industry is the most principal area of China’s energy consumption and carbon dioxide emissions. Additionally, the combustion of fossil fuels is the main contributor [1]. Therefore, industrial land allocation may have great impacts on carbon emissions [2]. In the context of the reform of the tax-sharing system, local governments are facing increasing financial pressure. As a result, they need to narrow the gap between revenue and expenditure through extra-budgetary revenues. Among them, revenues from land transfer were the main source of local governments [3]. As “rational economic men”, local governments were motivated both by “land-generating wealth” and “land-attracting wealth”. Additionally, local officials were motivated by promotions [4]. Consequently, China had adopted the “two-way” land supply strategy for a long time. Local governments not only sold industrial land at a low price or made big concessions in labor costs, but also sold commercial and residential land at a high price to make up for the cost of industrial land [5]. The selling price of urban industrial land was far lower than that of commercial and residential land [6]. The distortion of industrial land transfer price effectively promoted local economic growth. However, with the rapid economic development, the effect of the “two-way” land supply strategy gradually weakened. This strategy also resulted in a series of endogenous negative effects [7]. After the reform of the tax-sharing system, local governments mainly adopted the “regional race-to-the-bottom” model. They used competitive means such as selling industrial land at low prices and lowering environmental protection standards to attract investments in manufacturing and other industries [8]. Governments also provided “green channels” for enterprises with high performance and high taxation. Such enterprises often had high pollution, high emissions, and high energy consumption [4]. Related industrial projects were often repetitive, inefficient, and unsustainable, resulting in serious environmental pollution, and hindering the upgrading of the regional industrial structure. Therefore, as for the market reform of land elements and the realization of “carbon peaking and carbon neutrality”, it is of certain practical significance to study the carbon emission reduction from the perspective of industrial land, and analyze the overall and regional characteristics of local governments’ low-price transfer of industrial land. It is also crucial to empirically test whether this measure has an impact on the carbon emission intensity of cities in China, and further explore its internal mechanism.
The academia regards the industrial land transfer at low prices as a mismatch of land resources. The large-scale industrial land transfer by the governments at low prices had made the price of industrial land deviate from the actual value, resulting in the serious distortion of the price of industrial land [9]. Existing research on the distortion of industrial land transfer prices mainly focus on four aspects: causes, measurements, distortion characteristics, and impacts. The impacts of industrial land transfer price distortion are essential for related research, which can be summarized as the impact on economic development and the impact on the environment. The impacts on the economic development are generally discussed from three levels of enterprises, industries, and regions. Relevant conclusions show that the industrial land transfer price distortion would reduce the production cost and capital cost of enterprises. Substantive subsidies may cause excessive investments in enterprises and reduce the innovation ability and production efficiency of industrial enterprises [10]. At the industry level, because of the difference in the dependence degree of different industries on the input resources, the impacts of industrial land transfer price distortion on different industries are also diverse [11]. At the regional level, the bottom line of investment quality may be reduced, thereby inhibiting the regional innovation ability. There may be a lock-in effect on the regional extensive industrial structure, hindering the transformation and upgrading of regional industrial structure [12,13]. Generally, studies on the impacts of industrial land transfer price distortion on environment can be divided into two types. Some studies first proved that the distortion of industrial land-transfer price would aggravate the regional environmental pollution through empirical analyses, and then further discussed the transmission mechanism inhibiting the upgrading of industrial structure and the development of technological innovations [14,15]. The specific environmental quality indicators were industrial smoke/wastewater discharge, PM2.5, green total factor productivity, etc. [16,17]. The other studies considered governance and discussed the direct and indirect moderating effects of environmental regulations on the environmental pollution caused by the distortion of industrial land-transfer price [18].
Studies on carbon emission intensity focus on the measurement and prediction of carbon emission intensity, the decomposition and exploration of influencing factors, and the search for influence effects and emission reduction paths [19]. First, as far as the measurement and prediction of carbon emission intensity is concerned, current studies are mostly based on the IPAT model, the LEAP model, and the STIRPAT model [20]. Sun et al. (2022) predicted the provincial emission trajectory of China through the STIRPAT model [21]. Secondly, in terms of influencing factors of carbon emissions, existing studies comprehensively discussed the impacts of population, economy, technology, life, and other factors on carbon emissions and other environmental issues [22,23]. Some scholars studied carbon emissions based on structural decomposition model, and decomposed the influencing factors into scale effect, technical effect, and structure effect [24,25]. There are many factors influencing the carbon emission intensity, including economic growth, energy intensity, industrial structure, level of urbanization, and population size [26,27]. The urbanization level, openness level, and local government competition are variables that domestic scholars usually consider during the research on the influencing factors of China’s carbon emission intensity [28,29]. Among them, the current land-use research on carbon emission reduction is mostly conducted from the perspective of land-use intensity difference, structural change, and land finance [30]. Additionally, different national or regional characteristics have different influence degree characteristics [31,32]. In addition, in terms of emission reduction path, some scholars found that carbon emissions or carbon emission reduction policies have an important impact on sustainable economic development, enterprise investment efficiency, and other aspects from the impact of carbon emission intensity [33]. On this basis, combined with the negative impact of carbon emissions and the positive impact of carbon emission reduction, some scholars further conducted research on emission reduction paths from a front-end perspective. For example, Campbell C and other scholars (2000) also proved that the optimization of land-use structure can significantly reduce the overall level of carbon emissions [34]. This also shows that it is of great significance to explore the impact of land-transfer structure or price distortion on the carbon emission reduction path.
In short, existing research on the impact of single-direction exploration of industrial land is relatively extensive, and the research on the impact factors of single direction exploration of carbon emission intensity is also relatively rich. Some studies directly analyzed the impacts of land transfer price distortion on environmental quality [35]. However, there are several aspects of the existing literature worthy of further exploration. First, there are relatively few studies on the combination of industrial land and carbon emissions in the existing literature. Few studies have explored carbon emission intensity from the perspective of land transfer. Secondly, research on the theoretical mechanism of the impacts of industrial land transfer price distortion on carbon emission intensity is insufficient. Thirdly, few existing studies explore the regional and urban heterogeneity of the effects of industrial land-transfer price distortion.
In this context, this paper used the data of industrial land transfer and carbon dioxide emissions to construct the panel data of 196 cities in China from 2007 to 2017 and demonstrate the overall impacts of industrial land transfer price distortion on carbon emission intensity, as well as the differential impacts in different regions. The internal impact mechanism of industrial land-transfer price distortion on carbon emission intensity was examined from the perspective of industrial structure upgrading with the help of mediating effect model. This paper provided certain theoretical and empirical bases for the promotion of the land factor marketization reform. Additionally, it also proposed feasible suggestions for the realization of carbon emission reduction and the development of an urban green economy.

2. Model Setting, Variable Selection, and Data Sources

2.1. Model Setting

2.1.1. Multiple Linear Regression Model

In this paper, the benchmark regression model of industrial land market distortion behavior and carbon emission intensity was set as follows:
ln CEI it = α 0 + α 1 Landdist it 1 + α ε X it + u i + u t + ε it
In Equation (1), i indicates cities at the prefectural level and above; t indicates the year; t − 1 indicates a 1-year lag in taking values; To control for heteroscedasticity, we selected the logarithm of carbon dioxide emission intensity, namely lnCEI it , indicating the urban carbon dioxide emission intensity; Landdist is the distortion degree of industrial land-transfer price, and X it is a set of control variables at the regional level; u i indicates the entity fixed effect, u t indicates the time fixed effect, and ε it is a random disturbance term.

2.1.2. Heterogeneity Effect Analysis

Diverse regions have differences in resource endowment, development mode, and institutional environment. They also show inconsistency in terms of the carbon emission intensity and the industrial land-transfer price distortion degree. Under financial pressure, local governments with relatively weak gaming capabilities may greatly reduce the bottom line and increase the degree of intervention in the land market so as to maximize extra-budgetary revenues. In this case, there will be an agglomeration of a large number of industries with high energy consumption and high pollution, which causes serious damage to the environment, and is detrimental to the upgrading of regional industrial structures. The eastern, central, and western regions, cities of different scales and cities with different financial pressures, have great differences in economic development level and institutional environment, thus generating differences in the gaming ability of local governments. Such differences may result in the regional and urban heterogeneity in the impacts of industrial land-transfer price distortion on carbon emission intensity. Therefore, this paper further explored the impact of industrial land-transfer price distortion on carbon emission intensity in different regions and cities from the perspective of different regions, different city scales, and different financial conditions. The model is the same as Equation (1).

2.1.3. Mediating Effect Model

As for the impact of industrial land-transfer price distortion on industrial structure upgrading, it is universally acknowledged in academic circles that the distortion of industrial land-transfer price will significantly inhibit the upgrading of the industrial structure. As for the impacts of industrial structure upgrading on carbon emission intensity, the mainstream view believes that the industrial structure upgrading will greatly reduce the carbon emission intensity [36]. Therefore, the industrial structure upgrading may be an intermediate mechanism for the distortion of industrial land-transfer price to affect carbon emission intensity. Academia divides the industrial structure upgrading into two dimensions: the rationalization of industrial structure and the advancement of industrial structure. The rationalization of industrial structure refers to the process where the balance, correlation, and coordination among industries, as well as the effective utilization of elements improve continuously. In this process, large-scale production factors are transferred from the primary product production sector to the manufacturing sector, and then to the service sector. The labor productivity of the three industries tends to be consistent. While the advancement of industrial structure emphasizes the continuous transformation of industrial structure from low value-added to high value-added based on the rationalization of industrial structure. During the process, the dominance of the three industries transfers from the primary industry to the secondary industry, and then to the tertiary industry. The internal impact mechanism of industrial land-transfer price distortion on carbon emission intensity is analyzed from the perspective of industrial structure upgrading. On one hand, the distortion of industrial land-transfer price has led to the agglomeration of a large number of low-efficiency enterprises, making the demand for low-end labor forces by related departments increase significantly. As a result, the transfer and flow of labor forces between different departments are inhibited. The labor productivity has been greatly reduced, thus hindering the rationalization of industrial structure, increasing the energy consumption, and increasing the carbon emission intensity. On the other hand, the distortion of industrial land-transfer price makes it difficult to eliminate extensive industries. Large numbers of elements flow to the heavy chemical industry with high output value but high pollution or the low-level processing industry, which hinders the advancement process of industrial structure, that is, the upgrading and transformation to the technology-intensive and knowledge-intensive intensive industrial structure. It is difficult to greatly improve the efficiency of energy utilization. At the same time, when low-efficiency enterprises obtain land at low prices, enterprises are prone to excessive investment. Compared with R&D investments, enterprises prefer to preserve their profits by maintaining current large-scale business situations, which hinders industrial structure upgrading and inhibits the carbon emission reduction [30] (Figure 1).
To further identify the impact mechanism of industrial land-transfer price distortion on carbon emission intensity from the perspective of industrial structure upgrading, a mediating effect model is constructed to test the mechanism based on the classical test methods for the mediating effect of Wen et al. [37,38]. The test steps of the mediating effect model are as follows. Firstly, the carbon emission intensity is taken as the explained variable and the distortion degree of industrial land-transfer price is taken as the explanatory variable for regression, which were consistent with the Benchmark Regression Model Equation (1). Secondly, the indicators of industrial structure rationalization and industrial structure advancement are used as the explained variables, respectively. The degree of industrial land-transfer price distortion is used as the explanatory variable for regression. Finally, the distortion degree of the industrial land-transfer price and the mediating variable are both included in the regression model to examine the influences of industrial land-transfer price distortion and the mediating variable on carbon emission intensity. If the coefficients α 1 , γ 1 ( γ 2 ) are significant, and σ 1 is smaller or less significant than α 1 (or ρ 1 is smaller or less significant than α 1 ), it indicates that the mediating effect exists.
ISR = γ 01 + γ 1 Landdist it 1 + X it + u i + u t + ε 1 it
W = γ 02 + γ 2 Landdist it 1 + X it + u i + u t + ε 2 it
ln CEI it = σ 01 + σ 1 Landdist it 1 + σ 2 ISR + X it + u i + u t + ε 3 it
ln CEI it = ρ 01 + ρ 1 Landdist it 1 + ρ 2 W + X it + u i + u t + ε 4 it
In these equations, ISR indicates the industrial structure rationalization, and W indicates the industrial structure advancement, which are the mediating variables in this paper. The meanings of the remaining variables are the same as those in Equation (1).

2.2. Data Sources

Based on the feasibility and completeness of data acquisition, this paper selected 196 cities in China as research objects with a time scope ranging from 2007 to 2017. (1) The data of the industrial land-transfer price is obtained from China Land Market Network (https://www.landchina.com/ (accessed on 6 March 2022)). (2) Since China’s urban energy consumption data is insufficient, it is difficult to accurately calculate the urban carbon emissions from the perspective of energy consumption. However, night lighting is highly correlated with social and economic activities, as well as carbon emissions. A large number of existing studies adopt nighttime light data, especially DMSP/OLS images, as a proxy tool to estimate carbon emissions, and this approach has been widely accepted in the social sciences. So, we used the data of carbon dioxide emissions of 334 prefecture-level cities in China from 1992 to 2017, which constitute the latest research results of Chen et al. (2021) published in Scientific Reports [39]. (3) The energy consumption data is from statistical yearbooks of various provinces and cities, as well as statistical bulletins of national economic and social development of various cities. (4) The data of the secondary industry structure and the per capita disposable income were from the China City Statistical Yearbook and the “City Annual Database” of the China Economic Net Statistical Database (https://www.cei.cn/ (accessed on 6 March 2022)), the EPS database (eps Data Platform-Data Resources (https://www.epsnet.com.cn (accessed on 6 March 2022))).

2.3. Variable Selection

The explained variable is urban carbon dioxide emission intensity; the explanatory variable is the degree of industrial land-transfer price distortion. The mediators are the rationalization of industrial structure and the advancement of industrial structure. The Theil Index was applied to measure the rationalization of industrial structure [40] (ISR):
ISR = 1 TL = 1 i = 1 3 Y i Y ln ( Y i L i / Y L )
In Equation (6), i = 1, 2, 3; Y i indicates the total industrial output value of the i-th industry; L i indicates the number of employees in the i-th industry, and L indicates the total number of employees. The larger the ISR, the higher the rationalization level of the industrial structure.
The mediating variable is the advancement of industrial structure. First, the GDP was divided into three parts in accordance with the three industrial divisions. The proportion of added value of each part in GDP was taken as a component of the space vector, thus forming a set of three-dimensional vectors X 0 = ( x 1 , 0 , x 2 , 0 , x 3 , 0 ). Then, the angles ϑ 1 , ϑ 2 , ϑ 3 between the vector X 0 and the vectors X 1 = (1, 0, 0 ) ,   X 2 = (0, 1, 0), X 3 = (0, 0, 1) representing the industries arranging from low level to high level were calculated respectively. The calculation equation of W defining the advancement of industrial structure is as follows:
ϑ j = arccos i = 1 3 x i , j x i , 0 ( i = 1 3 x 2 i , j 1 2 i = 1 3 x 2 i , 0 1 2 )
W = k = 1 3 j = 1 k θ j
In Equations (7) and (8), j = 1, 2, 3. The larger the W, the higher the advancement of industrial structure.
We chose achievements, industrial structure, economic development level, energy intensity, urbanization level, and opening-up level as the control variables at the city level according to the exiting research (Table 1). The carbon emission intensity was obtained after dividing carbon dioxide emissions by the regional GDP; the energy intensity was obtained after dividing the energy consumption by the regional GDP; opening-up level was obtained after dividing the actual amount of foreign capital utilized by the regional GDP; the urbanization level was obtained after dividing the urban population by the resident population. The degree of industrial land-transfer price distortion was measured by the following method. If the actual price of urban industrial land is closer to the local minimum benchmark price of industrial land, or even lower than the benchmark price, the low-price transfer by local government is more distorted. Specifically, for the same city sample in the same year, the minimum price required by the policy is matched for the land in accordance with the land evaluation grade firstly (Minimum Price Standard for National Industrial Land Transfer). Then, the sum of policy benchmark prices of the city sample of the year (minimum price of industrial land transfer × land transfer area) and the sum of actual transaction prices were calculated. The degree of industrial land-transfer distortion was calculated through a formula, namely, (the sum of policy benchmark prices − the sum of actual transaction prices)/the sum of policy benchmark prices. For the presentation of the distortion degree, a positive coefficient referred to a high distortion of low-price industrial land transfer by the government and a negative coefficient referred to a low distortion of low-price industrial land transfer by the government. At the same time, taking 2000 as the base period, the variables related to GDP are deflated by the GDP deflator; the variables related to consumption and incomes are deflated by the consumer price index CPI; the data of carbon emission intensity was logarithmically processed.

3. Degree of Industrial Land-Transfer Price Distortion and Spatial–Temporal Evolution Characteristics of Carbon Emission Intensity

3.1. Distortion of Industrial Land-Transfer Price

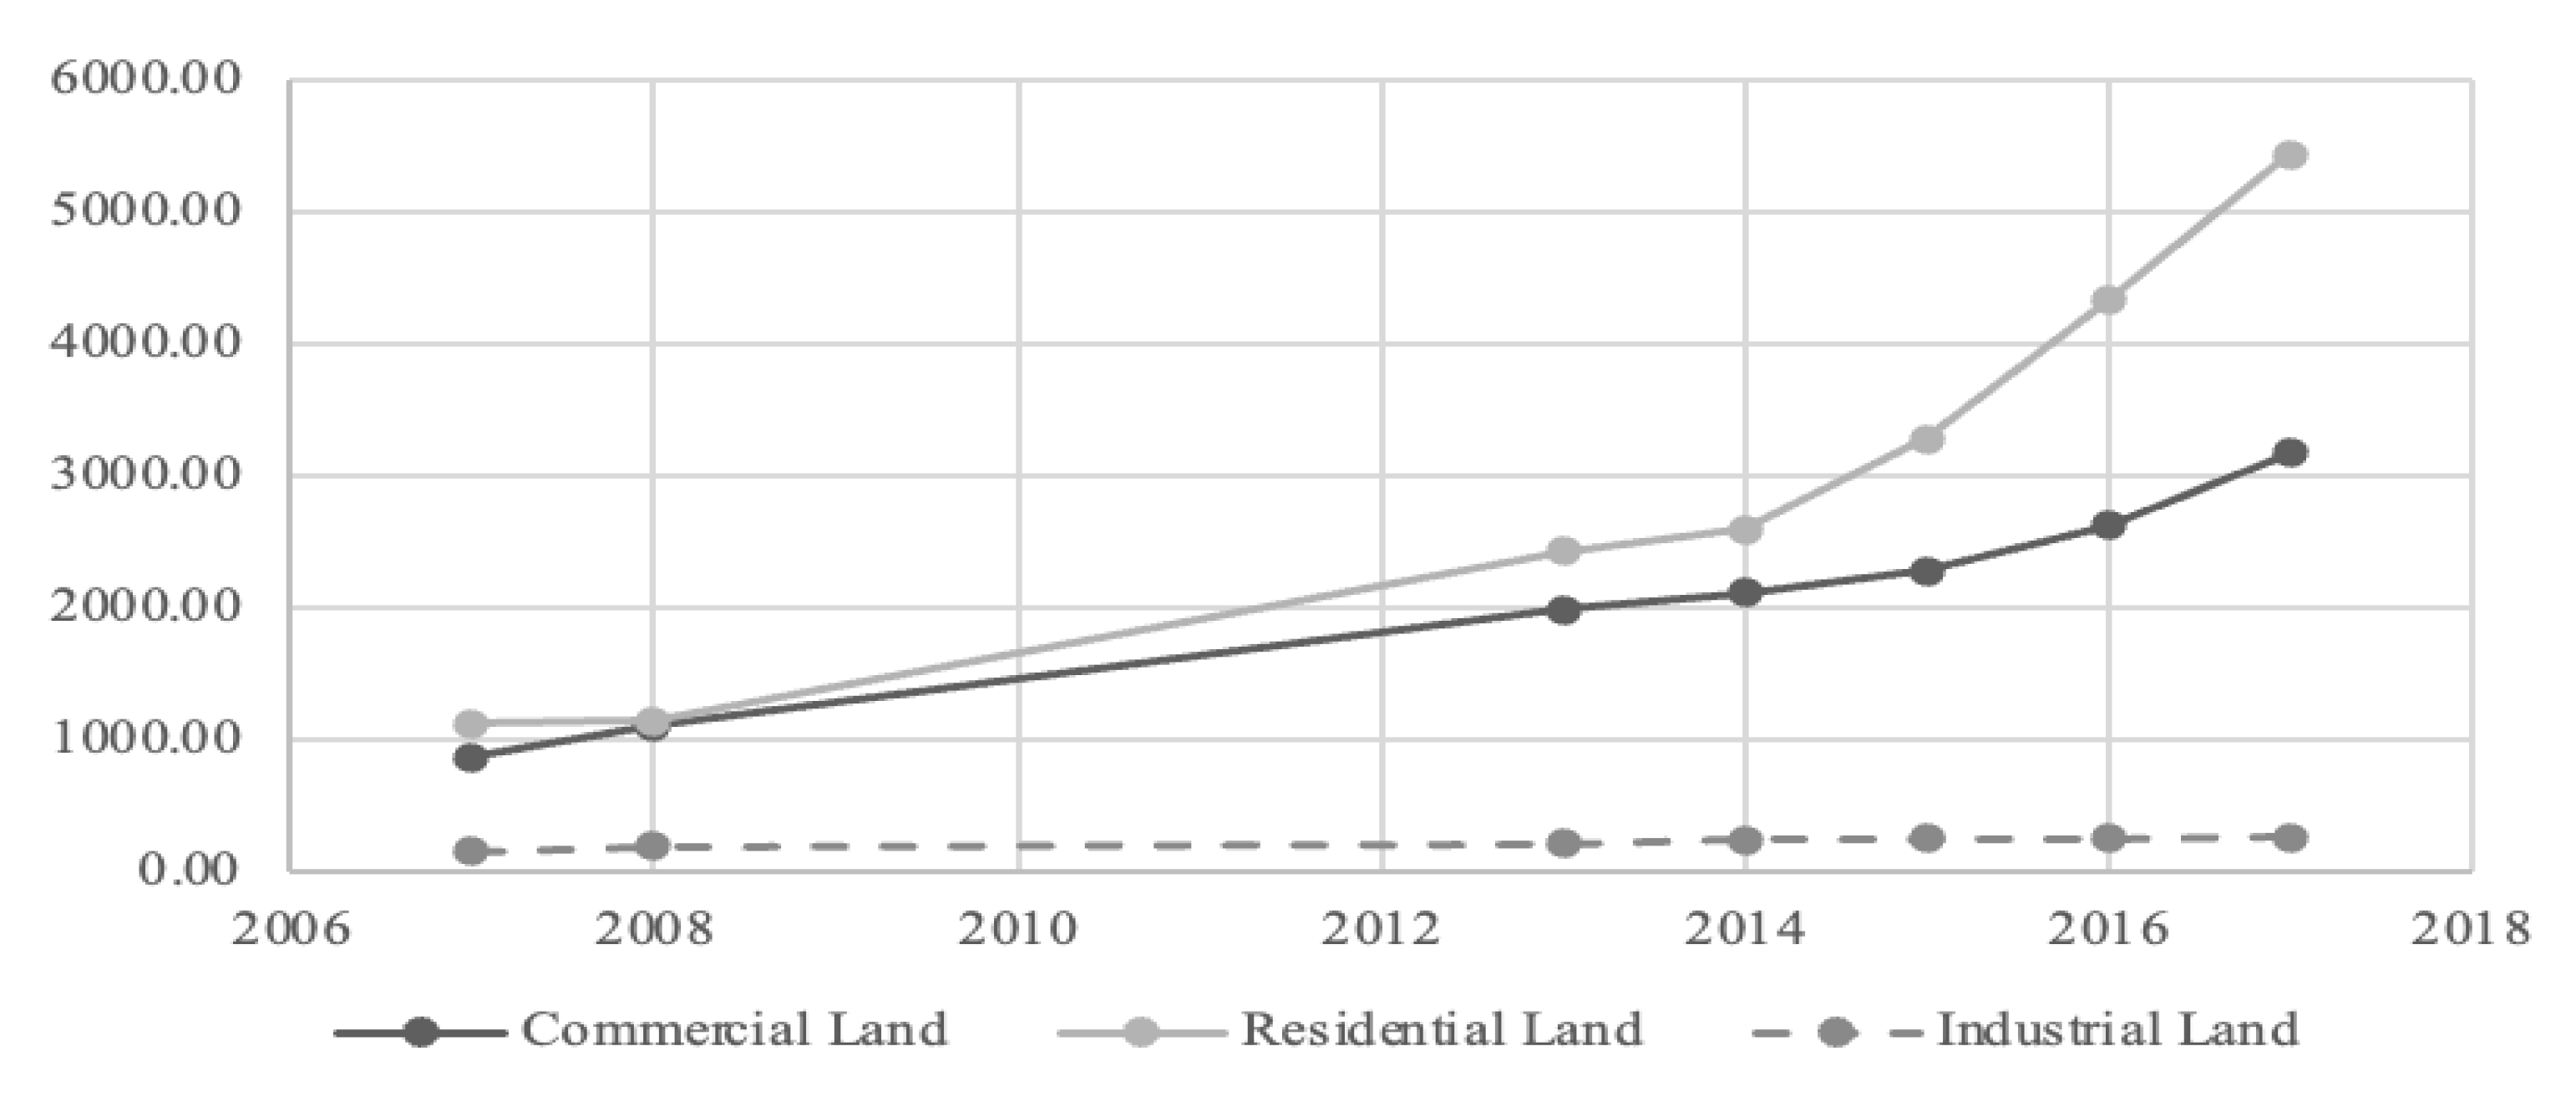
There is a clear gap of transfer prices between industrial land and commercial and residential land, which is becoming larger as time goes on. For a long time, the transfer price of industrial land in China has been much lower than that of commercial and residential land. It has never exceeded 20% of the transfer price of commercial land or residential land. From 2007 to 2017, although the transfer price of industrial land increased at the rate as high as 46.5%, the average transfer price of industrial land was only 227 yuan/square meter, remaining at a low level. In 2007, the average transfer price of commercial land was 5.6 times that of industrial land. The average transfer price of residential land was 7.3 times that of industrial land. In 2017, the average transfer price of commercial land and the average transfer price of residential land were 11.8 times and 20.2 times that of industrial land, respectively (Figure 2). It can be found that local governments have a strong dependence on land finance. By transferring commercial and residential land at high prices, and industrial land at low prices, they can attract investments, promote local economic growth, and maximize the extra-budget revenues.
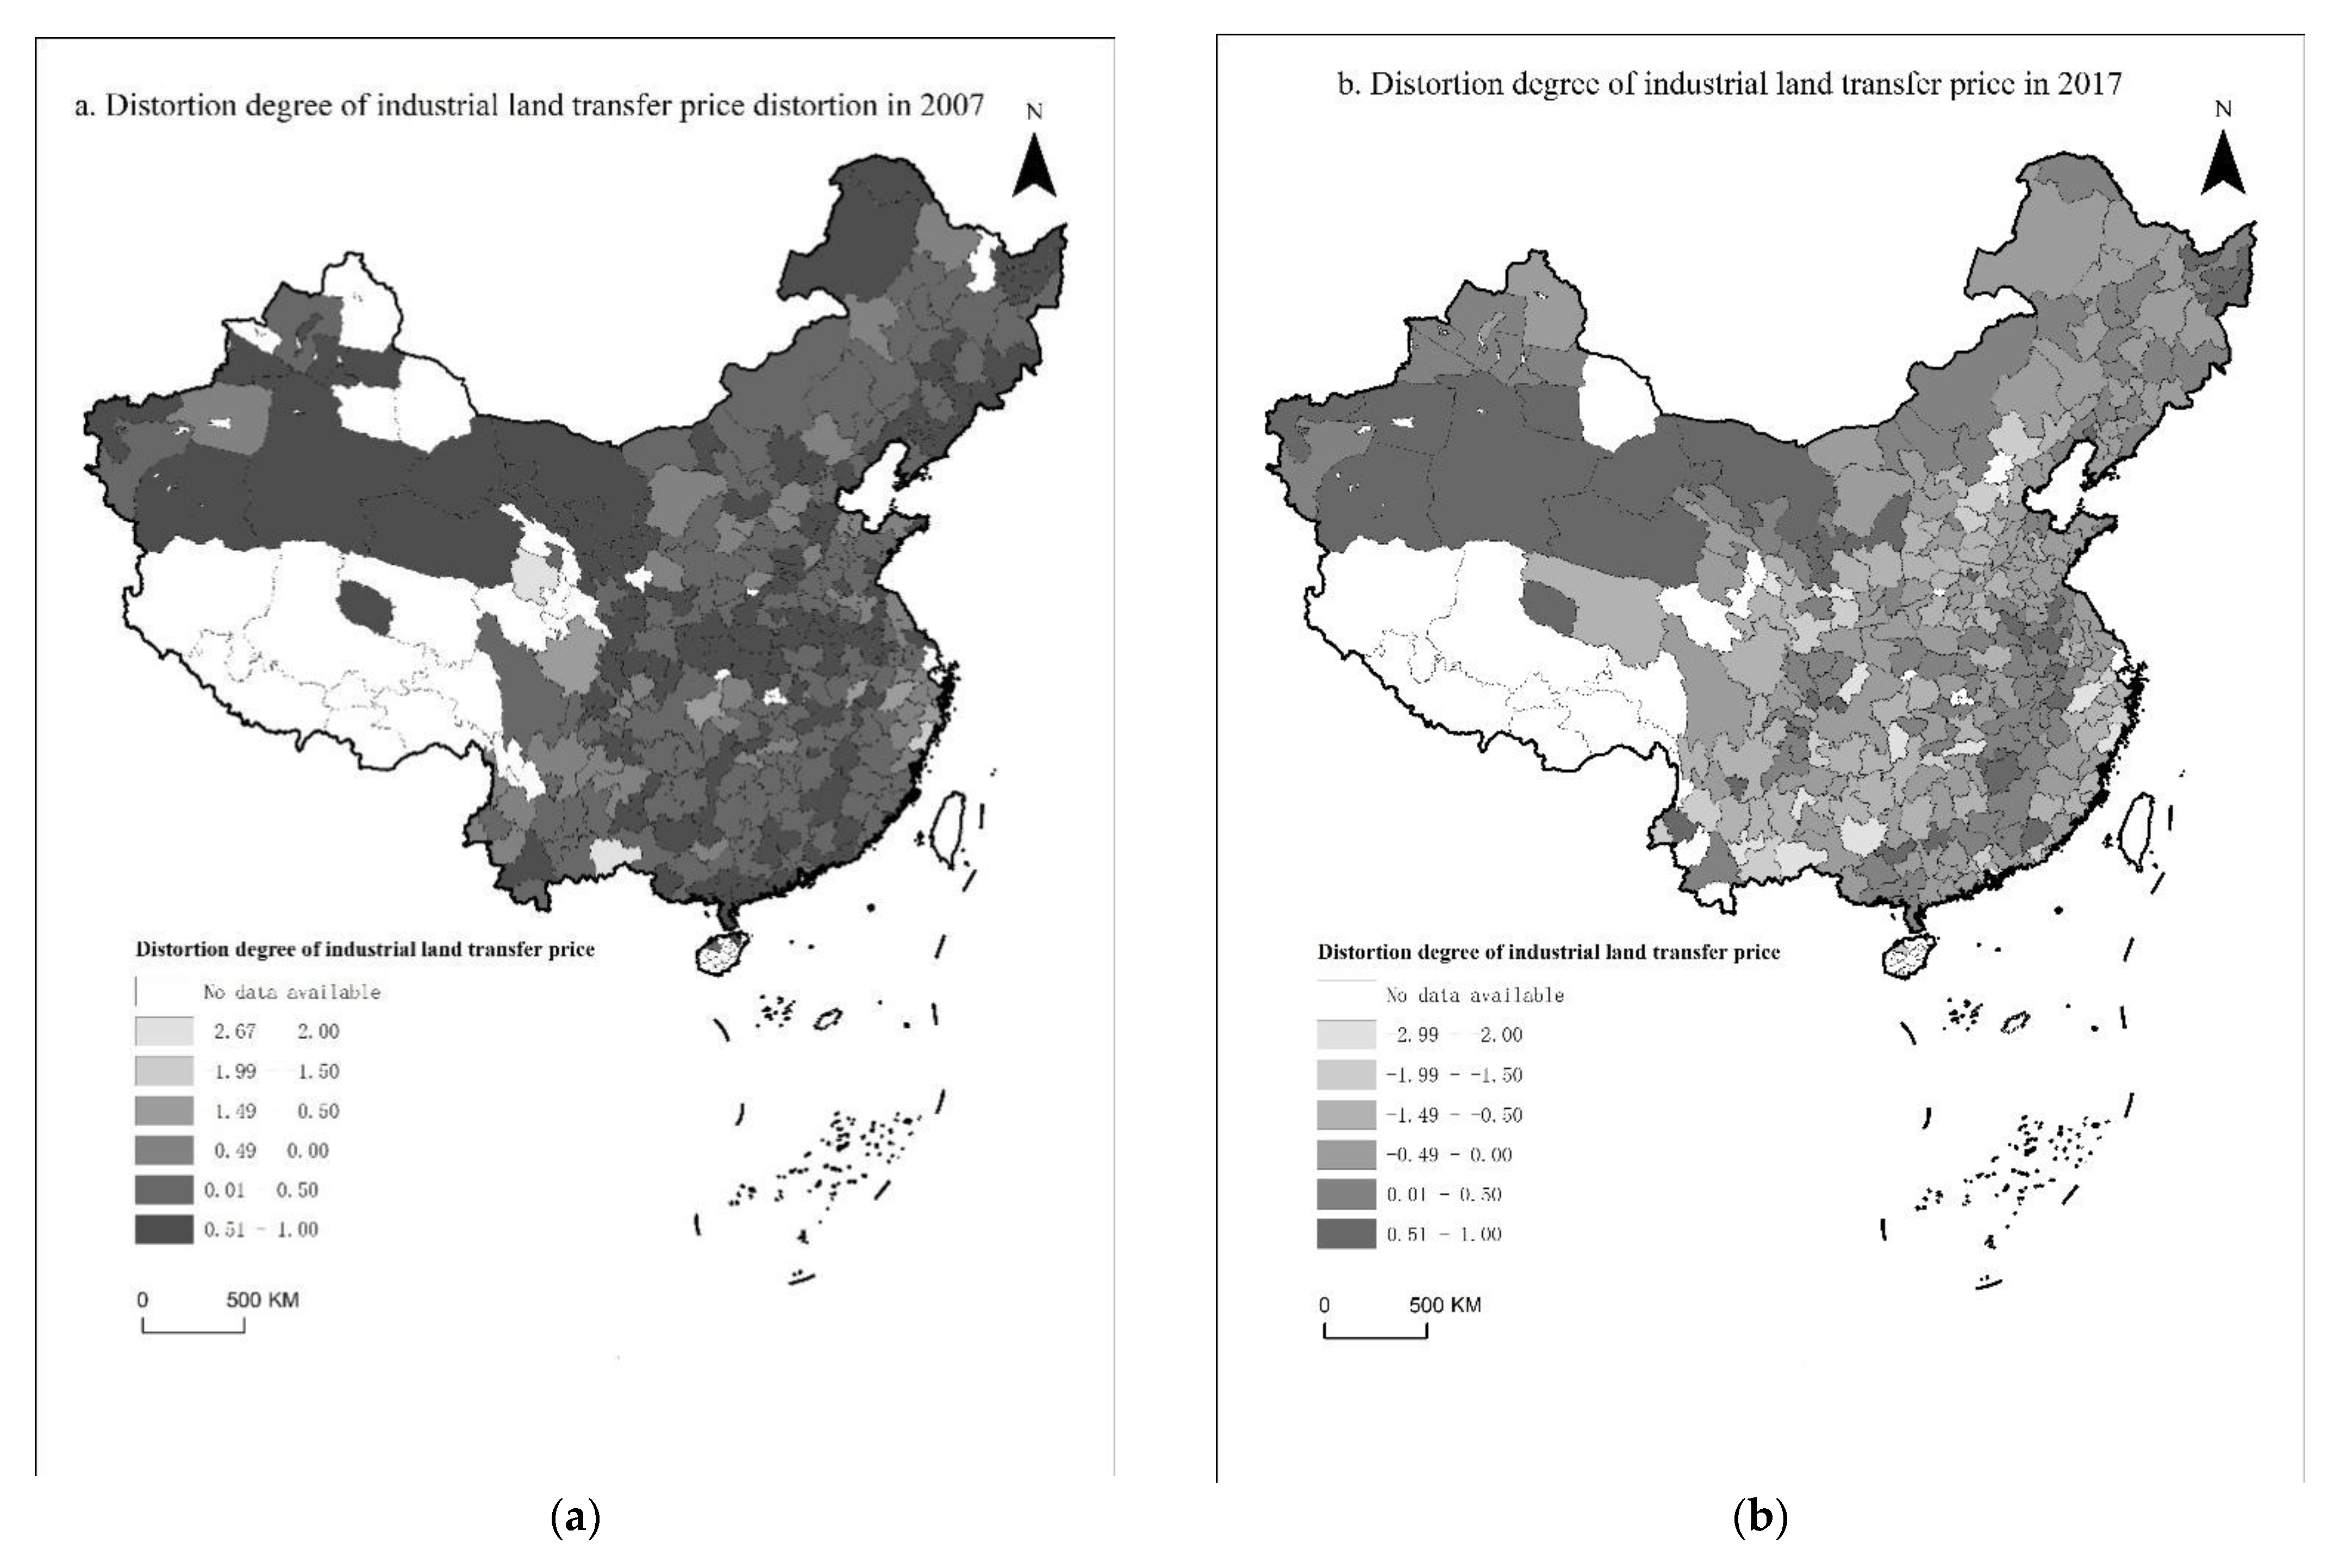
Generally speaking, the places with a high degree of industrial land-transfer price distortion are mainly distributed in the central, western and northeastern regions, with 80% of the cities with a high degree of distortion of industrial land-transfer prices are located in the central and western regions in 2017. These are usually areas with relatively poor economic development conditions, such as Gansu and Xinjiang. Document No. 31 issued by the State Council in 2006 formulated regulations such as the establishment of unified announcement system for the minimum price of industrial land transfer. To a certain extent, it was conducive to reducing irregularities in the land market. However, competitions between governments still exist. Local governments still intervene in the industrial land market and transfer industrial land at low prices or even in illegal ways. From the perspective of spatial and temporal distributions, the degree of industrial land-transfer price distortion in most cities slowed down from 2007 to 2017, making the spatial distribution pattern more concentrated. The degree of industrial land-transfer price distortion deepened in a small number of cities. The distortion degree of land market in 2017 shows that the areas with a high degree of industrial land-transfer price distortion were also mainly in the central and western regions. The distortion of industrial low-price land was the severest in Kizilsu Kirghiz Autonomous Prefecture in Xinjiang Uygur Autonomous Region, Alxa League in Inner Mongolia Autonomous Region, Jinchang City in Gansu Province, and Panzhihua City in Sichuan Province (Figure 3).

3.2. Carbon Emission Intensity

From 2007 to 2017, China’s carbon dioxide emissions increased rapidly at first and then turned to be stable gradually. According to China Sub-Sector Accounting Carbon Emission List released by the CEADs database, carbon dioxide emissions increased from 6546.30 million tons to 9534.24 million tons from 2007 to 2013, reaching the peak during this period. In 2006, China put forward the energy conservation and emission reduction goals for the first time in the “Eleventh Five-Year Plan” and formulated a series of actions and policies. However, the continuous increase in carbon dioxide emissions from 2007 to 2013 also showed that China was still in the stage of rapid economic development, the deepening stage of industrialization, and the rising stage of total energy consumption. Multiple complex factors made it impossible for China to quickly achieve carbon emission reduction in the short term. From 2014 to 2017, the average carbon dioxide emission was 9342.30 million tons with small fluctuations, indicating that the emission of carbon dioxide had been controlled to a certain extent. In the past ten years, China’s carbon dioxide emission intensity had fallen off a cliff. In 2017, China’s carbon dioxide emission intensity decreased by 56.6% compared with that of 2007, indicating that China had made significant progress in reducing the carbon dioxide emission intensity. It also reflected that China’s economy was gradually developing towards the high-quality period (Figure 4).
The carbon emissions from industrial sectors are the main sources of carbon emissions in China. From 2007 to 2013, the carbon emissions from industrial sectors continued to rise. Although the carbon emissions of industrial sectors were controlled to a certain extent after 2013 and no longer increased at the original growth rate, the proportion of carbon emissions from industrial sectors in the total carbon emissions still remained above 80% (Figure 5).
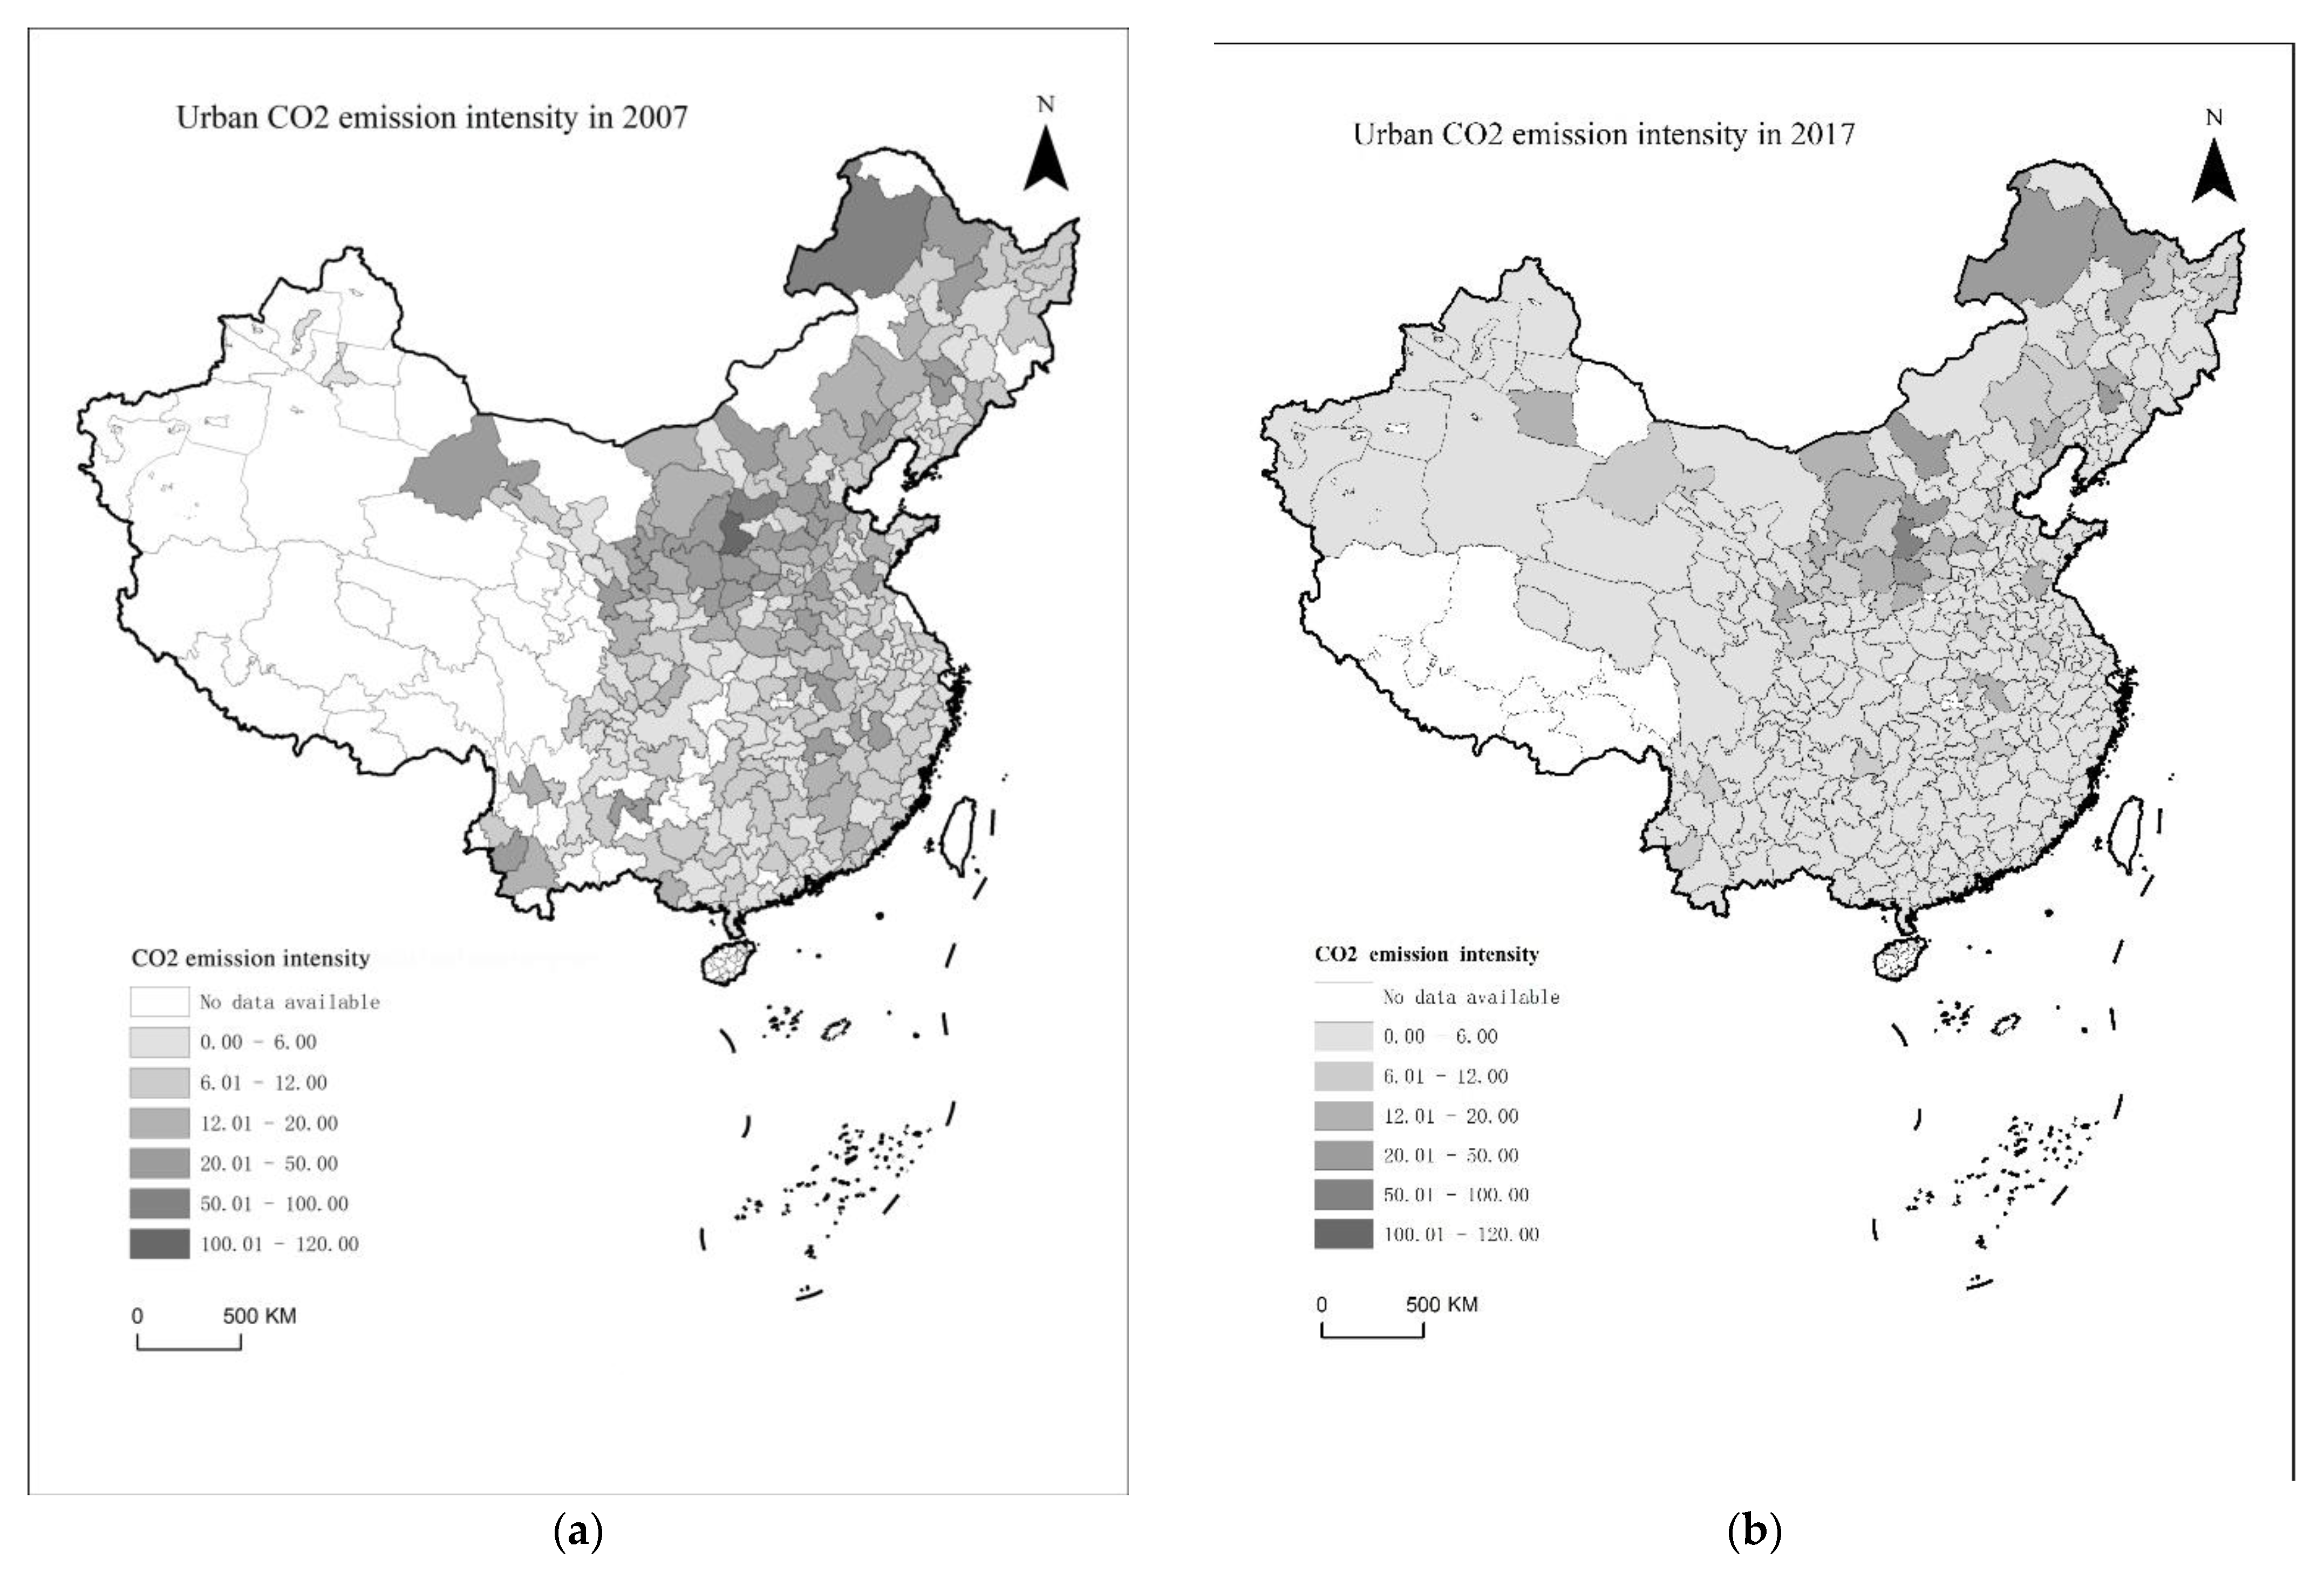
The overall pattern is “high in the north and low in the south”. Of the 290 cities for which data are available in 2017, two-thirds of the cities in the top 50 percent for carbon intensity are located in northern China. Most provinces with high carbon dioxide emission intensity were concentrated in the central, western, and northern regions where the economy was relatively less developed. In 2007, areas with the highest carbon dioxide emission intensity were mainly distributed in Shanxi, Inner Mongolia, and Ningxia. From 2007 to 2017, the carbon dioxide emission intensity of most cities decreased. The carbon emission reduction was particularly significant in some cities in the central regions, indicating that the carbon emission reduction measures at the urban level were relatively effective. The carbon dioxide emission intensity in 2017 shows that the areas with high carbon dioxide emission intensity were still concentrated in the central, western, and northern regions. The carbon dioxide emission intensity was the highest in Lyuliang City, Xinzhou City, and Linfen City in Shanxi Province, Heihe City in Heilongjiang Province, Hulunbuir City and Ulanqab City in Inner Mongolia Autonomous Region, Tieling City in Liaoning Province, and Linyi City in Shandong Province (Figure 6). Compared with the list of national resource-based cities published in the National Sustainable Development Plan for Resource-based Cities (2013–2020), most of the abovementioned cities are resource-based cities. Therefore, China’s urban carbon dioxide emission reduction policy should be adopted based on local conditions. The resource-based cities have more space for emission reduction. So they should actively promote the industrial restructuring and upgrading.

4. Empirical Results

4.1. Correlation Analysis

There is often a close correlation between economic variables. If the selection of explanatory variables is unreasonable, it will easily lead to the problem of multicollinearity in the model. To address this issue, we performed a correlation analysis of the variables. It can be seen from the results (Table 2) that there is no obvious correlation between the variables, so there is no multicollinearity in the model.

4.2. Benchmark Regression Analysis

In the initial test, the fixed effects of time and region are controlled. It can be seen from the result that the coefficient of industrial land-transfer price distortion is positive, and the distortion of industrial land-transfer price (Landdist) significantly promotes the increase in regional carbon emission intensity at the level of 5%. It can be known that the low-price transfer of industrial land by governments was not conducive to the development of a green and low-carbon economy (Table 3). Local governments realized the rapid economic development through the distortion of industrial land-transfer price, which would loosen the environmental regulations. Enterprises also only focused on the improvement of the output value. The short-term R&D investment and pollution control investment were ignored. The distortion of industrial land-transfer price had resulted in a large amount of high-quality land being occupied by low-efficient and extensive enterprises, which aggravated the mismatching of land resources. It was not conducive to the regional innovative development and the industrial structure upgrading. The results showed that the distortion of industrial land-transfer price had a significant positive impact on carbon emission intensity.
In terms of control variables, secondary industrial structure, energy intensity, opening-up level, per capita disposable income, and urbanization level all had significant impacts on urban carbon emission intensity. It also fully shows that economic growth would affect the environmental quality through scale effect, technical effect, and structure effect. The coefficient of the secondary industrial structure is significantly negative, indicating that a large proportion of the secondary industry would not necessarily lead to a high carbon emission intensity. Instead, favorable environmental regulations and other factors could help improve the energy utilization rate of the secondary industry. The coefficient of energy intensity was significantly positive, indicating that the improvement of energy utilization efficiency and other related technologies would help promote the reduction of carbon emission intensity. However, China’s new energy has not yet achieved the large-scale development and industrialization. Therefore, the energy utilization efficiency was low, making the carbon emission intensity increase. The coefficient of the opening-up level is significantly positive, indicating that the inflow of foreign investment was not conducive to the reduction of China’s carbon emission intensity, thus proving the existence of “pollution Haven Hypothesis” in China. The coefficient of per capita disposable income is significantly positive, indicating that the regional economic development level represented by the per capita disposable income could promote the increase in the carbon emission intensity. The economic scale effect was the dominant factor for a long time in the past. The coefficient of urbanization level is significantly negative, indicating that the accumulation of talents brought by the urban development would gradually reduce the carbon emission intensity with the improvement of the urbanization rate and quality.
In addition, a robustness test for the results was conducted. First, the data of Beijing, Tianjin, Shanghai, and Chongqing were eliminated based on the samples of prefectural and above cities, thus reducing the estimation bias caused by the extreme values in the samples. The regression result (1) was consistent with the basic regression. The basic regression results are robust from the perspective of changing the test of urban samples. Secondly, we standardized the deviation of the core variables as carbon dioxide emission intensity (CEI) and the distortion of industrial land-transfer price (Landdist), and the results were also consistent with previous results. The robustness of the results is confirmed. Finally, the carbon dioxide emission intensity was restricted in the industry. The intensity was measured by the amount of carbon dioxide emissions/the total industrial output value at a constant price. The results are consistent with previous benchmark regression results, thus confirming the robustness of the abovementioned results.

4.3. Heterogeneity Analysis

4.3.1. Regional Heterogeneity

To explore whether the impact of industrial land-transfer price distortion on carbon emission intensity in different regions is consistent, the prefecture-level cities in China are divided into the eastern, central, and western regions based on the classification standard of the National Bureau of Statistics. The impact of industrial land-transfer price distortion on carbon emission intensity is further discussed. It can be found through the analysis that the distortion of industrial land-transfer price in China’s central region had the strongest promoting effect on carbon emission intensity, followed by the eastern region. Additionally, the impact in the western region was weak (Table 4).
The distortion of industrial land-transfer price in the central region had a significant positive impact on urban carbon emission intensity at the level of 5%. Compared with the eastern region, the distortion of industrial land price in the central region had the largest positive effect on carbon emission intensity. The reason may be that the land index available to the central region was relatively lenient. The governments adopted an extensive investment attraction mode to pursue the rapid development of regional economy. As for the eastern industries, when considering the industry transfer, they gave priority to the central region compared with the western region with low development level. Consequently, the central region assumed the transfer of high energy-consuming and high-polluting industries from the eastern region and gained economic growth at the expense of environmental quality. On the other hand, the overall development foundation, and the value of industrial land in the central region were at an intermediate level. The gaming ability of local governments was also at an intermediate level, so the ability to attract investment was weaker than that in the eastern region. Local governments had to attract investments by lowering the bottom line such as the distortion of industrial land-transfer price, which further aggravated the passivation of industrial structure, hindered the improvement of energy efficiency, and increased the carbon emission intensity.
The positive effect of industrial land-transfer price distortion in the eastern region on carbon emission intensity was weaker than that in the central region. There may be two reasons. On one hand, the eastern region had a high level of industrialization development with a good location. Local governments had a strong gaming ability, and the entry threshold for enterprises was higher. To attract investments, local governments no longer simply relied on low-cost and extensive modes. Instead, they relied more on industrial chains, resource allocation, and license resource to fill the shortage of investment and other more effective way to attract investment and high-quality projects. On the other hand, the eastern region relatively lacked land resources. The intensive utilization rate of land was high. The distortion degree of land resource allocation was lower than that of other regions. Therefore, the positive effect of industrial land-transfer price distortion on carbon emission intensity in the eastern region was not as great as that in the central region. However, the carbon emission intensity in the western region was rarely affected by the distortion of industrial land-transfer price. It may be because that the western region was vast and sparsely populated, with weak industrial development foundation. It lacked capital, and the gaming ability of local governments was poor. Although the governments adopted more favorable policies for industrial land, the distortion degree of the transfer price was still high. However, the practical effect of investment attraction was not good. Therefore, the local carbon emission intensity was less correlated with the government’s low-price industrial land transfer.

4.3.2. Heterogeneity of Urban Scale

In 2014, the State Council issued the Notice on Adjusting the Criteria for Urban Scale Division, dividing cities into five categories and seven grades. In this paper, the classification was slightly adjusted and appropriately reduced. The classification criteria of urban permanent population were defined as three types: above 5 million (including 5 million), 1 to 5 million, and below 1 million (including 1 million). Correspondingly, cities are divided into “large cities”, “medium-sized cities”, and “small cities”. By analyzing the impact of industrial land-transfer price distortion on carbon emission intensity in accordance with urban scales, it can be found that the promotion effect of industrial land-transfer price distortion on carbon emission intensity is more significant in medium-sized cities (Table 5). In medium-sized cities, conditions such as convenient transportation, low costs of element circulation, and certain industrial foundations enabled the cities to attract investments through more favorable land policies. However, the production mode of medium-sized cities was quite homogenized. Low-end industries still dominated the market. The labor productivity was relatively low, inhibiting the upgrading of industrial structure. On the other hand, cities at the same level were more likely to have fierce competition with each other under the financial incentives and promotion incentives, which in turn intensified the resource mismatch and led to a continuous increase in carbon emission intensity [41].

4.3.3. Heterogeneity of Fiscal Self-Financing Degree

The fiscal self-financing degree can reflect the self-financial ability of local government. The government’s general public budget revenue/general public budget expenditure is used to define the fiscal self-financing degree. The samples are divided into two groups according to the ten-year average of the fiscal self- financing degree. One is prefecture-level cities with a fiscal self-financing degree in the bottom 50% and the other is prefecture-level cities with a fiscal self-financing degree in the top 50%. By exploring the impact of fiscal self-financing degree on how the distortion of industrial land-transfer price affects carbon emission intensity, it can be found that there were great differences in the impact of industrial land-transfer price distortion on carbon emission intensity in regions with different fiscal self-financing degrees. In regions with a low fiscal self-financing degree, the distortion of industrial land-transfer price would significantly increase the urban carbon emission intensity, while in regions with a high fiscal self-financing degree, the impact of industrial land-transfer price distortion was weak (Table 6).
After the reform of the tax-sharing system, the fiscal power of local governments declined, but their expenditure responsibilities increased. Faced with great financial pressure, local governments should take a series of measures to expand investments for the promotion of local GDP growth. The “two-way” land supply strategy was an essential method. On one hand, local governments transferred industrial land at low prices to satisfy the performance assessment such as investment attraction. On the other hand, they transferred commercial and residential land at high prices to maximize land financial revenues [42]. Generally, prefecture-level municipal governments which have a relatively high possibility of promotion were under great financial pressure, and the local government had stronger investment impulse to obtain performance through land finance. The greater the financial pressure, the easier for local governments to have short-sighted behaviors, and the greater dependence of local governments on land finance. The land resources under the intervention of local governments may not be effectively utilized, which may not flow to efficient enterprises. As a result, the mismatch of land resources was intensified, which inhibited the upgrading of industrial structure and the improvement of innovation abilities, finally increasing the carbon emission intensity.

4.4. Intermediate Mechanism Examination

In this paper, the industrial structure upgrading was divided into the rationalization of industrial structure and the advancement of industrial structure, which are substituted into the mediating effect model, respectively. The negative impact of industrial land-transfer price distortion on the advancement of industrial structure is significant, but the negative impact on the rationalization of industrial structure is not obvious, indicating that the advancement of industrial structure is an effective transmission mechanism for the impact of industrial land-transfer price distortion on carbon emission intensity (Table 7). The higher the distortion degree of industrial land-transfer price, the stronger the inhibitory effect on industrial structure upgrading. After the advancement of industrial structure is added as a mediator, the coefficient of industrial land-transfer price distortion becomes smaller than that of the benchmark regression, indicating that the mediating effect of industrial structure advancement exists. The distortion of industrial land-transfer price significantly inhibits the advancement development of industrial structure, which in turn promotes the increase in carbon emission intensity. There may be several reasons. First, to promote local GDP growth and increase budgetary revenue such as value-added taxes and business taxes in the promotion tournament, local governments preferred to transfer industrial land at low prices to promote the development of manufacturing industries. Although it can promote the rapid development of manufacturing industries, it also led to the excessive “industrialization” or heavy and chemical industrialization of local industrial structure. The energy consumption rose and the carbon emission intensity increased. Secondly, local governments paid more attention to quantity than quality in regional investment competition. A large number of low-efficiency and mid-and-low-end enterprises invested in industrial parks. There was a strong phenomenon of homogeneity. As a result, large numbers of elements flew to the capital-intensive heavy and chemical industry with high energy consumption and high output values or the low-level processing industry, hindering the advancement progress of industrial structure, namely, the transformation to the technology and knowledge intensive industry with low energy consumption and low pollution. As a result, the carbon emission intensity increased. At the same time, enterprises were prone to excessive investment when they acquired land at low costs. They were more inclined to maintain large-scale businesses to ensure the profits. As a result, the output of R&D innovation was low, the upgrading of the industrial structure slowed down, and the energy utilization rate was still at a low level, which in turn increased the carbon emission intensity. Furthermore, once local governments intervened in the land resources, it was easy to form a stable institutional environment, which would even gain momentum. Most cities in China have not yet entered the late stage of industrialization. The market intervention of local governments has led to large-scale agglomeration of low-end and medium-end industries within the cities, forming an industrial structure dominated by low-end and medium-end manufacturing industries, and causing a “lock-in effect”. The low-end and medium-end industries which would not be eliminated crowded out the resources of high-tech-intensive or emerging enterprises. It was difficult for high-efficient enterprises to enter efficiently, further hindering the upgrading of industrial structure, inhibiting the technological innovation, and increasing the carbon emission intensity.

5. Conclusions and Policy Implications

Based on the industrial land-transfer data and the carbon dioxide emissions data of cities at the prefecture level, this paper constructs the panel data of 196 cities in China from 2007 to 2017, and analyzes the distortion degree of industrial land-transfer price, the overall characteristics of carbon emission intensity, and the characteristics of spatial-temporal evolution. By constructing the multiple linear regression model, we demonstrated that the distortion of industrial land-transfer price can positively affect the carbon emission intensity. With the help of the mediating effect model, the internal impact mechanism of industrial land-transfer price distortion on carbon emission intensity is tested from the perspective of industrial structure upgrading. The main conclusions are as follows. (1) The areas with a high distortion degree of industrial land-transfer price were mainly located in the central and western regions of China and the northeast of China, where economic development was relatively poor; the overall carbon dioxide emission intensity had a pattern of “high in the north and low in the south”. The areas with a high intensity were mostly concentrated in the central and western regions where the economy was relatively less-developed, mainly in resource-based cities. (2) In terms of the overall effect, the distortion of industrial land-transfer price had a significant positive impact on carbon emission intensity. The higher the distortion degree of industrial land-transfer price, the less conducive to the development of a green and low-carbon economy. (3) The regional heterogeneity test shows that the impact of industrial land-transfer price distortion on carbon emission intensity was the most significant in the central regions, medium-sized cities, and cities with a low fiscal self-financing degree. (4) The high distortion degree of industrial land-transfer price can inhibit the upgrading of industrial structure, and further increased the carbon emission intensity.
The research findings have certain practical significance for promoting land factor marketization reform, promoting the optimization and upgrading of urban industrial structure, and achieving the green and low-carbon transformation. Based on the findings of this paper, the following policy recommendations are put forward for reference. First, considering the strong correlation between China’s land-transfer system and the upgrading of industrial structure, it is necessary to systematically and orderly promote the reform of land-transfer system, taking into account such factors as local financial pressure and promotion of government. Secondly, it is essential to deepen the land factor marketization reform, weaken the monopoly of local governments, and coordinate the relationship between the government and the market. It is crucial to consider developing a system for the transition of industrial land from current “policy pricing” to “market pricing”, thus alleviating the distortion of industrial land-transfer price, and promoting the transformation of industrial land from inefficiency to efficiency. Thirdly, for the central region, it is vital to avoid blindly undertaking low-efficient enterprises for the excessive pursuit of political achievements and short-term development benefits when the distortion of industrial land-transfer price is used to attract investments, which will lead to difficulties in future development and upgrading. The central region should make better use of the marketization of land resources allocation to dynamically adjust the development of industrial agglomeration, and try to adopt more effective methods to help the implementation of high-quality projects based on the original investment attraction. Taking the industrial chain investment as an example, the production chain of terminal products contains many complex modules and has a strong spatial stickiness. Therefore, during the investment attraction for some strategic emerging industries projects, market resources of the upper, middle, and lower reaches can be integrated to form an industrial chain cluster, thus optimizing the allocation, and improving the benefits.
Due to the space and data limitations, there are some topics that remain unexplored. First, for the discussion of the internal mechanism of the impact of industrial land-transfer price distortion on carbon emission intensity, this paper mainly discusses from the perspective of industrial structure upgrading. There was no specific analysis of the internal industrial structure upgrading of industrial sector. Secondly, the carbon emissions focused on the urban scale, and there was no one-to-one correspondence between land transfers and corporate carbon emissions. Finally, the internal mechanism of the impact of industrial land-transfer price distortion on carbon emission intensity also includes specific technical effects such as green innovative products, and there may be certain connections between different mechanisms. This paper did not discuss all the mechanisms. It was studied from the perspective of industrial structure upgrading, which is expected to be further improved in the follow-up research.

Author Contributions

Conceptualization, B.-y.G. and Z.-j.H.; methodology, T.-t.Z. and Z.-j.H.; validation, B.-y.G.; formal analysis, B.-y.G., Z.-j.H. and T.-t.Z.; investigation, T.-t.Z. and X.-y.S.; resources, T.-t.Z.; data curation, T.-t.Z.; writing—original draft preparation, B.-y.G., Z.-j.H. and T.-t.Z.; writing—review and editing, B.-y.G., Z.-j.H., X.-y.S. and M.-y.S.; visualization, X.-y.S., M.-y.S. and T.-t.Z. All authors have read and agreed to the published version of the manuscript.

Funding

Gao Bo-yang’s research was funded by the Natural Science Foundation of China, grant number 41871115; Huang Zhi-ji’s research was funded by the Natural Science Foundation of China, grant number 72274229.

Data Availability Statement

The data used in this study are from China Land Market Network (https://www.landchina.com/ (accessed on 6 March 2022)),China City Statistical Yearbook, the “City Annual Database” of the China Economic Net Statistical Database (https://www.cei.cn/ (accessed on 6 March 2022)),and the EPS database (eps Data Platform-Data Re-sources (https://www.epsnet.com.cn (accessed on 6 March 2022))).

Conflicts of Interest

The authors declare no conflict of interest.

References

  1. Wang, S.; Zhou, C.; Li, G.; Feng, K.H. CO2, economic growth, and energy consumption in China’s provinces: Investigating the spatiotemporal and econometric characteristics of China’s CO2 emissions. Ecol. Indic. 2016, 69, 184–195. [Google Scholar] [CrossRef]
  2. Tang, P.; Yang, S.; Fu, S. Do political incentive affects China’s land transfer in energy-intensive industries? Energy 2018, 164, 550–559. [Google Scholar] [CrossRef]
  3. Liu, Y.; Alm, J. Province-Managing-County’ Fiscal Reform, Land Expansion, and Urban Growth in China. J. Hous. Econ. 2016, 33, 82–100. [Google Scholar] [CrossRef] [Green Version]
  4. Li, H.B.; Zhou, L.A. Political turnover and economic performance: The incentive role of personnel control in China. J. Public Econ. 2004, 89, 1743–1762. [Google Scholar] [CrossRef]
  5. Deng, H.; Zheng, X.; Huang, N.; Li, F.H. Strategic Interaction in Spending on Environmental Protection: Spatial Evidence from Chinese Cities. China World Econ. 2012, 20, 103–120. [Google Scholar] [CrossRef]
  6. Huang, Z.H.; Du, X.J. Government intervention and land misallocation: Evidence from China. Cities 2017, 60, 323–332. [Google Scholar] [CrossRef]
  7. Hsieh, C.T.; Moretti, E. Housing constraints and spatial. Am. Econ. J. Macroecon. 2019, 11, 1–39. [Google Scholar] [CrossRef] [Green Version]
  8. Du, J.; Peiser, R.B. Land supply, pricing and local governments’ land hoarding in China. Reg. Sci. Urban Econ. 2014, 48, 180–189. [Google Scholar] [CrossRef]
  9. Meng, Y.; Zhang, F.R.; An, P.L.; Dong, M.L.; Wang, Z.Y.; Zhao, T.T. Industrial Land-use Efficiency and Planning in Shunyi, Beijing. Landsc. Urban Plan. 2008, 85, 40–48. [Google Scholar] [CrossRef]
  10. Du, J.; Mickiewicz, T. Subsidies, rent seeking and performance: Being young, small or private in China. J. Bus. Ventur. 2016, 31, 22–38. [Google Scholar] [CrossRef]
  11. Glaeser, E.L.; Kahn, M.E. The greenness of cities: Carbon dioxide emission and urban development. J. Urban Econ. 2010, 67, 404–418. [Google Scholar] [CrossRef] [Green Version]
  12. Zhou, L.; Tian, L.; Gao, Y.; Yingkai Ling, Y.K.; Fan, C.J.; Hou, D.Y.; Shen, T.Y.; Zhou, E.T. How did industrial land supply respond to transitions in state strategy? An analysis of prefecture-level cities in China from 2007 to 2016. Land Use Policy 2019, 87, 104009. [Google Scholar] [CrossRef]
  13. Yang, M.; Yang, F.X.; Sun, C.Y. Factor market distortion correction, resource reallocation and potential productivity gains: An empirical study on China’s heavy industry sector. Energy Econ. 2018, 69, 270–279. [Google Scholar] [CrossRef]
  14. Wu, H.; Guo, H.; Zhang, B.; Bu, M.L. Westward movement of new polluting firms in China: Pollution reduction mandates and location choice. J. Comp. Econ. 2017, 45, 119–138. [Google Scholar] [CrossRef]
  15. Lin, B.Q.; Chen, Z.Y. Does factor market distortion inhibit the green total factor productivity in China? J. Clean. Prod. 2018, 197, 25–33. [Google Scholar] [CrossRef]
  16. Ren, S.G.; Yuan, B.L.; Ma, X.; Chen, X.H. International trade, FDI (foreign direct investment) and embodied CO2 emissions: A case study of Chinas industrial sectors. China Econ. Rev. 2014, 28, 123–134. [Google Scholar] [CrossRef]
  17. Lv, J.K.; Sun, J.G. Temporal and Spatial Changes of Land Use in Donghe District of Baotou City and Its Impact on Ecological Environment. IOP Conf. Ser. Earth Environ. Sci. 2021, 766, 012067. [Google Scholar] [CrossRef]
  18. Francesco, T.; Fabio, I.; Marco, F. The Effect of Environmental Regulation on Firms’ Competitive Performance: The Case of the Building & Construction Sector in Some EU Regions. J. Environ. Manag. 2011, 92, 2136–2144. [Google Scholar]
  19. Baek, J. Environmental Kuznets curve for CO2 emissions: The case of Arctic countries. Energy Econ. 2015, 50, 13–17. [Google Scholar] [CrossRef]
  20. Théophile, A.; Francois, L.; Phu, N.V. Economic development and CO2 emissions: A nonparametric panel approach. J. Public Econ. 2006, 6, 1347–1363. [Google Scholar]
  21. Sun, L.L.; Cui, H.J.; Ge, Q.S. Will China achieve its 2060 carbon neutral commitment from the provincial perspective? Adv. Clim. Change Res. 2022, 13, 169–178. [Google Scholar] [CrossRef]
  22. Shobande, O.A. Decomposing the Persistent and Transitory Effect of Information and Communication Technology on Environmental Impacts Assessment in Africa: Evidence from Mundlak Specification. Sustainability 2021, 13, 4683. [Google Scholar] [CrossRef]
  23. Liu, J.H.; Li, J.H.; Ding, Y.T. Econometric analysis of the impact of the urban population size on carbon dioxide (CO2) emissions in China. Environ. Dev. Sustain. 2021, 23, 18186–18203. [Google Scholar] [CrossRef]
  24. Pan, B.B.; Zhang, Y.L. Impact of affluence, nuclear and alternative energy on US carbon emissions from 1960 to 2014. Energy Strategy Rev. 2020, 32, 100581. [Google Scholar] [CrossRef]
  25. Ling, Y.T.; Xia, S.M.; Cao, M.Q.; He, K.R.; He, K.R.; Lim, M.K.; Sukumar, A.; Yi, H.Y.; Qian, X.D. Carbon emissions in China’s thermal electricity and heating industry: An input-output structural decomposition analysis. J. Clean. Prod. 2021, 329, 0959–6526. [Google Scholar] [CrossRef]
  26. Yu, X.; Wu, Z.; Zheng, H.; Li, M.Q.; Tan, T.L. How urban agglomeration improve the emission efficiency? A spatial econometric analysis of the Yangtze River Delta urban agglomeration in China. J. Environ. Manag. 2020, 260, 110061. [Google Scholar] [CrossRef]
  27. Zhang, J.N.; Wang, J.L.; Yang, X.D.; Ren, S.Y.; Ran, Q.Y.; Hao, Y. Does local government competition aggravate haze pollution? A new perspective of factor market distortion. Socio-Econ. Plan. Sci. 2020, 76, 100959. [Google Scholar] [CrossRef]
  28. Li, W.X.; Fan, Y. Influence of green finance on carbon emission intensity: Empirical evidence from China based on spatial metrology. Environ. Sci. Pollut. Res. Int. 2022, 22, 23523. [Google Scholar] [CrossRef]
  29. Liu, X.J.; Jin, X.B.; Luo, X.L.; Zhou, Y.K. Multi-scale variations and impact factors of carbon emission intensity in China. Sci. Total Environ. 2022, 857, 159403. [Google Scholar] [CrossRef]
  30. Zhang, W.; XU, H.Z. Effects of land urbanization and land finance on carbon emissions: A panel data analysis for Chinese provinces. Land Use Policy 2017, 63, 493–500. [Google Scholar] [CrossRef] [Green Version]
  31. Van der Kamp, D.; Lorentzen, P.; Mattingly, D. Racing to the bottom or to the top? Decentralization, revenue pressures, and governance reform in China. World Dev. 2017, 95, 164–176. [Google Scholar] [CrossRef]
  32. Lin, B.; Abudu, H. Changes in Energy Intensity during the Development Process: Evidence in Sub-Saharan Africa and Policy Implications. Energy 2019, 183, 1012–1022. [Google Scholar] [CrossRef]
  33. Wang, H.; Chen, Z.; Wu, X.; Nie, X. Can a carbon trading system promote the transformation of a low-carbon economy under the framework of the porter hypothesis? —Empirical analysis based on the PSM-DID method. Energy Policy 2019, 129, 930–938. [Google Scholar] [CrossRef]
  34. Campbell, C.A.; Zentner, R.P.; Liang, B.C.; Roloff, G.; Gregorich, E.C.; Blomert, B. Organic C accumulation in soil over 30 years in semiarid southwestern Saskatchewan–Effect of crop rotations and fertilizers. Can. J. Soil Sci. 2000, 80, 179–192. [Google Scholar] [CrossRef]
  35. Bartelsman, E.; Haltiwanger, J.; Scarpetta, S. Cross-Country Differences in Productivity: The Role of Allocation and Selection. Am. Econ. Rev. 2013, 103, 305–334. [Google Scholar] [CrossRef] [Green Version]
  36. Meng, X.N.; Xu, S.C.; Zhang, J.N. How does industrial intelligence affect carbon intensity in China? Empirical analysis based on Chinese provincial panel data. J. Clean. Prod. 2022, 376, 134273. [Google Scholar] [CrossRef]
  37. Balli, H.O.; Sørensen, B.E. Interaction effects in econometrics. Empir. Econ. 2013, 45, 583–603. [Google Scholar] [CrossRef] [Green Version]
  38. Robins, J.M.; Greenland, S. Identifiability and exchangeability for direct and indirect effects. Epidemiol. 1992, 3, 143–155. [Google Scholar] [CrossRef] [Green Version]
  39. Chen, J.; Gao, M.; Cheng, S.; Liu, X.; Hou, W.X.; Song, M.L.; Li, D.; Fan, W. China’s city-level carbon emissions during 1992–2017 based on the inter-calibration of nighttime light data. Sci. Rep. 2021, 11, 3323. [Google Scholar] [CrossRef]
  40. Paul, K. Increasing Returns and Economic Geography. J. Political Econ. 1991, 99, 483–499. [Google Scholar]
  41. Yan, Y.; Liu, T.; Wang, N.C.; Yao, S.J. Urban sprawl and fiscal stress: Evidence from urbanizing China. Cities 2022, 126, 103699. [Google Scholar] [CrossRef]
  42. Zhang, X.L.; Lin, Y.L.; Wu, Y.Z.; Skitmore, M. Industrial land price between China’s Pearl River Delta and Southeast Asian regions: Competition or Coopetition? Land Use Policy 2017, 61, 575–586. [Google Scholar] [CrossRef]
Figure 1. Intermediation effects based on industrial structure upgrading.
Land 12 00092 g001
Figure 2. Land Sale Price Statistics by Type (2007–2017). Data Source: China Land and Resources Statistical Yearbook.
Land 12 00092 g002
Figure 3. Spatial evolution of the degree of distortion in the price of industrial land transfers (2007–2017). Note. The analysis unit is the national prefecture-level administrative units.
Land 12 00092 g003
Figure 4. CO2 emissions and intensity (2007–2017).
Land 12 00092 g004
Figure 5. CO2 emissions by sector (2007–2017).
Land 12 00092 g005
Figure 6. Spatial evolution of CO2 emission intensity (2007–2017). Note. The analysis unit is the national prefecture-level administrative units.
Land 12 00092 g006
Table 1. Research data explanation and sources (2007–2017).
VariableAbbreviationUnitMeanStandard ErrorMinMaxSample Capacity
Carbon emission intensitylnCEITons/billion11.0960.9227.82014.2433149
Degree of industrial land-transfer
distortion
Landdist-−0.0050.628−2.9860.9903525
Rationalization of
industrial structure
TL-0.1790.19401.9362804
Advancement of
industrial structure
Moore-6.7310.3255.3817.6073100
Opening-up levelopen-0.4950.05300.4802805
Energy intensityenergyMillion tons/billion yuan0.2820.2900.0097.8603149
Secondary industry structuresecondary%0.4950.1210.0970.9103101
Urbanization levelurban%0.5200.1500.17012545
Per capita disposable incomeincomemillion yuan1.6350.5420.5354.2603186
Table 2. Correlation analysis results.
lnCEILanddistOpenEnergySecondaryUrbanIncomeTLMoore
lnCEI1
Landdist0.129 ***1
open0.238 ***0.02101
energy0.176 ***0.129 ***−0.01401
secondary−0.146 ***0.233 ***−0.036 *0.062 ***1
urban−0.641 ***−0.180 ***−0.060 ***−0.057 ***−0.008001
income−0.581 ***−0.416 ***-0.0130−0.075 ***−0.098 ***0.647 ***1
TL0.194 ***−0.00900−0.045 **−0.119 ***−0.191 ***−0.449 ***−0.216 ***1
Moore−0.189 ***−0.296 ***0.098 ***0.062 ***−0.344 ***0.474 ***0.433 ***−0.613 ***1
The values in the parentheses represent the t-statistics; *, **, and *** indicate the significance levels of 10%, 5%, and 1%, respectively.
Table 3. Baseline regression result.
(1)(2)(3)
Landdist0.169 ***
(5.56)
0.031 ***
(3.32)
0.021 **
(2.51)
secondary −0.679 ***
(−10.19)
−0.949 ***
(−14.61)
energy 0.236 ***
(7.05)
0.256 ***
(8.50)
open 1.394 ***
(12.45)
1.364 ***
(13.59)
income −0.343 ***
(−32.72)
0.057 **
(2.43)
urban −2.429 ***
(−19.62)
−0.826 ***
(−6.20)
Constant11.060 ***
(646.41)
12.260 ***
(131.24)
10.043 ***
(75.00)
Urban fixed effectNOYESYES
Time fixed effectNONOYES
Sample capacity282620492049
R20.0110.9840.987
The values in the parentheses represent the t-statistics; ** and *** indicate the significance levels of 5% and 1%, respectively.
Table 4. Estimated results of the sub-area regression.
Eastern RegionCentral RegionWestern Region
Landdist0.023 *
(1.66)
0.026 **
(2.02)
−0.009
(−0.58)
secondary−0.977 ***
(−9.02)
−1.036 ***
(−11.66)
−0.860 ***
(−4.10)
energy0.322 ***
(6.44)
0.300 ***
(6.78)
0.067
(1.00)
open1.506 ***
(9.61)
0.836 ***
(5.45)
0.674
(1.16)
income0.090 ***
(3.07)
−0.058
(−1.12)
0.115
(1.36)
urban−1.003 ***
(−4.41)
−0.943 ***
(−5.21)
1.226 **
(2.43)
Constant10.108 ***
(49.53)
11.684 ***
(71.44)
10.204 ***
(35.34)
Urban fixed effectYESYESYES
Time fixed effectYESYESYES
Sample capacity950832267
R20.9870.9870.989
The values in the parentheses represent the t-statistics; *, **, and *** indicate the significance levels of 10%, 5%, and 1%, respectively.
Table 5. Estimation results from sub-city size regressions.
Small CitiesMedium−Sized CitiesLarge Cities
Landdist0.045
(1.32)
0.028 **
(2.34)
0.006
(0.51)
secondary−3.125 ***
(−8.71)
−0.885 ***
(−9.92)
−0.804 ***
(−8.10)
energy−0.131
(−0.64)
0.309 ***
(7.21)
0.175 ***
(4.24)
open2.619
(1.35)
1.448 ***
(10.58)
1.288 ***
(8.28)
income−0.052
(−0.45)
0.080 **
(2.15)
0.086 ***
(2.75)
urban0.807 *
(1.98)
−1.270 ***
(−5.63)
−0.505 **
(−2.19)
Constant12.578 ***
(45.37)
12.102 ***
(95.89)
9.714 ***
(41.77)
Urban fixed effectYESYESYES
Time fixed effectYESYESYES
Sample capacity501147838
R20.9900.9860.991
The values in the parentheses represent the t-statistics; *, **, and *** indicate the significance levels of 10%, 5%, and 1%, respectively.
Table 6. Estimation results of sub-fiscal self-sufficiency regressions.
Fiscal Self-Financing Degree above 50%Fiscal Self-Financing Degree below 50%
Landdist0.003
(0.25)
0.030 **
(2.58)
secondary−0.612 ***
(−5.89)
−1.461 ***
(−15.69)
energy0.380 ***
(7.97)
0.140 ***
(3.63)
open1.341 ***
(9.99)
1.359 ***
(8.40)
income0.080 ***
(2.77)
0.090 *
(1.84)
urban−0.379 **
(−2.24)
−1.787 ***
(−6.95)
Constant9.530 ***
(56.47)
12.511 ***
(75.35)
Urban fixed effectYESYES
Time fixed effectYESYES
Sample capacity1109849
R20.9890.988
The values in the parentheses represent the t-statistics; *, **, and *** indicate the significance levels of 10%, 5%, and 1%, respectively.
Table 7. An intermediate mechanism test of the effect of distortion in the price of industrial land concessions on carbon emission intensity.
Rationalization of Industrial Structure (TL) Advancement of Industrial Structure (Moore) Model (1)
Landdist−0.001
(−0.20)
0.018 **
(2.00)
−0.010 **
(−2.23)
0.020 **
(2.35)
0.021 **
(2.52)
TL 0.002
(0.06)
Moore −0.122 ***
(−2.88)
Control variablesControlControlControlControlControl
Time and region controlYESYESYESYESYES
R20.8960.9870.9700.9880.987
The values in the parentheses represent the t-statistics; ** and *** indicate the significance levels of 5% and 1%, respectively.
Disclaimer/Publisher’s Note: The statements, opinions and data contained in all publications are solely those of the individual author(s) and contributor(s) and not of MDPI and/or the editor(s). MDPI and/or the editor(s) disclaim responsibility for any injury to people or property resulting from any ideas, methods, instructions or products referred to in the content.