Abstract
Urban resilience assessment is crucial to guarantee the safe and stable operation of our cities. Looking at the whole process of emergencies from the occurrence, development, causing disaster losses to taking emergency response measures, we combine the danger of urban accident and disaster, the capacity of disaster-bearing carriers, and the emergency management capacity as the influencing factors. Taking Beijing as an example, considering the completeness of the relevant indicators and the difficulty of obtaining data, TOPSIS is used to construct a multi-factor comprehensive assessment model of urban safety resilience; At the same time, the important factors constraining the improvement of safety resilience are further analyzed by using the obstacle degree model. The results show that: among the 16 districts in Beijing, Chaoyang and Haidian districts have the highest level of safety resilience; the level of the degree of disaster tolerance among the multi-factors has the greatest impact on the level of urban safety resilience in Beijing; and the multifactorial comprehensive assessment model of urban resilience is able to reflect the urban resilience distribution, discover the weaknesses that exist in the development of urban safety and provide decision-making aids for the relevant city managers to carry out urban resilience construction.
1. Introduction
Currently, urbanization is an inevitable trend of industrialization and modernization, as well as an important strategic choice for China to achieve modernization. With 54% of the world’s population living in cities and more than 80% of GDP created by cities, the safety and stability of cities are crucial to global economic growth and healthy social development. At the same time, meanwhile, frequent natural disasters and accidental catastrophes pose serious challenges to the stability of urban systems. The report “Natural and Unnatural Disasters: The Economics of Effective Prevention,” [1] published by the World Bank and the United Nations, stated that urbanization will increase the exposure of cities to disasters. According to the report “Exposure and Vulnerability to Natural Disasters for World’s Cities,” as of 2018, there were 1860 cities of 300,000 or more people worldwide, with a total population of 2.5 billion, nearly 58% of whom are exposed to at least one of six types of disasters, including tornadoes, floods, droughts, earthquakes, landslides, and volcanoes, with a total population of 64% of the population of cities of statistical size [2].
The study and construction of safe and resilient cities have received much interest and attention from the global academic and physical communities to improve the vulnerability and risk reduction of cities and increase their resilience. Figure 1 shows the time profile of the urban resilience study. After launching the “Making Cities More Resilient” [3] campaign in 2010, the United Nations Office for Disaster Risk Reduction (UNDRR) was confirmed globally in 2018 to assess whether participating cities have increased their resilience and improved their urban safety resilience.
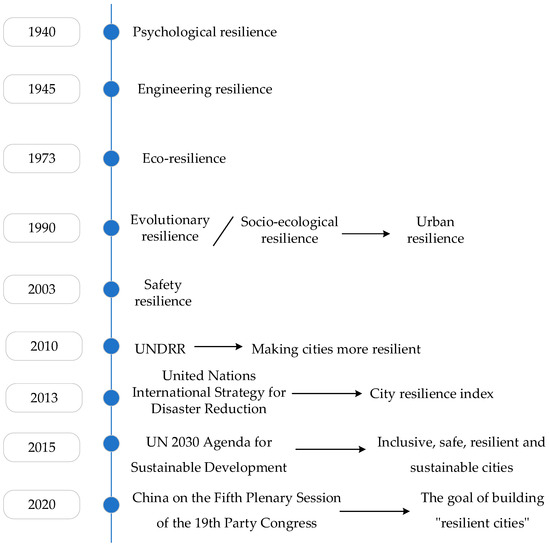
Figure 1.
Timeline of urban resilience research.
The United Nations 2030 Agenda for Sustainable Development calls on all countries to strengthen inclusive and sustainable cities [4], with “inclusive, safe, resilient and sustainable cities” explicitly listed as one of the key objectives by 2030. In March 2015, the International Organization for Standardization (ISO) formed a new Technical Committee on Standardization (ISO-TC292), which expanded the term “security” to “security and resilience.”1 In 2020, the “Proposal of the Central Committee of the Communist Party of China on Formulating the Fourteenth Five-Year Plan for National Economic and Social Development and the Long-term Goals for 2035” [5], which was reviewed and approved by the Fifth Plenary Session of the 19th Central Committee of the Communist Party of China, also clearly proposed the construction of “Resilient Cities”. Disasters are the common enemy of humankind, and one country’s efforts alone cannot improve global safety resilience in response to the ever-changing risks of disasters. Therefore, countries worldwide support many action policies and project activities to promote and build urban resilience [6], including the definition and interpretation of the concept of unified urban resilience, the reinforcement and improvement of urban lifeline systems, the assessment of possible disasters and accidents, and the promotion of urban resilience by multiple actors.
As most of the literature has described, the connotation of resilience has been transformed through a process of “engineering resilience [7,8]—ecological resilience [9,10]—evolutionary resilience [11,12]—cultural resilience [13]”, which has been tested by theory and practice, making the connotation of resilience has been continuously deepened. With the practice of urban resilience, a uniform definition of resilience and its interpretation within different fields might become less important, despite controversies and imprecision, but it is this conceptual ambiguity that has created the ability for various fields to fully apply divergent thinking to adopt a variety of strategies to address a wide range of threats [14]. In the context of the growing maturity of basic economic and social development, resilience as a new paradigm for safety science research has attracted the attention of scholars and experts [15]. In 1990, resilience theory was first combined with urban systems and was introduced into the field of urban planning and construction, expanding the horizon of urban risk-hazard research [16]. In 2003, Woods [17] first introduced the concept of “resilience” into the field of safety. Currently, the exploration of safe and resilient cities remains in the exploratory stage, and the framework, composition and evaluation of resilient cities are important parts of determining urban resilience goals, as well as an important basis for guiding sustainable and healthy urban development and enhancing urban resilience. The United Nations International Strategy for Disaster Reduction (UNISDR) has proposed a disaster resilience scorecard for cities [18], which is being promoted globally. The Rockefeller Foundation proposed the construction of the city resilience index [19] in the Global 100 Resilient Cities Innovation Project. Ruidong Zhao et al. [20], Chen, Han, S et al. [21]. Xinglin et al. [22] create a multidimensional indicator system to assess urban resilience in terms of the economic, social, institutional, ecological, and infrastructural dimensions, and to carry out a multidimensional assessment of urban resilience to identify the weaknesses of resilience in different dimensions. Quyang et al. [23] proposed a three-stage analysis framework, including resilience, absorption, and recovery based on the shape of the resilience curve, taking urban infrastructure as the research object. Fan Weicheng et al. [6] proposed a triangular model of urban safety resilience, which consists of three aspects: public safety events, urban disaster-bearing systems and safety resilience management. Yijun Shi et al. [24] constructed a framework for a complex urban system based on complex adaptive system (CAS) theory, combined with its seven basic characteristics from three aspects: system environment, system elements and system structure. Lang Huang [25] constructed a conceptual model of the system safety resilience system in three dimensions on the basis of which a mathematical model of system safety resilience assessment was constructed. Riccardo Patriarca et al. [26] proposed a simulation model combining simple indicators through absorption, adaptation and recovery, focusing on the resilience of the system at the technical level. The idea of safety and resilience as the core of urban safety governance has been adapted to the requirements of the times to improve the overall resilience and safety of cities, as well as sustainable development.
In the construction of safe and resilient cities, scholars have conducted in-depth research on the theoretical study of resilience to practical application, forming a set of more systematic research systems. However, there is currently no unified understanding of the conceptual definition of a safe and resilient city; In terms of research methods, more qualitative research is favoured, while quantitative research is relatively lacking. The factors considered in the evaluation of urban safety and resilience are not sufficiently comprehensive, including the lack of research on pre-disaster prevention, disaster relief material input and post-disaster recovery and adaptability. On this basis, the authors analyse the development law of safety and resilient cities, emphasize the negative impacts of hazards and vulnerability on urban safety functions, consider the coping capacity of urban safety systems, identify the key factors affecting safe and resilient cities, explore the structural relationships among the factors, construct corresponding evaluation mechanism models and metrics, and finally verify the scientificity and validity of the models through applications.
2. The Mechanism of Action of Resilient Cities
Although there are some differences in the conceptual framework of safe urban resilience, the core features can be broadly summarized as follows: a safe and resilient city is a city that has the ability to withstand, adapt, quickly recover, learn, and recreate in an inverted environment, with an emphasis on the urban capacity to adapt to uncertainties [6]. When a city is subject to external disturbances, the mechanism of action of a resilient city can be summarized as three stages: resisting/sustaining-adaptation/recovery—learning transformation. A visual decomposition of the stages of the urban resilience mechanism is shown in Figure 1 [27].
In Figure 2, Li Tongyue et al. [27] analyzed the level of urban resilience by introducing a resilience index to measure the level of urban resilience, quantitatively defining that the urban resilience index (RI) can be interpreted as the ratio of the percentage increase in urban resilience to the percentage increase in threat. The threat intensity refers to the degree to which disturbances within and outside the urban system cause serious harm and threat to social property, personal safety, political stability and social order in the urban system. Urban carrying capacity [28] is the maximum load that an urban system can withstand in the face of internal and external disturbances, including the carrying capacity of the city’s natural resources, environment and infrastructure for the city’s population and social activities, i.e., the ability to ensure the stability of the city’s main functional structures and the normal operation of production and life.
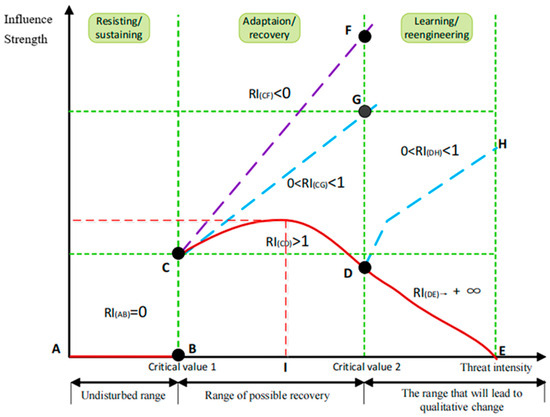
Figure 2.
Diagram of the mechanism of action of resilient cities Adapted from reference [27]. (Note: line AB, RI = 0; line CF, RI < 0; line CG, DH, 0 < RI < 1; line CD, RI > 1; line DE → +∞).
CR (city resilience) = Percentage increase in carrying capacity of urban systems/Percentage of enhanced threat.
The resilience scenarios for the different phases of the city are characterized by the existence of a critical value for the resilience of the city after a disturbance, with critical value 1 being RI = 1 and critical value 2 being the maximum limit for the destruction of the urban system. In the resist or sustain phase, the threat intensity is less than the critical value of 1, the “impact-intensity” function is AB, the line overlaps with the horizontal axis, and RI = 0. At this point, the urban system is not resilient at this time. In this stage, the urban system is resilient enough to sustain the threats within this range and is self-healing. The urban system does not need to make corresponding adjustments, so there is no resilience to speak of. In the adaptation or recovery stage, the threat is greater than the critical value of 1 and less than the critical value of 2. In this scenario, when RI < 0, the “impact-intensity” function is CF, indicating that, as the urban threat increases, the resilience of the urban system decreases rather than increase, and the city is unable to cope with the threat and lacks urban resilience. When 0 < RI < 1, the “impact-intensity” function is CG, which is a straight line with a positive slope, indicating that the increase in the city’s ability to withstand a threat is less than the increase in the threat, and the city shows initial resilience. With the increase in urban threats, the city’s ability to bear the threat gradually increases, but it cannot completely resist the increased threat intensity of cities.
When RI > 1, the “impact-intensity” function is CD, which is a quadratic function, indicating that for every 1% increase in urban threats, the increase in affordability is greater than 1%, and the urban system is more resilient at this time. When the reinforcement of the threat gradually increases the impact on the system, the urban system is affected by the degree of first strengthening and then gradually weakening, and the very strong urban resilient system adapts to external shocks through its own adjustment. This scenario is adaptation or recovery. In the learning or conversion stage, the threat intensity is greater than the critical value of 2, and the threat intensity of the system reaches the threshold value of the urban system; that is, the external disturbance intensity far exceeds the maximum capacity of the urban system. In this scenario, RI → +∞, the “impact-intensity” function is DE, which has a negative slope of a straight line, indicating that the city is capable of resisting external threats or ensuring complete recovery from shocks through its own transformation or learning, and it continues to develop under new external conditions, truly realizing a transformation from quantitative to a qualitative change in urban resilience. However, if the urban system cannot complete learning or reconstruction after the threat intensity reaches the critical value, then the qualitative change of urban resilience cannot be achieved in the face of shocks. At this time, 0 < RI < 1, infinitely close to 0, and the urban system gradually loses its resilience.
The above analysis shows that to maintain resilience, the urban “influence intensity” should be prevented from appearing in the C-F, C-G, and D-H trajectories, and the urban system’s “influence intensity” should be within any line segment A-B-C-D, within which the urban system can rely on self-resilience, gradually resolve the damage due to the threat disturbance, and return to the normal operation track. Therefore, from the perspective of safety management, when the city is in the resist/sustain phase, it should always provide the necessary early warning. Although the city system does not suffer from a large threat, it should also increase prevention, prediction and early warning regarding the weaknesses of the city system to prevent sudden damage caused by unexpected events due to these weaknesses. When the city is in the adaptation/recovery phase, the focus is on emergency management measures to reduce the vulnerability of the city’s disaster-bearing body and increase the city’s own capacity while minimizing the risk to the city system from emergencies, ensuring that the increase in the city’s capacity is always greater than the increase in the threat and maintaining the minimum resilience of the city system. When a city is in the learning/reengineering phase, it is necessary to continuously increase the capacity of the city system, but it is necessary to change the concept to cultivate a city system that adapts to new changes in the environment, guided by the goal of resilient cities. In general, in reality, it is not common for cities to suffer from threats that exceed the critical value of urban systems, so most city managers, from the perspective of safety management, should be more committed to reducing the vulnerability of urban carriers and enhancing the affordability of urban systems while undertaking emergency management measures to enhance the emergency response capacity of cities and greatly reduce the risk of emergencies; therefore, the safety and resilience of the urban system should be continuously and systematically improved. Through the above analysis of the mechanism of the role of safe and resilient cities, it is vital to increase the level of resilience of urban systems, improving their disaster-bearing capacity, and emergency response capacity and reducing the risk of disaster risk accidents.
3. Methodology
3.1. Construction of the Evaluation System
Academician Fan Weicheng [29], a member of the public safety scientific community, proposed a “triangular” theoretical model of the public safety system, which divides public safety into three parts, as shown in Figure 3 [30], first, the disaster and accident itself, which is the emergency; second, the object of the emergency, which is the carrier of the disaster; and third, the measures to be undertaken for the emergency, which is emergency management. There are also key factors inside the triangular framework, including material, energy and information, called disaster elements.

Figure 3.
Public safety triangle framework [26].
Emergencies are events and disasters that occur suddenly and on a large scale in a certain region, with a negative impact on society and posing a serious threat to life and property [31]. The emergencies in this thesis mainly refer to the two major types of emergencies, natural disasters and accidental disasters; triggered by disaster elements, whose danger is mainly reflected in the impact and threat posed to people, property and materials; with three characteristics of type, intensity and spatial and temporal characteristics; so the danger of urban system emergencies can be its danger directly expressed as the number of deaths, economic losses, and the number of accidents and disasters [32].
The disaster carrier is the object of the emergency, including people, objects, or systems. The strength of the disaster carrier itself directly affects the threat and loss caused by the occurrence of the emergency. The disaster carrier is the functional carrier for the sustainable and stable development of the urban system and the protection object of emergency management. Therefore, the disaster-carrying capacity of the urban system is reflected in four aspects: economic, social, human, and infrastructure [20,21,22,33,34].
Emergency management refers to various human interventions to prevent or reduce emergencies and their consequences. Emergency management can target emergencies themselves, thus reducing the frequency of emergencies or reducing the danger of the role of emergencies, and it can also be implemented for disaster-bearing carriers to greatly enhance cities’ own resilience to disasters. The level of urban emergency response capacity directly affects the ability of urban systems to respond to disasters [35]. Therefore, this thesis reflects the comprehensive emergency management capability in terms of grassroots prevention construction, safety and governance capability, social supervision services, press and publicity situation, and organization and institution construction [36,37].
Based on the above analysis of the role mechanism of resilient cities and drawing on the public safety triangle framework proposed by academician Fan Weicheng [26], this paper establishes an analysis model of urban safety resilience in three aspects—disaster bearing capacity, danger, and emergency ability—and determines the hierarchical structure of the indicator system (shown in Figure 4) on the basis of the indicator selection method. Specifically, it starts from four levels: the first-level indicators and the second-level indicators are established based on the understanding of the urban resilience mechanism and the triangle model of urban public safety. They constitute a general indicator system composed of a series of resilience dimensions. The next layer of indicators in the dimension constitutes the final specific indicator layer and serves as the main indicator factor for assessing the level of urban safety resilience. From the hierarchical structure of the indicator system in Figure 4, it can be seen that disaster-bearing capacity and emergency response capacity have a positive growth relationship with urban safety resilience, and risk and urban safety resilience have a negative growth relationship. The construction of the evaluation model system of Beijing’s safe and resilient city is shown in the flow chart in Figure 5, which follows the logical sequence of indicator system construction, weight determination, comprehensive level assessment, and cause analysis.
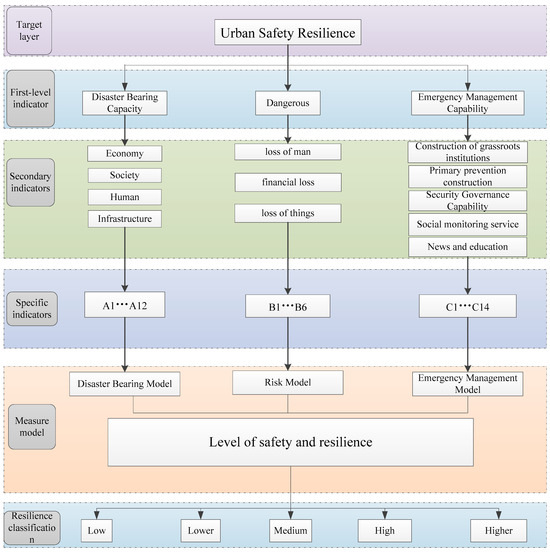
Figure 4.
Hierarchy of urban safety resilience metrics (Author Homemade).

Figure 5.
Flowchart model for this research.
3.2. Determination of Weights
3.2.1. Correlation Analysis
Indicator selection is the core step of evaluation system establishment, and indicator screening directly affects the scientific, systematic and comprehensive nature of an evaluation system. The selection of indicators is usually a process of selecting and optimizing indicators based on the evaluator’s understanding of the evaluation object and evaluation content, which is highly subjective. In this paper, by reading a large amount of literature, based on the mechanism of the role of resilient cities and the public safety triangle model, we make a selection according to the evaluation object and the evaluation content and establish a database of indicators, which can be used for the next screening of indicators. When screening indicators, this paper selects the method of correlation analysis to screen the selected indicators according to the law reflected by the data. Correlation analysis refers to the analysis of two or more variable elements with a correlation to measure the closeness of the correlation between two variable factors.
In order to more precisely screen the main influencing factors of Beijing’s urban safety and resilience assessment, this paper, on the basis of the seared indicator system, takes each criterion layer as the basic unit and conducts a correlation analysis of the indicators within the criterion layer and correlation analysis of every two indicators under the same indicator layer. In order to maintain an efficient representation of the information, the Pearson Correlation Index (R) [38] is calculated to measure the correlation between two variables X and Y based on the magnitude of R. Its value ranges between −1 and 1 which describes the strength of the linear correlation between the two variables, with a larger absolute value showing a stronger correlation. Where 0.8 to 1.0 very strong correlation; 0.6 to 0.8 strong correlation; 0.4 to 0.6 moderate correlation; 0.2 to 0.4 weak correlation; and 0.0 to 0.2 is extremely weak or no correlation (as shown in Table 1). The Pearson correlation coefficient was calculated using the formula shown below. where R is the Pearson correlation coefficient, and are the sample mean and sample standard deviation.

Table 1.
|R| characterisation correlation table [30].
3.2.2. Combinatorial Empowerment Method
- Analytic hierarchy process
The analytic hierarchy process (AHP), a combined qualitative and quantitative, systematic and hierarchical multi-objective decision analysis method, was proposed by American operations researcher Professor T.L. Satty in the 1980s and is applicable to transforming complex multiple elements into a pairwise comparison to determine the relative importance of the levels. The emergence of hierarchical analysis has brought great convenience to decision-makers in solving decision problems that are difficult to describe quantitatively [39].
Through the expert scoring method, seven experts were invited to compare the importance of factors at each level in the assessment index using the 1–9 scale method to obtain an initial importance comparison matrix. To eliminate subjective differences among experts, the seven initial importance comparison matrices were integrated. The final judgment matrix was obtained by calculating the geometric mean, and subjective weights were calculated according to the general steps of AHP. This process is mainly run through the hierarchical analysis aid yaahp. The main steps are as follows.
The main steps are as follows.
(1) Establish a recursive hierarchy. The urban safety resilience evaluation in the system is divided into three levels: target level, criterion level and factor level.
(2) Construction of the comparison matrix. Using the analytic hierarchy process to determine the index weight coefficients, for an element of the previous level, the comparison of the relative importance of each relevant element in that level is constructed. is the result of the comparison of the importance of element and element . Table 2 lists the nine importance levels introduced by Saaty and their assigned values, which is called the comparison matrix. It has the following properties.
Table 2.
Definition and explanation of the 1–9 proportional scale [31].
(3) Hierarchical single ranking. The comparison matrix is used to measure the importance between two different hierarchical levels. It can be obtained by calculating the eigenroots and eigenvectors of the judgement matrix, and the calculation process is as follows.
is the maximum feature root of , is the feature vector, and is the weight value of the corresponding element ordering.
(4) Consistency testing. The constructed comparison matrix is tested for consistency, where CR measures the consistency test result, and if CR < 0.1, the comparison matrix is consistent; otherwise, the judgment matrix must be readjusted. The calculation process is as follows.
- 2.
- Entropy method
“Entropy” is a physical term in thermodynamics that was introduced into information theory by Claude Shannon, the father of information theory, and it has been widely used in many fields. Defined as the probability of occurrence of a discrete random event, the more ordered a system is, the lower the information entropy; similarly, the more chaotic a system is, the higher the information entropy. Information entropy is considered as a measure of the degree of orderliness of a system. It represents the most stable internal state of a system when it is not influenced by external disturbances. The entropy method is a method of determining the weight of an indicator by the dispersion of the data of multiple indicators [40]. The specific steps are as follows.
(1) Construct the original matrix. Select the number of zones and indicators; then is the jurisdiction of the j-th value of the indicator ( = 1, 2, …, ; = 1, 2, …, ).
(2) Data standardization. Different evaluation indicators often have different scales and scale units between them, and such a situation can affect the results of data analysis. In order to eliminate the influence of the scale between indicators, data standardization is required to address the comparability between data indicators. After the raw data has been standardized, the indicators are in the same order of magnitude and are suitable for comprehensive comparative analysis. Min-max normalization, also known as discrete normalization, is a linear transformation of the original data that maps the data values to a new range between [min, max]. so that the result is mapped to the range [0, 1], achieving an isometric scaling of the original data. The advantage of this method is that it does not change the data distribution after processing the original data, the disadvantage is that when new data is added, it may lead to changes in max and min, which need to be redefined.
in Equation (1), is the standardized index value, is the value of the i-th jurisdiction of the j-th the raw data of the indicator, and and are the maximum and minimum values of the j-th indicator, respectively.
(3) Calculate the index weights. Calculate the proportion of the i-th jurisdiction in this indicator under the j-th indicator:
(4) Calculate the information entropy value. Calculate the information entropy value for the j-th indicator:
(5) Calculate the coefficient of variance for the j-th indicator.
(6) Calculation of indicator weight values :
- 3.
- Combined Empowerment Method
The hierarchical analysis method and the entropy method each have their own shortcomings and scope of application. In this paper, the two methods are combined to determine the weights of the indicator system, which can reflect the experts’ judgment on the importance of the indicators, and also reflect the information on the distribution of the indicator values and the internal links between the indicators using the indicator data. In order to find a balance between judges’ preferences and objective data, the combined weighting method is to combine the indicator weights obtained from the above two methods by adopting certain rules, and this method can improve the reliability of the weighting results to a certain extent. Therefore, this article chooses the combined empowerment method to determine the indicator weights [41], the main formula of which is:
where is the value of the combined weights, is the weight value obtained by the analytic hierarchy process, is the weight value obtained by the entropy method, is the proportion of subjective values in the combined weight, takes the value of 0.5, and the calculation of the subjective and objective methods is assigned equal weights.
3.3. Technique for Order Preference by Similarity to an Ideal Solution (TOPSIS)
The TOPSIS method was first proposed by C.L. Hwang and K. Yoon in 1981, and it is a method for ranking a finite number of evaluation objects according to their proximity to an idealized target and an evaluation method of the relative merits of existing objects [42]. Through the use of raw data information, combined with the normalised data normalisation matrix to calculate the distance between each evaluation objective and the positive and negative ideal solutions, the relative closeness of each objective to the positive and negative ideal solutions is obtained and ranked as a basis for evaluating the advantages and disadvantages of the objectives. If a plan is closer to the ideal optimal solution and farther away from the worst solution, it is considered to be better. TOPSIS method, as a commonly used decision-making method for multi-objective decision analysis of finite scenarios, has been widely used in various fields of evaluation and decision-making problems [43], including the successful application of urban attribute evaluation and other decision-making fields [44]. Research on urban resilience can be divided into general resilience and special resilience, in the field of general resilience research of cities, Zhang Zhen et al. applied the use of the TOPSIS model to evaluate the urban resilience of seven districts and three counties under the jurisdiction of Changchun City from 2016 to 2020 in order to achieve the sustainable development of the city [45]. Xun, XL et al. considered that the urban resilience evaluation is a mixed multi-attribute group decision-making problem, using a proposed evaluation model based on intuitionistic fuzzy set theory and TOPSIS method, applying the proposed method in an example of Dalian, and the results show the feasibility and effectiveness of the proposed method [46]. In the field of urban special resilience research: Li Dezhi et al. used the entropy weight TOPSIS method to construct an evaluation model of county resilience to flooding, obtained the county resilience index, and then quantitatively evaluated the level of resilience to flooding of 41 counties in Jiangsu Province from 2009 to 2020 [47]. Xiansheng Chen et al. used the subjective evaluation AHP (hierarchical analysis method) method and the objective evaluation TOPSIS (ideal solution similarity preference ranking technique) method based on the waterlogging scenario to evaluate the urban resilience of 16 districts in Shanghai mega-city [48]. It is a commonly used comprehensive evaluation method, which can improve the science, accuracy, and operability of multi-objective decision analysis. In this thesis, we propose to use the combined assignment-TOPSIS method to evaluate the safety resilience of 16 districts in Beijing, which can effectively correct the calculated weights and carry out comprehensive ranking, and the combination of the two methods can help to improve the accuracy of the evaluation results. However, as the research continues, the shortcomings of the TOPSIS method also gradually emerge, firstly, the data required for each indicator, corresponding to the selection of quantitative indicators will be difficult; secondly, there must be more than two research subjects before the user can be carried out [49].
- (1)
- Construct the original data matrix
There are m areas to be evaluated, and each area has n evaluation indicators, which can form the original data matrix X.
- (2)
- Determining the weighting of indicators. The results of the calculation of the indicator weights in combination with the portfolio assignment method.
- (3)
- Determine the optimal and inferior solution vectors.
Through the normalization matrix , the positive ideal solution and negative ideal solution of each evaluation index are determined separately, which are expressed as follows.
Positive ideal solution:
negative ideal solution:
where = (, , , ); = (, , , ); = 1, , .
- (4)
- Calculate the Euclidean distance between each index value and the positive and negative ideal solutionswhere denotes the Euclidean distance from the optimal solution, and denotes the Euclidean distance from the inferior solution.
- (5)
- Proximity calculation
Calculate the relative proximity of each evaluation object to the ideal solution.
according to the size of , the quality of the evaluation object is evaluated. ∈ (0, 1), the closer that is to 1, the higher that the level of safety resilience is in the area; in contrast, the closer that is to 0, the higher that the level of safety resilience is in the area. According to the literature and natural fracture points, this paper divides the degree of closeness into 5 grades (Very low, Low, Average, High, Very high.) to represent the safety and resilience level of 16 areas in Beijing.
3.4. Obstacle Degree Model
To clarify the shortcomings that restrict the development of urban safety and resilience in Beijing’s districts and counties, a obstacle degree model was applied to diagnose the main obstacle factors of safety and resilience development in Beijing [50,51]. The specific calculation steps are as follows.
(1) Factor contribution degree. The factor contribution degree indicates the weight of one-way indicators on the level of safe and resilient cities. In the formula, is the weight of the j-th index of the -th criterion layer. is the weight of the -th criterion layer where the -th indicator is located.
(2) Deviation of indicators. The deviation degree of indicator is the deviation of each indicator from the evaluation target of safe and resilient city development. is the standard value of an individual indicator.
(3) Obstacle degree. Obstacle degrees and denote the obstacle degrees of one-way indicators and categorical indicators for safe and resilient cities, respectively.
3.5. Data Sources
As the capital of the People’s Republic of China, Beijing is the political, economic, and cultural center of China, as well as a world-renowned center of international interaction. Beijing’s unique urban role and the overlapping of its multiple identities make it a megacity in China and a place where multiple risks are superimposed, making the study of safety resilience in Beijing of very special importance. Beijing is located in northern China, in the northern part of the North China Plain, bordered by Tianjin in the east and surrounded by Hebei Province in the other direction, within the developed coastal economic circle. Beijing has a total area of 16,410.54 km2, a resident population greater than 21 million, and a GDP of 3610.26 billion RMB in 2020. Beijing has 16 districts: Dongcheng District, Xicheng District, Chaoyang District, Fengtai District, Shijingshan District, Haidian District, Mentougou District, Fangshan District, Tongzhou District, Shunyi District, Changping District, Daxing District, Huairou District, Pinggu District, Miyun District, and Yanqing District. Figure 6 shows the distribution of the 16 districts in Beijing.
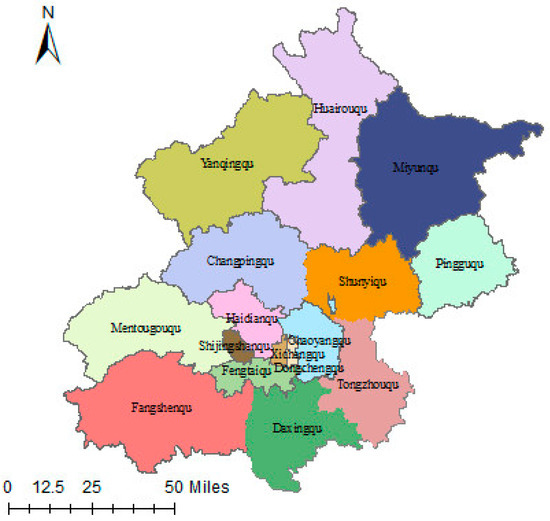
Figure 6.
Distribution of 16 districts in Beijing.
Considering the validity, availability, authenticity, and completeness of the data, this paper selects 2020 as the examination year and considers 16 district committees in Beijing as the research object, combined with the actual situation of each district in Beijing, the 2020 Beijing Statistical Yearbook, the 2020 China Regional Economic Statistical Yearbook, the Beijing Statistical Yearbook, the 2020 Beijing Statistical Bulletin on the Development of Emergency Management Business, the Beijing Municipal Government Work Report, the development bulletin of each district, and relevant network data. Individual missing data are provided by the mean value method.
4. Empirical Analysis
4.1. Determination of Evaluation Indicators
First, based on the existing indicator system, the definition of resilience, the mechanism of resilience, and the triangular framework of public safety, the guideline layer of indicators is divided into three aspects—disaster bearing capacity, danger and emergency response capacity—and the indicators are initially organized according to the connotation and characteristics of the guideline layer. The process of indicator selection followed the principles of personalization, scientificity, comprehensiveness, validity, and flexibility to delete and replace the indicators to ensure the integrity and scientificity of the indicator system. Second, on the basis of the preliminary sorting, each guideline layer was considered a basic unit and correlation analysis was conducted for every two indicators under the same indicator layer within the guideline layer. Correlations with an absolute value greater than 0.9 were considered significant and the indicators with a high degree of similarity were removed.
The correlation analysis of all indicators of disaster bearing capacity showed that the correlations of GDP per capita with the medical coverage rate and resident population density were 0.953 and 0.948, respectively, and the correlation between the rest of the indicators was less than 0.9, so the indicator GDP per capita was deleted (As shown in Table A1). In the analysis results of the indicator of danger, the correlation between the direct economic loss per capita and the direct economic loss rate of 100 million yuan GDP is 0.949, which is significant, so the indicator of the direct economic loss rate of 100 million yuan GDP is deleted (As shown in Table A2). The correlations between the indicators in the analysis results of emergency response capacity indicators are all less than 0.9, and the correlations are small, so there is no need to adjust the indicators (As shown in Table A3). After the correlation screening of indicators, the final results are shown in Table 3 and Table 4.
Table 3.
Information on the Safe and Resilient Cities guideline layer.
Table 4.
Information on the Safe and Resilient Cities indicator layer.
4.2. Measurement of the Level of Safety Resilience in Beijing
In order to accurately distinguish the level and difference of urban safety resilience, the urban resilience level standards under disasters are established, as shown in Table 5. According to Formulas (14) and (15), the distances and between the initial evaluation matrix and the positive and negative ideal solutions, as well as the fit degree between the initial evaluation matrix and the positive and negative ideal solutions, are obtained. The natural fracture point method was used to classify the magnitude of the fit as a representation of the different levels of urban safety and resilience.
Table 5.
Classification Criteria for Urban Safety Resilience Level.
TOPSIS is used to evaluate the safety resilience level of Beijing in 2020. According to Formulas (9) and (10), the distances between the state resilience level and the optimal solution and the worst solution in 16 districts of Beijing are calculated. Formula (11) calculates the proximity to the optimal solution. The results are shown in Table 6, and ArcGIS is used to visualize various data of Beijing’s safety resilience level, as shown in Figure 7a–d.
Table 6.
Ranking of safety resilience in 16 districts in Beijing.
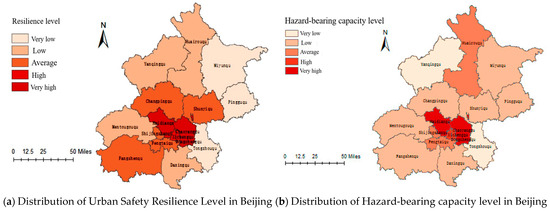
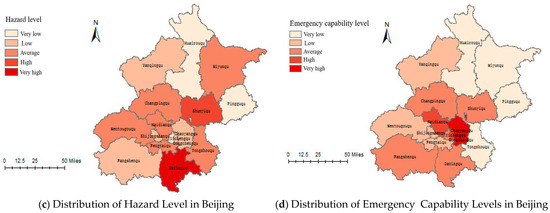
Figure 7.
Display of the overall level of safety resilience in Beijing in 2020.
Overall, the proximity of the 16 districts and counties in Beijing to the optimal vector can be seen (as shown in Table 6). Chaoyang District has the highest level of safety and resilience, with a value of 0.6783, followed by Haidian District, with a value of 0.5494. The lowest level of safety resilience is in Tongzhou District with a value of 0.1890, followed by Pinggu District with a value of 0.2113. Combined with the natural fracture point method, the safety resilience level of Beijing is divided into five levels: Very low, low, average, high, very high. To show the resilience levels of districts and counties in Beijing more impressively, ArcGIS is used. Figure 7a shows that Chaoyang District and Haidian District have very high resilience levels; Dongcheng District and Xicheng District have high resilience levels; Shijingshan District, Fengtai District, Fangshan District, Changping District, and Shunyi District have average resilience levels; Mentougou District, Huairou District, Daxing District, and Yanqing District have low resilience levels; and Miyun District, Pinggu District, and Tongzhou District have very low resilience levels.
Figure 7b shows the distribution of disaster-bearing capacity levels of 16 districts in Beijing. The map shows that very high level of disaster-bearing capacity is in Haidian District and Chaoyang District, followed by Dongcheng District and Xicheng District; Shijingshan District, Huairou District, and Fengtai District have a average level of disaster-bearing capacity; the low level of disaster-bearing capacity is in seven districts and counties, namely Mentougou District, Changping District, Shunyi District, Miyun District, Fangshan District, Pinggu District; and Daxing District; Yanqing District and Tongzhou District are at the very low stage of disaster-bearing capacity.
Figure 7c shows the hazard level distribution of 16 districts in Beijing. The figure shows that Daxing District was at the very high risk in 2020, that is, the most serious losses due to accident disasters; Shunyi District has the second highest hazard level after Daxing District; six districts with average hazard levels are Mentougou District, Fengtai District, Miyun District, Changping District, Tongzhou District, and Haidian District; Chaoyang District, Fangshan District, Dongcheng District, Shijingshan District, and Yanqing District have low hazard levels; and Huairou District, Xicheng District, and Pinggu District have the very low hazard levels.
Figure 7d shows the distribution of emergency response capacity levels of 16 districts in Beijing. The figure shows that Chaoyang District has the vety high level of emergency response capability; Dongcheng District and Haidian District are second only to Chaoyang District; Changping District, Daxing District, Fangshan District, Shunyi District, and Xicheng District are in the average level; Fengtai District, Mentougou District, Shijingshan District, and Yanqing District have poor emergency response capability; Miyun District, Huairou District, Tongzhou District, and Pinggu District are at the poorest level stage among the 16 districts and counties.
4.3. Diagnosis of Obstacle Degree of Safety Resilience Level in Beijing
The obstacle degree model is used to diagnose the obstacle factors affecting the development of safety and resilience in 16 districts of Beijing in 2020. First, according to the obstacle degree of the one-way index, the average value of the obstacle degree of each index is calculated (as shown in Figure 8); second, according to the size of the obstacle degree of the one-way index, the top 3 obstacle factors with obvious effects are identified (as shown in Table 7).
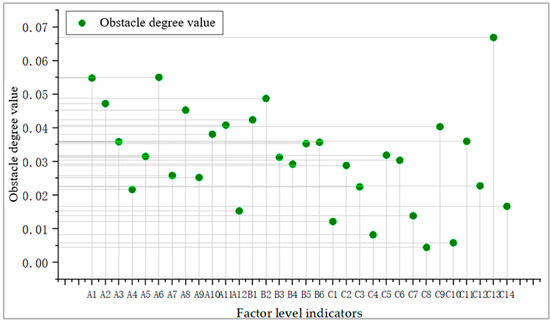
Figure 8.
Average obstacle degree of each indicator of the safety resilience level in Beijing.
Table 7.
The top three obstacle factors in the safety resilience level of each district in Beijing.
The obstacle degrees of each criterion layer indicator regarding the level of safe and resilient cities in Beijing show more consistent results, except for the obstacle degrees of the Xicheng District criterion layers, which are mainly hazard and emergency response capability. The main obstacle degrees of the other 15 districts and counties’ criterion layer are disaster bearing capacity and emergency response capability, and the average value of the obstacle degrees of the criterion layer is disaster bearing capacity (43.67%) > emergency response capability (34.07%) > hazardousness (22.26%). Additionally, combined with Figure 6, it can be seen that overall, by comparing the mean values of each obstacle degree for each indicator factor, the top three obstacle degree factors affecting the level of safety and resilience in Beijing are the number of safety production training and assessments, the medical insurance participation rate, and general public budget income, with mean values of 6.69%, 5.50%, and 5.48%, respectively. Therefore, the disaster-bearing capacity and emergency response capacity of Beijing’s urban system have a significant hindering effect on the improvement of Beijing’s safety resilience level, and the improvement of Beijing’s safety resilience level should focus on the city’s bearing capacity and emergency response capacity. In particular, we should strengthen the emphasis on the amount of safety training and assessment, the medical insurance participation rate, and the general public budget revenue.
First, the culture of personal safety in the industry, enterprises and residents must progress with the development of society and the advancement of science and technology; whether it is the progress of the country, the development of the city, or the operation of enterprises needed to prioritize safety. Safety education and training are prerequisites for ensuring safe production, which can cover the safety production process comprehensively, fully and completely, which is conducive to improving the safety production level of enterprises, effectively curbing the occurrence of accidents, greatly reducing the loss of people, property and materials, and reducing the danger to the city system, as well as improving the city’s ability to respond to accidents and disasters.
Second, as far as the medical insurance participation rate is concerned, in the field of product safety and public safety, medical insurance can provide a large amount of risk protection, improve the anti-risk ability and risk compensation level of the masses, and play a huge role in actively participating in the construction of disaster prevention and loss prevention systems. At the micro-level, the increase in the medical insurance participation rate can greatly reduce the loss of people who are the victims of accidents and disasters in the urban system and play an active role in disaster prevention and relief; at the macro-level, the medical insurance participation rate also plays a key role in the fields of medical safety, environmental governance, social management, public safety, and natural disaster prevention and management.
Finally, general public budget revenue is an important indicator of a country or city government’s financial strength, which can largely control the scope and quantity of public goods and services provided by the government in social and ecological economic activities. Then, in the construction of a safe and resilient city, the general public budget can directly determine the investment for urban risk disaster prevention and financial safety for disaster prevention, mitigation, and relief. Beijing’s general public budget revenue in 2020 decreased by 5.7% compared with 2019, mainly affected by the impact of the epidemic overlaid with the policy of tax reduction and fee reduction, so while coordinating epidemic prevention and control and safeguarding basic people’s livelihood, Beijing should adapt to the current situation of epidemic prevention and control as soon as possible and allow the public budget to play the role of a long-term mechanism to guarantee the safe operation of cities.
Combined with the operation rules of finance, the construction of urban disaster management mechanisms based on public finance includes normal operation mechanisms and extraordinary operation mechanisms, among which normal operation mechanisms include public finance daily operation mechanisms and public finance predisaster warning and prevention mechanisms; extraordinary operation mechanisms include public finance disaster response mechanisms and public finance postdisaster recovery and reconstruction mechanisms among normal and extraordinary operation mechanisms. Public finance supervision and inspection mechanisms are always in place. Efforts to realize the change from focusing on postdisaster relief input to focusing on predisaster input prevention effectively improve the legalization, standardization, and modernization of disaster prevention, mitigation, and relief work.
As seen from Table 7, in the first obstacle factor, the main obstacle factor in Chaoyang District, Dongcheng District, Xicheng District, Haidian District, and Fengtai District, is the number of beds per 10,000 people (one), mainly because the medical resources in the local region cannot meet the growing demand for health care, although the number of beds per 10,000 people in Dongcheng District, Xicheng District, Haidian District, and Fengtai District is relatively high compared to other districts and counties. However, because Beijing, as one of the districts, has one of the best medical conditions, and these areas are in the main urban area of Beijing, the medical resources in these areas must not only meet the needs of the local region but also face the needs of the people nationwide, so there is more pressure to seek medical treatment from other places. In Shijingshan District, Mentougou District, Fangshan District, Pinggu District, Huairou District, Miyun District, and Yanqing District, the main obstacle factor is the number of production safety training assessments. These areas for the development of new areas in Beijing are the distribution of industrial enterprises in Beijing. More areas, mainly in the process of enterprise development regarding the balance of business performance and safety level, should further improve the intensity and strength of enterprise safety training. Three management musts (management of industry management of safety, management of the business must manage safety, management of production and operation must manage safety) exist in the first place. In Tongzhou District, Shunyi District, Daxing District, and Changping District, the main obstacle factor is the number of accident disasters. The region in 2020 has 58 and 38 accidents and disasters compared to other regions, respectively, indicating that the level of safety risks in the region will be further strengthened.
In the second obstacle factor, the obstacle factor for Dongcheng District, Changping District, Fengtai District, Fangshan District, and Tongzhou District is the A6 health insurance participation rate. The reason for this is the overall low participation rate in these districts and the significant variation in internal medical insurance participation rates. In addition, the mobility of the region, age, education level, and nature of household registration all have a significant impact on the participation rate of the mobile population in local medical insurance. The obstacle factor for Pinggu District, Yanqing District, Huairou District, Shijingshan District, Mentougou District, and Miyun District is general public budget revenue, and the gap between the public budget revenue of this region and that of Chaoyang District and Haidian District is 51.164 billion yuan and 45.387 billion yuan in the main urban area, respectively, because the general public budget revenue of Beijing jurisdictions shows a decreasing trend from inside to outside. The obstacle factor for Shunyi District and Daxing District is direct economic loss from accidents and disasters; the region’s direct economic losses in 2020 are 43.15723 million yuan and 128.6143 million yuan, respectively, and the reason is that the region had 38 disaster accidents in 2020, which is a higher number of accidents and disasters, and another reason is that each accident and disaster loss is more tragic. The obstacle factor for Xicheng District, Chaoyang District and Haidian District is the number of general students in school per 10,000 people A8, which mainly shows that this area is that with the most abundant educational resources and the highest quality of education in Beijing, rich in university resources and concentrated in high-tech companies and enterprises, and it is a high-quality school district gathering children of intellectuals and high-income groups, which is the best schooling choice not only for students in Beijing but also for students nationwide, so the pressure brought by off-site schooling to this area is higher.
Regarding the third obstacle factor, Xicheng District, Fengtai District, Fangshan District, Tongzhou District, Pinggu District, Huairou District, Yanqing District and Mentougou have the obstacle factor of urban registered unemployment rate, mainly showing the increase in the number of unemployed urbanites in these regions. The key connotation of resilient cities is to be able to effectively respond to disasters and quickly resume social operations after disasters. People, as the most critical element in the operation of urban systems, play a very important role in the construction of safety and resilience and directly affect the positive operation of social systems. Affected by emergencies, such as the new crown pneumonia epidemic, the unemployment rate in these regions showed a higher status quo in 2020, seriously affecting the recovery, adaptation and adjustment of the system in urban safety resilience construction. The obstacle factors in Dongcheng District, Chaoyang District and Haidian District are the professional emergency rescue team, accident hidden danger investigation and management system hidden danger rectification rate, and disaster information, indicating that the region has a strong demand for emergency management institutions, safety production hidden danger investigations, professional personnel for natural disasters, etc., and the emergency management capacity of the region must be further strengthened and improved. The obstacle factors of Changping District, Shunyi District, Miyun District, Daxing District and Shijingshan District are urban electricity consumption per capita, showing that, although the comprehensive capacity of China’s post and telecommunications business is strong, there is still the problem of uneven development. In rescue and disaster relief, people’s production and life, search and rescue, medical care, water supply, communication and other instruments and equipment all use electricity as an energy source, and a reliable power supply material guarantee is necessary to achieve effective rescue and disaster relief. Therefore, in the process of resilient city construction, per capita electricity resources play a crucial role in the process of the urban system resisting and adapting to disasters.
5. Conclusions and Recommendations
5.1. Conclusions
Based on the public safety triangle model, this paper constructs an index system for safety resilient cities from three aspects: disaster bearing capacity, hazard and emergency response capacity; measures the level of safety resilience and the contribution of each index to the overall resilience of each district and county in Beijing in 2020 using the TOPSIS method; explores the obstacle factors affecting the level of safety resilience of each district and county in Beijing using the obstacle degree model; and draws the following conclusions.
(1) Based on the public safety triangle model proposed by Fan Weicheng [25,26], combined with the mechanism of urban resilience, a city safety and resilience assessment index system was established from three dimensions, including disaster-bearing bodies, hazards and emergency management, and the Beijing Statistical Yearbook 2019 and 2020, the Beijing Statistical Bulletin on the Development of Emergency Management Business 2019 and 2020 and the development bulletins of 18 districts and counties in Beijing were used as data sources to evaluate the level of safe and resilient cities in Beijing.
(2) Correlation analysis was used to screen the evaluation indices of secure and resilient cities, eliminating the indices with high correlations, selecting 32 important indices with strong independence as evaluation indices, and scientifically establishing the evaluation index system of secure and resilient cities.
(3) The safety resilience level of 16 districts and counties in Beijing was evaluated by the TOPSIS method, and the results showed that the highest level of safety resilience in 2020 in all districts and counties in Beijing was in Chaoyang District, followed by Haidian District, and the lowest level of safety resilience was in Tongzhou District, followed by Pinggu District.
(4) Using the obstacle degree model to diagnose the obstacle factors of the safety resilience level in Beijing, it was found that the average value of obstacles at the guideline level is: disaster tolerance (43.67 percent) > emergency response capacity (34.07 percent) > danger (22.26 percent); the top three obstacles affecting the level of safety resilience in Beijing are the number of people who have been assessed for safety training (6.69 percent), the rate of participation in medical insurance (5.50 percent), and the income from the general public budget (5.48 percent).
The limitations of this paper are: (1) the study of urban safety resilience in this paper is limited to the impact of two types of emergencies on cities, namely natural disasters and accidents and catastrophes. The current exploration of safe and resilient cities is at a preliminary stage, and future research on urban resilience will cover more of all disturbances that have an impact on the internal and external aspects of urban systems, and explore the study of safe and resilient cities from a multifaceted and complex perspective. (2) Due to the complex diversity of urban systems, all aspects of the urban system have an impact on urban resilience to some extent. However, the study of the resilience of urban systems is based on four relatively broad concepts—economic, engineering, ecological, and social—and the selection of specific indicators is based on official national and institutional data. In the case of the organisation, culture, political development, and demographic diversity of urban systems, no indicators have been selected due to the unavailability of data. Therefore, in the future, we will further investigate the impact of organisation, culture, political development [52], and demographic diversity [53] within urban systems on the resilience of urban safety. (3) At present, there are two methods for determining the weights of indicators in this study, but each of them still has some defects and deficiencies. The objective weighting method can often be obtained according to mathematical methods, with certain objective facts and theoretical foundations, but its consideration of real factors and dynamic changes in things is lacking, and the weights obtained may not be consistent with the real situation. Although the subjective weighting method can make corresponding changes according to the reality of things, it is greatly influenced by human factors. The weights given by different experts may be very different, and it is often not possible to judge which is right or wrong, therefore, there are many limitations in the practical application. Combined assignment method is a simple combination of the above two methods, so it is also subject to the limitations of these two methods at the same time. In the future, if there is a more accurate objective assignment method or a mechanism can be established to regulate the scoring standards of experts, it will have an important impact on the determination of indicator weights and the reliability of evaluation results.
5.2. Implications
(1) Construction of safety resilience level indicator system
Because different researchers and scholars have different understandings and research directions of safety resilient cities, there are often problems of incompleteness and poor adaptability in the selection of indicators; in addition, because different research areas have their own characteristics, the impact of their safety resilience indicators will also have a large difference, and thus it is difficult to find out what to focus on when selecting the indicators, and the results of the evaluation will become inaccurate as a result. Although this paper has carried out some exploration in this area, it is still limited by the data, so we hope that there will be a complete set of rules for selecting indicators or methods for screening indicators to improve the indicator system of safe and resilient cities in the future.
(2) Dynamic safety resilience assessment
In the future, it is necessary to carry out dynamic monitoring and assessment of safety resilience cities, strengthen the research on the resilience process of long time series, highlight the different time stages of urban safety resilience, and carry out dynamic research on the spatial distribution of the level of safety resilience of cities in different regions, scales, and functional types.
(3) Evaluation dimensions of safety resilience city
City resilience measurement dimensions need to be further expanded, such as the cultural dimension of resilience, culture is the soul of the city, is the city to achieve resilience development of the essential force, how to conduct resilience research on the city’s cultural dimensions, how to combine the city’s inner culture with the concept of resilient development of the city, all of these efforts are worth exploring in the future research. Therefore, the construction of resilient cities needs to pay attention to the shaping process of urban cultural power for the resilient development of cities, and cities need to have the cultural power to rise up and move forward after being disturbed by disasters.
5.3. Recommendations
Based on the above findings, the following observations and recommendations are made in this paper.
(1) Improving the defense capacity of urban systems
The defense capacity of urban systems is an important foundation for the safety of safe and resilient cities. First, the development of the urban economy directly affects social development, infrastructure construction, disaster prevention, and mitigation construction, as well as social safety investment and the level of experience strength is an important basis for the investment in urban defense against disasters. The regional differences in the resilience index are closely related to the differences in economic development in different regions. Therefore, economic growth should be guaranteed in the main urban area of Beijing, while the policy inclination should be increased to the regions outside the main urban area of Beijing, according to local conditions and regional advantages. Industrial structure adjustment should be promoted for the regions with lower economic levels, and economic development should be promptly restored, facilitating regional post-disaster recovery.
Second, the urban layout should be planned. Buffer zones should be established between towns and cities; risk isolation zones should be planned; risk sources that are difficult to relocate or transfer in urban center areas within urban areas should be isolated; the differentiation role of towns and cities should be enhanced; buffer space for the evolution and spread of risks should be reserve; and mountains, water systems, highways, waterways, etc., as well as open above-ground and underground spaces, should be used to form transition zones to promote disaster prevention, mitigation and resilience of towns and cities, integration of resources, and equalization. At the same time, to enhance the safety net technology system of urban systems, risk assessment, monitoring and early warning, rescue and disposal, comprehensive safety, etc., should be fully combined with the Internet of Things, big data, 5G communication, cloud computing, artificial intelligence, blockchain, and other new-generation information technology means, research and development of key technologies, equipment, and platforms.
(2) Improving the adaptive resilience of urban systems
The ability of urban systems to adapt and recover is an important prerequisite for a safe and resilient city. One priority is to build a normalized governance system for emergency management, enhance the robustness and reflexivity of the urban governance system, and integrate the conception, planning, and implementation of safe city resilience construction into the preparation and rehearsal of urban emergency plans, urban risk control, emergency disposal, and post-disaster recovery and reconstruction—especially to improve the design standards and management level of urban high-risk areas, particularly the redundant space preservation of urban lifeline projects. Areas with high-risk potential in the city, such as old buildings, should be regularly maintained, renovated, and rebuilt to reduce disaster damage from the source. The foresight and timeliness of urban resilience management should be enhanced, as well as the science of risk prevention and control, and the adaptive recovery ability of cities to cope with disasters should be improved.
Second, the urban disaster mitigation system should be improved and the emergency response capacity of the city should be enhanced. A highly efficient urban disaster mitigation system is the key to the survival of a safe and resilient city. Cities should take the initiative to set bright, clear, and prominent emergency indicator signs at emergency shelters, transfer routes, key intersections, and major arteries with a high density of residents to ensure that residents can find and reach shelters in a timely and rapid manner. Where conditions permit, emergency service stations in villages and communities should be established and equipped with the necessary emergency supplies, such as fire-fighting equipment, rescue tools, communication equipment, rescue tools, first-aid drugs, and living supplies, considering the local disaster situation, the actual situation and the number of people to ensure regular replacement, maintenance, and timely replenishment.
(3) Improving the transformational learning capacity of urban systems
Learning ability is the key to building a safe and resilient city for sustainable development, and cultural cultivation is an important means for the survival of safe and resilient cities. When an emergency occurs, those directly affected are people, and people are both victims and helpers in an emergency. Because there is a certain time lag in the initiation of emergency response, the first response for the directly affected and directly disposed is crucial. Therefore, it is necessary to pay attention to the leading and inculcating role of the soft environment of safety culture. The cultural construction of resilience can start with strengthening safety culture education, incorporating safety science and technology knowledge into education, and making full use of major platforms, including television, radio, newspapers, and the internet to spread popular science propaganda and improve people’s safety concepts, safety awareness and the ability to save themselves. In addition, we should pay attention to the cultivation of emergency talent, strengthen the cultivation of high-level professional talent, enrich emergency rescue teams, improve the emergency rescue capability, increase the proportion of funds invested in activities related to the cultivation of urban safety culture in the overall urban planning, enrich emergency supplies and equipment, and improve emergency rescue teams to meet the safety needs of the people. We should build a multilevel network of safety culture covering the “government-community-unit-individual” [54].
Author Contributions
Conceptualization, L.L. and J.P.; methodology, L.L., Y.L. and J.P.; data curation, L.L. and H.W.; writing—original draft preparation, L.L. and J.P.; writing—review and editing, L.L., J.P. and H.W. All authors have read and agreed to the published version of the manuscript.
Funding
This research was funded by the National Natural Science Foundation of China: “Research on the theory and method of urban accident disaster risk assessment and resilience prevention and control” (52004258).
Institutional Review Board Statement
Not applicable.
Informed Consent Statement
Not applicable.
Data Availability Statement
The evaluation data selected in this article are all derived from the “2020 Beijing Statistical Yearbook”, “2020 China Regional Economic Statistical Yearbook”, “2020 Beijing Municipal Statistical Bulletin on the Development of Emergency Management”, the work report of the Beijing Municipal Government, the development bulletins of various regions, and related network data, etc.
Conflicts of Interest
The authors declare no conflict of interest.
Abbreviations
| Pearson’s correlation coefficient | |
| Sample mean | |
| Sample standard deviation | |
| The result of the comparison of the importance of element i and element j | |
| Consistency Indicator. | |
| Consistency ratio | |
| Research subjects (16 districts in Beijing) | |
| Number of indicators | |
| Value of indicator for jurisdiction | |
| Positive and negative indicator treatment values | |
| Calculation of the share of the -th jurisdiction under the -th indicator for that indicator | |
| Information entropy | |
| Indicator weight values | |
| Weight values obtained from hierarchical analysis | |
| The weight values obtained by the entropy method | |
| Combined weight values | |
| TOPSIS raw matrix | |
| Positive ideal solution | |
| Negative ideal solution | |
| Euclidean distance from the optimal solution | |
| Euclidean distance from the worst solution | |
| Relative proximity of each evaluation object to the ideal solution |
Appendix A
Correlation Analysis Processing Results
Table A1.
Results of the Pearson correlation coefficient test for the disaster bearing capacity component.
Table A1.
Results of the Pearson correlation coefficient test for the disaster bearing capacity component.
| Pearson Correlation—Standard Format | |||||||||||||
|---|---|---|---|---|---|---|---|---|---|---|---|---|---|
| Disaster Bearing Capacity | (1) | (2) | (3) | (4) | (5) | (6) | (7) | (8) | (9) | (10) | (11) | (12) | (13) |
| GDP per capita (yuan/person) (1) | 1 | ||||||||||||
| General public budget revenue (billion yuan) (2) | 0.692 ** | 1 | |||||||||||
| Total industrial output value as a proportion of GDP (3) | 0.362 | 0.809 ** | 1 | ||||||||||
| Total industrial output value as a proportion of GDP (%) (4) | −0.570 * | −0.471 | −0.366 | 1 | |||||||||
| Per capita disposable income of residents (yuan) (5) | 0.827 ** | 0.754 ** | 0.573 * | −0.680 ** | 1 | ||||||||
| Urban registered unemployment rate (%) (6) | 0.729 ** | 0.428 | 0.311 | −0.629 ** | 0.579 * | 1 | |||||||
| Urban per capita electricity consumption (KW·h/person) A12 (7) | −0.063 | −0.205 | −0.248 | 0.147 | −0.466 | 0.167 | 1 | ||||||
| Number of hospital beds per 10,000 people (units) (8) | 0.838 ** | 0.385 | 0.002 | −0.543 * | 0.745 ** | 0.630 ** | −0.146 | 1 | |||||
| Ratio of social safety expenditure and employment to fiscal expenditure (%) (9) | 0.4 | 0.584 * | 0.572 * | −0.597 * | 0.668 ** | 0.496 | −0.157 | 0.391 | 1 | ||||
| Medical insurance participation rate (%) (10) | 0.953 ** | 0.563 * | 0.285 | −0.617 * | 0.804 ** | 0.839 ** | −0.072 | 0.892 ** | 0.442 | 1 | |||
| Number of students in general secondary schools per 10,000 people (11) | 0.850 ** | 0.345 | 0.14 | −0.439 | 0.517 * | 0.678 ** | 0.19 | 0.707 ** | 0.153 | 0.852 ** | 1 | ||
| Resident population density (persons/km2) (12) | 0.948 ** | 0.635 ** | 0.235 | −0.611 * | 0.857 ** | 0.666 ** | −0.202 | 0.899 ** | 0.48 | 0.921 ** | 0.746 ** | 1 | |
| Natural population growth rate (‰) (13) | −0.784 ** | −0.358 | −0.16 | 0.672 ** | −0.810 ** | −0.663 ** | 0.253 | −0.889 ** | −0.478 | −0.863 ** | −0.673 ** | −0.806 ** | 1 |
* p < 0.05 ** p < 0.01.
Table A2.
Results of the Pearson correlation coefficient test for the Dangerous component.
Table A2.
Results of the Pearson correlation coefficient test for the Dangerous component.
| Pearson Correlation—Standard Format | |||||||
|---|---|---|---|---|---|---|---|
| Dangerous | (1) | (2) | (3) | (4) | (5) | (6) | (7) |
| Umber of accidents and disasters (cases) (1) | 1 | ||||||
| Number of fatalities in production safety accidents (persons) (2) | 0.395 | 1 | |||||
| Accident disaster direct economic loss (million yuan) (3) | 0.363 | −0.012 | 1 | ||||
| The number of accidental disaster deaths year-on-year decline rate (%) (4) | −0.057 | −0.272 | 0.098 | 1 | |||
| Billion GDP mortality rate (%) (5) | −0.138 | −0.021 | −0.085 | −0.1 | 1 | ||
| Direct economic loss rate of 100 million GDP (6) | 0.294 | −0.07 | 0.981 ** | 0.04 | −0.02 | 1 | |
| Direct economic loss per capita (yuan) (7) | 0.349 | −0.072 | 0.984 ** | 0.15 | −0.077 | 0.949 ** | 1 |
** p < 0.01.
Table A3.
Results of the Pearson correlation coefficient test for the emergency response capacity.
Table A3.
Results of the Pearson correlation coefficient test for the emergency response capacity.
| Pearson Correlation—Standard Format | ||||||||||||||
|---|---|---|---|---|---|---|---|---|---|---|---|---|---|---|
| Emergency Response Capacity | (1) | (2) | (3) | (4) | (5) | (6) | (7) | (8) | (9) | (10) | (11) | (12) | (13) | (14) |
| Emergency management agency personnel (people) (1) | 1 | |||||||||||||
| Number of professional emergency rescue teams (people) (2) | −0.088 | 1 | ||||||||||||
| Disaster information officer (person) (3) | 0.556 * | −0.042 | 1 | |||||||||||
| Earthquake Disaster Reporters and Geohazard Surveyors (4) | 0.237 | 0.474 | 0.429 | 1 | ||||||||||
| Number of administrative law enforcement officers holding certificates (people) (5) | 0.555 * | −0.383 | 0.675 ** | 0.167 | 1 | |||||||||
| Administrative enforcement inspections per capita (pieces/person) (6) | −0.192 | −0.331 | 0.228 | −0.079 | 0.316 | 1 | ||||||||
| Workload per full-time safety officer (home/person) (7) | 0.234 | −0.552 * | −0.042 | −0.289 | 0.31 | −0.009 | 1 | |||||||
| safety inspection coverage (%) (8) | −0.029 | −0.077 | −0.054 | −0.123 | −0.314 | −0.544 * | 0.282 | 1 | ||||||
| The coverage rate of accident and hidden danger investigation and management systems (%) (9) | 0.308 | −0.396 | 0.106 | −0.205 | 0.499 * | 0.095 | 0.448 | 0.194 | 1 | |||||
| Correction rate of accidents and hidden dangers (%) (10) | −0.014 | 0.194 | −0.131 | 0.04 | 0.074 | −0.276 | −0.217 | −0.055 | 0.01 | 1 | ||||
| Coverage rate of safety risk assessment in key industry areas (%) (11) | 0.316 | −0.568 * | 0.510 * | −0.195 | 0.681 ** | 0.147 | 0.384 | −0.077 | 0.237 | −0.154 | 1 | |||
| Coverage rate of safety risk assessment in key industry areas (%) (12) | 0.005 | −0.449 | 0.047 | −0.395 | 0.33 | −0.151 | 0.259 | 0.316 | 0.487 | 0.308 | 0.257 | 1 | ||
| Number of safety training assessment personnel (people) (13) | 0.346 | −0.366 | 0.791 ** | 0.299 | 0.761 ** | 0.468 | 0.182 | 0.008 | 0.435 | −0.017 | 0.484 | 0.338 | 1 | |
| Administrative law enforcement personnel training exam pass rate (%) (14) | −0.051 | 0.047 | 0.246 | 0.166 | 0.323 | 0.275 | −0.324 | −0.372 | −0.027 | 0.3 | 0.222 | 0.066 | 0.306 | 1 |
* p < 0.05 ** p < 0.01.
Note
| 1 | Pei, J.; Liu, J. Evaluation of Chinese Enterprise safety production resilience based on a combined gray relevancy and BP neural network model. Sustainability 2019, 11, 4321. |
References
- Sanghi, A.; Ramachandran, S.; Fuente, A.; Tonizzo, M.; Sahin, S.; Adam, B. Natural Hazards, Unnatural Disasters: The Economics of Effective Prevention; The World Bank: Washington, DC, USA, 2010. [Google Scholar]
- United Nations, Department of Ecinomic and Social Affairs. Exposure and Vulnerability to Natural Disasters for World’s Cities. Available online: https://www.alnap.org/system/files/content/resource/files/main/TP2019-4.pdf (accessed on 13 April 2021).
- Amaratunga, D.; Sridarran, P.; Haigh, R. Making cities resilient (MCR) Campaign: Comparing MCR and non-MCRcities. In Global Assessment Report on Disaster Risk Reduction (GAR 2019); Mcglade, J., Ed.; United Nations Office for Disaster Risk Reduction (UNDRR): Geneva, Switzerland, 2019; p. 14. [Google Scholar]
- Lv, H. Release of China’s Progress Report on Implementing the 2030 Agenda for Sustainable Development. China Economic Times, 27 September 2021; p. T01. [Google Scholar]
- The Central People’s Government of the People’s Republic of China. Suggestions of the Central Committee of the Communist Party of China on Formulating the 14th Five-Year Plan for National Economic and Social Development and the Vision for 2035. Available online: http://www.gov.cn/zhengce/2020-11/03/content_5556991.htm (accessed on 28 August 2022).
- Fan, W. Development Trend of Safe and Resilient Cities. Labor Prot. 2020, 537, 20–23. [Google Scholar]
- Berkes, F.; Folke, C. Linking social and ecological systems for resilience and sustainability. In Linking Social and Ecological Systems: Management Practices and Social Mechanisms for Building Resilience; Berkes, F., Folke, C., Eds.; Cambridge University Press: Cambridge, UK, 1998; pp. 13–20. [Google Scholar]
- Wang, C.; Blackmore, M. Resilience concepts for water resource systems. J. Water Resour. Plan. Manag. 2009, 135, 528–536. [Google Scholar] [CrossRef]
- Holling, C.S. Resilience and Stability of Ecological Systems. Annu. Rev. Ecol. Syst. 1973, 3, 1–23. [Google Scholar] [CrossRef]
- Peterson, G.D. Scaling ecological dynamics: Self-organization, hierarchical structure, and ecological resilience. Clim. Chang. 2000, 44, 291–309. [Google Scholar] [CrossRef]
- Stringer, L.C.; Dougill, A.J.; Fraser, E.; Hubacek, K.; Prell, C.; Reed, M.S. Unpacking “participation” in the adaptive management of social–ecological systems: A critical review. Ecol. Soc. 2006, 11, 39. [Google Scholar] [CrossRef]
- Wilkinson, C. Social-ecological resilience: Insights and issues for planning theory. Plan. Theory 2012, 11, 148–169. [Google Scholar] [CrossRef]
- Rotarangi, S.J.; Stephenson, J. Resilience pivots: Stability and identity in a social-ecological-cultural system. Ecol. Soc. 2014, 19, 28. [Google Scholar] [CrossRef]
- Ainuddin, S.; Routray, J.K. Community resilience framework for an earthquake prone area in Baluchistan. Int. J. Disaster Risk Reduct. 2012, 2, 25–36. [Google Scholar] [CrossRef]
- Shamsuddin, S. Resilience resistance: The challenges and implications of urban resilience implementation. Cities 2020, 103, 102763. [Google Scholar] [CrossRef]
- Bloomberg, M. A Stronger, More Resilient New York; City of New York Mayor’s Office: New York, NY, USA, 2013. [Google Scholar]
- Pei, J.; Liu, W. Evaluation of Chinese Enterprise safety production resilience based on a combined gray relevancy and BP neural network model. Sustainability 2019, 11, 4321. [Google Scholar] [CrossRef]
- Li, R.; Huang, H.; Zhou, R. Urban Security Resilience Modeling Based on Resilience Curve. J. Tsinghua Univ. (Nat. Sci. Ed.) 2020, 60, 1–8. [Google Scholar]
- Spaans, M.; Waterhout, B. Building up resilience in cities worldwide–Rotterdam as participant in the 100 Resilient Cities Programme. Cities 2017, 61, 109–116. [Google Scholar] [CrossRef]
- Zhao, R.; Fang, C.; Liu, J.; Zhang, L. The evaluation and obstacle analysis of urban resilience from the multidimensional perspective in Chinese cities. Sustain. Cities Soc. 2022, 86, 104160. [Google Scholar] [CrossRef]
- Han, S.; Wang, B.; Ao, Y.; Bahmani, H.; Chai, B. The coupling and coordination degree of urban resilience system: A case study of the Chengdu–Chongqing urban agglomeration. Environ. Impact Assess. Rev. 2023, 101, 107145. [Google Scholar] [CrossRef]
- Chen, X.-L.; Yu, L.-X.; Lin, W.-D.; Yang, F.-Q.; Li, Y.-P.; Tao, J.; Cheng, S. Urban resilience assessment from the multidimensional perspective using dynamic Bayesian network: A Case Study of Fujian Province, China. Reliab. Eng. Syst. Saf. 2023, 238, 109469. [Google Scholar] [CrossRef]
- Ouyang, M.; Dueñas-Osorio, L.; Min, X. A three-stage resilience analysis framework for urban infrastructure systems. Struct. Saf. 2012, 36, 23–31. [Google Scholar] [CrossRef]
- Shi, Y.; Zhai, G.; Xu, L.; Zhou, S.; Lu, Y.; Liu, H.; Huang, W. Assessment methods of urban system resilience: From the perspective of complex adaptive system theory. Cities 2021, 112, 103141. [Google Scholar] [CrossRef]
- Huang, L.; Wu, C.; Wang, B. Modeling on shaping and assessment of system safety resilience. J. Saf. Sci. Technol. 2016, 12, 15–21. [Google Scholar]
- Patriarca, R.; De Paolis, A.; Costantino, F.; Di Gravio, G. Simulation model for simple yet robust resilience assessment metrics for engineered systems. Reliab. Eng. Syst. Saf. 2021, 209, 107467. [Google Scholar] [CrossRef]
- Li, T.Y.; Gu, C.L. Resilient Cities Index System in China. In Proceedings of the 2014 2nd International Conference on Social Sciences Research (SSR 2014 V6), Hong Kong, China, 10 December 2014; Singapore Management and Sports Science Institute: Singapore; Volume 6, pp. 74–79. [Google Scholar]
- Han, J.; Xia, Z. Study on the construction of a comprehensive capacity building system for disaster prevention, disaster resistance and disaster relief in China. Theor. Discuss. 2010, 153, 79–82. [Google Scholar]
- Fan, W.; Liu, Y.; Weng, W. The “triangle” framework and “4 + 1” methodology of public safety science and technology. Sci. Technol. Her. 2009, 27, 3. [Google Scholar]
- Wang, W.; Zhang, L.; Peng, T. Evaluation of a safe resilient City: A comparison of Hangzhou and Shaoxing, China. Sustain. Cities Soc. 2023, 98, 104798. [Google Scholar] [CrossRef]
- Chen, A.; Chen, N.; Ni, H. Modern Emergency Management Theory and Methods; Science Press: Beijing, China, 2009; pp. 2–3. [Google Scholar]
- Zhao, D.Y.; Chen, C.K.; Yi, L.; Lei, P.; Xu, L.L. Research on comprehensive assessment model of urban resilience with multi-factor. China Prod. Saf. Sci. Technol. 2022, 18, 54–59. [Google Scholar]
- Wang, J.; Gong, Q.; Yu, Y.; Yuan, S.; Chen, J.; Huang, G. Evaluation of the comprehensive disaster-bearing capacity of the Guangdong-Hong Kong-Macao Greater Bay Area urban agglomerations for natural disasters. Geogr. Res. 2020, 39, 2189–2199. [Google Scholar]
- Tariq, H.; Pathirage, C.; Fernando, T. Measuring community disaster resilience at local levels: An adaptable resilience framework. Int. J. Disaster Risk Reduct. 2021, 62, 102358. [Google Scholar] [CrossRef]
- Li, X.; Li, M.; Cui, K.; Lu, T.; Xie, Y.; Liu, D. Evaluation of Comprehensive Emergency Capacity to Urban Flood Disaster: An Example from Zhengzhou City in Henan Province, China. Sustainability 2022, 14, 13710. [Google Scholar] [CrossRef]
- Wang, K.; Wang, Z.; Deng, J.; Feng, Y.; Li, Q. Study on the evaluation of emergency management capacity of resilient communities by the AHP-TOPSIS method. Int. J. Environ. Res. Public Health 2022, 19, 16201. [Google Scholar] [CrossRef]
- Cheng, F.; Wang, C.; Yuan, X. Assessment of urban emergency management capability from the perspective of safety development. Chin. J. Saf. Sci. 2023, 33, 158–167. [Google Scholar]
- Chen, C.F. Assessment of the effectiveness of monetary policy in China—An analysis based on Pearson’s correlation coefficient. China Bus. J. 2020, 805, 48–49. [Google Scholar]
- Fu, B.; Zhan, X.; Lei, G. Safety Evaluation of Chemical Machinery System Based on AHP-Cloud Model. Saf. Environ. Eng. 2020, 27, 142–146. [Google Scholar]
- Ye, T.; Jin, H.; Min, A. Evaluation of the efficiency of agricultural modernization development under the strategy of ruralrevi talization—Based on the combined analysis of super-efficiency DEA and comprehensive entropy method. Issues Agric. Econ. 2021, 3, 100–113. [Google Scholar]
- Gai, M.; Yan, S.; Cheng, Z.; Qu, S.; Zhao, X. Evaluation of the Effectiveness of the Combinatorial Empowerment TOPSIS Anti-Missile Early Warning System. Firepower Command. Control 2020, 45, 43–47. [Google Scholar]
- Zhang, Y.; You, W. Research on the evaluation of social vulnerability to urban natural disasters based on TOPSIS: Taking Shanghai as an example. Disaster Sci. 2014, 29, 109–114. [Google Scholar]
- Jiang, F.; Zhou, S.; Wu, Z.; Zhong, J.; Zhang, S.; Zhang, X. Analysis of coal mine safety investment decision based on entropy weight-TOPSIS method. Chin. J. Saf. Sci. 2021, 31, 24–29. [Google Scholar]
- Qiao, H.; Pei, J. Urban stormwater resilience assessment method based on cloud model and TOPSIS. Int. J. Environ. Res. Public Health 2021, 19, 38. [Google Scholar] [CrossRef] [PubMed]
- Zhang, Z.; Zhang, Y.; Zhang, J.; Lang, Q.; Yan, J.; Duan, C. Urban resilience assessment based on entropy weight method and TOP SIS model—The case of Changchun City. Disaster Sci. 2023, 38, 213–219. [Google Scholar]
- Xun, X.; Yuan, Y. Research on the urban resilience evaluation with hybrid multiple attribute TOPSIS method: An example in China. Nat. Hazards 2020, 103, 557–577. [Google Scholar] [CrossRef]
- Li, D.; Nie, S.; Zhu, S.; Zhou, S. Quantitative evaluation and spatial-temporal evolution of county resilience to flooding—A case study of Jiangsu Province. Disaster Sci. 2023, 99–106. [Google Scholar]
- Chen, X.; Jiang, S.; Xu, L.; Xu, H.; Guan, N. Resilience assessment and obstacle factor analysis of urban areas facing waterlogging disasters: A case study of Shanghai, China. Environ. Sci. Pollut. Res. 2023, 30, 65455–65469. [Google Scholar] [CrossRef]
- Zhang, K.; Liang, X.; Wei, H.; Liu, S.; Su, K. An improved TOPSIS-ANP composite shielding material performance evaluation method based on gray relational projection algorithm. Front. Energy Res. 2023, 10, 1102997. [Google Scholar] [CrossRef]
- Shan, S.; Xu, H.; Yang, L.; Qi, X.; Chen, T.; Chen, S.; Gao, Y. Analysis of the interannual variation characteristics and influencing factors of ecological carrying capacity in Qilian Mountains National Park. J. Grassl. 2022, 10, 1–16. [Google Scholar]
- Yang, H.; Tan, Y.; Sun, X.; Cheng, X.; Liu, G.; Zhou, G. Comprehensive evaluation of water resources carrying capacity and analysis of obstacle factors in Weifang City based on hierarchical cluster analysis-VIKOR method. Environ. Sci. Pollut. Res. 2021, 28, 50388–50404. [Google Scholar] [CrossRef] [PubMed]
- Shahab, S.; Hartmann, T.; Jonkman, A. Strategies of municipal land policies: Housing development in Germany, Belgium, and Netherlands. Eur. Plan. Stud. 2021, 29, 1132–1150. [Google Scholar] [CrossRef]
- Hartmann, T.; Jehling, M. From diversity to justice–Unraveling pluralistic rationalities in urban design. Cities 2019, 91, 58–63. [Google Scholar] [CrossRef]
- Wang, Y. Research on urban security risk governance strategies in the new era from the perspective of resilience. Leadersh. Sci. 2020, 16, 37–40. [Google Scholar]
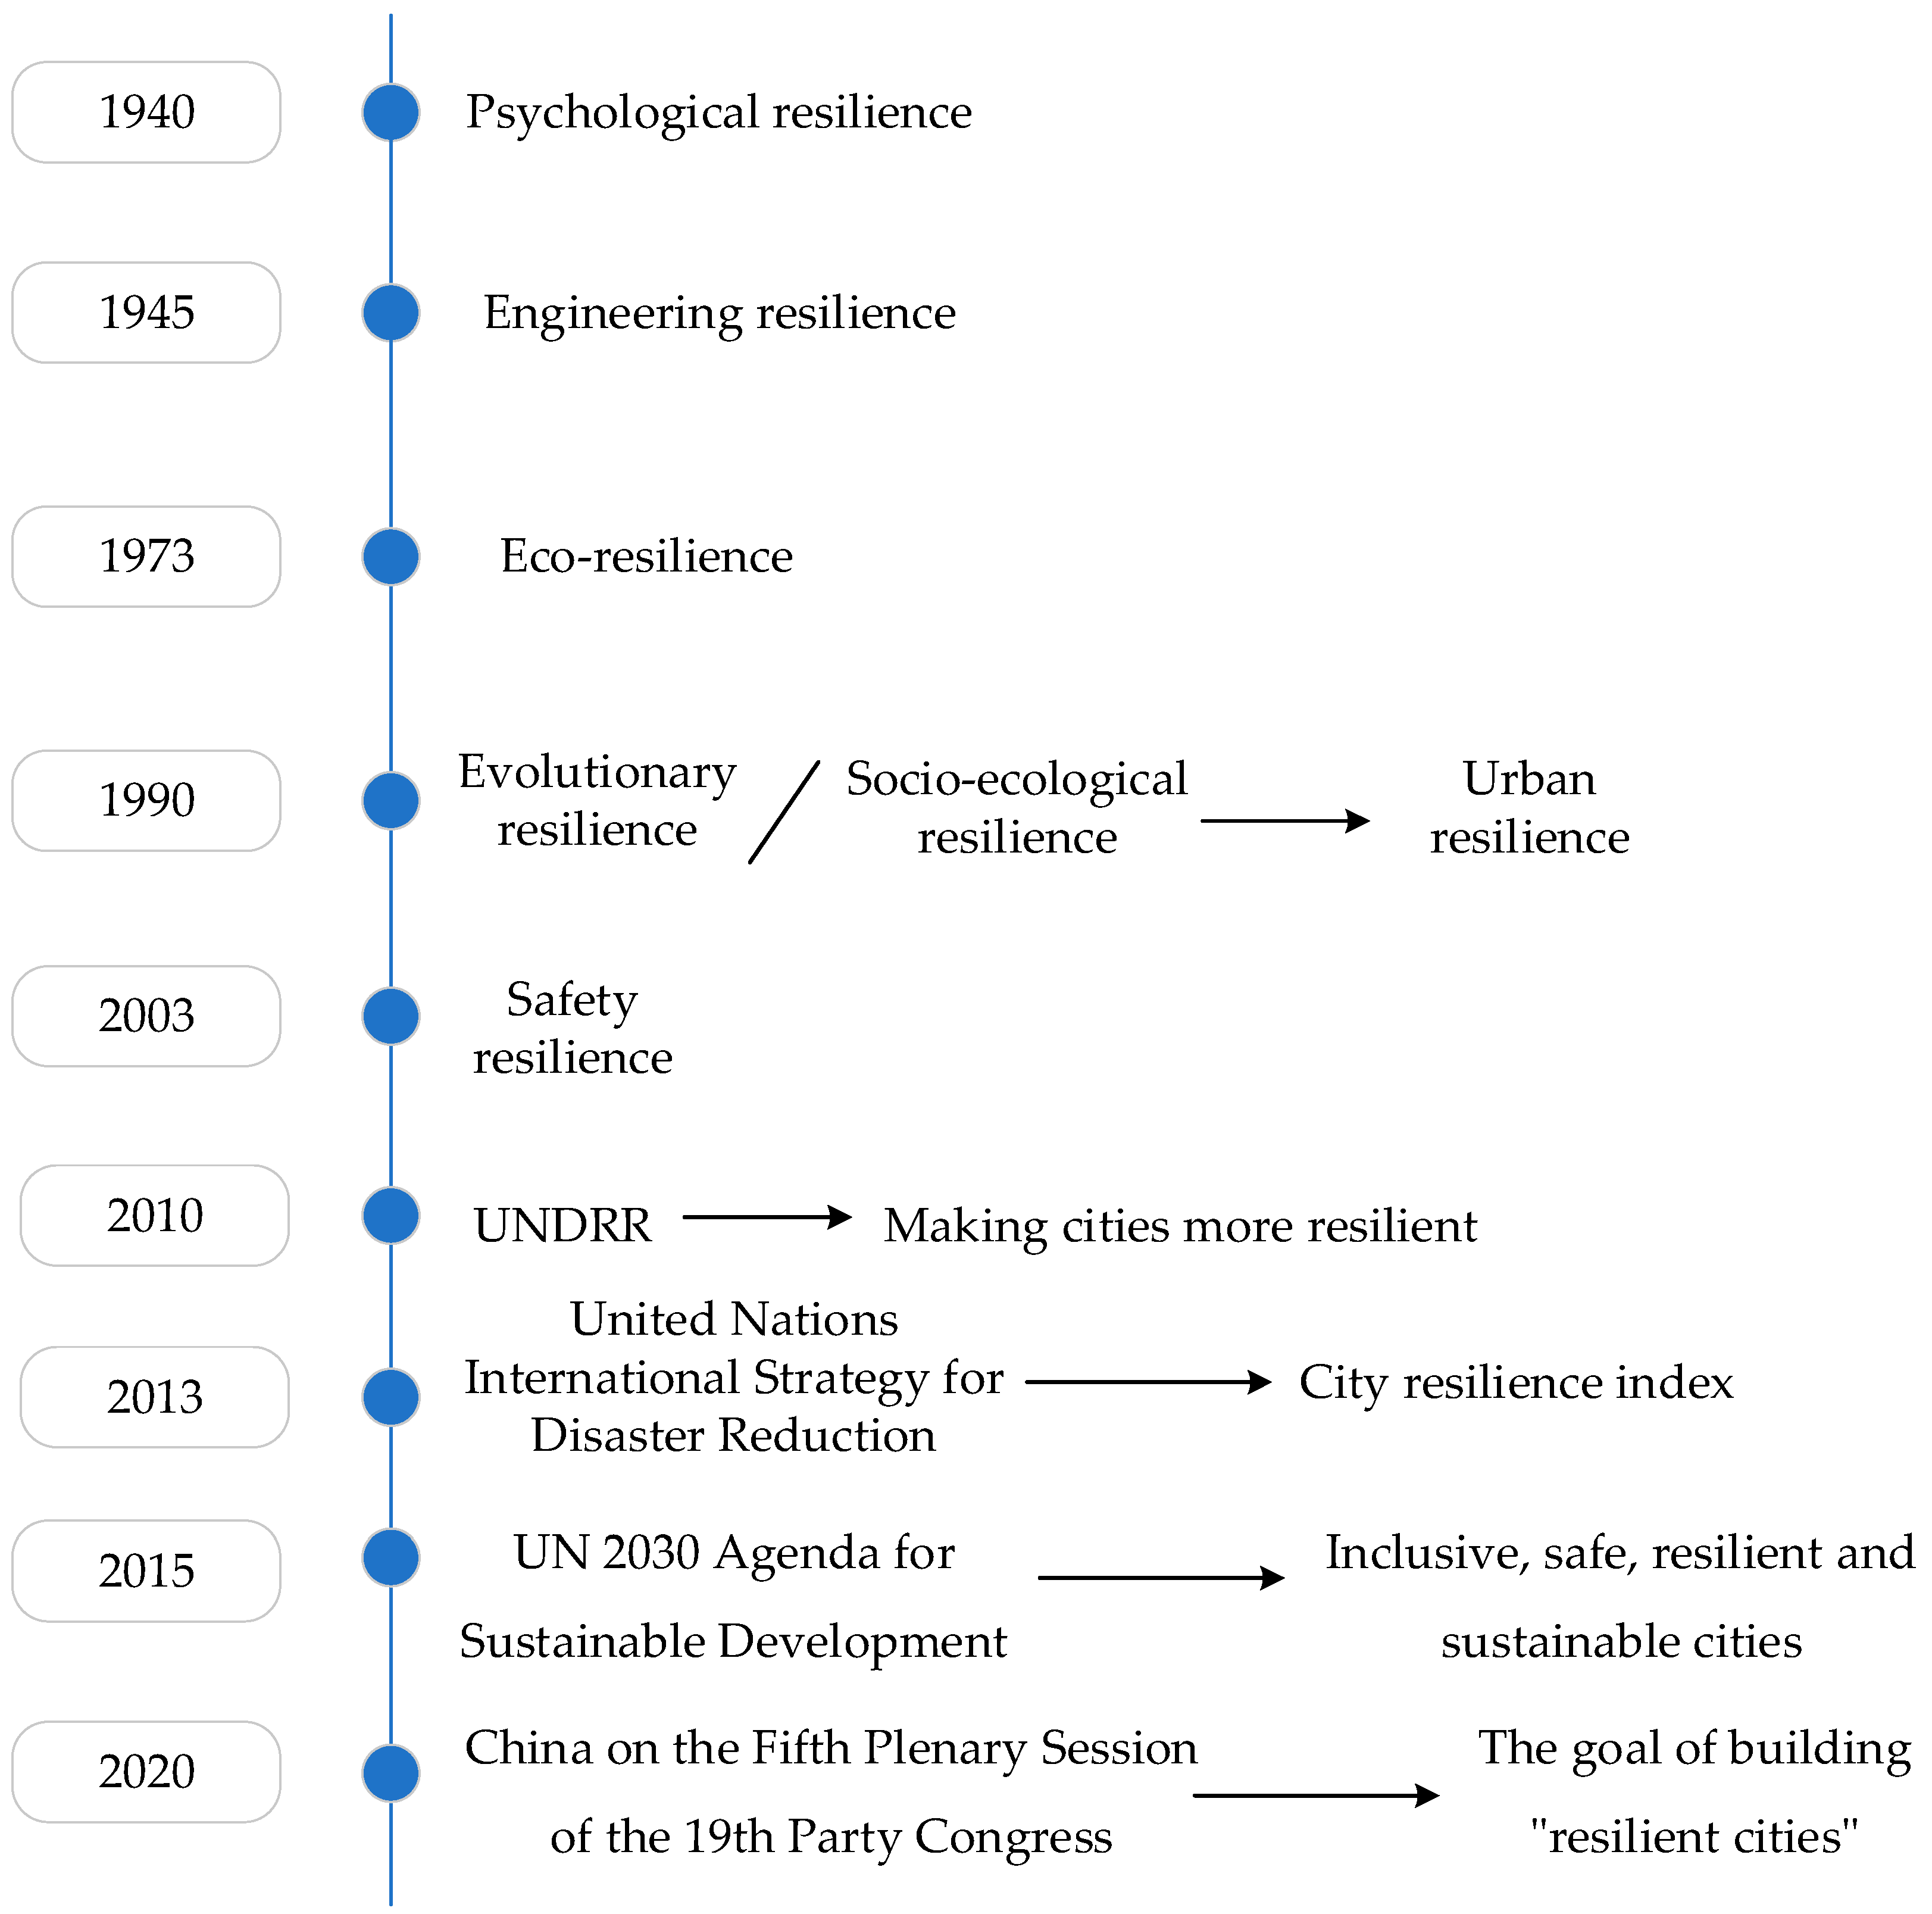
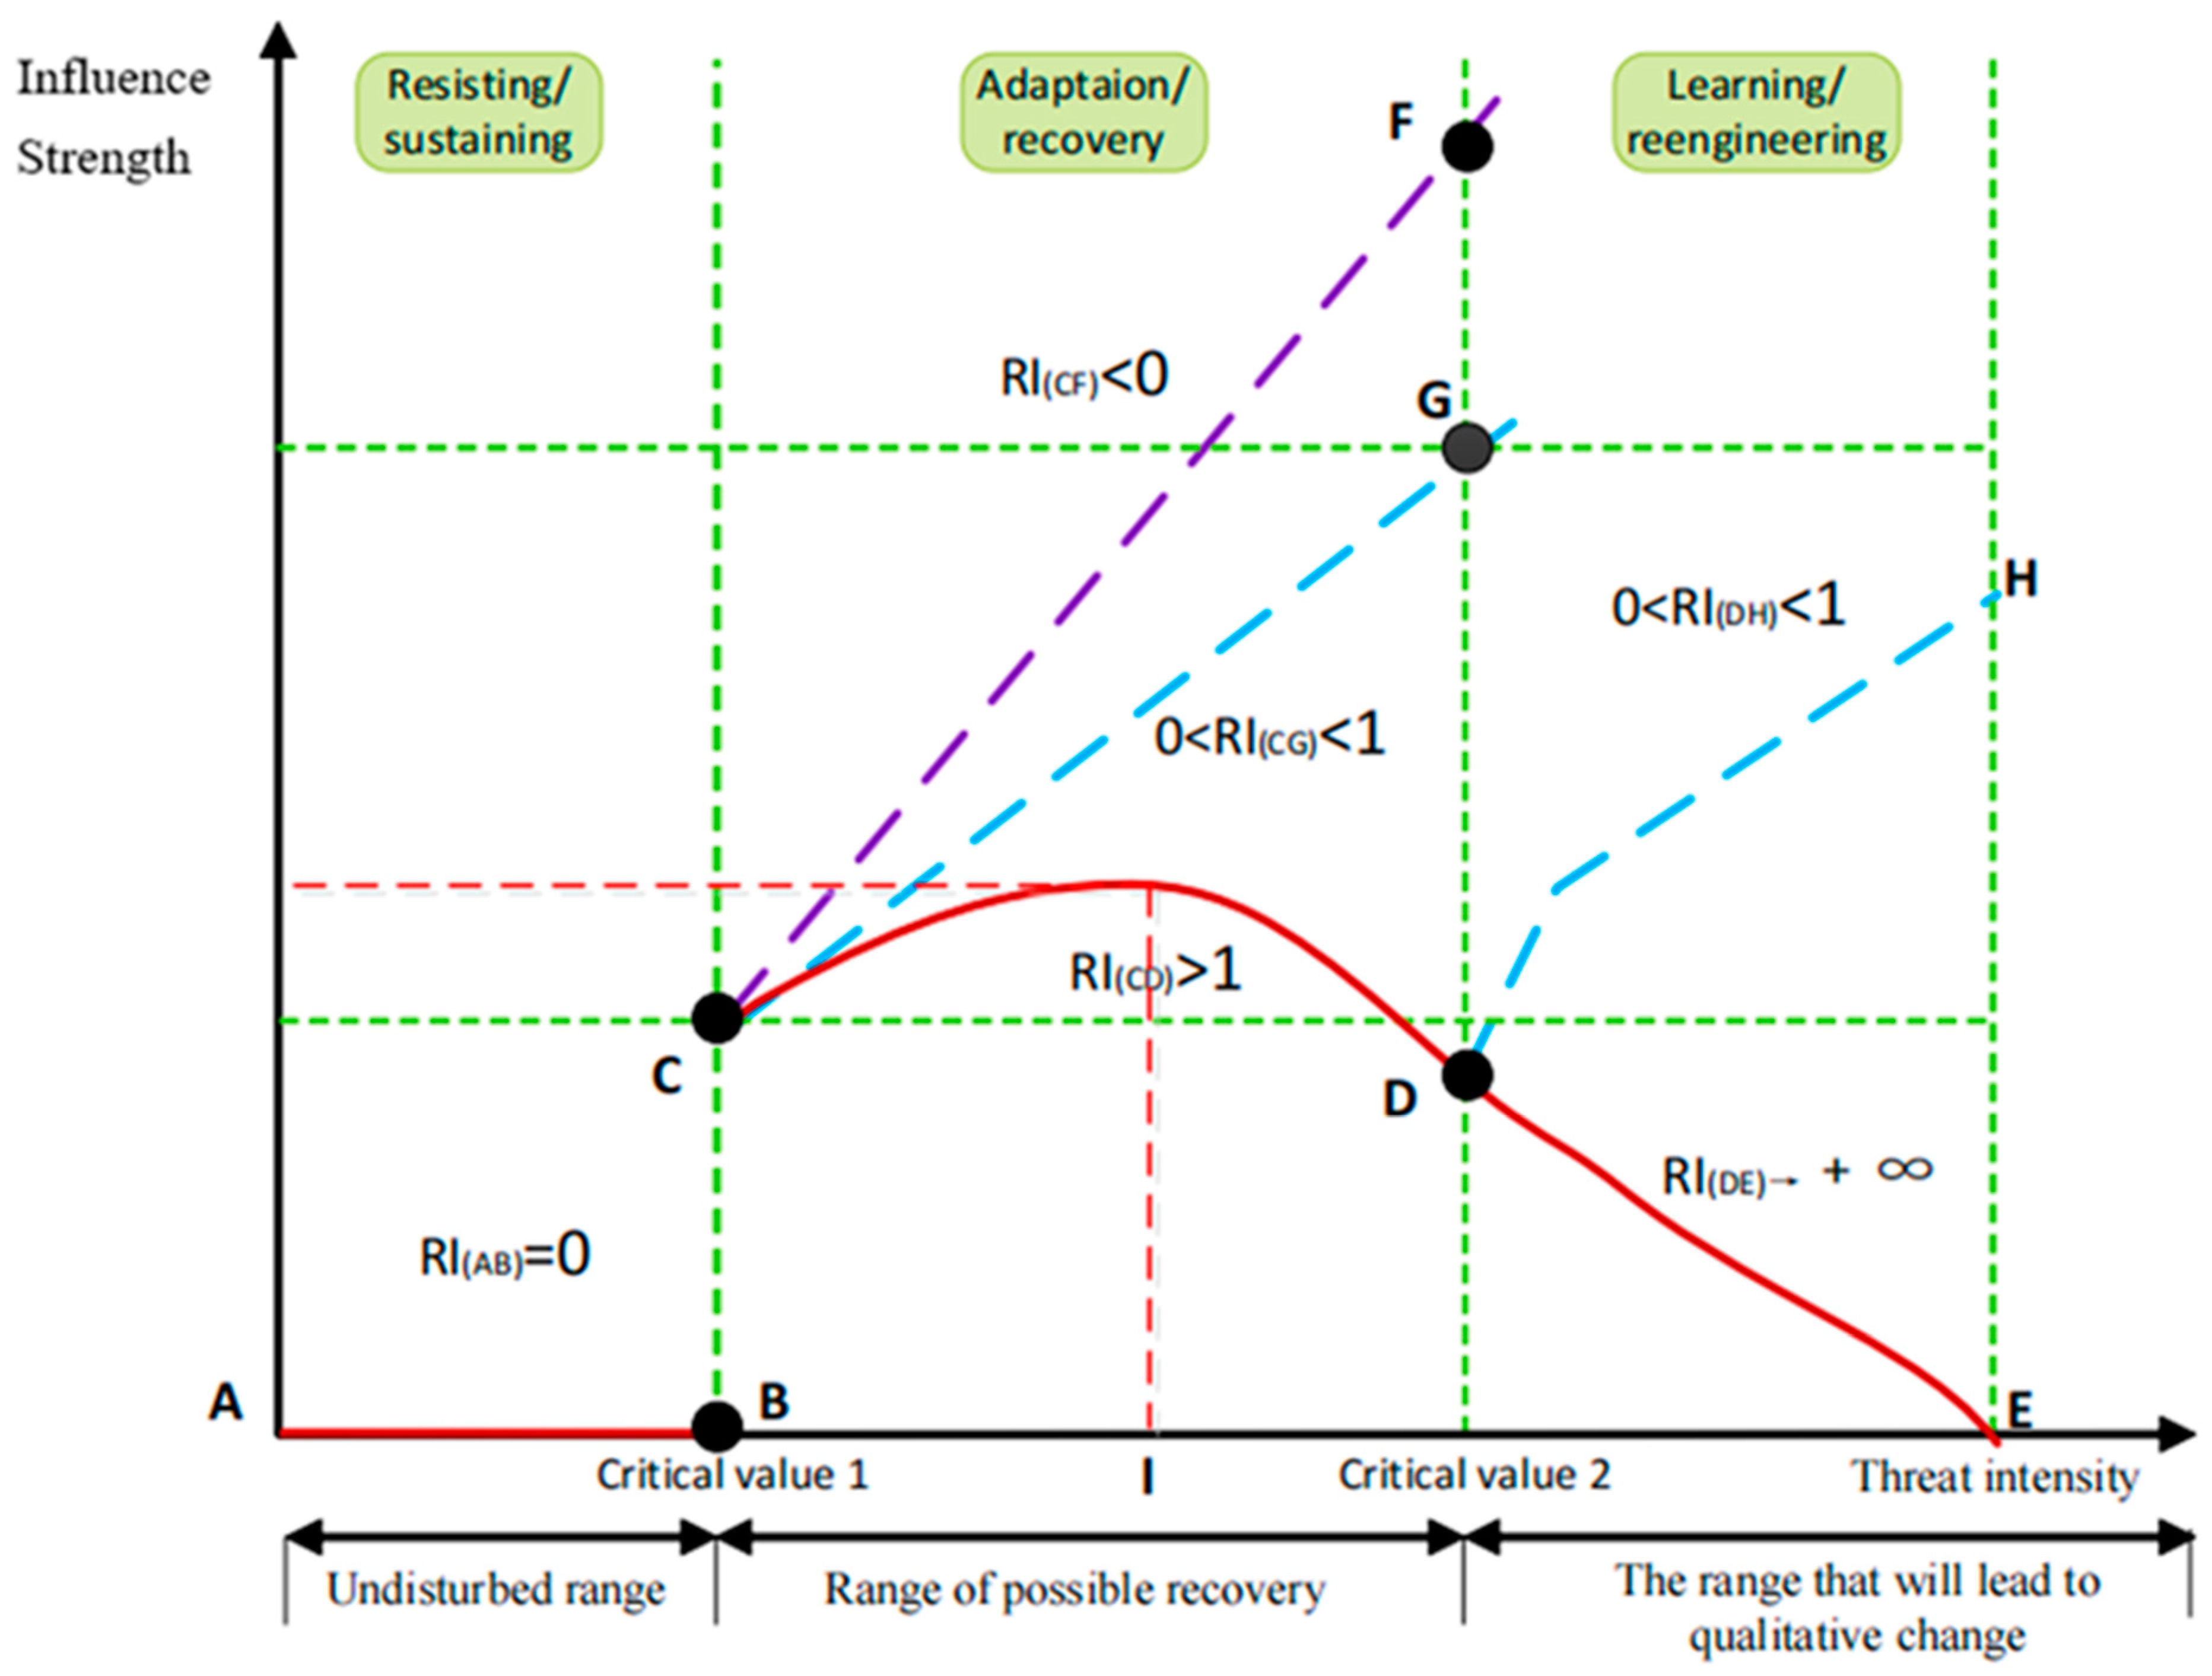
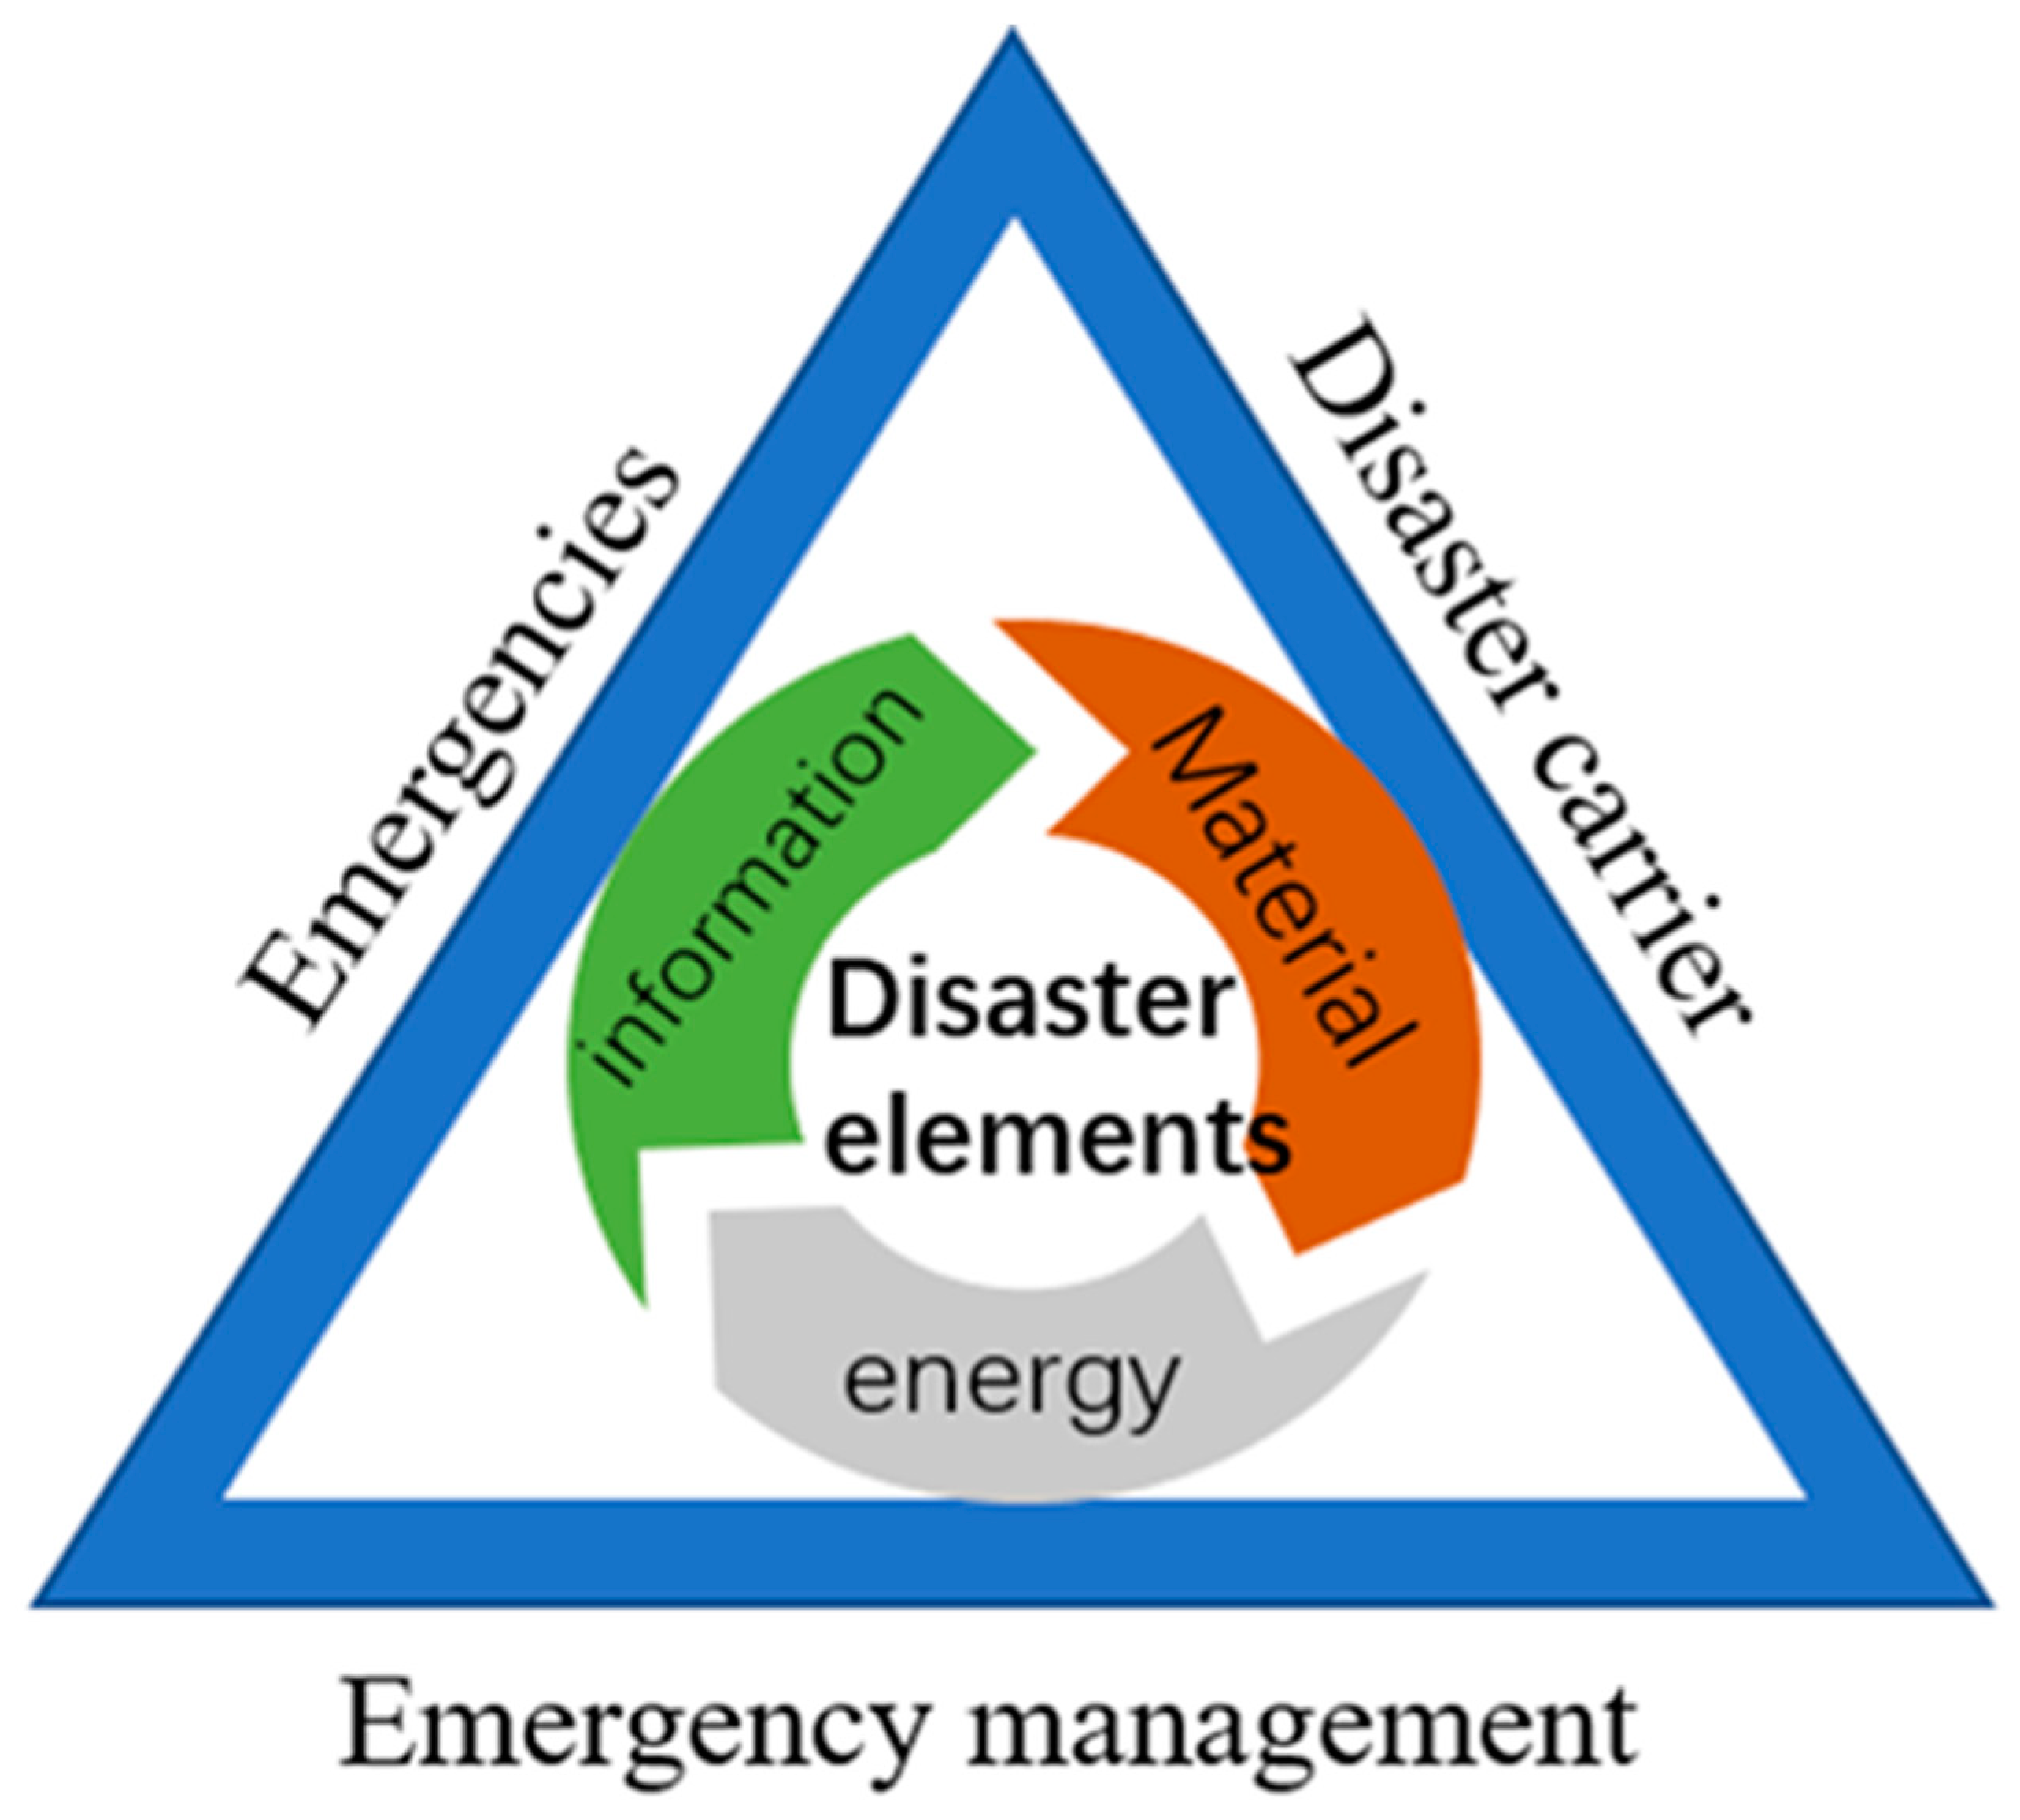
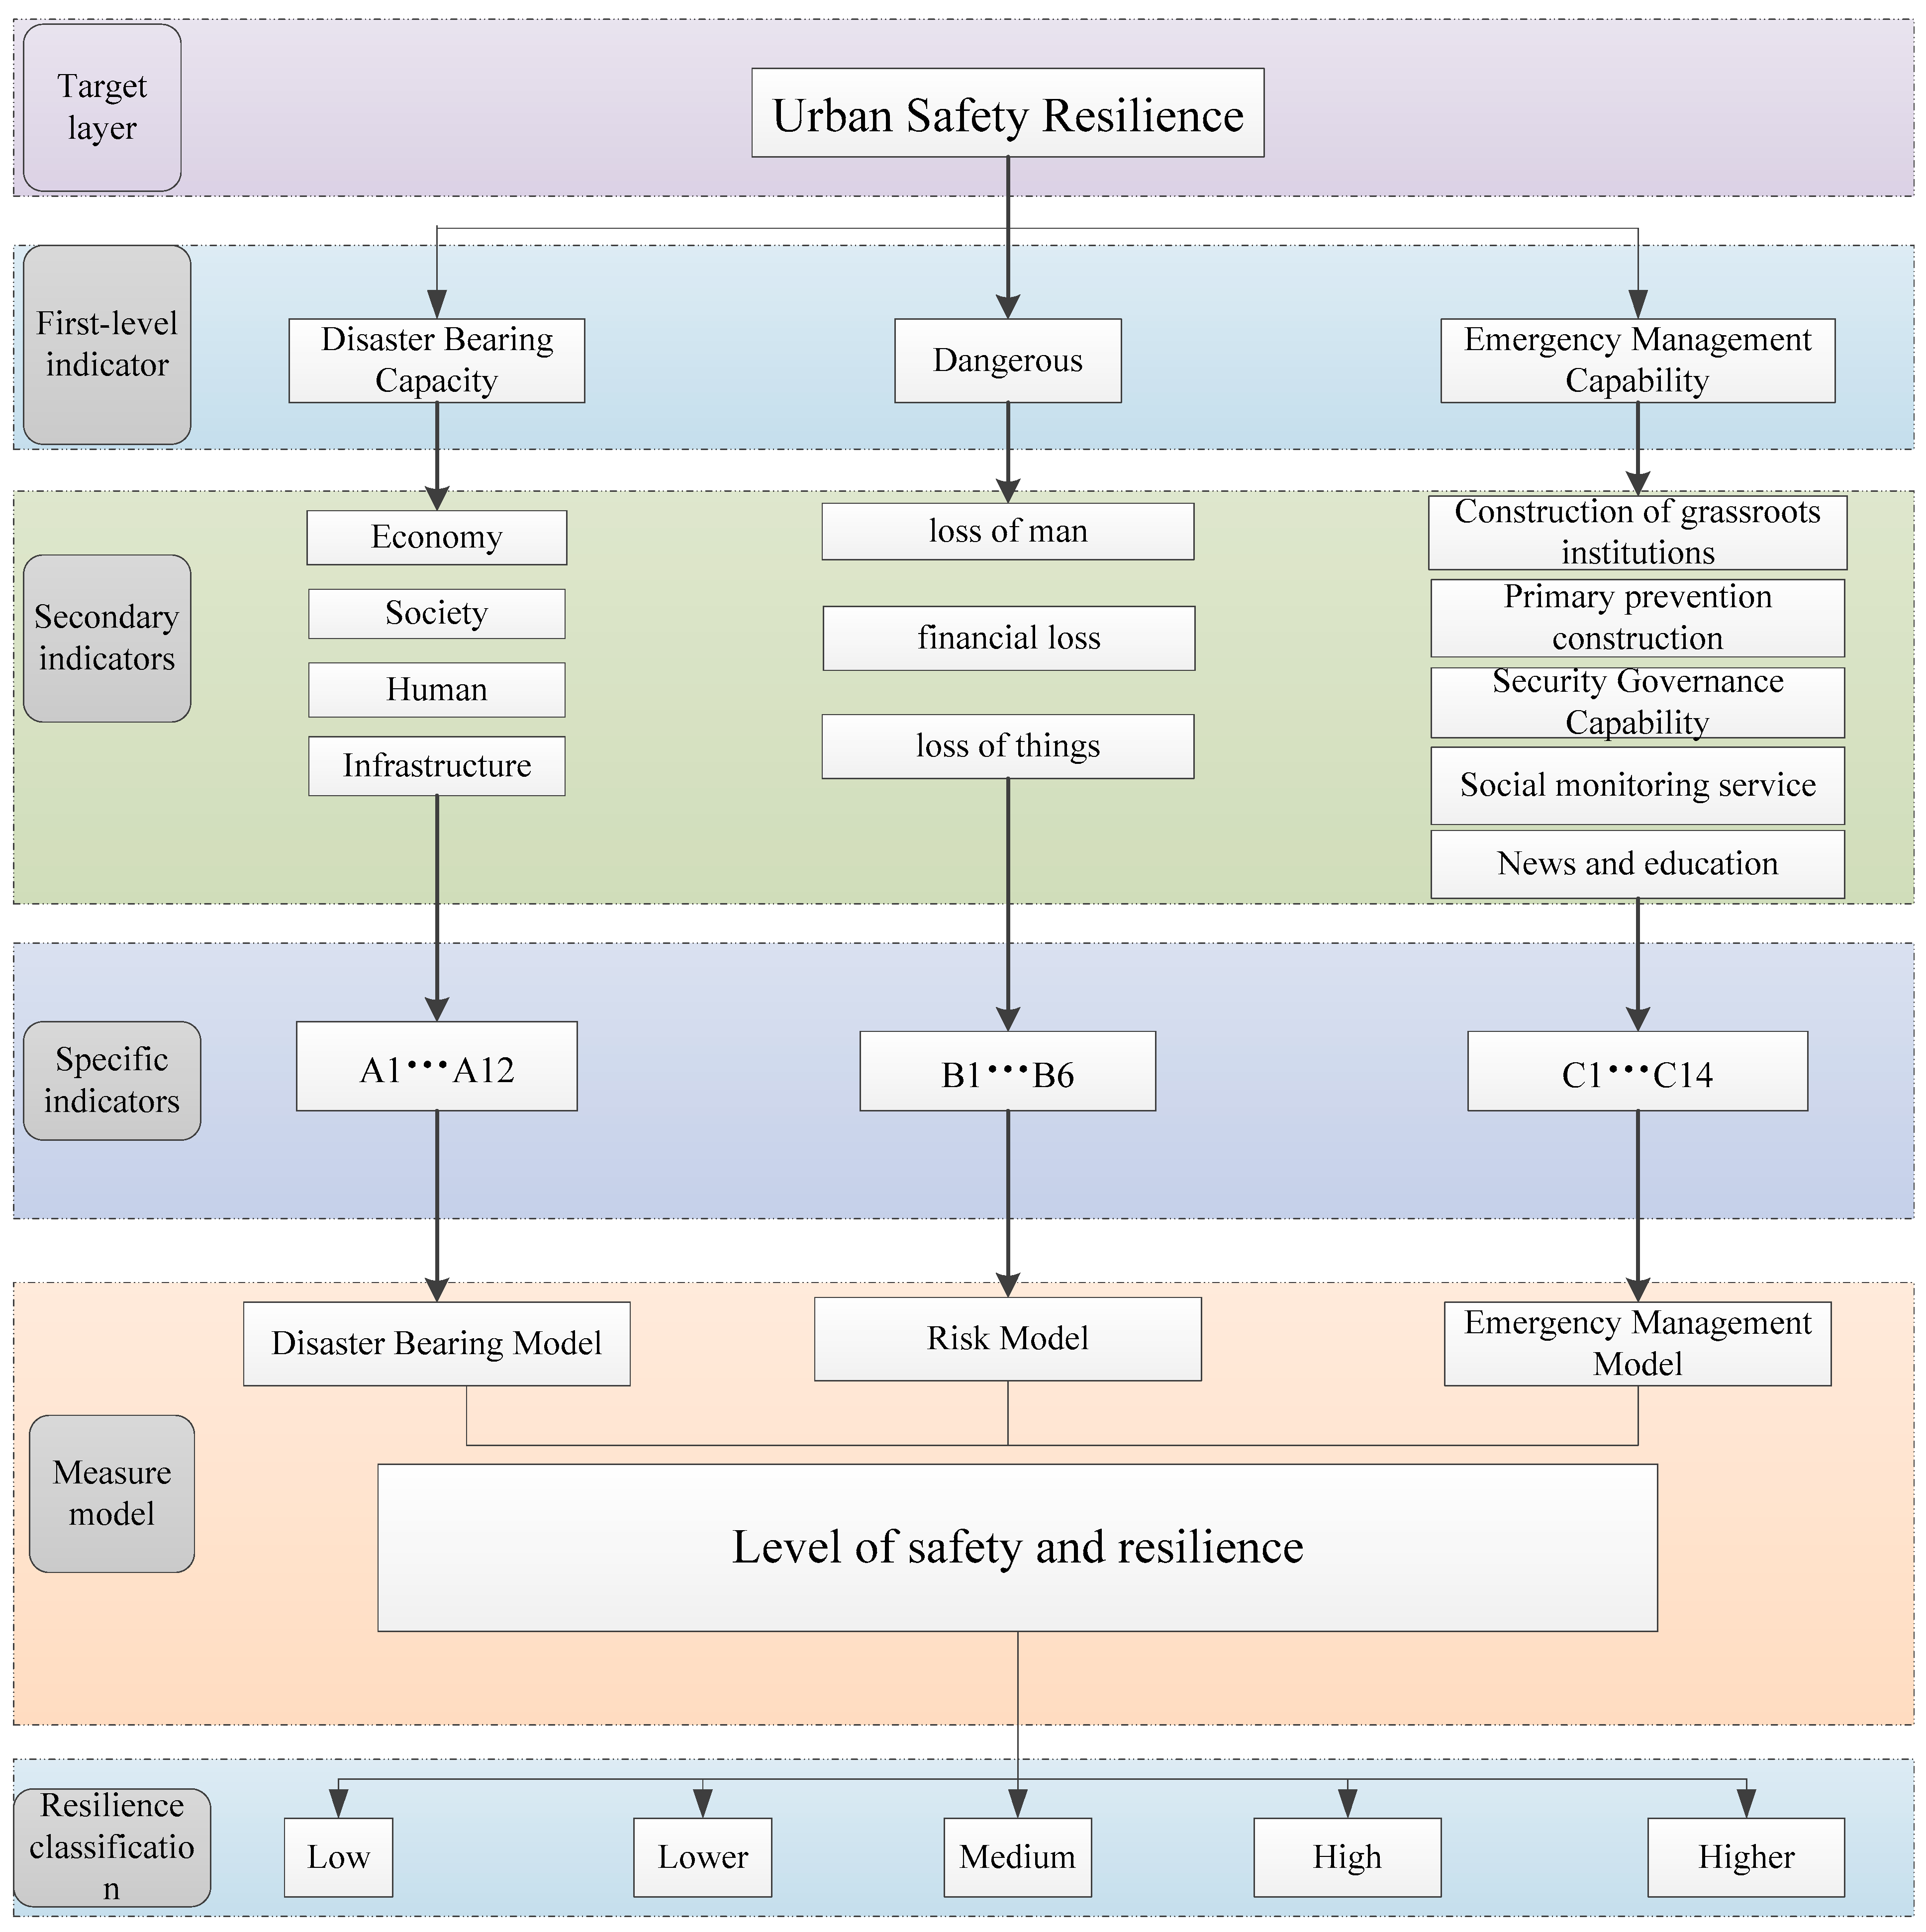
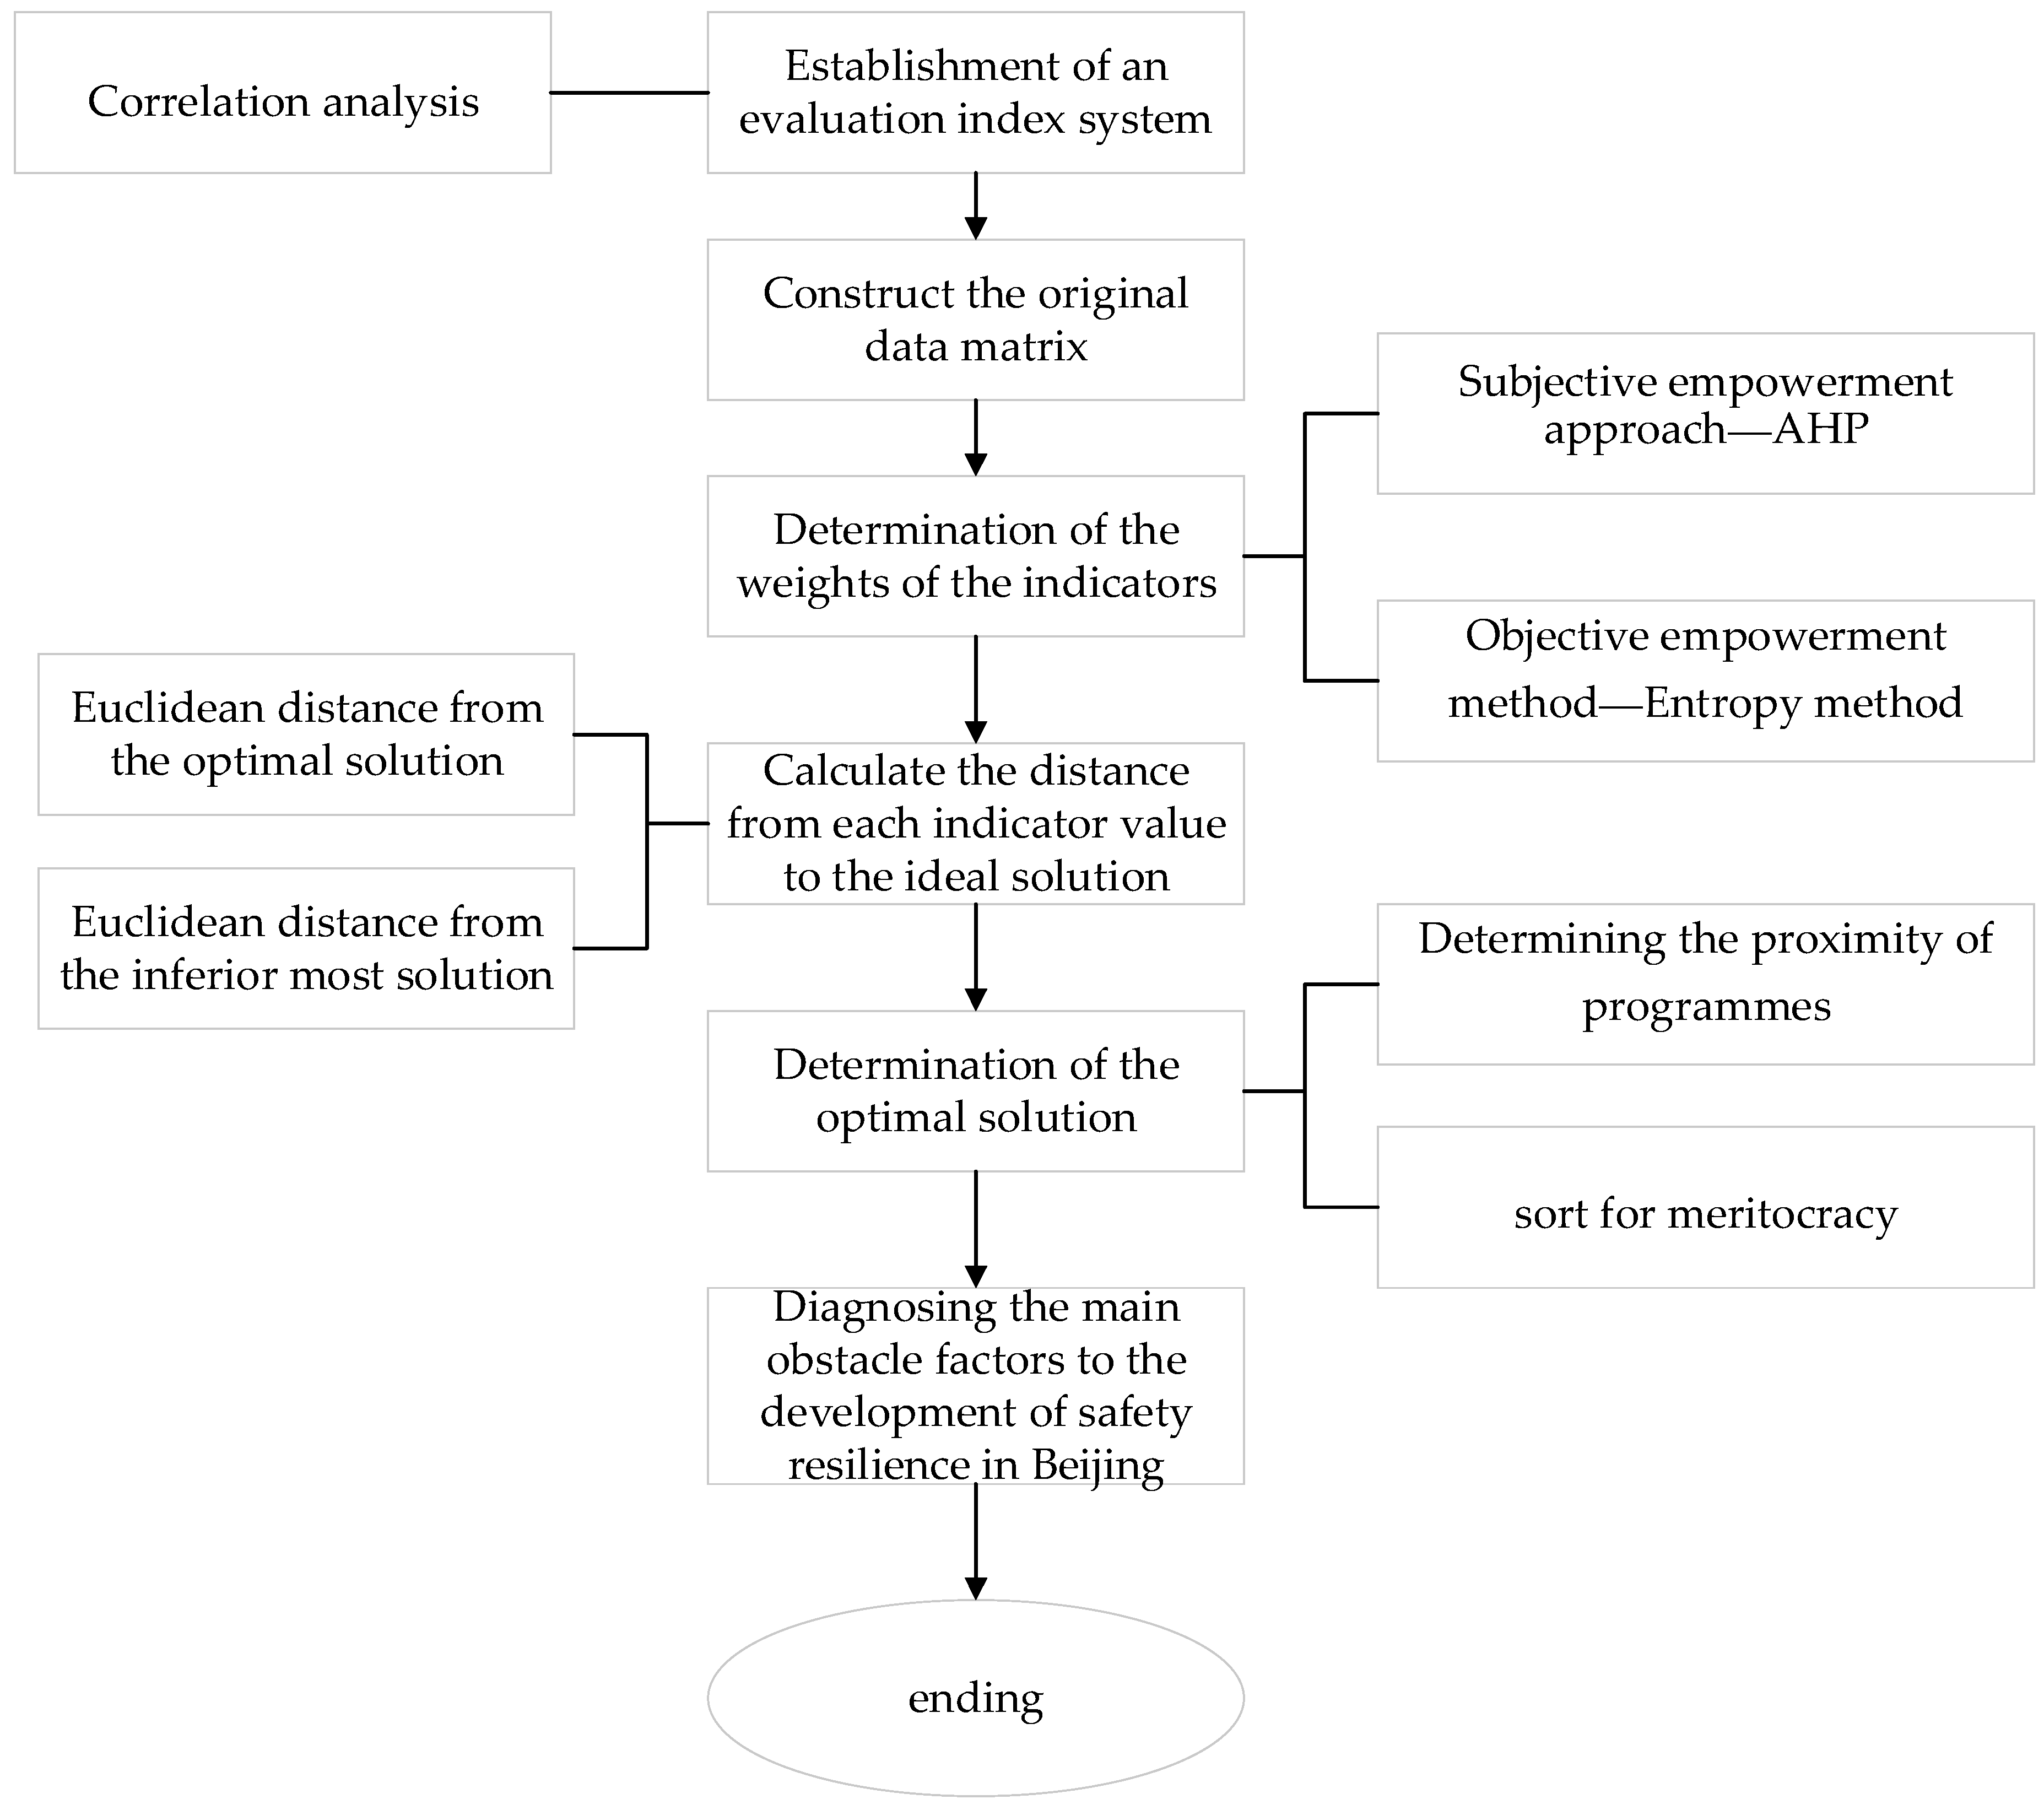

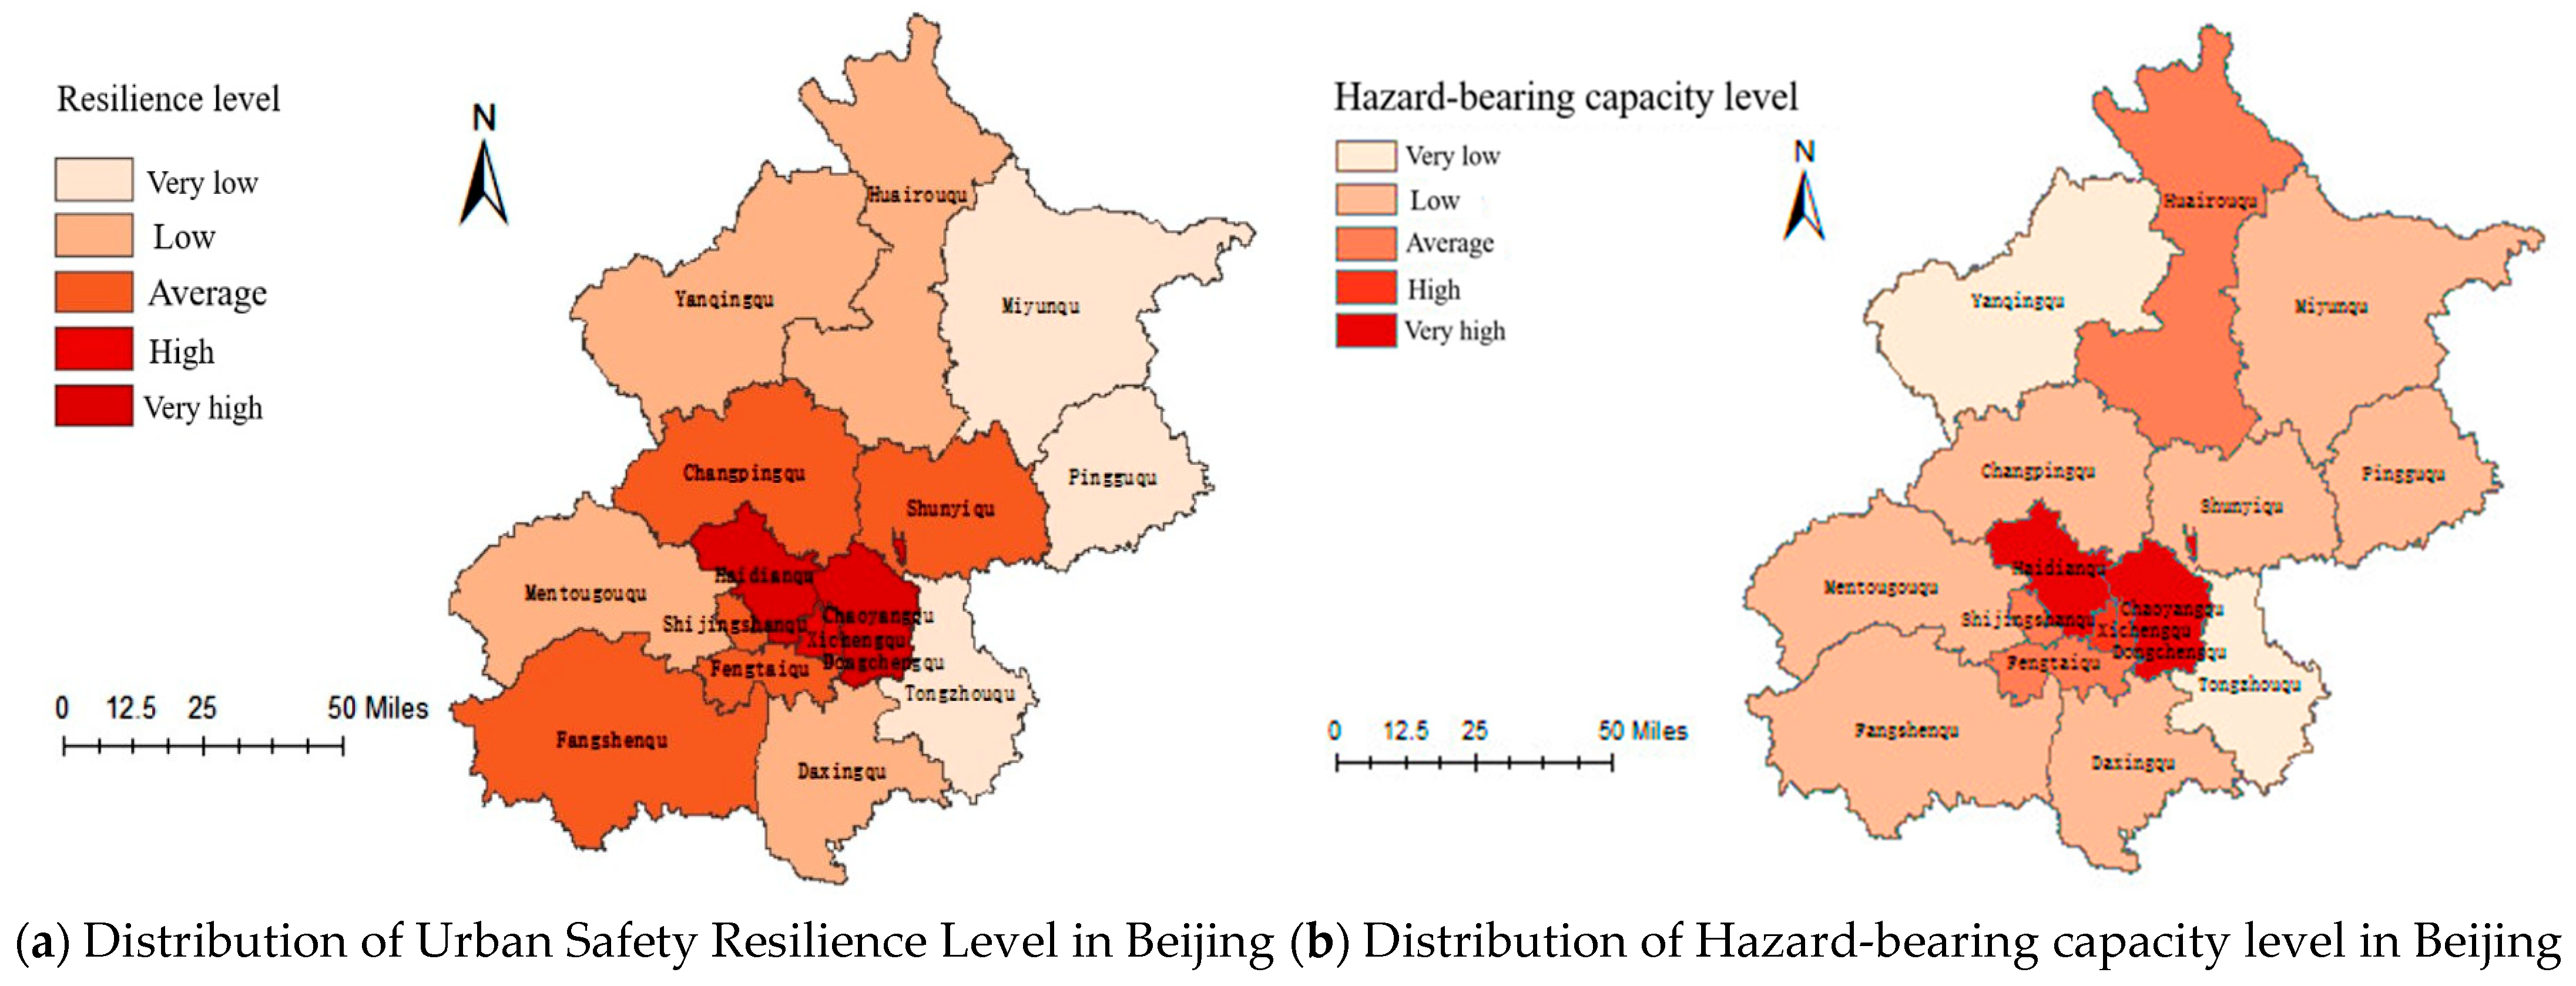
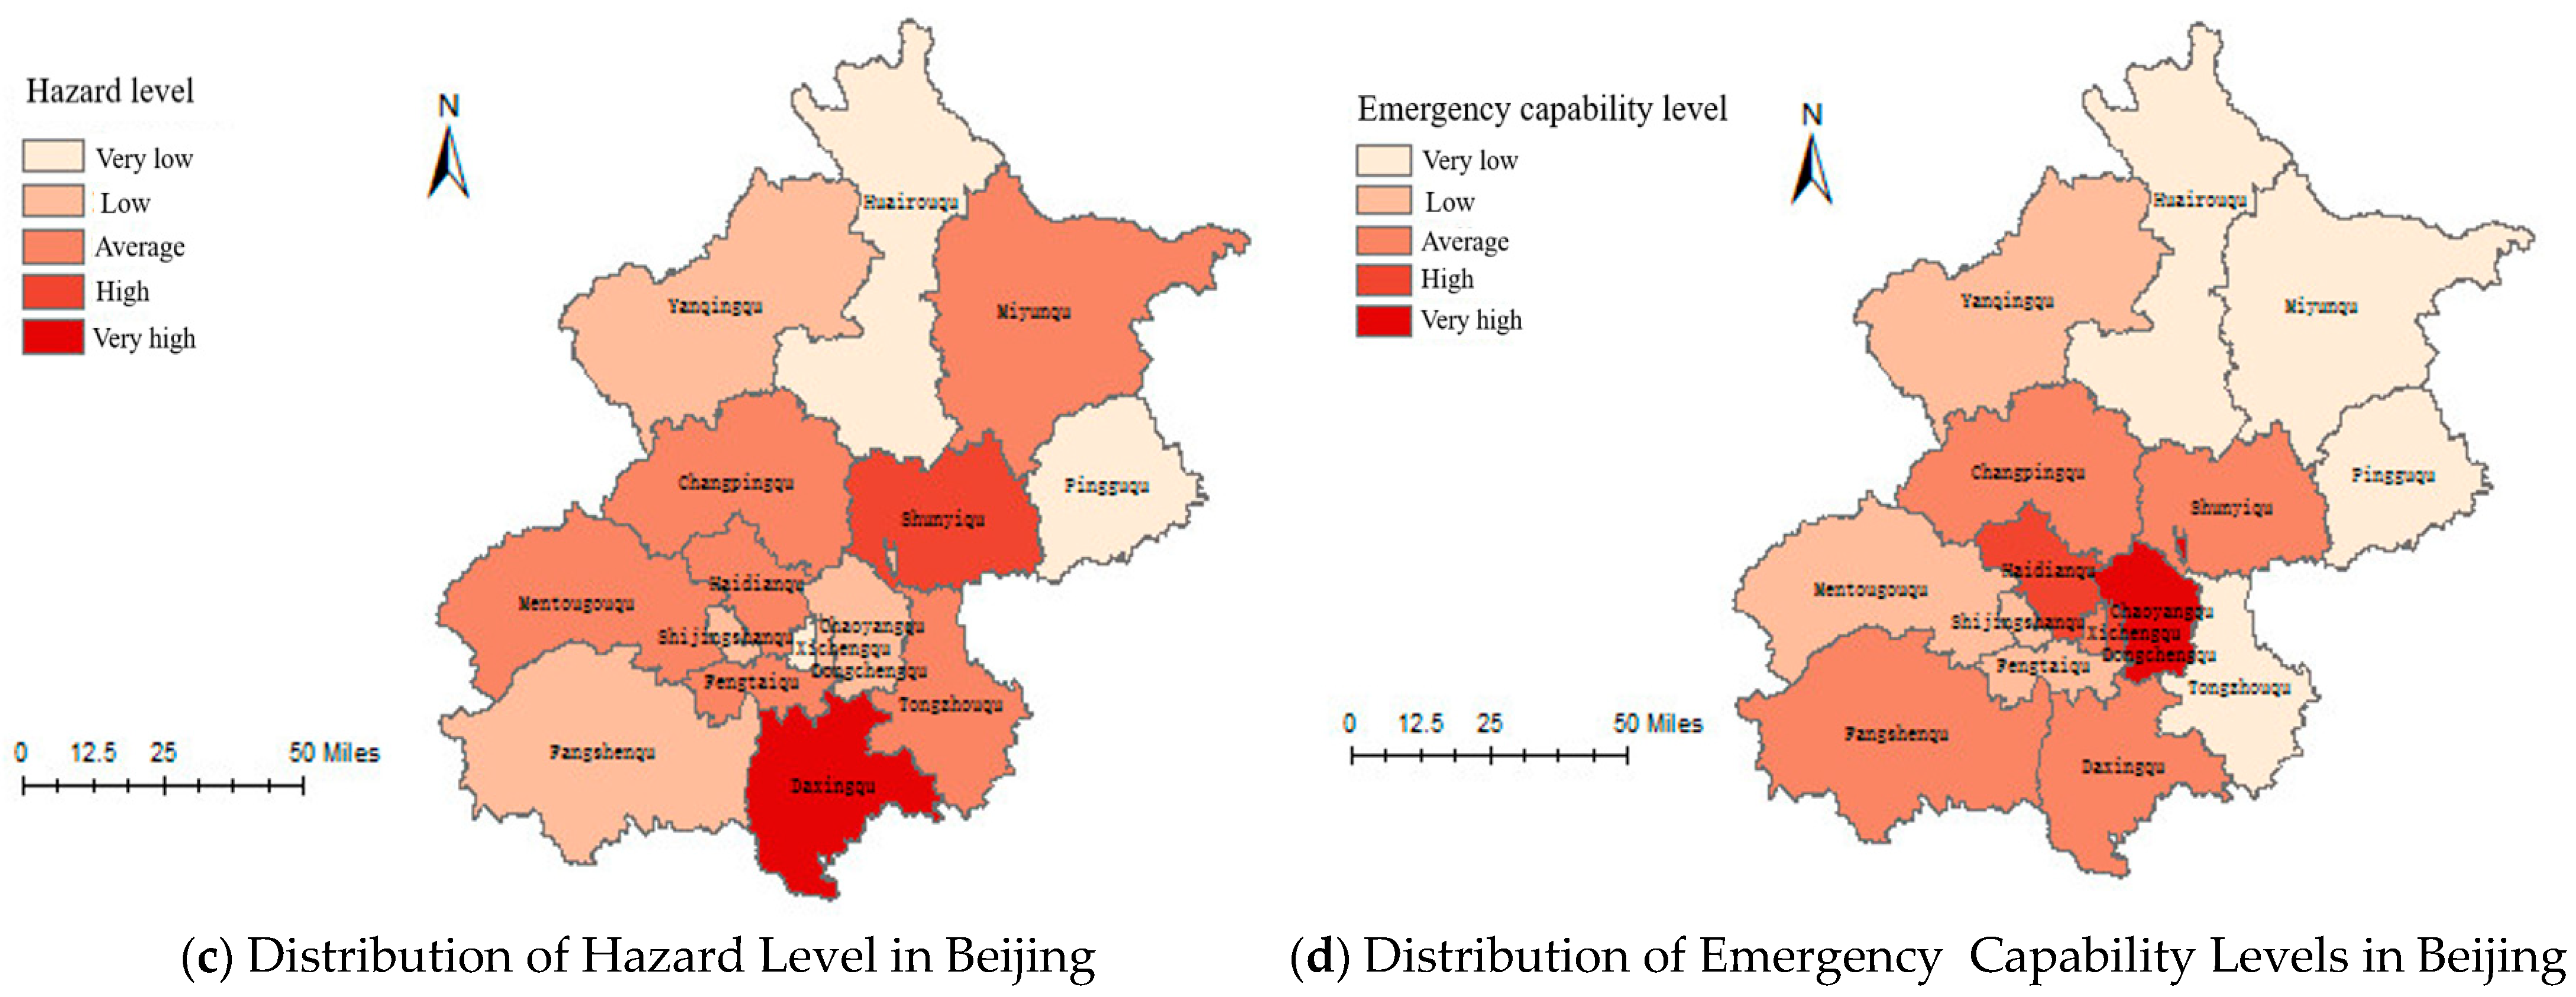
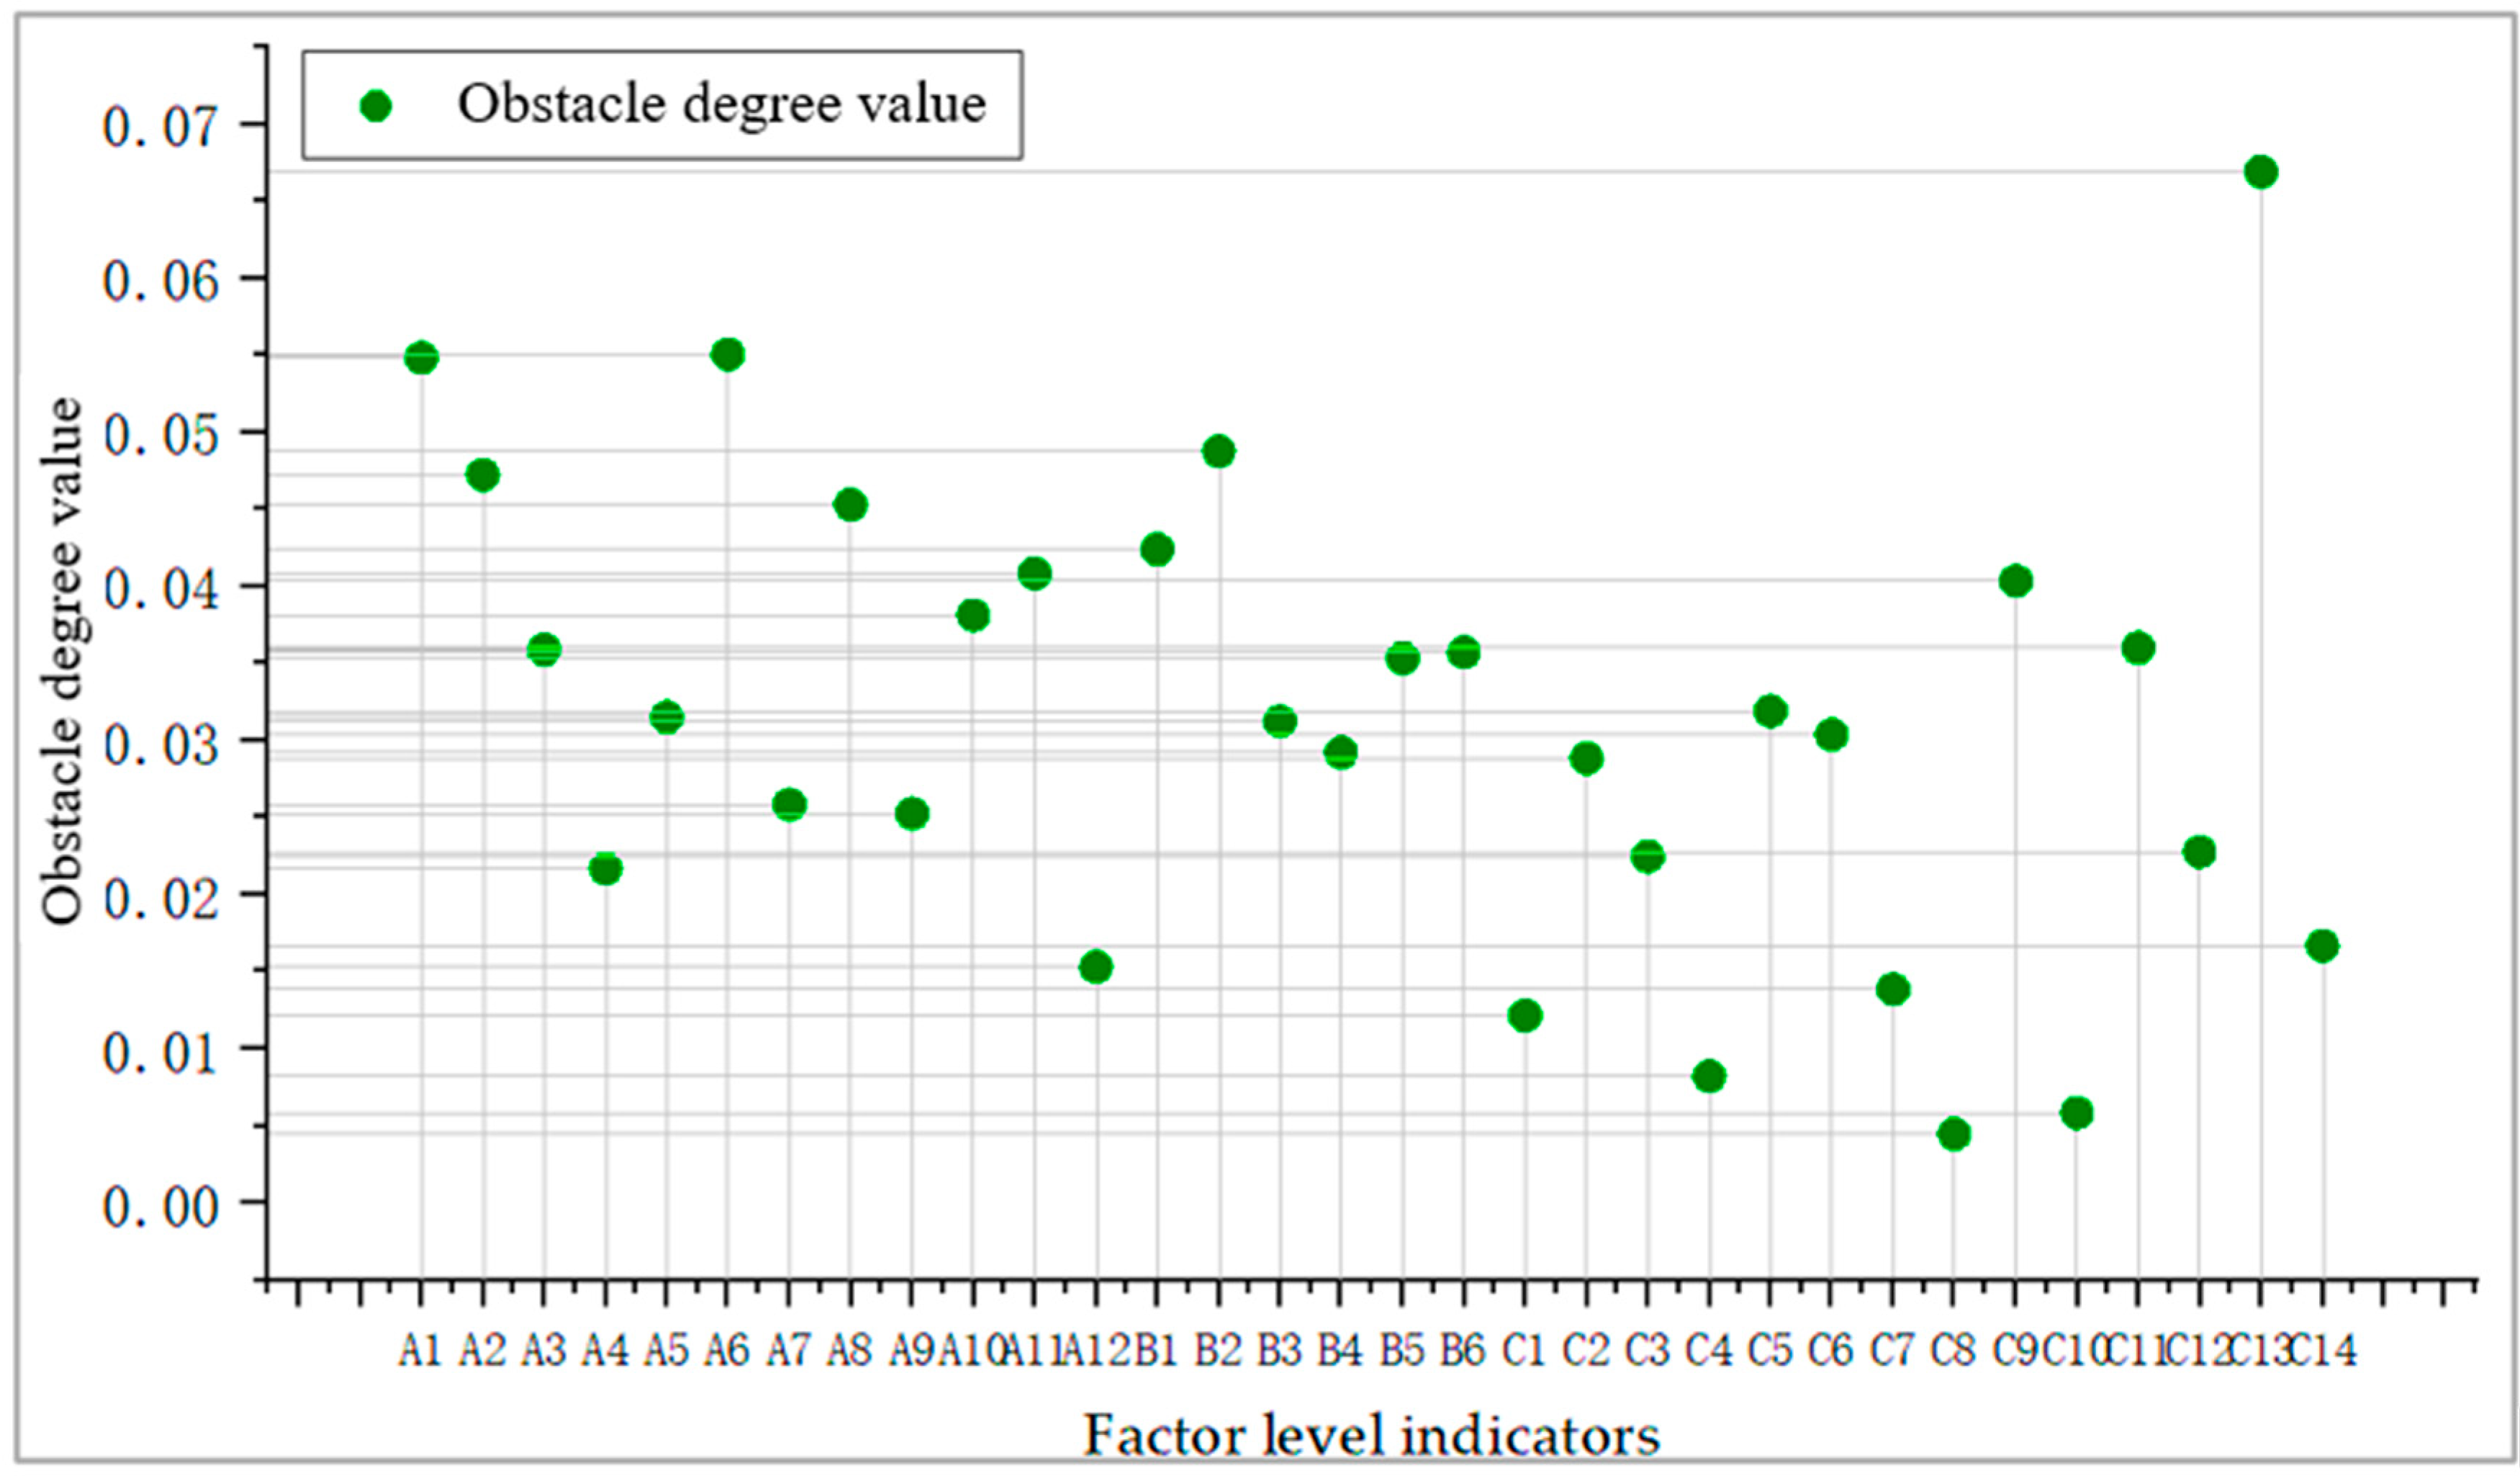
Disclaimer/Publisher’s Note: The statements, opinions and data contained in all publications are solely those of the individual author(s) and contributor(s) and not of MDPI and/or the editor(s). MDPI and/or the editor(s) disclaim responsibility for any injury to people or property resulting from any ideas, methods, instructions or products referred to in the content. |
© 2023 by the authors. Licensee MDPI, Basel, Switzerland. This article is an open access article distributed under the terms and conditions of the Creative Commons Attribution (CC BY) license (https://creativecommons.org/licenses/by/4.0/).