Unpacking the Sub-Regional Spatial Network of Land-Use Carbon Emissions: The Case of Sichuan Province in China
Abstract
:1. Introduction
2. Materials and Methods
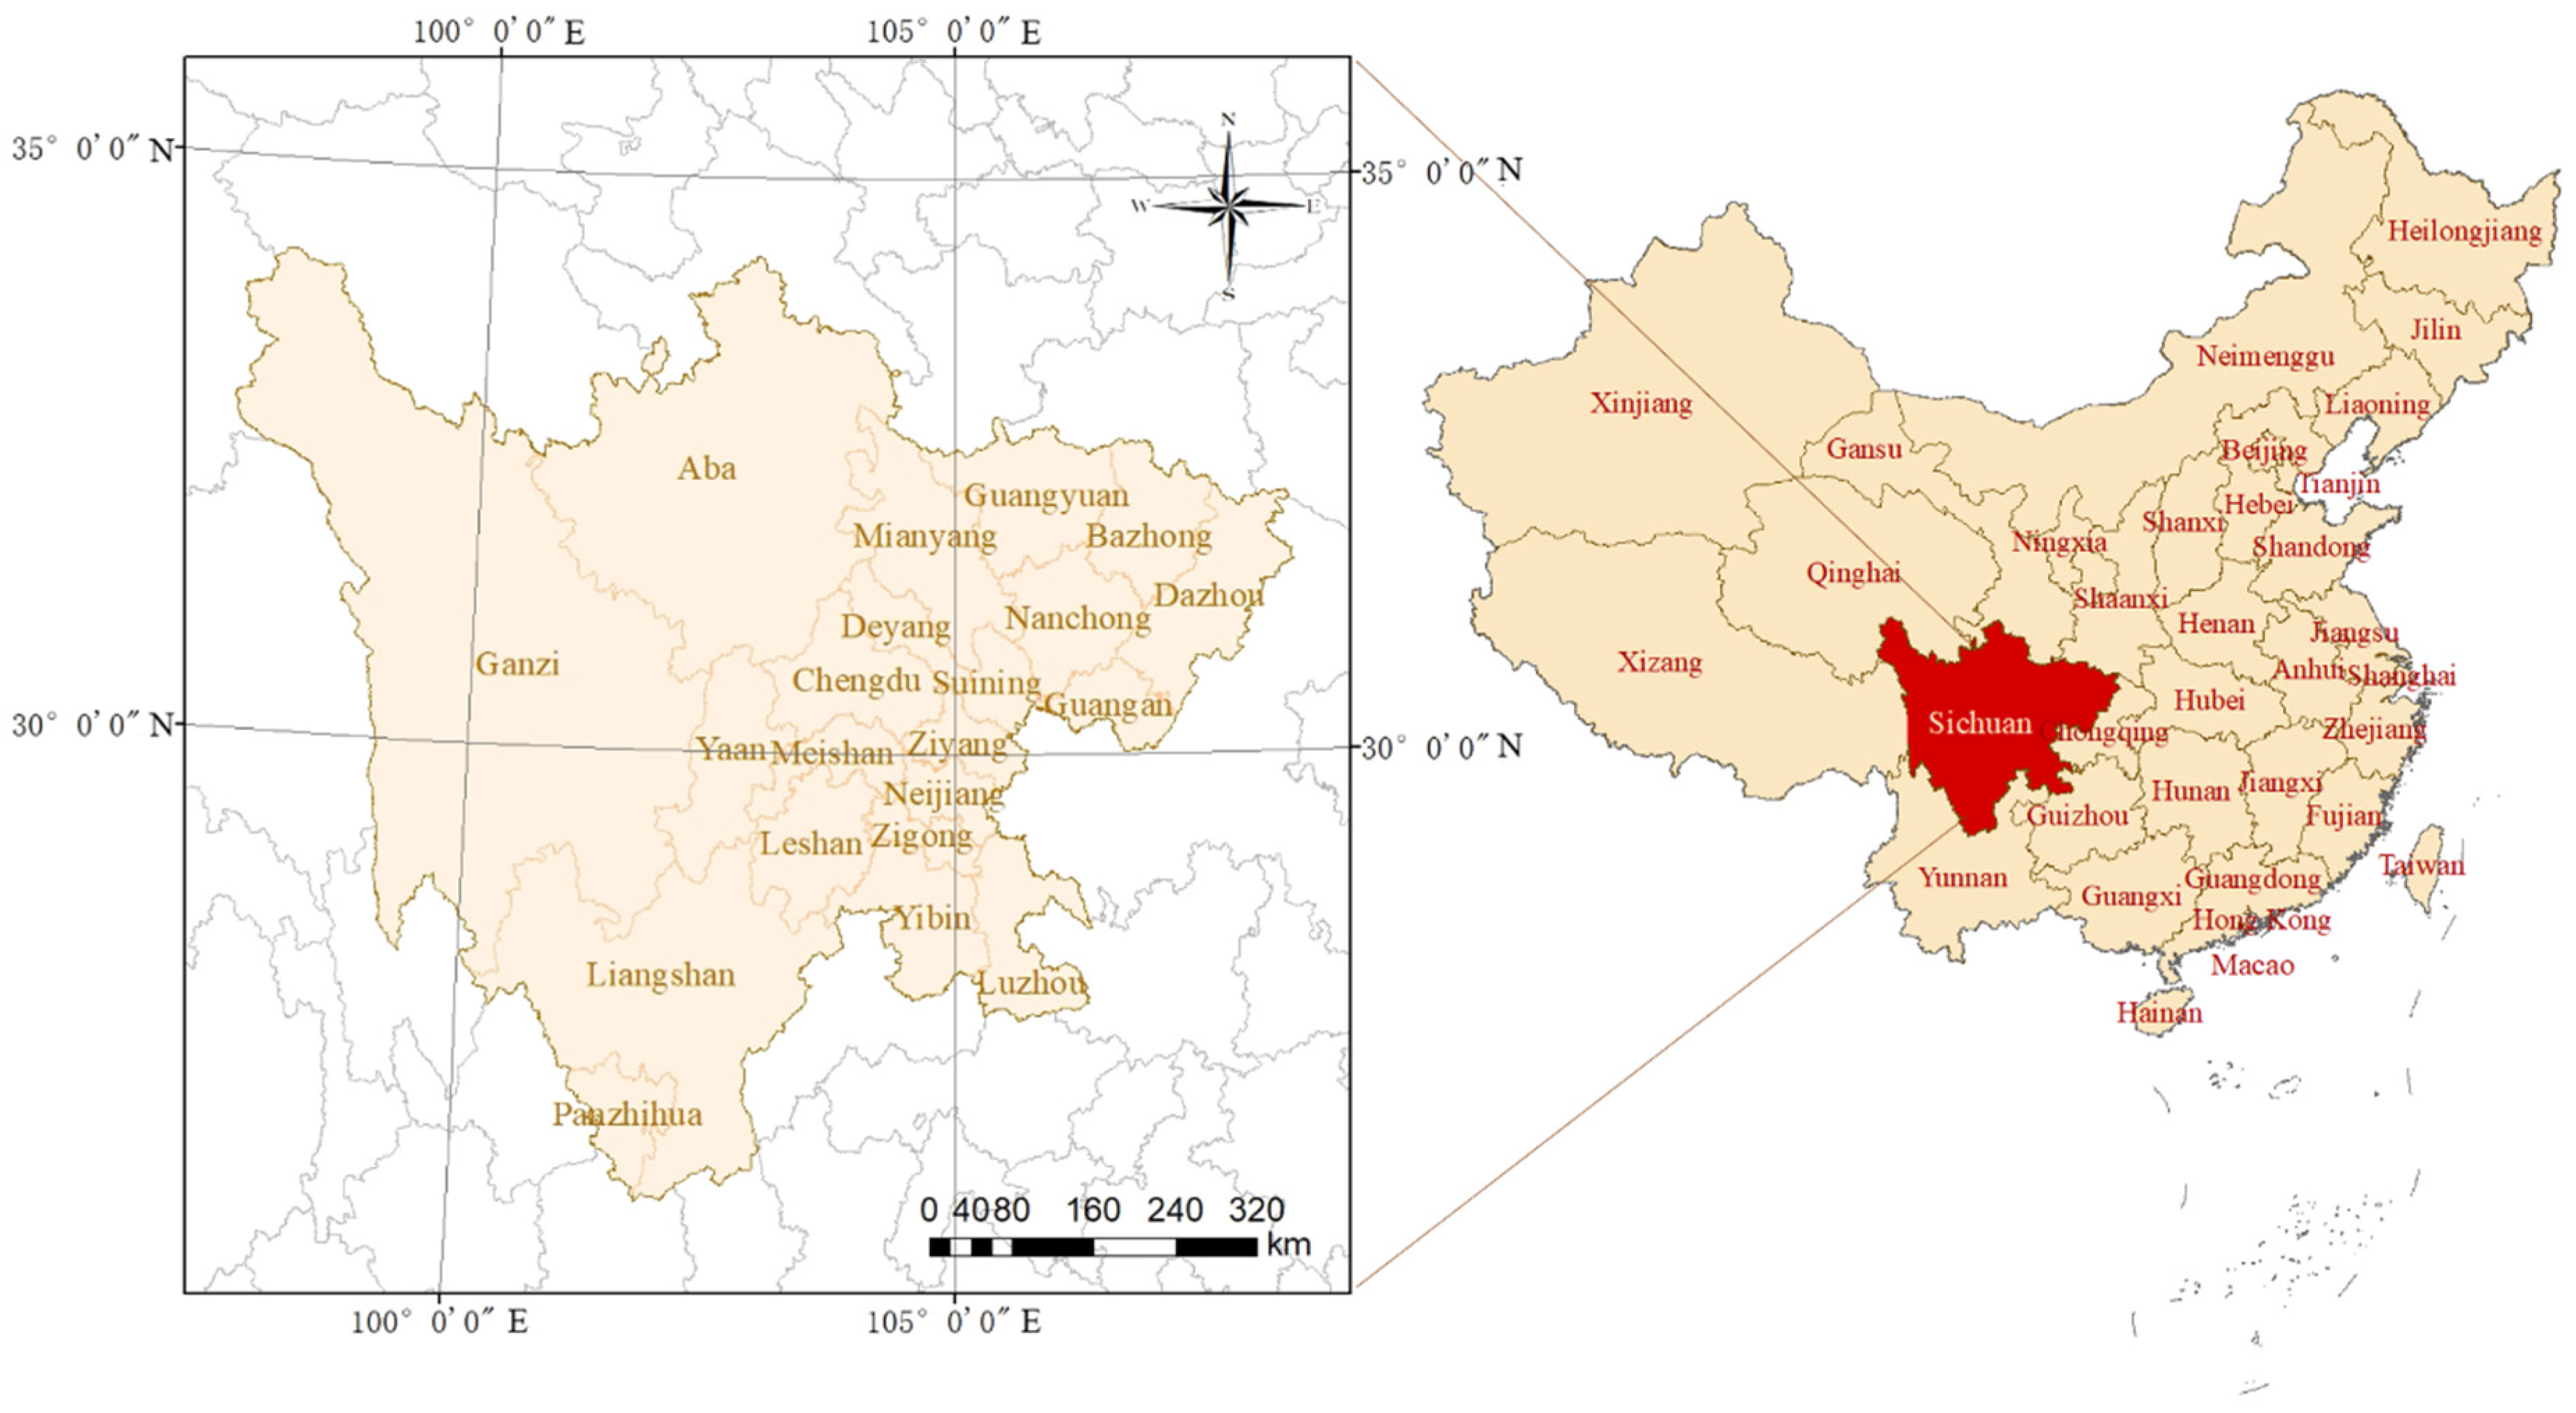
2.1. Study Area
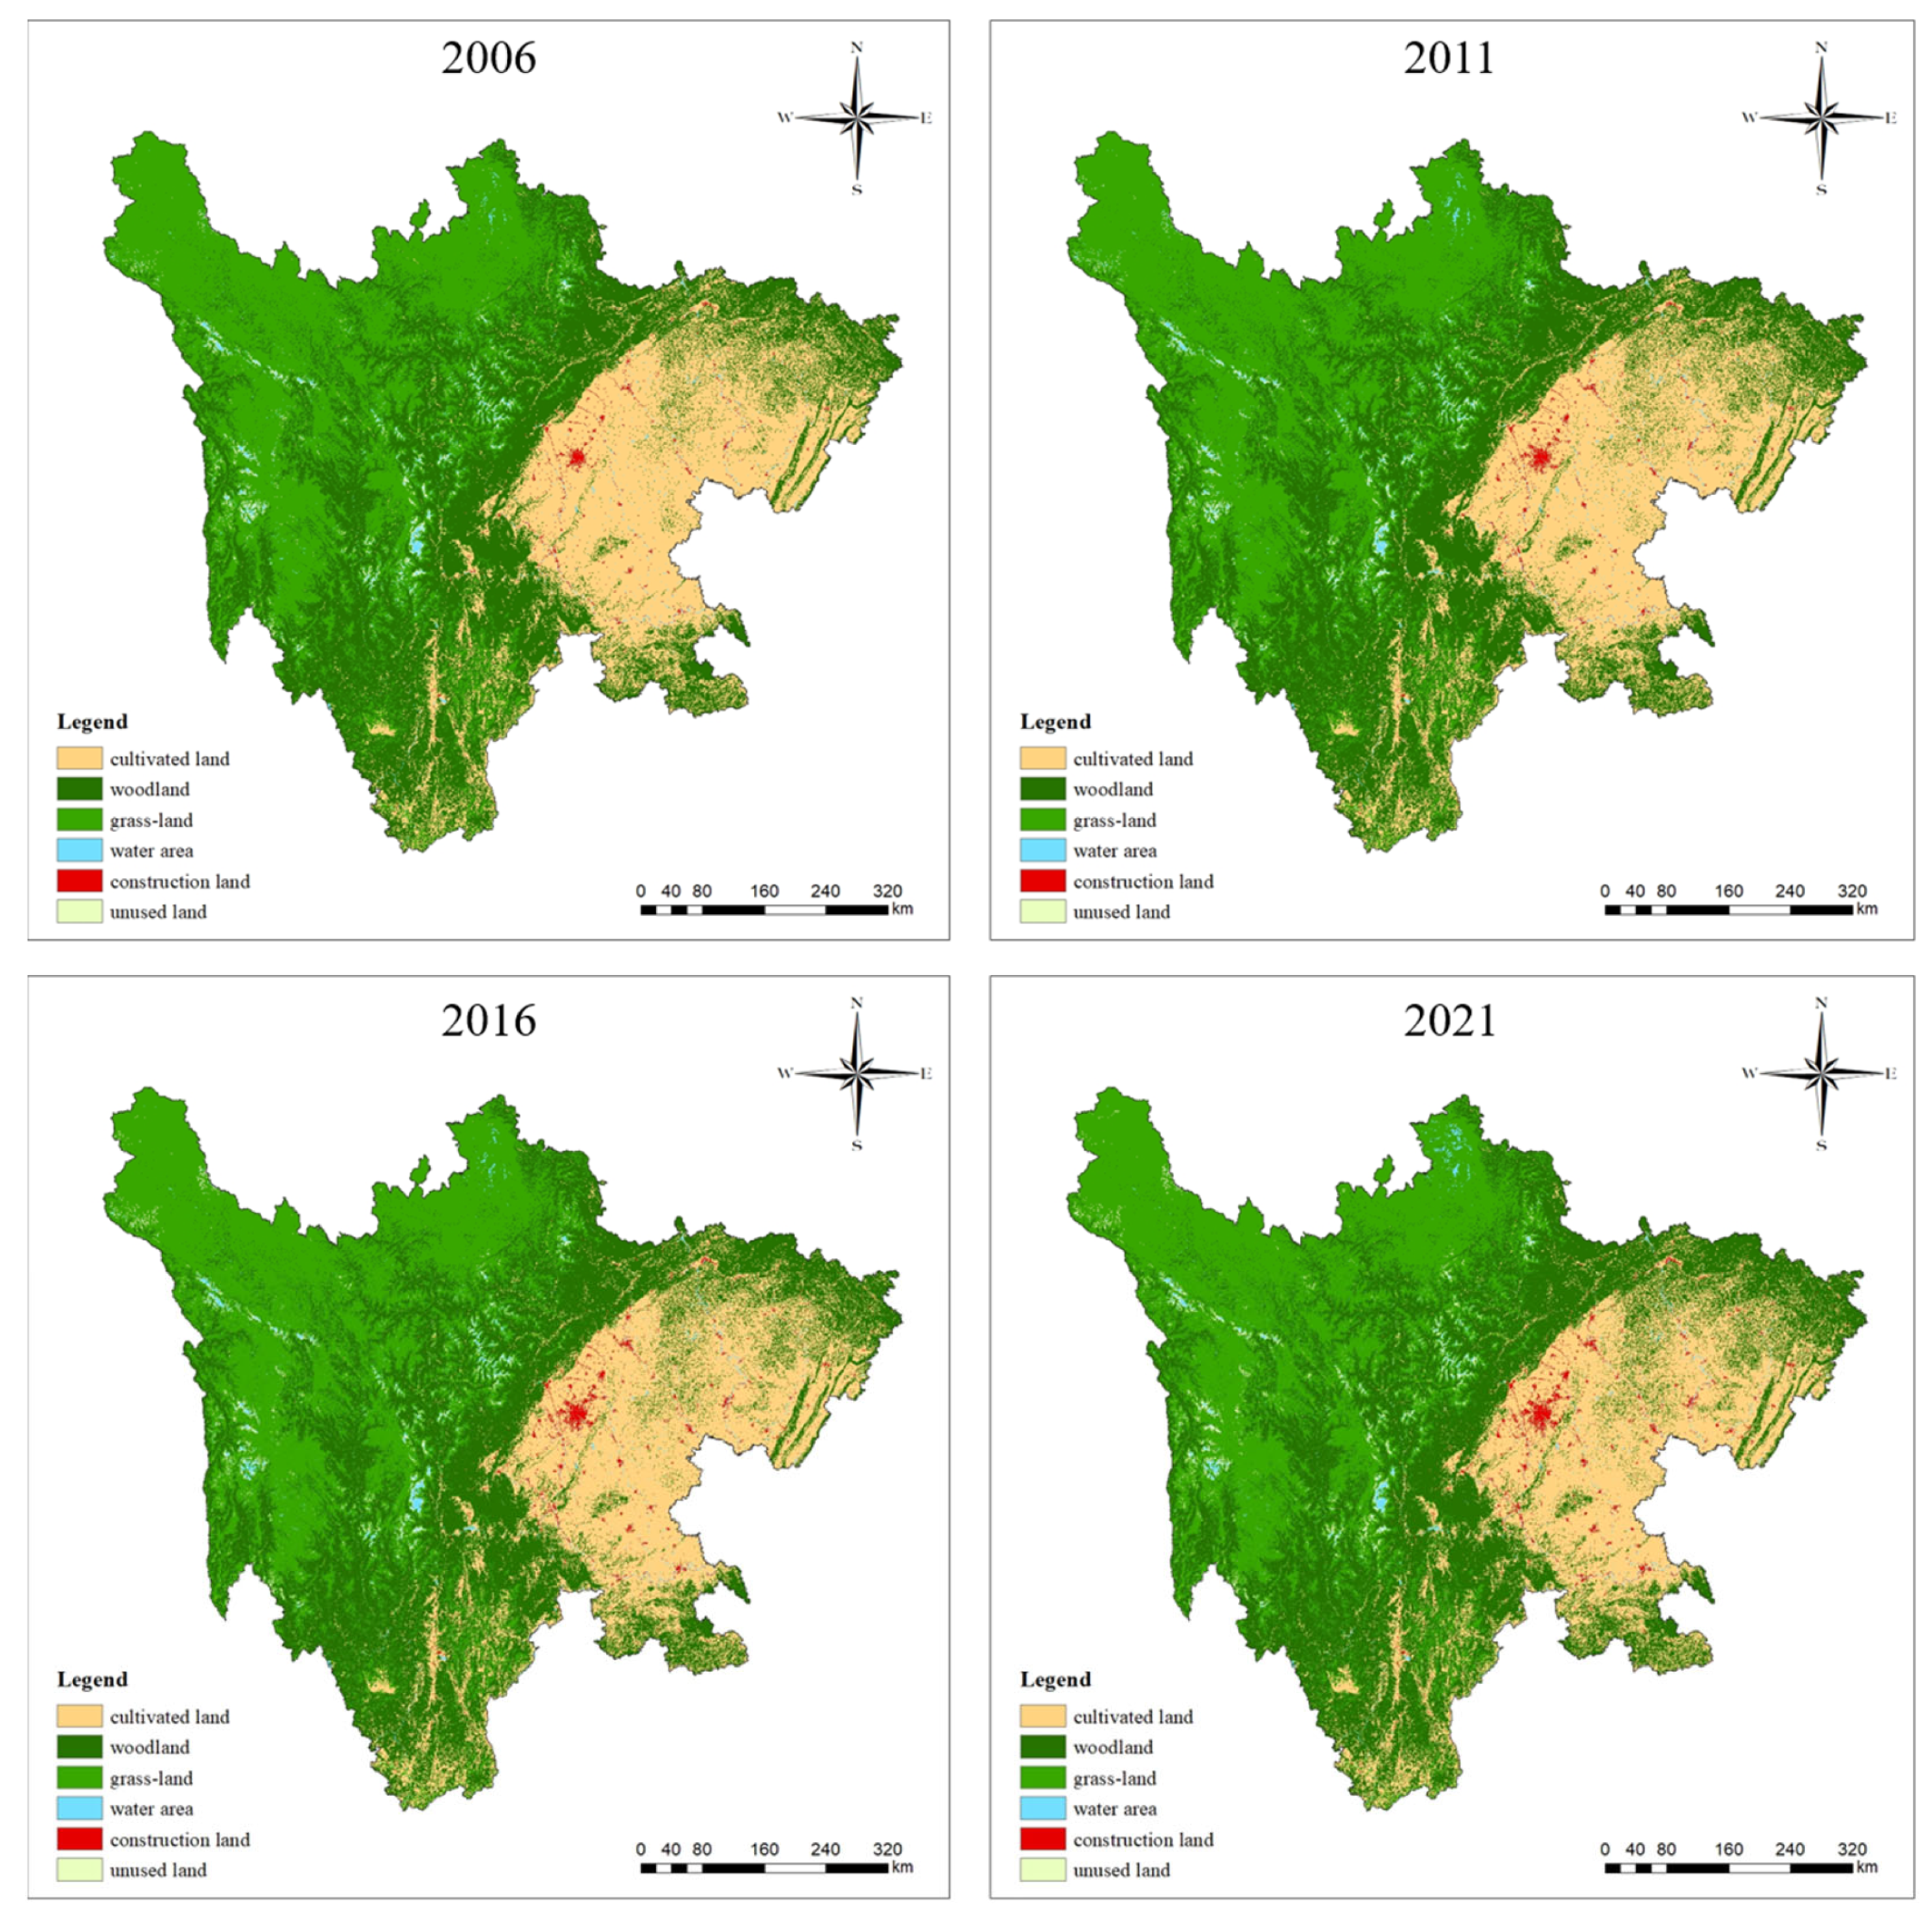
2.2. Data Sources
2.3. Methods
2.3.1. Model of Land-Use Carbon Emission Measurement
2.3.2. Model of Land-Use Carbon Emission Spatial Network Analysis
- Modified gravity model and spatial correlation matrix
- Social Network Analysis model and spatial network characteristics
- (a)
- Overall spatial network characteristics
- (b)
- Network structure characteristics of individual nodes
- (c)
- Network structure characteristics of clusters
3. Results
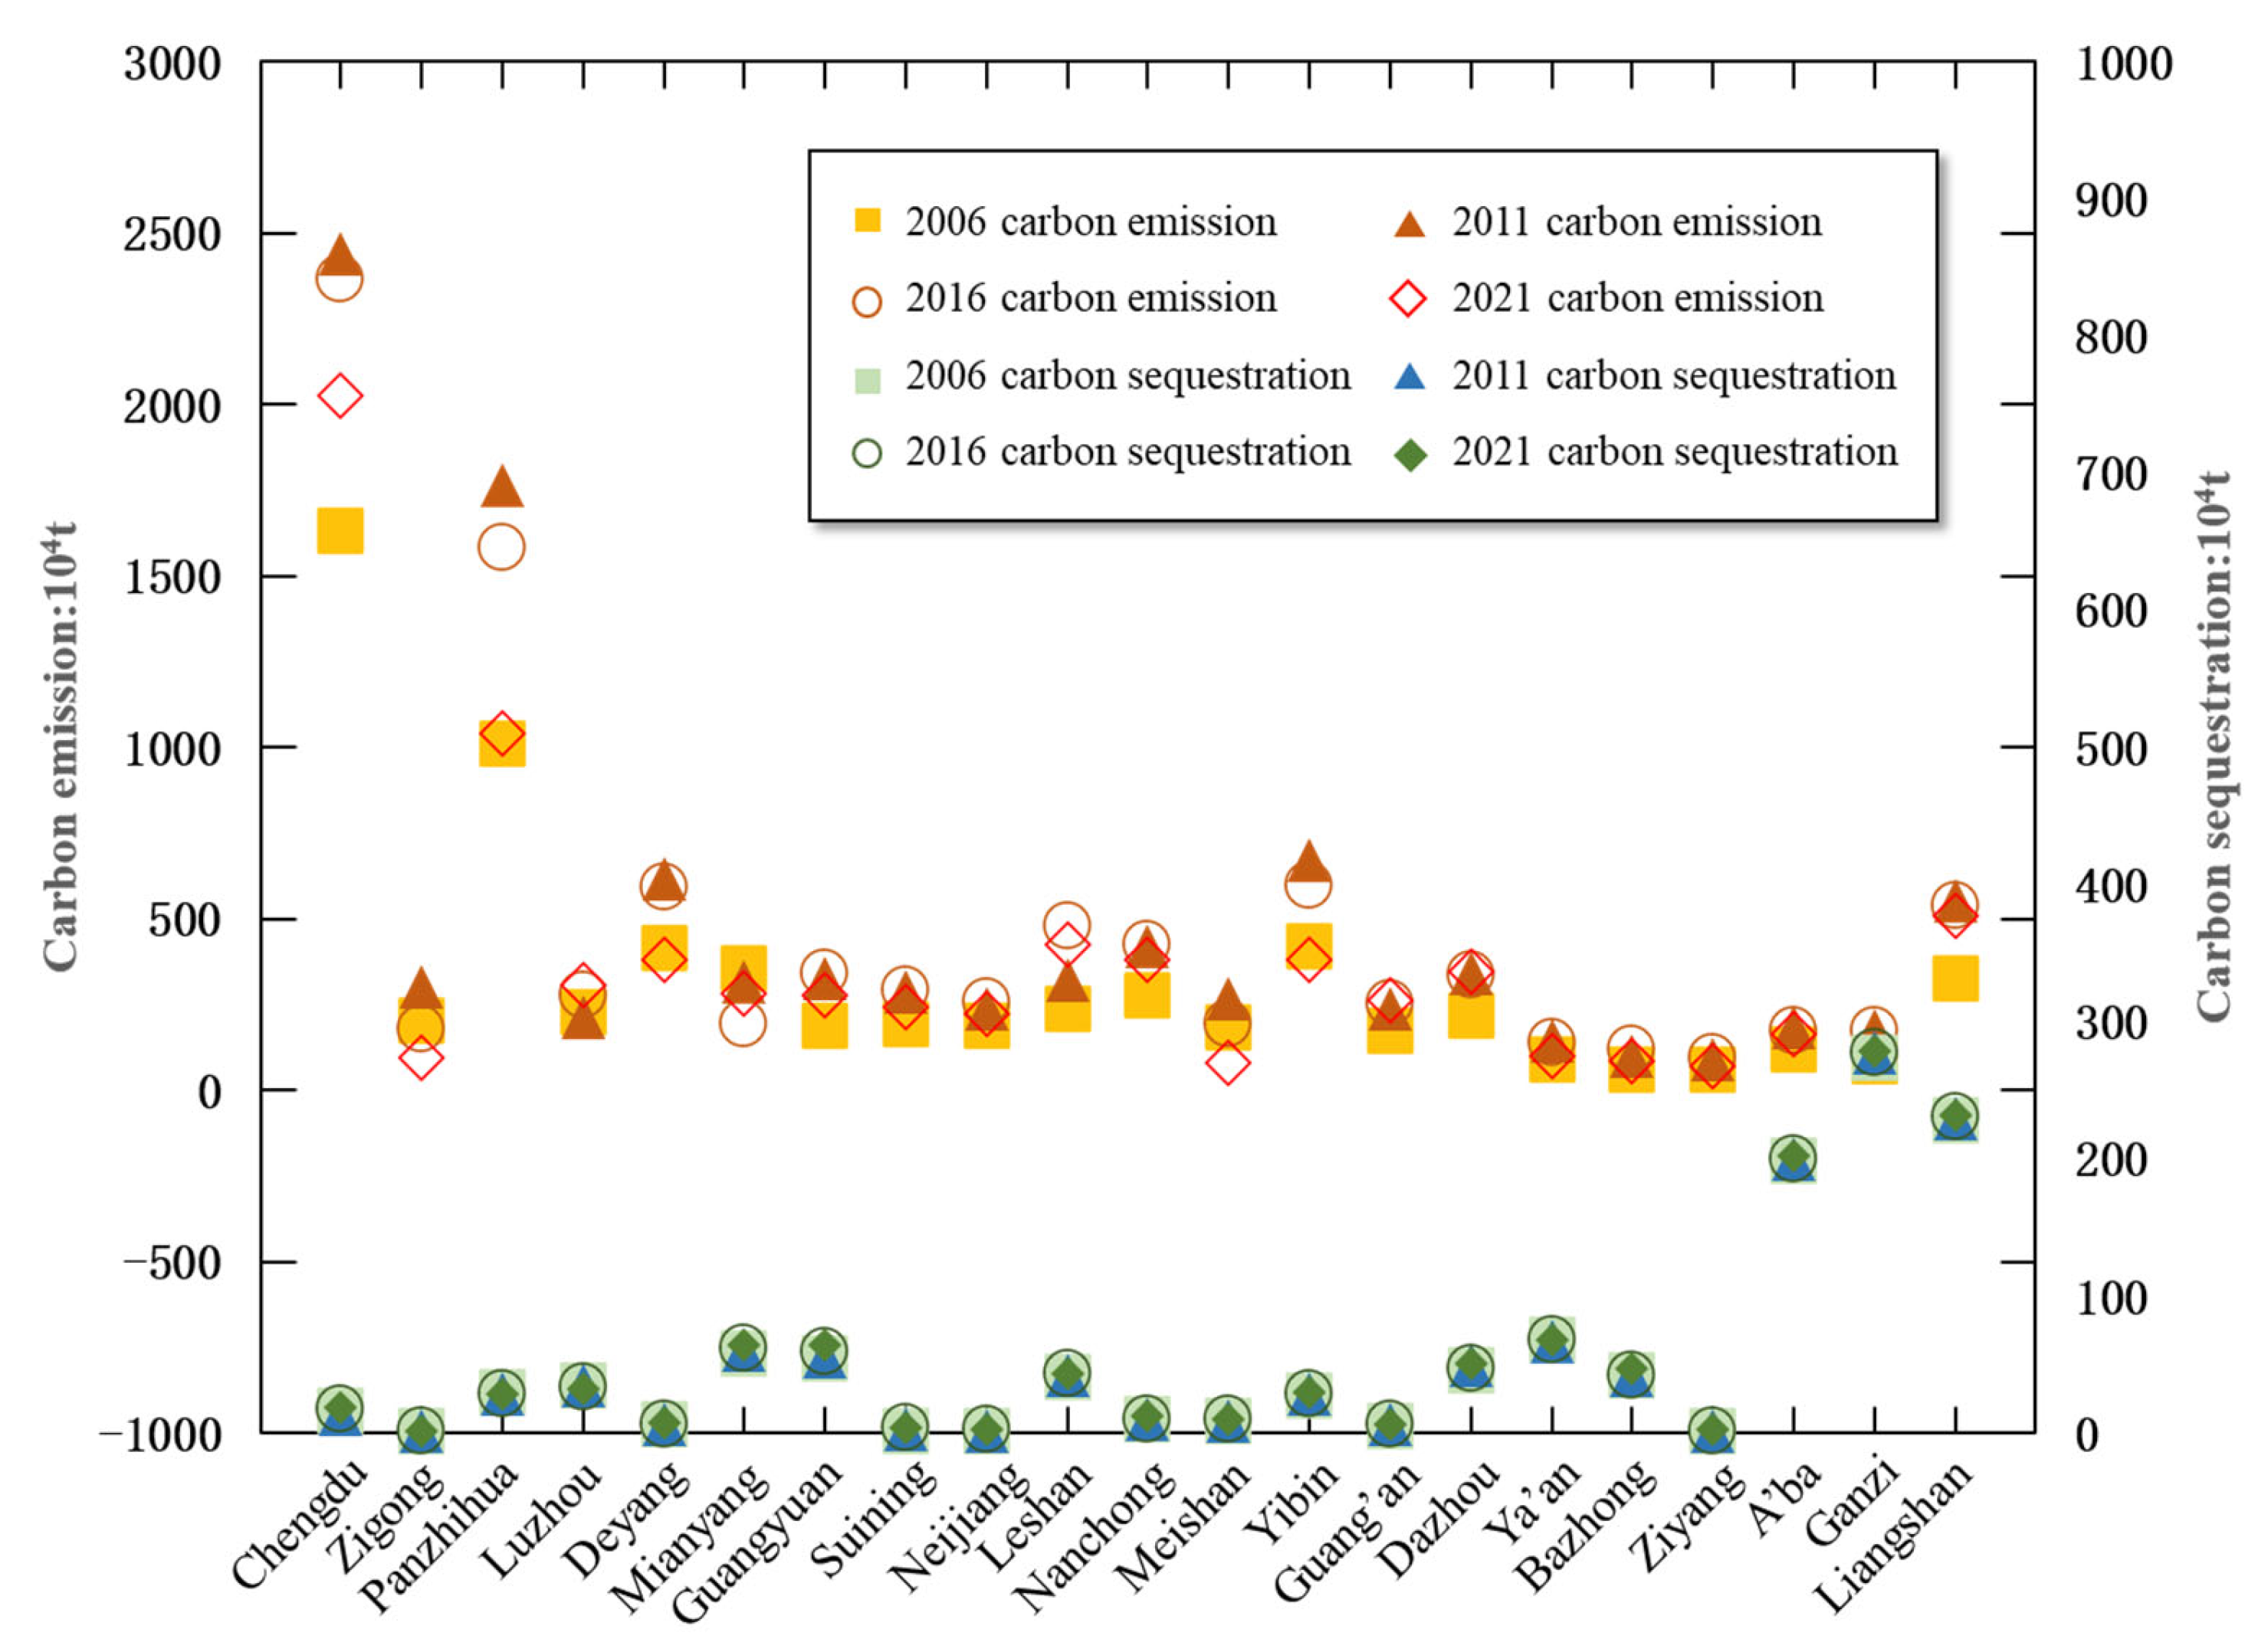
3.1. Land-Use Carbon Emission Measurement Results
3.2. Land-Use Carbon Emission Spatial Network Analysis
3.2.1. Overall Spatial Network Characteristics of Land-Use Carbon Emissions
3.2.2. Spatial Network Characteristics of Nodes of Land-Use Carbon Emissions
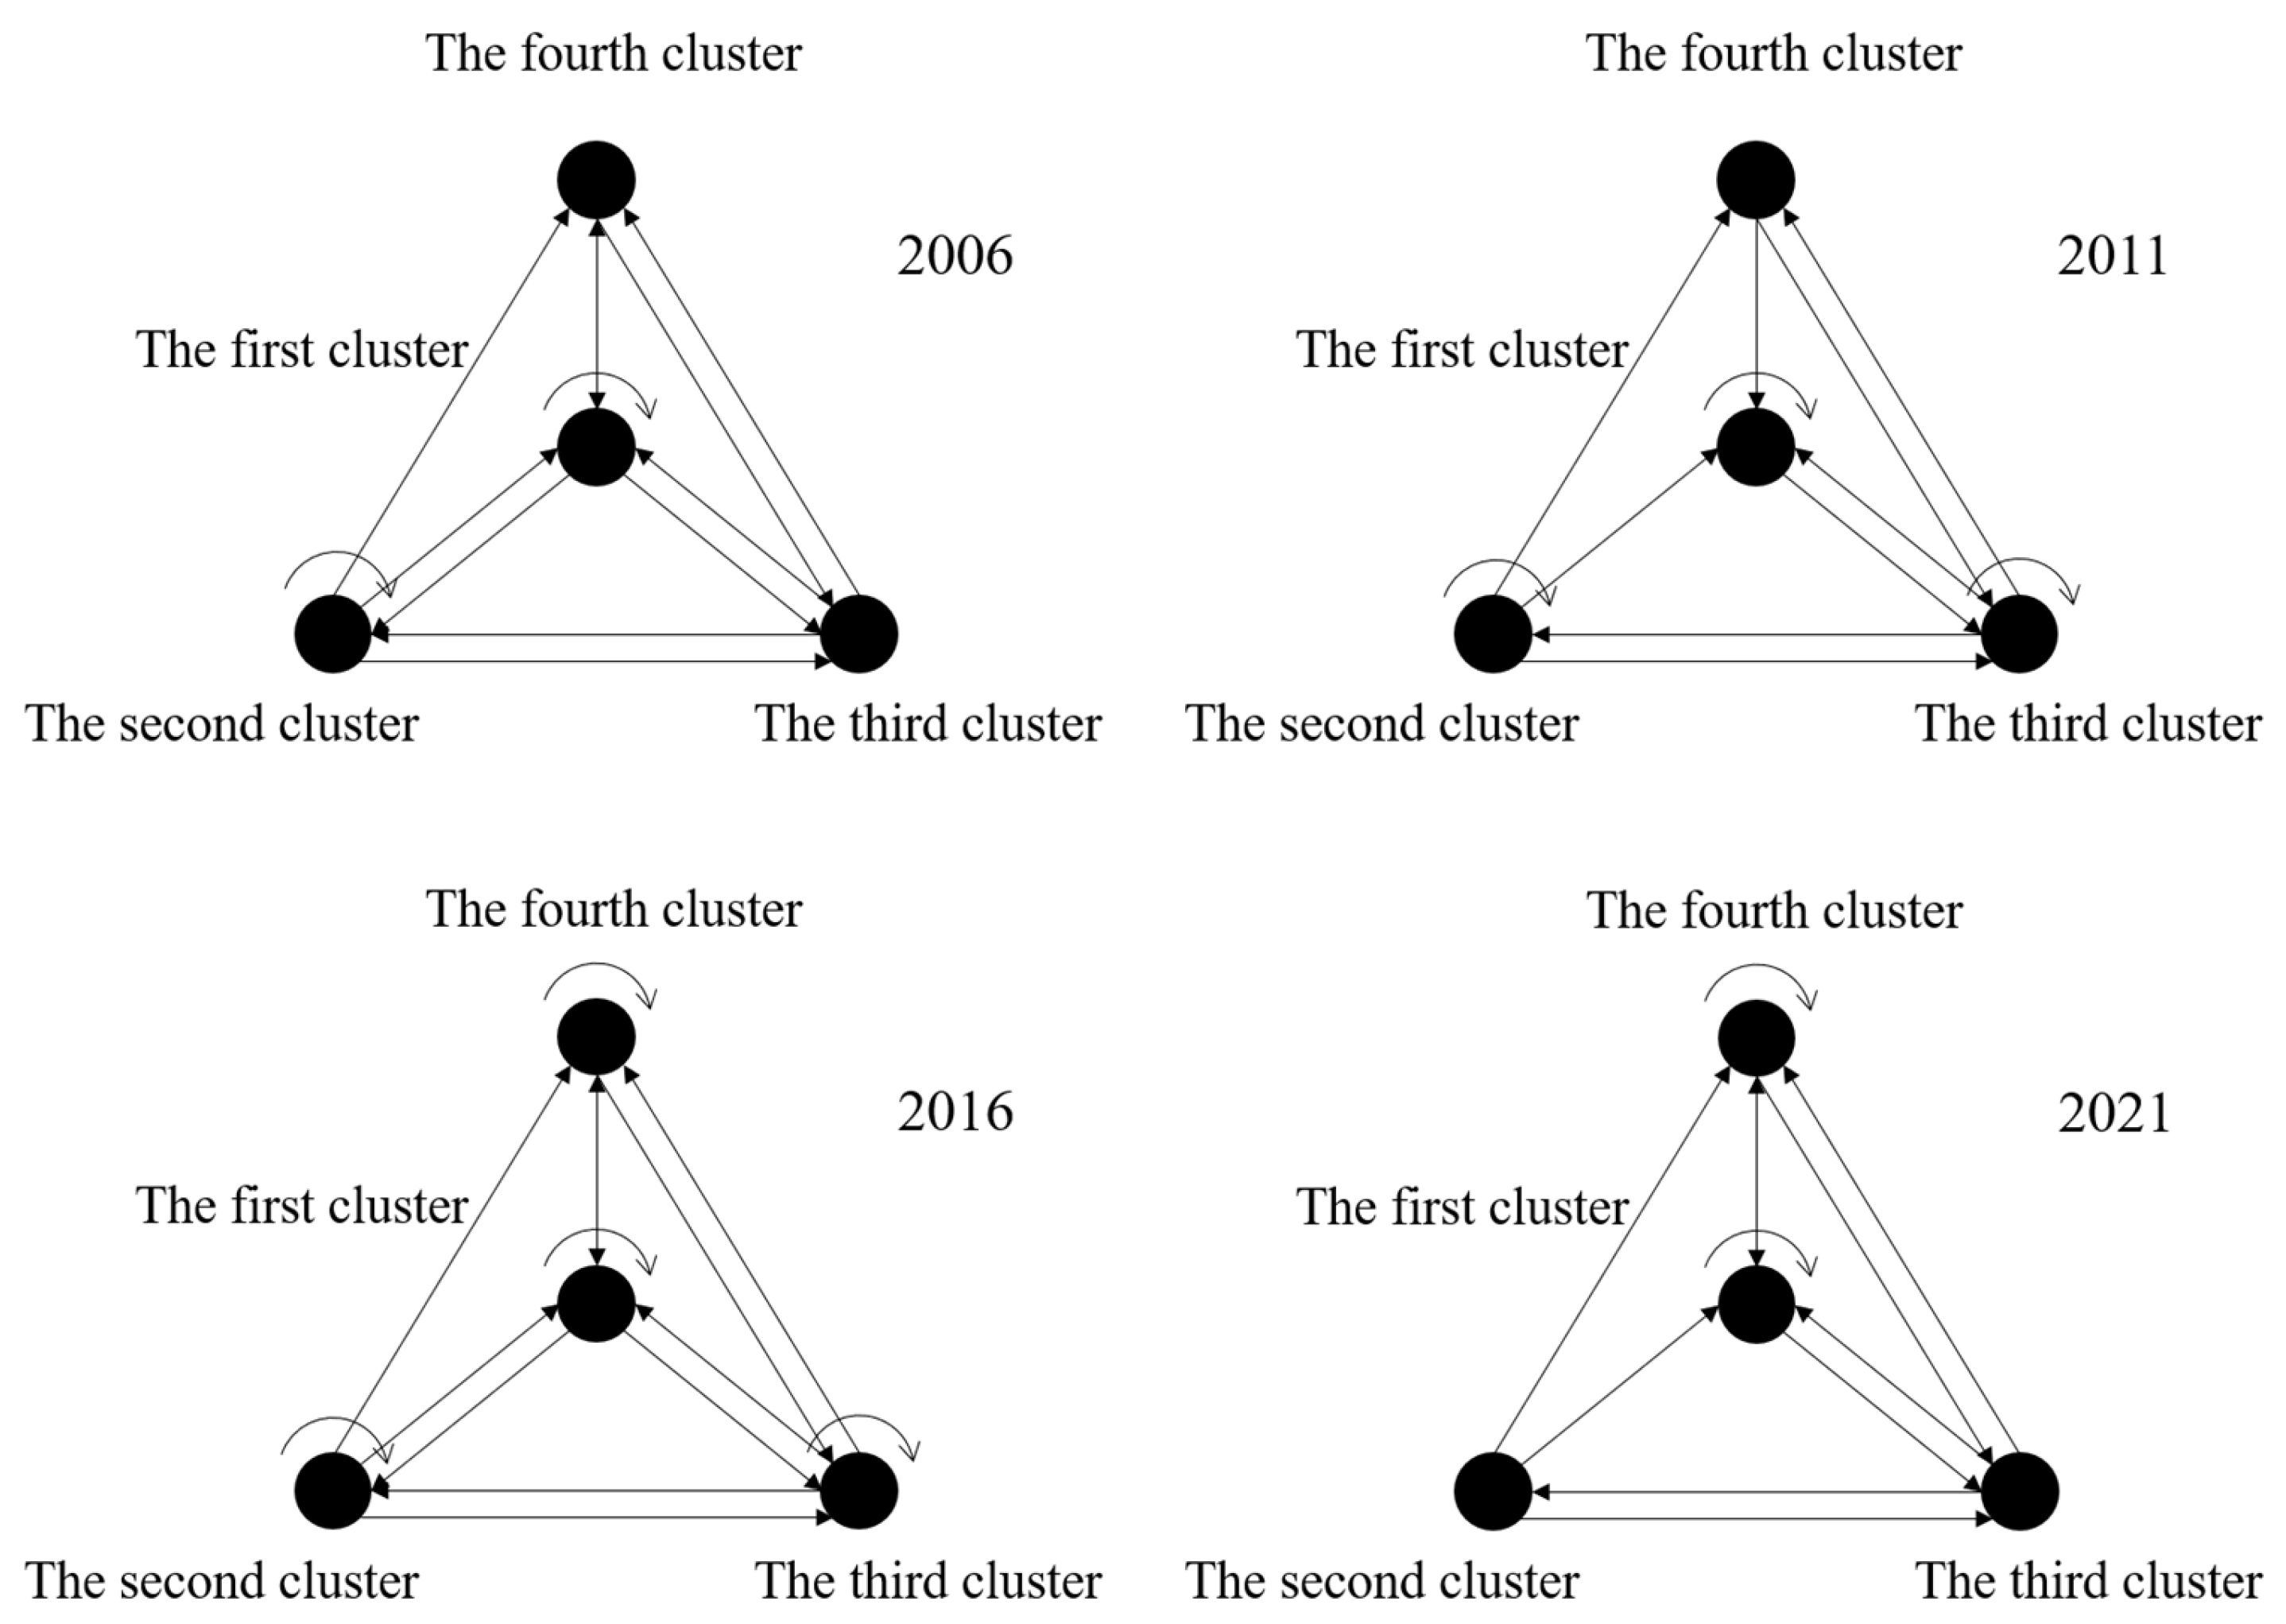
3.2.3. Spatial Network Characteristics of Clusters of Land-use Carbon Emissions
4. Discussion and Policy Implications
- (a)
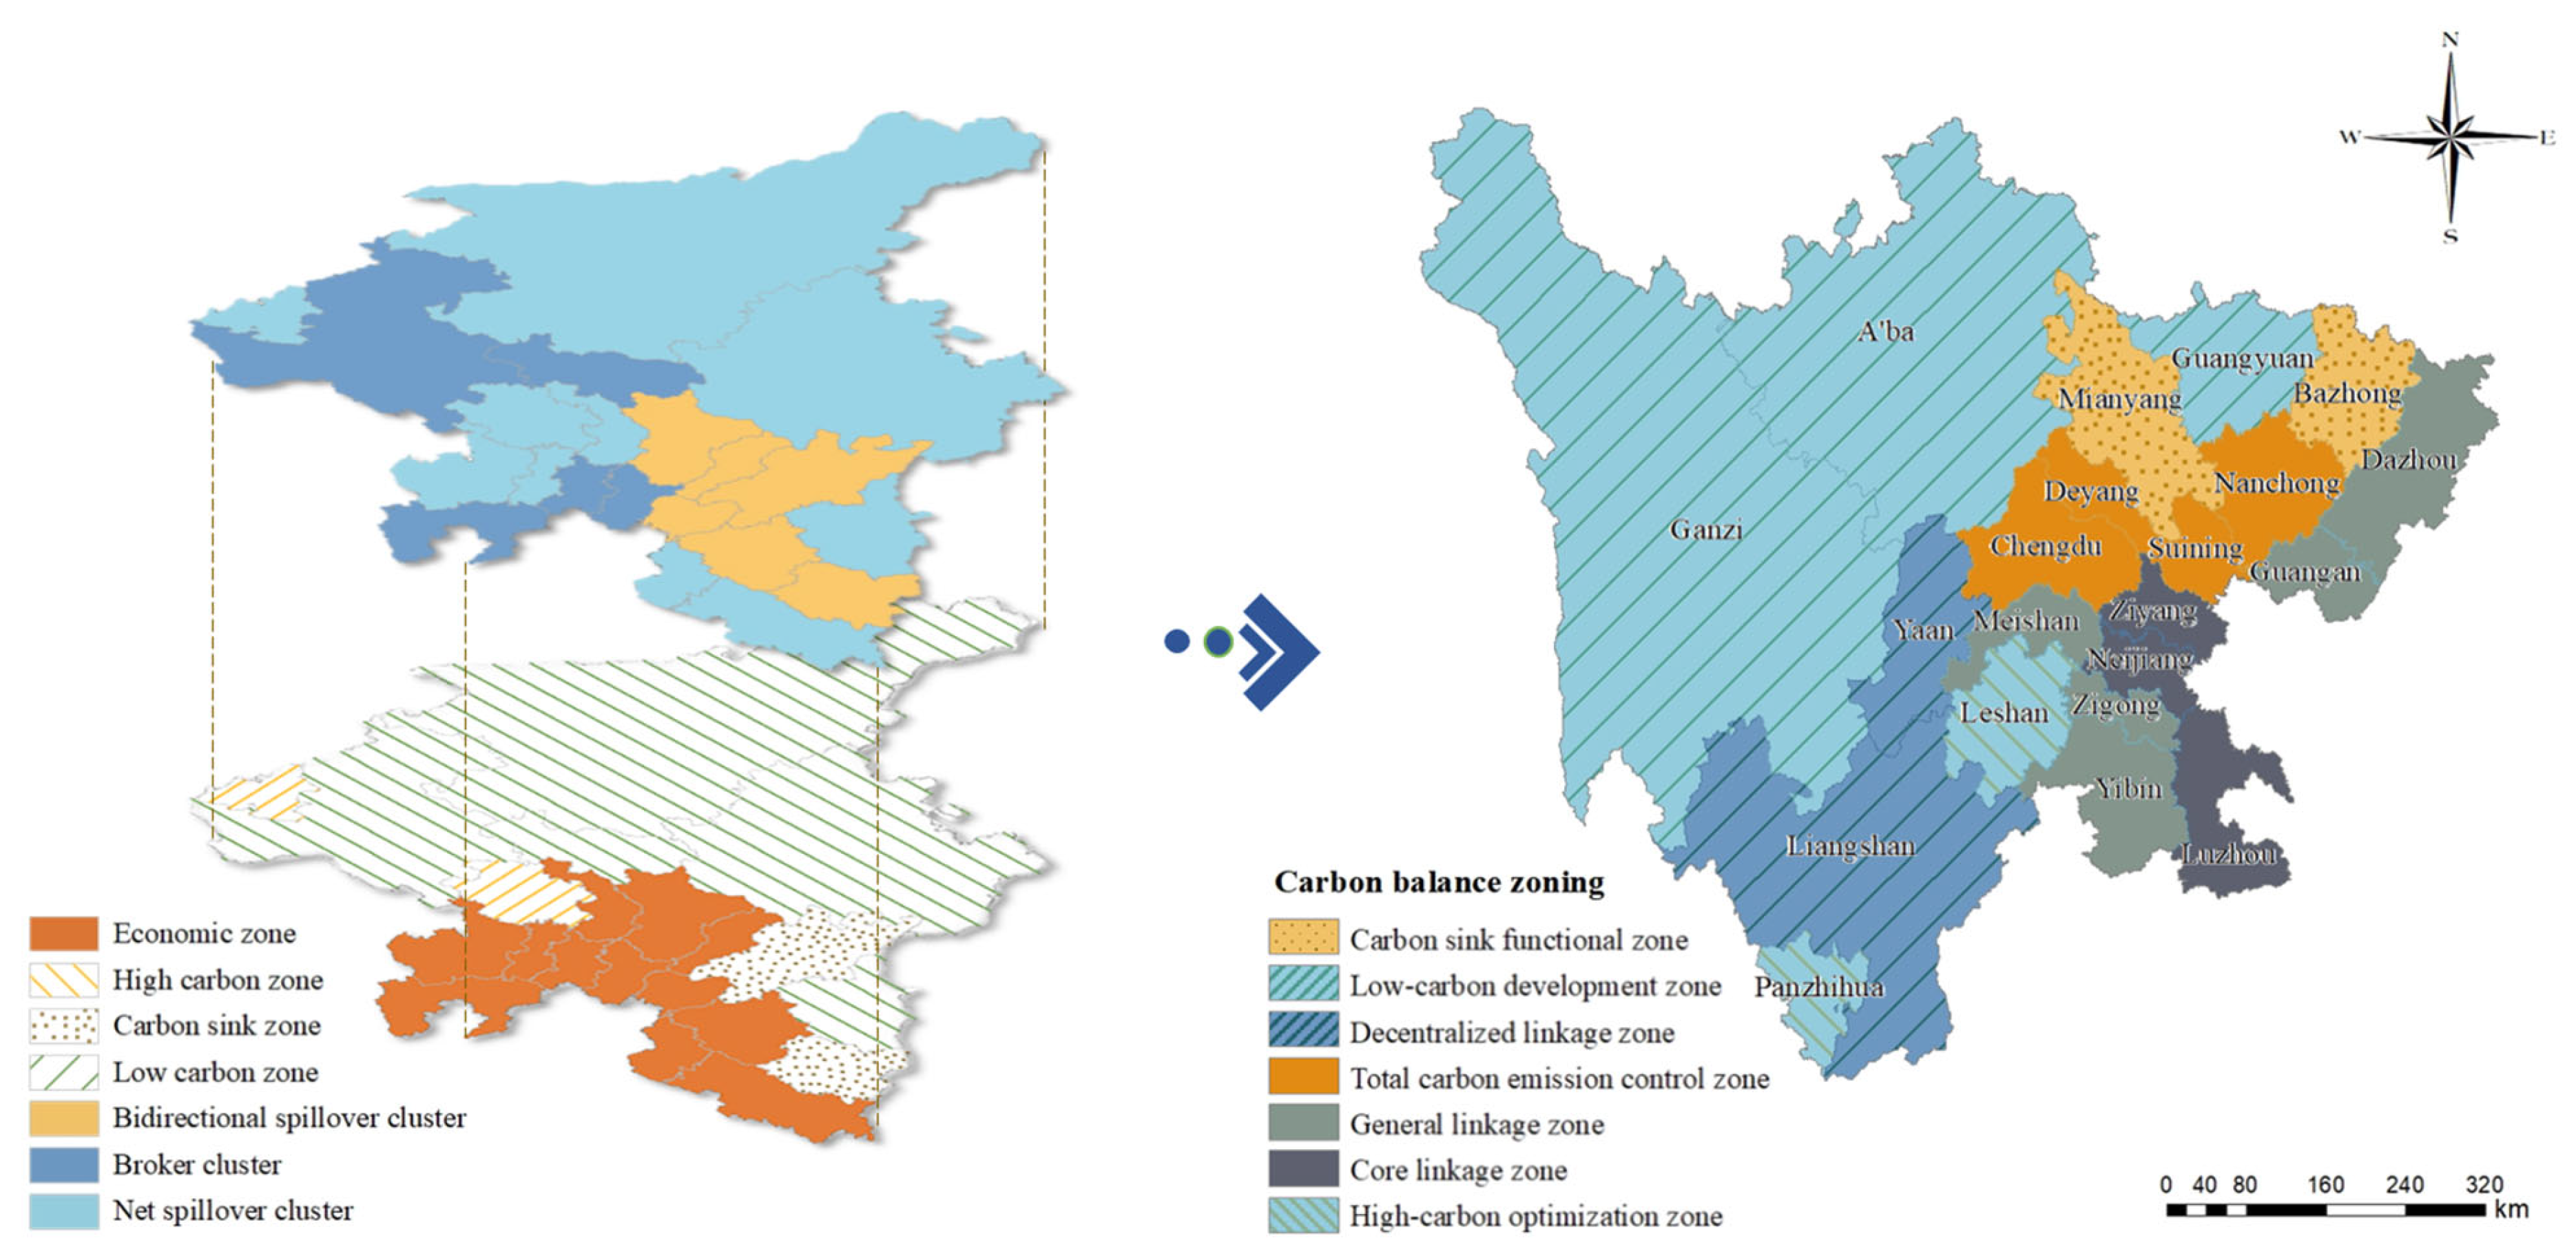
- Carbon sink functional zone: In Sichuan’s case, examples include Mianyang and Bazhong. There are natural scenic spots such as Sichuan Xuebaoding Nature Reserve and Sanjianghu National Wetland Park. This zone could represent areas with relatively high economic contribution coefficients of land-use carbon emissions. This zone should make full use of existing carbon sink resources and protect such resources, maintain a stable economic growth rate, vigorously develop local tourism, and encourage local industries to thrive.
- (b)
- Low-carbon development zone: In Sichuan’s case, examples include A’ba, Ganzi, and Guangyuan. This zone represents areas with strong carbon sequestration capacity and rich carbon sink resources but low levels of economic and social development. Therefore, this region should focus on developing low-carbon green industries according to local conditions, and transforming ecological advantages into economic advantages.
- (c)
- Decentralized linkage zone: In Sichuan’s case, examples include Liangshan and Ya’an. This zone has a high land-use carbon compensation rate and relatively low economic benefits per unit of carbon emissions. This type of zone should focus on the transformation of its economic development paths, through which the zone can drive the adjustment of the energy consumption structure, accelerate technological innovation, and enhance its economic strength. The zone should also play the role of an intermediate “bridge” in the network and establish more ecological connections with surrounding areas to share the land-use carbon source pressure.
- (d)
- Total carbon emission control zone: In Sichuan’s case, examples include Chengdu, Deyang, Suining, and Nanchong. This zone usually has sub-regional centers and lies at the center of the entire carbon emission network. Therefore, the economic development advantage is prominent, and the carbon sink capacity is weak. Since the total carbon emissions are generally high, this type of zone should focus on protecting the ecological environment and realizing coordinated development, accelerating technological modernization, and achieving energy conservation and emission reduction. Furthermore, it should also make full use of the core position to radiate surrounding areas and drive their economic development and technological progress.
- (e)
- General linkage zone: In Sichuan’s case, examples include Meishan, Zigong, Yibin, Dazhou, and Guang’an. This zone is spatially connected to other areas with a land-use carbon emission spillover effect. It represents areas with relatively abundant resources and industrial transfer, which results in carbon emissions overflow. Therefore, this zone should make full use of its energy advantages, improve energy utilization, and pay attention to ecological protection while controlling energy consumption and focusing on energy-saving development.
- (f)
- Core linkage zone: In Sichuan’s case, examples include Luzhou, Neijiang, and Ziyang. The regional average GDP is relatively high, and the ecological pressure is moderate. This zone plays a “broker” role in the spatial network. Therefore, its linkage with the surrounding areas is strong. This area should continue to control carbon sources and reduce the impact on the surrounding areas. Moreover, it should engage in stabilizing and optimizing the source of land-use carbon sinks, alleviating the carbon pressure of the whole province, and better exerting the linkage effect.
- (g)
- High carbon optimization zone: In Sichuan’s case, examples include Panzhihua and Leshan. This zone represents areas with a high total amount of carbon emissions and low ecological carrying capacity. This type of zone should establish the development strategy of ecological priority and green development, strictly control the energy consumption and pollution discharge of enterprises, accelerate technological reform, and build a green and low-carbon industrial system, thus achieving low-carbon sustainable development.
5. Conclusions
Author Contributions
Funding
Data Availability Statement
Conflicts of Interest
References
- Feng, W.; Zhao, R.; Xie, Z.; Ding, M.; Xiao, L.; Sun, J.; Yang, Q.; Liu, T.; You, Z. Land Use Carbon Emission Efficiency and Its Spatial-Temporal Pattern under Carbon Neutral Target: A Case Study of 72 Cities in the Yellow River Basin. China L. Sci. 2023, 37, 102–113. [Google Scholar] [CrossRef]
- Poeplau, C.; Don, A. Sensitivity of Soil Organic Carbon Stocks and Fractions to Different Land-Use Changes across Europe. Geoderma 2013, 192, 189–201. [Google Scholar] [CrossRef]
- IPCC. IPCC Summary for Policymakers. In Climate Change and Land: An IPCC Special Report on Climate Change, Desertification, Land Degradation, Sustainable Land Management, Food Security, and Greenhouse Gas Fluxes in Terrestrial Ecosystems; IPCC: Geneva, Switzerland, 2019; pp. 3–22. ISBN 9781139177245. [Google Scholar]
- Ren, X.; Li, Y.; Duan, K.; Mishra, T. Evaluation of European Union Carbon and Energy Networks: Evidence from Market Efficiency. Energy Environ. 2023, 1–24. [Google Scholar] [CrossRef]
- Jiang, M.; An, H.; Gao, X.; Liu, S.; Xi, X. Factors Driving Global Carbon Emissions: A Complex Network Perspective. Resour. Conserv. Recycl. 2019, 146, 431–440. [Google Scholar] [CrossRef]
- Lu, P.; Li, Z.; Wen, Y.; Liu, J.; Yuan, Y.; Niu, R.; Wang, Y.; Han, L. Fresh Insights for Sustainable Development: Collaborative Governance of Carbon Emissions Based on Social Network Analysis. Sustain. Dev. 2023, 31, 1873–1887. [Google Scholar] [CrossRef]
- Su, J.; Zhou, B.; Liao, Y.; Wang, C.; Feng, T. Impact Mechanism of the Urban Network on Carbon Emissions in Rapidly Developing Regions: Example of 47 Cities in Southwest China. Land 2022, 11, 458. [Google Scholar] [CrossRef]
- The State Council Information Office of the People’s Republic of China. Responding to Climate Change: China’s Policies and Actions; The State Council Information Office of the People’s Republic of China: Beijing, China, 2022. [Google Scholar]
- IEA. CO2 Emissions in 2022; International Energy Agency: Washington, DC, USA, 2022. [Google Scholar]
- Chuai, X.; Huang, X.; Wang, W.; Zhao, R.; Zhang, M.; Wu, C. Land Use, Total Carbon Emissions Change and Low Carbon Land Management in Coastal Jiangsu, China. J. Clean. Prod. 2015, 103, 77–86. [Google Scholar] [CrossRef]
- Houghton, R.A.; House, J.I.; Pongratz, J.; Van Der Werf, G.R.; Defries, R.S.; Hansen, M.C.; Le Quéré, C.; Ramankutty, N. Carbon Emissions from Land Use and Land-Cover Change. Biogeosciences 2012, 9, 5125–5142. [Google Scholar] [CrossRef]
- Campbell, C.D.; Lilly, A.; Towers, W.; Chapman, S.J.; Werritty, A.; Hanley, N. Land Use and a Low-Carbon Society. Earth Environ. Sci. Trans. R. Soc. Edinb. 2012, 103, 165–173. [Google Scholar] [CrossRef]
- Moran, D.; MacLeod, M.; Wall, E.; Eory, V.; McVittie, A.; Barnes, A.; Rees, R.M.; Topp, C.F.E.; Pajot, G.; Matthews, R.; et al. Developing Carbon Budgets for UK Agriculture, Land-Use, Land-Use Change and Forestry out to 2022. Clim. Chang. 2011, 105, 529–553. [Google Scholar] [CrossRef]
- Ulrich, V.; Schultz, M.; Lautenbach, S.; Zipf, A. Carbon Fluxes Related to Land Use and Land Cover Change in Baden-Württemberg. Environ. Monit. Assess. 2023, 195, 616. [Google Scholar] [CrossRef] [PubMed]
- Smith, S.J.; Rothwell, A. Carbon Density and Anthropogenic Land-Use Influences on Net Land-Use Change Emissions. Biogeosciences 2013, 10, 6323–6337. [Google Scholar] [CrossRef]
- Mahowald, N.M.; Randerson, J.T.; Lindsay, K.; Munoz, E.; Doney, S.C.; Lawrence, P.; Schlunegger, S.; Ward, D.S.; Lawrence, D.; Hoffman, F.M. Interactions between Land Use Change and Carbon Cycle Feedbacks. Glob. Biogeochem. Cycles 2017, 31, 96–113. [Google Scholar] [CrossRef]
- Mishra, A.; Humpenöder, F.; Churkina, G.; Reyer, C.P.O.; Beier, F.; Bodirsky, B.L.; Schellnhuber, H.J.; Lotze-Campen, H.; Popp, A. Land Use Change and Carbon Emissions of a Transformation to Timber Cities. Nat. Commun. 2022, 13, 4889. [Google Scholar] [CrossRef] [PubMed]
- Beillouin, D.; Demenois, J.; Cardinael, R.; Berre, D.; Corbeels, M.; Fallot, A.; Boyer, A.; Feder, F. A Global Database of Land Management, Land-Use Change and Climate Change Effects on Soil Organic Carbon. Sci. Data 2022, 9, 228. [Google Scholar] [CrossRef]
- Beillouin, D.; Cardinael, R.; Berre, D.; Boyer, A.; Corbeels, M.; Fallot, A.; Feder, F.; Demenois, J. A Global Overview of Studies about Land Management, Land-use Change, and Climate Change Effects on Soil Organic Carbon. Glob. Chang. Biol. 2022, 28, 1690–1702. [Google Scholar] [CrossRef]
- Tian, S.; Wang, S.; Bai, X.; Luo, G.; Li, Q.; Yang, Y.; Hu, Z.; Li, C.; Deng, Y. Global Patterns and Changes of Carbon Emissions from Land Use during 1992–2015. Environ. Sci. Ecotechnol. 2021, 7, 100108. [Google Scholar] [CrossRef]
- Chini, L.; Hurtt, G.; Sahajpal, R.; Frolking, S.; Klein Goldewijk, K.; Sitch, S.; Ganzenmüller, R.; Ma, L.; Ott, L.; Pongratz, J.; et al. Land-Use Harmonization Datasets for Annual Global Carbon Budgets. Earth Syst. Sci. Data 2021, 13, 4175–4189. [Google Scholar] [CrossRef]
- Li, Y.; Liu, W.; Feng, Q.; Zhu, M.; Yang, L.; Zhang, J. Effects of Land Use and Land Cover Change on Soil Organic Carbon Storage in the Hexi Regions, Northwest China. J. Environ. Manag. 2022, 312, 114911. [Google Scholar] [CrossRef]
- Dumortier, J.; Elobeid, A. Effects of a Carbon Tax in the United States on Agricultural Markets and Carbon Emissions from Land-Use Change. Land Use Policy 2021, 103, 105320. [Google Scholar] [CrossRef]
- Tang, X.; Woodcock, C.E.; Olofsson, P.; Hutyra, L.R. Spatiotemporal Assessment of Land Use/Land Cover Change and Associated Carbon Emissions and Uptake in the Mekong River Basin. Remote Sens. Environ. 2021, 256, 112336. [Google Scholar] [CrossRef]
- Hung, L.Q.; Asaeda, T.; Thao, V.T.P. Carbon Emissions in the Field of Land Use, Land Use Change, and Forestry in the Vietnam Mainland. Wetl. Ecol. Manag. 2021, 29, 315–329. [Google Scholar] [CrossRef]
- Liu, J.; Shi, D.; Wang, C. A Study on Spatial Spillover and Correlation Effect of Carbon Emissions across 30 Provinces in China. J. Nat. Resour. 2015, 30, 1289–1303. [Google Scholar] [CrossRef]
- Komeili Birjandi, A.; Fahim Alavi, M.; Salem, M.; Assad, M.E.H.; Prabaharan, N. Modeling Carbon Dioxide Emission of Countries in Southeast of Asia by Applying Artificial Neural Network. Int. J. Low-Carbon Technol. 2022, 17, 321–326. [Google Scholar] [CrossRef]
- Sun, Y.; Jia, J.; Ju, M.; Chen, C. Spatiotemporal Dynamics of Direct Carbon Emission and Policy Implication of Energy Transition for China’s Residential Consumption Sector by the Methods of Social Network Analysis and Geographically Weighted Regression. Land 2022, 11, 1039. [Google Scholar] [CrossRef]
- Wei, J.; Xia, L.; Chen, L.; Zhang, Y.; Yang, Z. A Network-Based Framework for Characterizing Urban Carbon Metabolism Associated with Land Use Changes: A Case of Beijing City, China. J. Clean. Prod. 2022, 371, 133695. [Google Scholar] [CrossRef]
- Sun, L.; Qin, L.; Taghizadeh-Hesary, F.; Zhang, J.; Mohsin, M.; Chaudhry, I.S. Analyzing Carbon Emission Transfer Network Structure among Provinces in China: New Evidence from Social Network Analysis. Environ. Sci. Pollut. Res. 2020, 27, 23281–23300. [Google Scholar] [CrossRef]
- Yu, Z.; Chen, L.; Tong, H.; Chen, L.; Zhang, T.; Li, L.; Yuan, L.; Xiao, J.; Wu, R.; Bai, L.; et al. Spatial Correlations of Land-Use Carbon Emissions in the Yangtze River Delta Region: A Perspective from Social Network Analysis. Ecol. Indic. 2022, 142, 109147. [Google Scholar] [CrossRef]
- Wang, F.; Gao, M.; Liu, J.; Fan, W. The Spatial Network Structure of China’s Regional Carbon Emissions and Its Network Effect. Energies 2018, 11, 2706. [Google Scholar] [CrossRef]
- Jiang, M.; An, H.; Gao, X.; Zheng, H.; Li, Y. Identifying the Key Sectors in the Carbon Emission Flows along the Production Chain Paths: A Network Perspective. Ecol. Indic. 2021, 130, 108050. [Google Scholar] [CrossRef]
- Yang, J.; Huang, X. The 30 m Annual Land Cover Dataset and Its Dynamics in China from 1990 to 2019. Earth Syst. Sci. Data 2021, 13, 3907–3925. [Google Scholar] [CrossRef]
- Shi, W.; Zhao, X.; Zhao, J.; Zhao, S.; Guo, Y.; Liu, N.; Sun, N.; Du, X.; Sun, M. Reliability and Consistency Assessment of Land Cover Products at Macro and Local Scales in Typical Cities. Int. J. Digit. Earth 2023, 16, 486–508. [Google Scholar] [CrossRef]
- Liu, B.; Zhang, Z.; Pan, L.; Sun, Y.; Ji, S.; Guan, X.; Li, J.; Xu, M. Comparison of Various Annual Land Cover Datasets in the Yellow River Basin. Remote Sens. 2023, 15, 2539. [Google Scholar] [CrossRef]
- Mi, Z.; Meng, J.; Guan, D.; Shan, Y.; Song, M.; Wei, Y.M.; Liu, Z.; Hubacek, K. Chinese CO2 Emission Flows Have Reversed since the Global Financial Crisis. Nat. Commun. 2017, 8, 1712. [Google Scholar] [CrossRef] [PubMed]
- Liu, Z.; Guan, D.; Wei, W.; Davis, S.J.; Ciais, P.; Bai, J.; Peng, S.; Zhang, Q.; Hubacek, K.; Marland, G.; et al. Reduced Carbon Emission Estimates from Fossil Fuel Combustion and Cement Production in China. Nature 2015, 524, 335–338. [Google Scholar] [CrossRef]
- Chen, J.; Gao, M.; Cheng, S.; Hou, W.; Song, M.; Liu, X.; Liu, Y.; Shan, Y. County-Level CO2 Emissions and Sequestration in China during 1997–2017. Sci. Data 2020, 7, 391. [Google Scholar] [CrossRef] [PubMed]
- Shan, Y.; Guan, Y.; Hang, Y.; Zheng, H.; Li, Y.; Guan, D.; Li, J.; Zhou, Y.; Li, L.; Hubacek, K. City-Level Emission Peak and Drivers in China. Sci. Bull. 2022, 67, 1910–1920. [Google Scholar] [CrossRef]
- Cui, Q.; Yang, J.; Dong, W. Determinants of the Variance of Estimations on China’s Carbon Emission Based on Meta-Analysis. China Popul. Resour. Environ. 2016, 26, 35–41. [Google Scholar] [CrossRef]
- Yu, S.; Wei, Y.M.; Guo, H.; Ding, L. Carbon Emission Coefficient Measurement of the Coal-to-Power Energy Chain in China. Appl. Energy 2014, 114, 290–300. [Google Scholar] [CrossRef]
- Lan, J.; Fu, W.; Yuan, B.; Zhang, T.; Peng, J. Analysis of Land Use Patterns on Carbon Emission and Carbon Footprint in Chongqing City. J. Soil Water Conserv. 2012, 26, 146–155. [Google Scholar] [CrossRef]
- Ji, X.; Liu, H.; Zhang, Y. Spatiotemporal Evolution and Driving Factors of Spatial Correlation Network Strucutre of China’s Land-Use Carbon Emission. Econ. Geogr. 2023, 43, 190–200. [Google Scholar] [CrossRef]
- Wei, Y.; Chen, S. Spatial Correlation and Carbon Balance Zoning of Land Use Carbon Emissions in Fujian Province. Acta Ecol. Sin. 2021, 41, 5814–5824. [Google Scholar] [CrossRef]
- Isard, W. Location Theory and Trade Theory: Short-Run Analysis. Q. J. Econ. 1954, 68, 305–320. [Google Scholar] [CrossRef]
- Anderson, J.E. A Theoretical Foundation for the Gravity Equation. Am. Econ. Rev. 1979, 69, 106–116. [Google Scholar]
- Gan, C.; Wang, K.; Voda, M. Decoupling Relationship between Carbon Emission and Economic Development in the Service Sector: Case of 30 Provinces in China. Environ. Sci. Pollut. Res. 2022, 29, 63846–63858. [Google Scholar] [CrossRef]
- Liu, C.; Sun, W.; Li, P.; Zhang, L.; Li, M. Differential Characteristics of Carbon Emission Efficiency and Coordinated Emission Reduction Pathways under Different Stages of Economic Development: Evidence from the Yangtze River Delta, China. J. Environ. Manag. 2023, 330, 117018. [Google Scholar] [CrossRef]
- The People’s Government of Sichuan Province. Quantitative Research Report on the Degree of Regional Cooperation in the Cheng-Du-Chongqing Economic Circle; The People’s Government of Sichuan Province: Chengdu, China, 2022. [Google Scholar]
- Zhang, D.; Yao, X. Analysis of Spatial Correlation Networks of Carbon Emissions in Emerging Economies. Environ. Sci. Pollut. Res. 2023, 30, 87465–87482. [Google Scholar] [CrossRef]
- Snyder, D.; Kick, E.L. Structural Position in the World System and Economic Growth, 1955–1970: A Multiple-Network Analysis of Transnational Interactions. Am. J. Sociol. 1979, 84, 1096–1126. [Google Scholar] [CrossRef]
- Chen, Y.; Wen, C.; Shen, T. Evaluation and Spatial-Temporal Evolution of Green Development Efficiency in Chengdu-Chongqing Twin City Economic Circle. Resour. Environ. Yangtze Basin 2022, 31, 1137–1151. [Google Scholar]
- Burt, R.S. Positions in Networks. Soc. Forces 1976, 55, 93–122. [Google Scholar] [CrossRef]
- Ding, Z.; Gao, X.; Qian, X.; Wang, H. Governmental Inspection and Local Legislation on Environmental Protection: Evidence from China. J. Econ. Surv. 2022, 36, 728–763. [Google Scholar] [CrossRef]
- Earnhart, D.; Friesen, L. Enforcement Federalism: Comparing the Effectiveness of Federal Punishment versus State Punishment. Environ. Resour. Econ. 2021, 78, 227–255. [Google Scholar] [CrossRef]
- Hedemann-Robinson, M. Environmental Inspections and the EU: Securing an Effective Role for a Supranational Union Legal Framework. Transnatl. Environ. Law 2017, 6, 31–58. [Google Scholar] [CrossRef]
- Spina, F. Environmental Justice and Patterns of State Inspections. Soc. Sci. Q. 2015, 96, 417–429. [Google Scholar] [CrossRef]
- Zhang, R.; Matsushima, K.; Kobayashi, K. Land Use Policy Can Land Use Planning Help Mitigate Transport-Related Carbon Emissions ? A Case of Changzhou. Land Use Policy 2018, 74, 32–40. [Google Scholar] [CrossRef]
- Wang, S.; Huang, S.; Huang, P. Can Spatial Planning Really Mitigate Carbon Dioxide Emissions in Urban Areas? A Case Study in Taipei, Taiwan. Landsc. Urban Plan. 2018, 169, 22–36. [Google Scholar] [CrossRef]
- Abbas, G.; Kasimu, A. Characteristics of Land-Use Carbon Emissions and Carbon Balance Zoning in the Economic Belt on the Northern Slope of Tianshan. Sustainability 2023, 15, 11778. [Google Scholar] [CrossRef]
- Zhang, Z.; Zhang, D. Spatial Connection of Carbon Emission and Carbon Balance Zoning in Beijing Tianjin Hebei Counties Based on Social Network. China Environ. Sci. 2022, 43, 2057–2068. [Google Scholar] [CrossRef]
- Yao, J.; Yuan, W.; Gao, Z.; Liu, H.; Chen, X.; Ma, Y.; Arntzen, E.; Mcfarland, D. Impact of Shifts in Vegetation Phenology on the Carbon Balance of a Semiarid Sagebrush Ecosystem. Remote Sens. 2022, 14, 5924. [Google Scholar] [CrossRef]
- Liu, G.; Wang, Y. Spatial-Temporal Prediction and Zoning Governance of Realizing the “Double Carbon” Goal in Chengdu-Chongqing Agglomeration. Environ. Prot. 2021, 49, 60–62. [Google Scholar] [CrossRef]
- Liang, X.; Liu, Z.; Zhai, L.; Ji, L.; Feng, Y.; Sang, H. Spatial Terrestrial Carbon Emissions/Sequestrations Evolution Based on Ecological Network Analysis in Beijing-Tianjin-Hebei Urban Agglomeration. Ecol. Eng. 2023, 189, 106914. [Google Scholar] [CrossRef]
- Zhu, K.; Liu, Q.; Xiong, X.; Zhang, Y.; Wang, M.; Liu, H. Carbon Footprint and Embodied Carbon Emission Transfer Network Obtained Using the Multi-Regional Input-Output Model and Social Network Analysis Method: A Case of the Hanjiang River Basin, China. Front. Ecol. Evol. 2022, 10, 941520. [Google Scholar] [CrossRef]
- Xu, Q.; Yang, R.; Dong, Y.; Liu, Y.; Qiu, L. The Influence of Rapid Urbanization and Land Use Changes on Terrestrial Carbon Sources / Sinks in Guangzhou, China. Ecol. Indic. 2016, 70, 304–316. [Google Scholar] [CrossRef]
- Xie, H.; Zhai, Q.; Wang, W.; Yu, J.; Lu, F.; Chen, Q. Resources, Conservation & Recycling Does Intensive Land Use Promote a Reduction in Carbon Emissions? Evidence from the Chinese Industrial Sector. Resour. Conserv. Recycl. 2018, 137, 167–176. [Google Scholar] [CrossRef]

| Fossil Types | ESCCC (104 tce/104 t) | CEC (104 tce/104 t) |
|---|---|---|
| Raw coal | 0.7559 | 0.7143 |
| Coke | 0.8550 | 0.9714 |
| Natural gas | 0.4483 | 1.2143 |
| Gasoline | 0.5538 | 1.4714 |
| Diesel | 0.5921 | 1.4571 |
| Fuel oil | 0.6185 | 1.4286 |
| Liquefied petroleum gas | 0.5042 | 1.7143 |
| Kerosene | 0.5714 | 1.4714 |
| Ratio of Internal Relationships | Ratio of Accepted Relationships | |
|---|---|---|
| ≈0 | >0 | |
| Bidirectional spillover cluster | Net beneficiary cluster | |
| Net spillover cluster | Brokers cluster | |
| Prefecture-Level Divisions | Net Carbon Emissions from LUC (104 t) | |||
|---|---|---|---|---|
| 2006 | 2011 | 2016 | 2021 | |
| Chengdu | 1616.342 | 2423.794 | 2349.454 | 2007.995 |
| Zigong | 200.060 | 299.599 | 176.580 | 94.701 |
| Panzhihua | 983.071 | 1734.065 | 1554.043 | 1013.417 |
| Luzhou | 192.149 | 177.543 | 245.389 | 274.453 |
| Deyang | 408.255 | 612.795 | 586.253 | 374.641 |
| Mianyang | 299.691 | 256.433 | 133.906 | 218.615 |
| Guangyuan | 134.121 | 268.563 | 281.175 | 212.513 |
| Suining | 192.084 | 285.521 | 289.036 | 236.673 |
| Neijiang | 186.097 | 235.673 | 254.253 | 221.905 |
| Leshan | 198.759 | 281.096 | 434.076 | 380.609 |
| Nanchong | 265.829 | 409.410 | 416.904 | 366.848 |
| Meishan | 173.676 | 257.715 | 184.637 | 68.921 |
| Yibin | 392.790 | 644.051 | 569.767 | 350.725 |
| Guang’an | 170.038 | 232.763 | 248.672 | 255.512 |
| Dazhou | 171.693 | 291.092 | 290.736 | 297.374 |
| Ya’an | 23.236 | 75.615 | 72.691 | 33.513 |
| Bazhong | 18.318 | 55.492 | 79.262 | 39.867 |
| Ziyang | 60.034 | 86.826 | 95.591 | 67.770 |
| A’ba | −79.964 | −17.817 | −24.923 | −37.450 |
| Ganzi | −189.255 | −102.977 | −105.254 | −183.496 |
| Liangshan | 98.047 | 324.702 | 309.262 | 275.431 |
| Indicators | Overall Network Structure Characteristics | |||
|---|---|---|---|---|
| 2006 | 2011 | 2016 | 2021 | |
| ND | 0.145 | 0.162 | 0.141 | 0.231 |
| NC | 0.356 | 0.333 | 0.372 | 0.427 |
| NH | 0.521 | 0.611 | 0.521 | 0.333 |
| NE | 0.905 | 0.837 | 0.879 | 0.747 |
| Prefecture-Level Divisions | DC | BC | CC | |||
|---|---|---|---|---|---|---|
| 2006 | 2021 | 2006 | 2021 | 2006 | 2021 | |
| Chengdu | 95.000 | 95.000 | 66.842 | 40.544 | 95.238 | 95.238 |
| Zigong | 25.000 | 20.000 | 1.711 | 0.132 | 57.143 | 54.054 |
| Panzhihua | 20.000 | 5.000 | 1.404 | 0.000 | 40.816 | 36.364 |
| Luzhou | 20.000 | 20.000 | 3.004 | 0.132 | 55.556 | 54.054 |
| Deyang | 60.000 | 70.000 | 13.026 | 11.342 | 71.429 | 74.074 |
| Mianyang | 35.000 | 55.000 | 1.579 | 4.412 | 58.824 | 66.667 |
| Guangyuan | 15.000 | 20.000 | 0.000 | 0.000 | 52.632 | 54.054 |
| Suining | 15.000 | 35.000 | 0.000 | 0.579 | 52.632 | 58.824 |
| Neijiang | 10.000 | 30.000 | 0.000 | 0.763 | 51.282 | 57.143 |
| Leshan | 5.000 | 35.000 | 0.000 | 3.351 | 50.000 | 60.606 |
| Nanchong | 15.000 | 30.000 | 0.000 | 0.588 | 52.632 | 57.143 |
| Meishan | 5.000 | 15.000 | 0.000 | 0.088 | 50.000 | 52.632 |
| Yibin | 15.000 | 40.000 | 1.798 | 4.719 | 54.054 | 62.500 |
| Guang’an | 15.000 | 25.000 | 0.000 | 0.325 | 52.632 | 55.556 |
| Dazhou | 20.000 | 20.000 | 0.000 | 0.000 | 54.054 | 54.054 |
| Ya’an | 5.000 | 20.000 | 0.000 | 0.088 | 50.000 | 54.054 |
| Bazhong | 25.000 | 35.000 | 0.351 | 0.658 | 55.556 | 58.824 |
| Ziyang | 15.000 | 50.000 | 0.175 | 4.772 | 52.632 | 64.516 |
| A’ba | 10.000 | 15.000 | 0.000 | 0.000 | 51.282 | 52.632 |
| Ganzi | 15.000 | 25.000 | 2.412 | 0.561 | 54.054 | 55.556 |
| Liangshan | 10.000 | 20.000 | 1.382 | 10.105 | 52.632 | 55.556 |
| Year | Cluster No. | Cluster Type | Division | Number of Relations Received | Number of Relations Issued | Ratio of Expected Internal Relations (%) | Ratio of Actual Internal Relations (%) | ||
|---|---|---|---|---|---|---|---|---|---|
| Inside | Outside | Inside | Outside | ||||||
| 2006 | The First Cluster | Bidirectional Spillover Cluster | Chengdu; Mianyang; Deyang | 6 | 32 | 6 | 6 | 10 | 50 |
| The Second Cluster | Broker Cluster | Guang’an; Ganzi; Meishan; Ziyang; Suining; Guangyuan; A’ba; Nanchong; Leshan; Bazhong; Dazhou | 3 | 6 | 3 | 26 | 50 | 10 | |
| The Third Cluster | Net Spillover Cluster | Panzhihua; Zigong | 0 | 7 | 0 | 8 | 5 | 0 | |
| The Fourth Cluster | Net Spillover Cluster | Luzhou; Ya’an; Yibin; Neijiang; Liangshan | 0 | 7 | 0 | 12 | 20 | 0 | |
| 2011 | The First Cluster | Net Beneficial Cluster | Chengdu; Mianyang; Deyang | 6 | 29 | 6 | 6 | 10 | 50 |
| The Second Cluster | Broker Cluster | Guang’an; Ganzi; Suining; Guangyuan; A’ba; Nanchong; Bazhong; Liangshan; Dazhou | 5 | 3 | 5 | 23 | 40 | 18 | |
| The Third Cluster | Bidirectional Spillover Cluster | Yibin; Meishan; Ya’an; Neijiang; Luzhou; Ziyang; Zigong | 14 | 7 | 14 | 9 | 30 | 61 | |
| The Fourth Cluster | Net Spillover Cluster | Panzhihua; Leshan | 0 | 4 | 0 | 5 | 5 | 0 | |
| 2016 | The First Cluster | Net Beneficial Cluster | Chengdu; Mianyang; Deyang | 6 | 27 | 6 | 6 | 10 | 50 |
| The Second Cluster | Broker Cluster | Guang’an; Ganzi; Suining; Guangyuan; A’ba; Nanchong; Bazhong; Dazhou | 8 | 2 | 8 | 19 | 35 | 30 | |
| The Third Cluster | Bidirectional Spillover Cluster | Yibin; Liangshan; Ya’an; Neijiang; Luzhou; Zigong | 5 | 4 | 5 | 8 | 25 | 38 | |
| The Fourth Cluster | Bidirectional Spillover Cluster | Panzhihua; Ziyang; Meishan; Leshan | 1 | 6 | 1 | 6 | 15 | 17 | |
| 2021 | The First Block | Bidirectional Spillover Cluster | Chengdu; Mianyang; Deyang; Nanchong; Bazhong; Suining | 27 | 32 | 27 | 9 | 25 | 75 |
| The Second Cluster | Net Spillover Cluster | Guang’an; Ganzi; Meishan; Guangyuan; A’ba; Dazhou | 0 | 5 | 0 | 24 | 25 | 0 | |
| The Third Cluster | Net Spillover Cluster | Panzhihua; Leshan; Yibin; Zigong | 0 | 15 | 0 | 15 | 15 | 0 | |
| The Fourth Cluster | Broker Cluster | Luzhou; Ya’an; Neijiang; Ziyang; Liangshan | 3 | 15 | 3 | 19 | 20 | 14 | |
Disclaimer/Publisher’s Note: The statements, opinions and data contained in all publications are solely those of the individual author(s) and contributor(s) and not of MDPI and/or the editor(s). MDPI and/or the editor(s) disclaim responsibility for any injury to people or property resulting from any ideas, methods, instructions or products referred to in the content. |
© 2023 by the authors. Licensee MDPI, Basel, Switzerland. This article is an open access article distributed under the terms and conditions of the Creative Commons Attribution (CC BY) license (https://creativecommons.org/licenses/by/4.0/).
Share and Cite
Zhao, Q.; Xie, B.; Han, M. Unpacking the Sub-Regional Spatial Network of Land-Use Carbon Emissions: The Case of Sichuan Province in China. Land 2023, 12, 1927. https://doi.org/10.3390/land12101927
Zhao Q, Xie B, Han M. Unpacking the Sub-Regional Spatial Network of Land-Use Carbon Emissions: The Case of Sichuan Province in China. Land. 2023; 12(10):1927. https://doi.org/10.3390/land12101927
Chicago/Turabian StyleZhao, Qianyu, Boyu Xie, and Mengyao Han. 2023. "Unpacking the Sub-Regional Spatial Network of Land-Use Carbon Emissions: The Case of Sichuan Province in China" Land 12, no. 10: 1927. https://doi.org/10.3390/land12101927


