
Characterizing and Measuring the Environmental Amenities of Urban Recreation Leisure Regions Based on Image and Text Fusion Perception: A Case Study of Nanjing, China

 ,
,
Abstract
:1. Introduction
- A framework is proposed for measuring URLR environments using fused image and text perception. This considers leisure space diversity and complex environmental perception.
- The features of EAs in leisure spaces are explained by big data fusion perception, enriching the system of EAs and the connotation of EAs for leisure. The comprehensive and quantifying perception of EA features in URLRs provides a clearer pathway for leisure quality enhancement.
- The time and space distribution of EAs in URLRs of a developing country city is analyzed at the more refined and practical spatial scale, and its formation mechanism is preliminarily revealed. The specific guidelines for urban construction and leisure planning are presented based on the results of the study.
2. Data and Case Study Area
2.1. Data
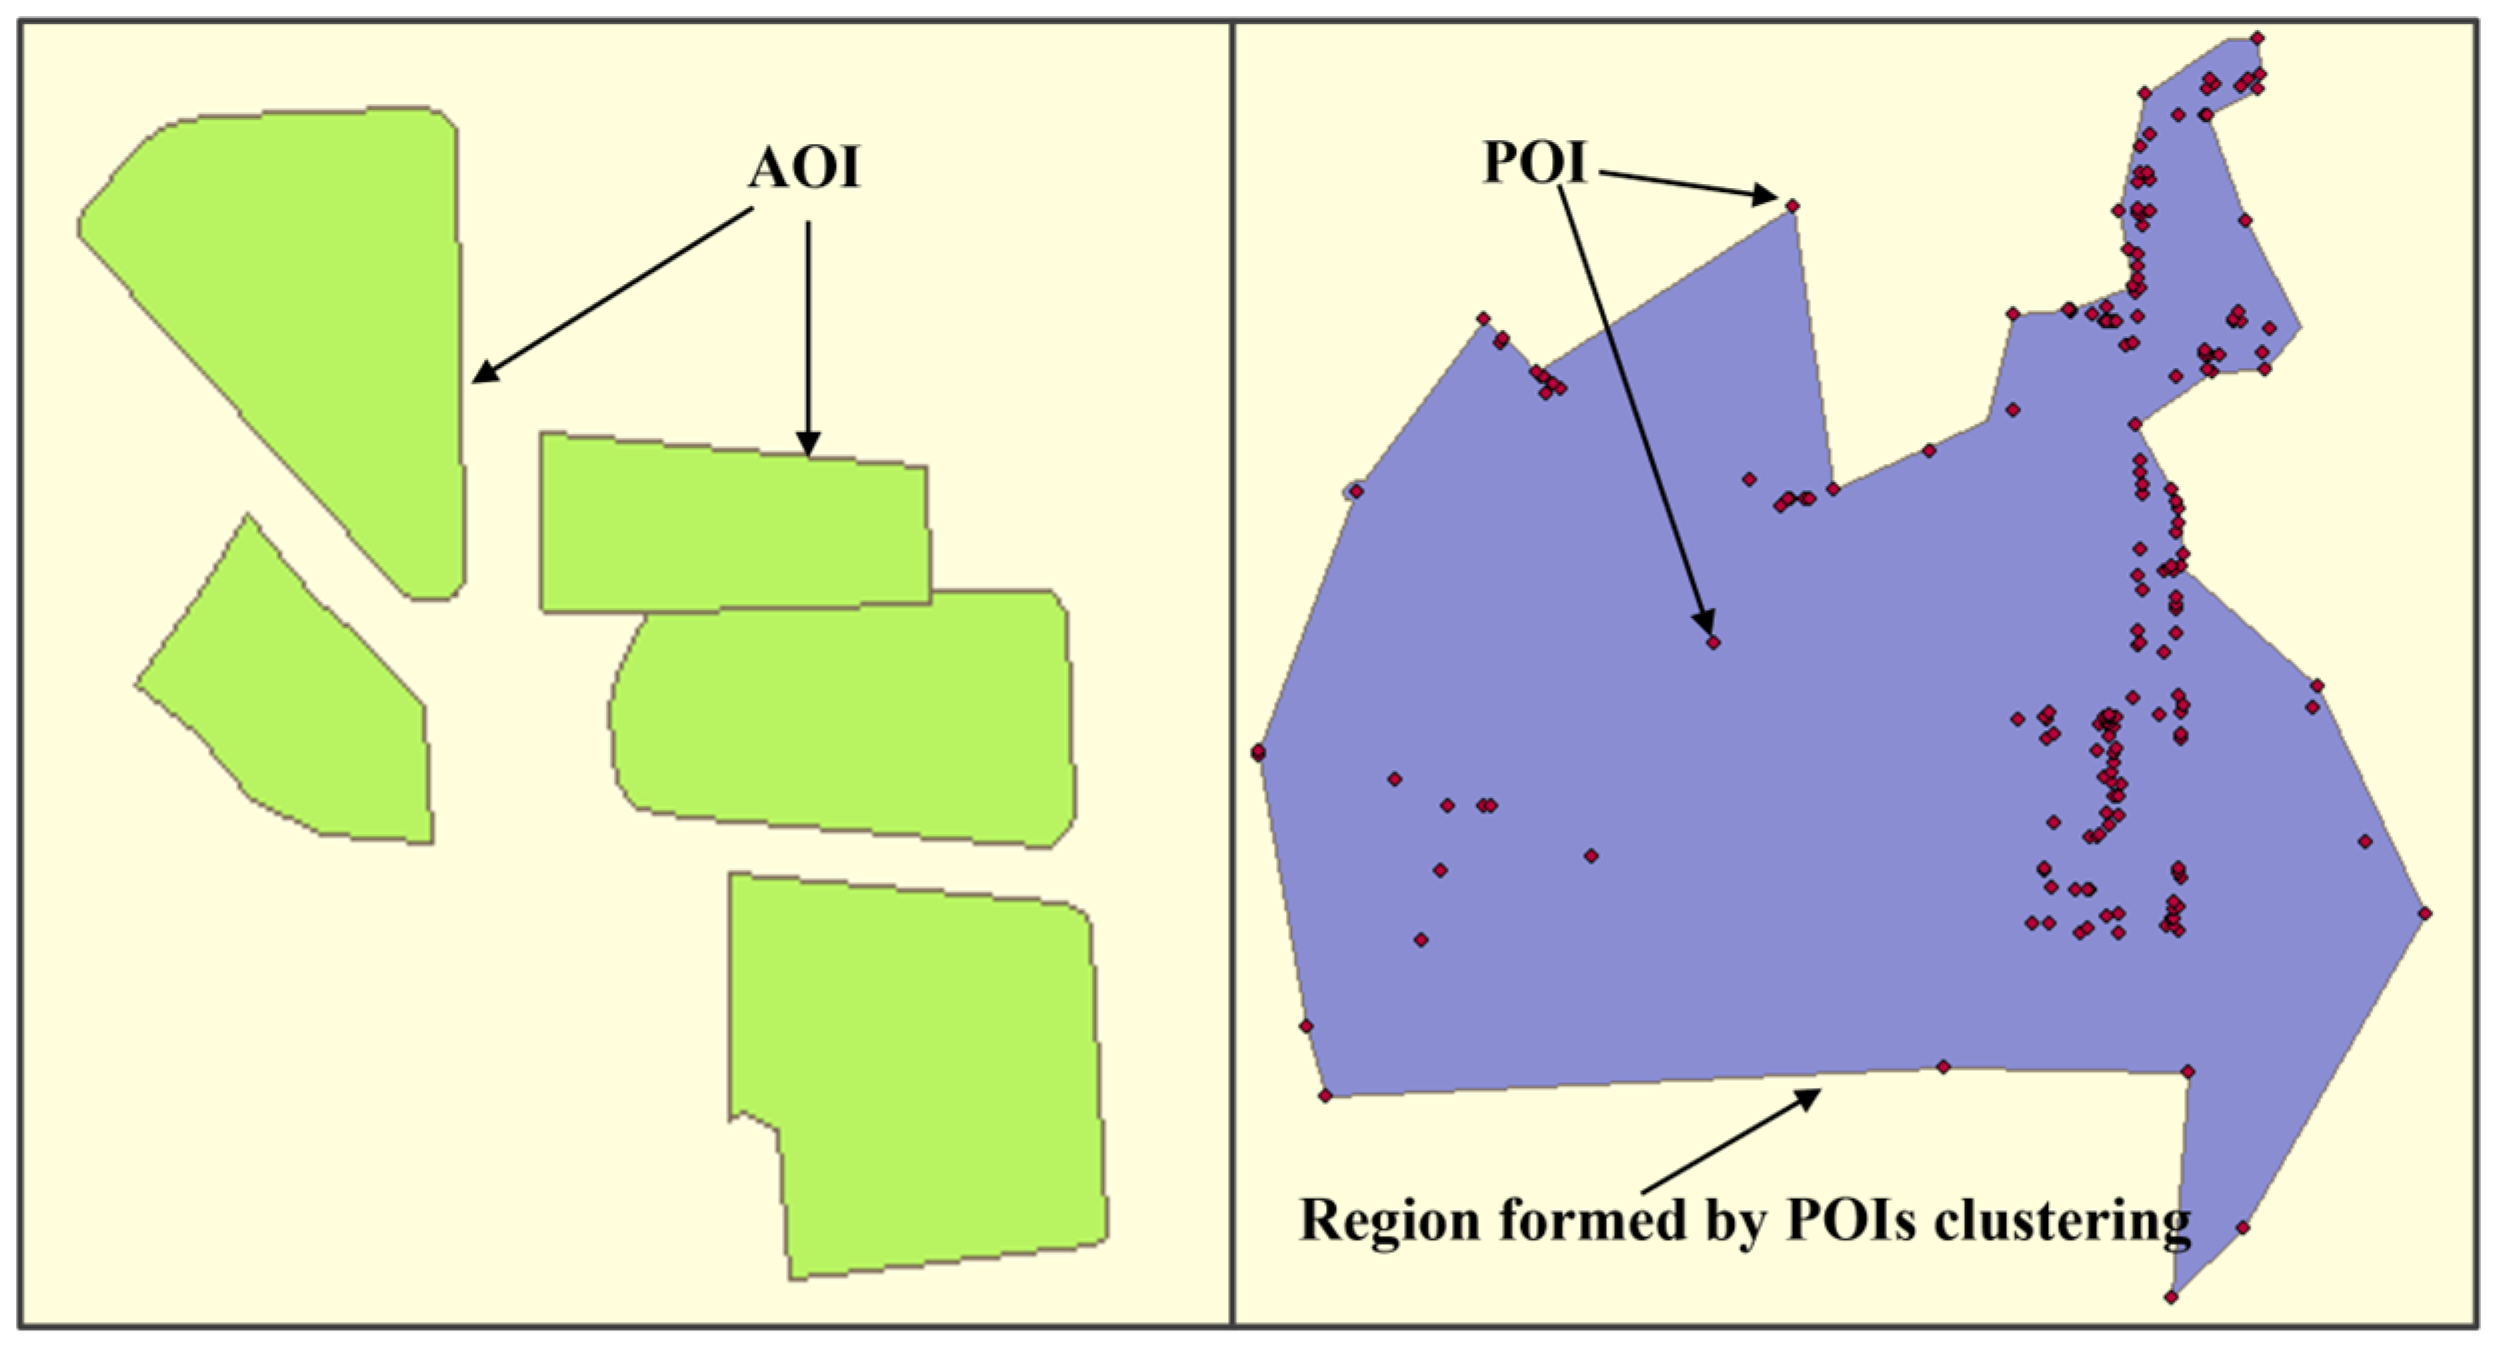
2.1.1. Areas of Interest (AOIs) and Points of Interest (POIs)
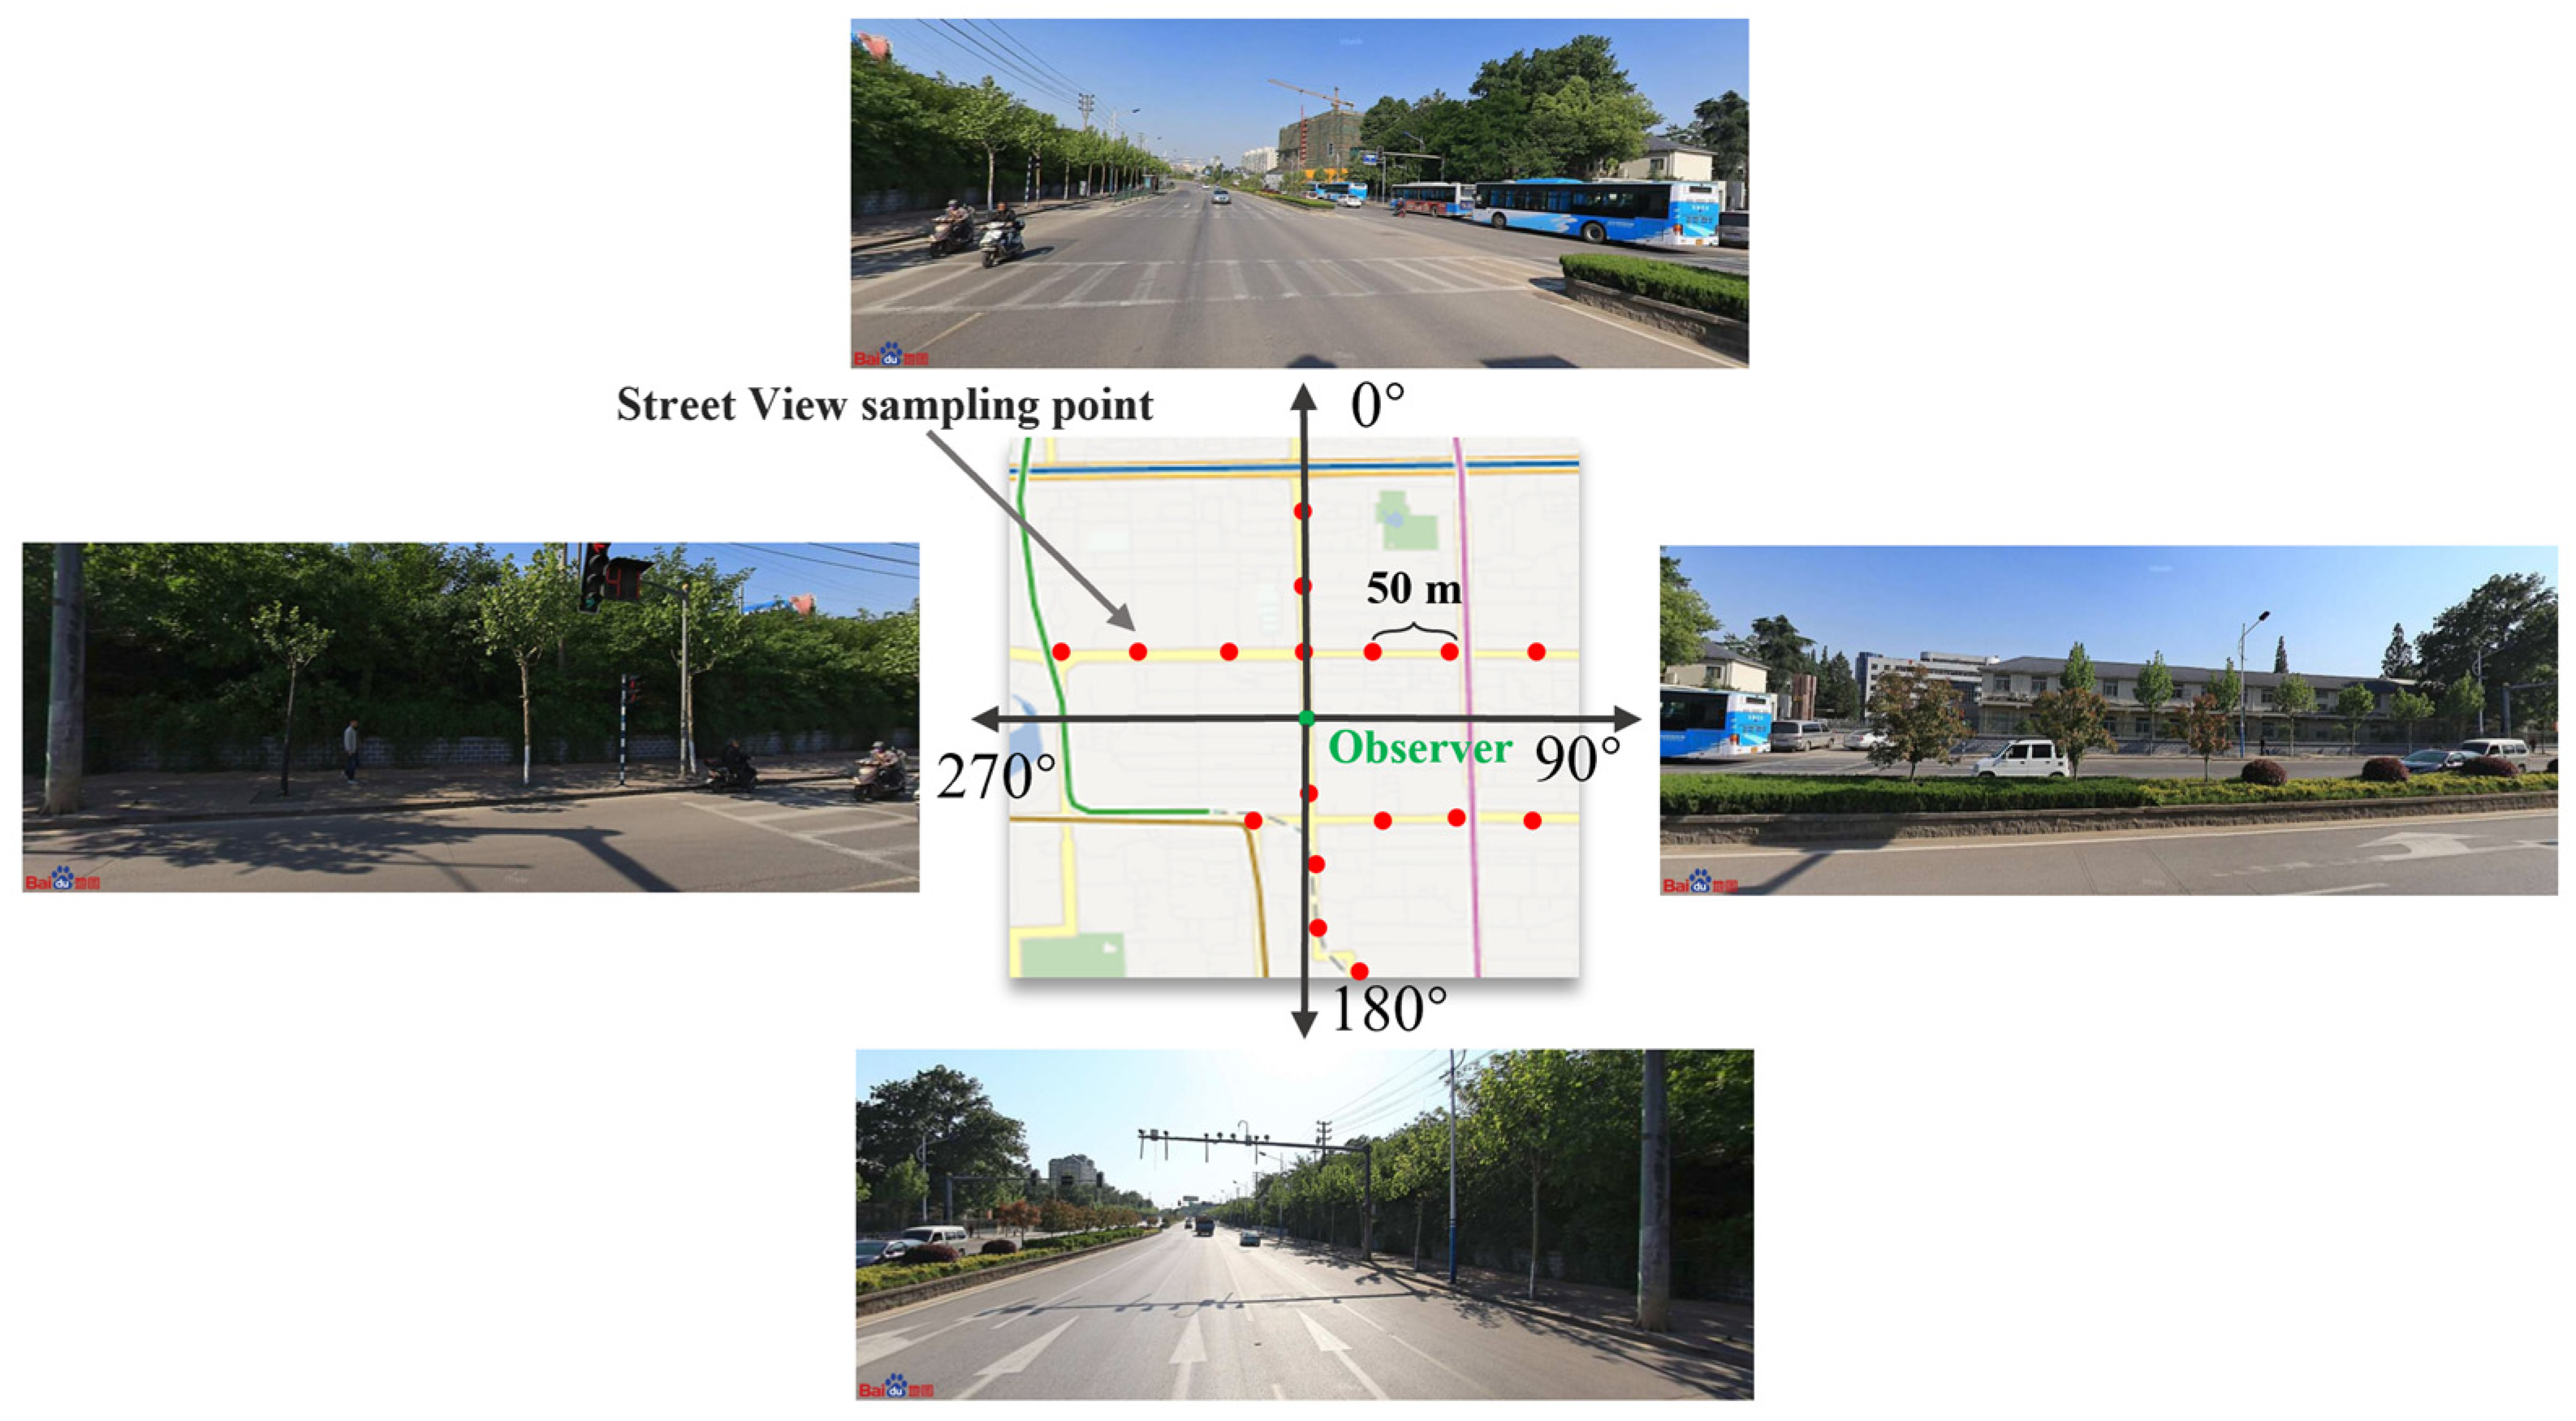
2.1.2. Baidu Street Map View Image and Road Network
2.1.3. Web Comment Text
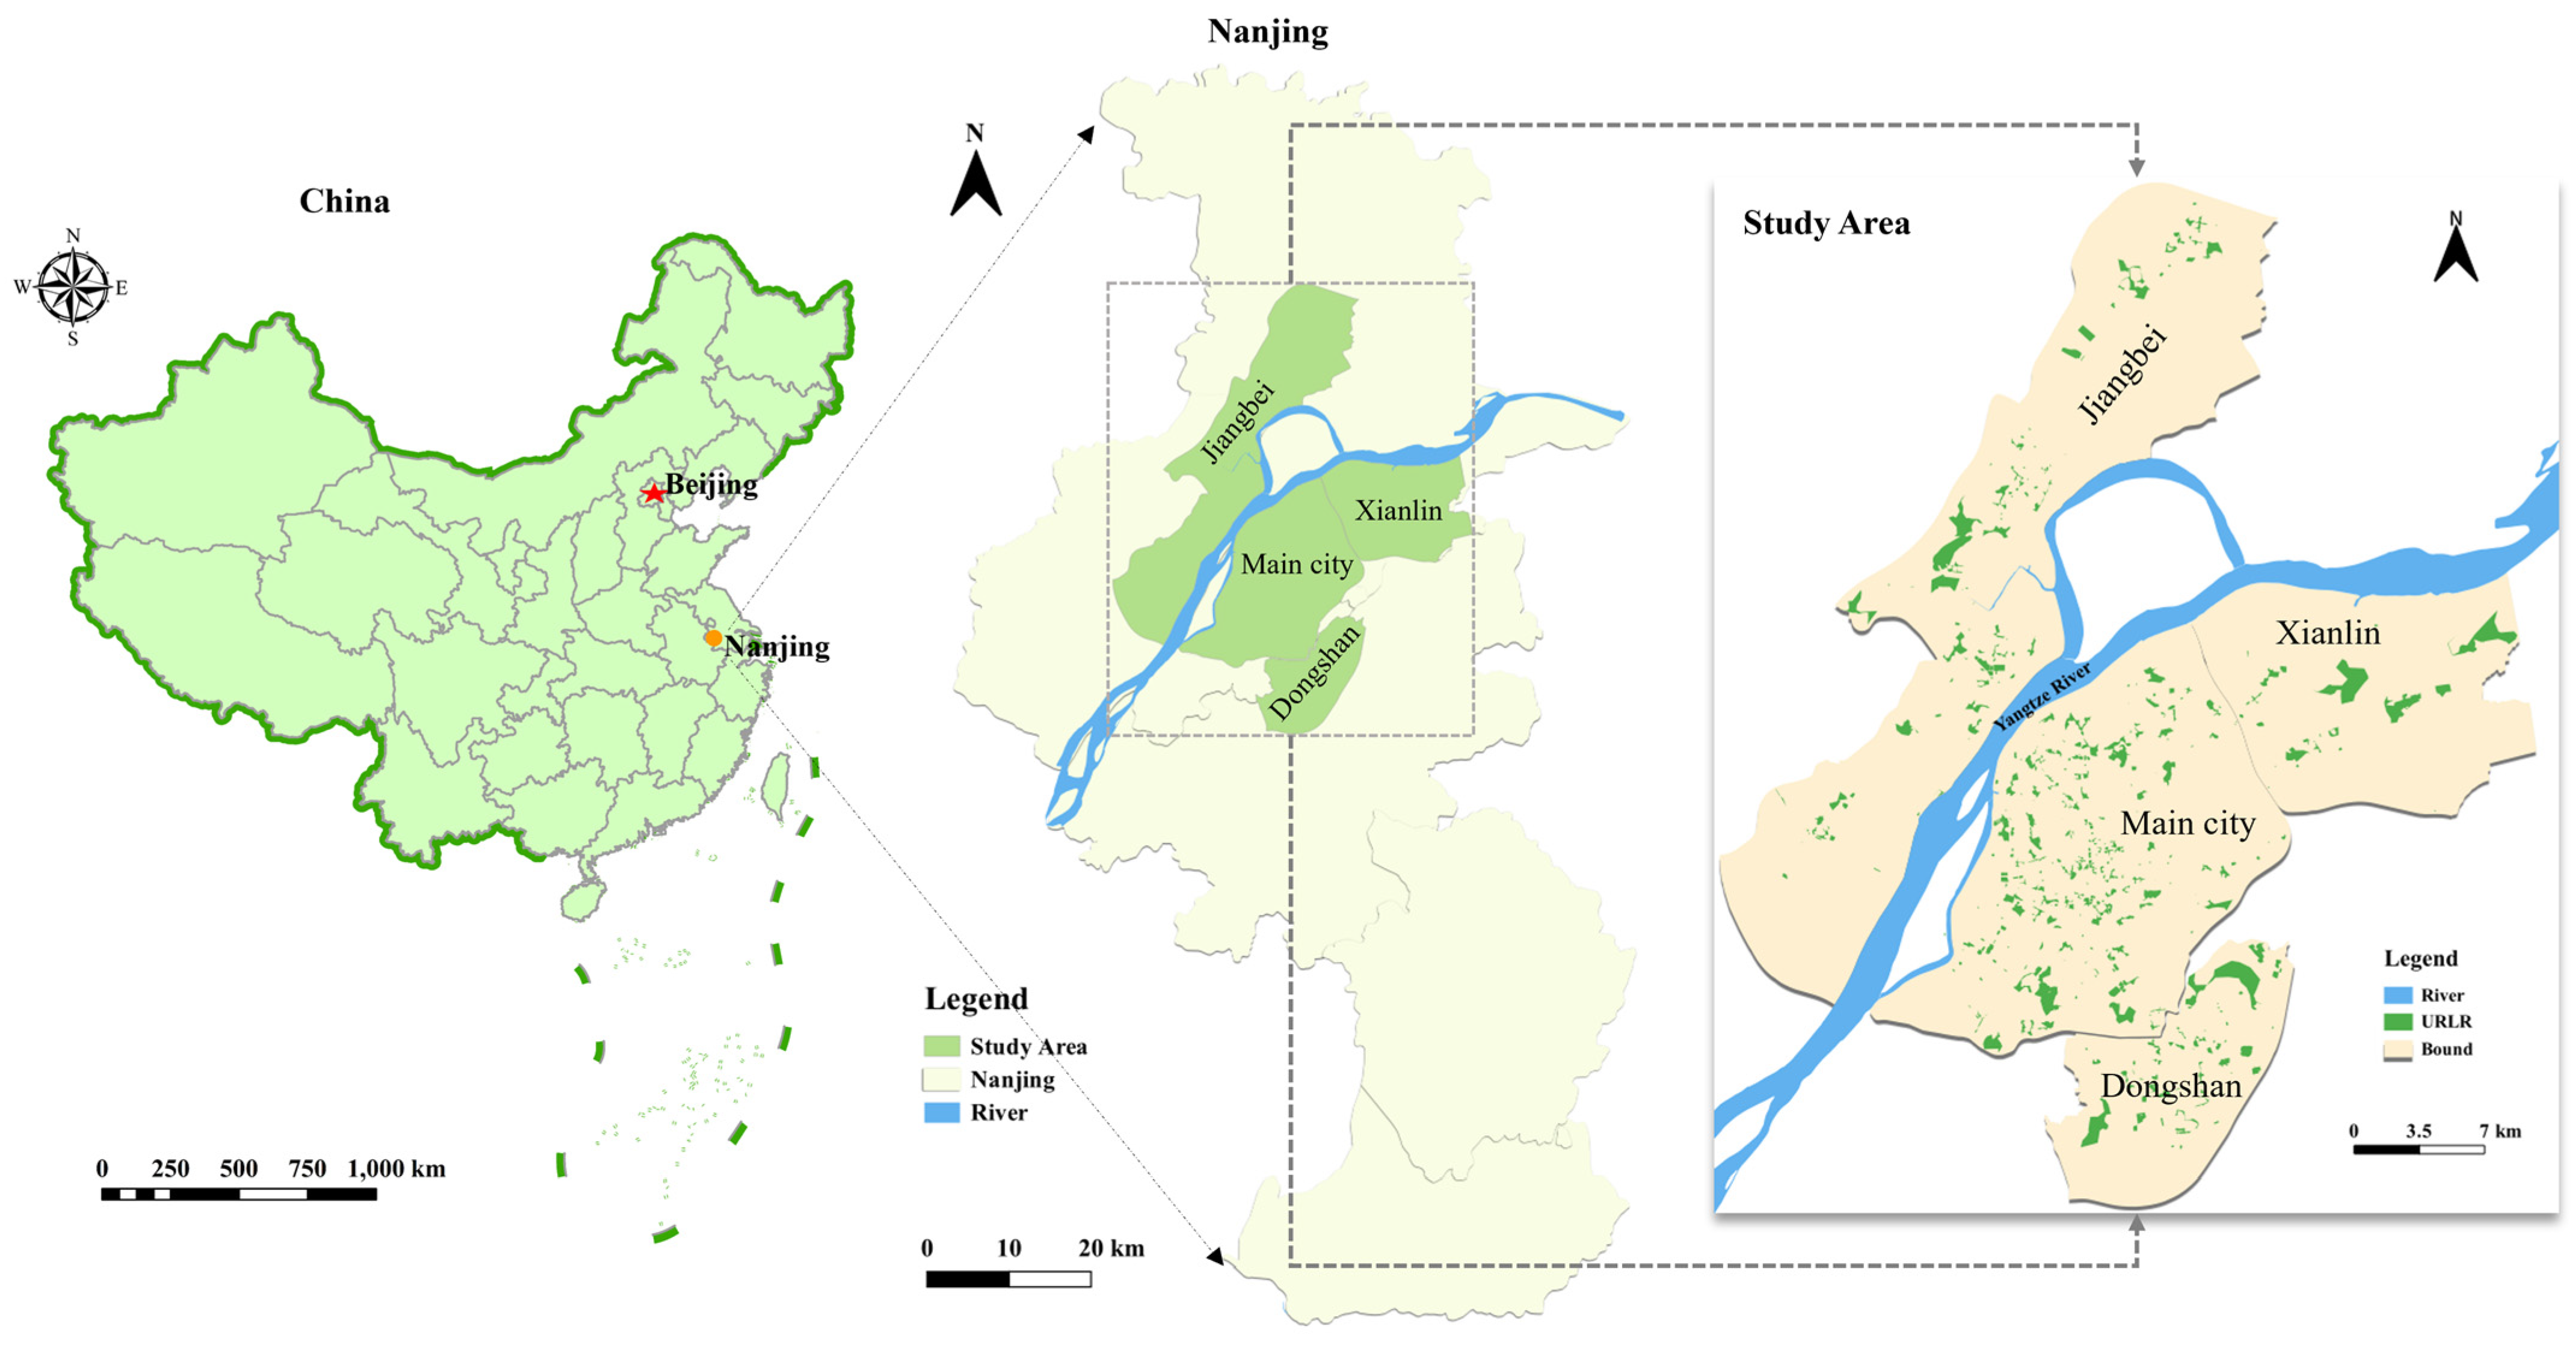
2.2. Study Area
3. Methods
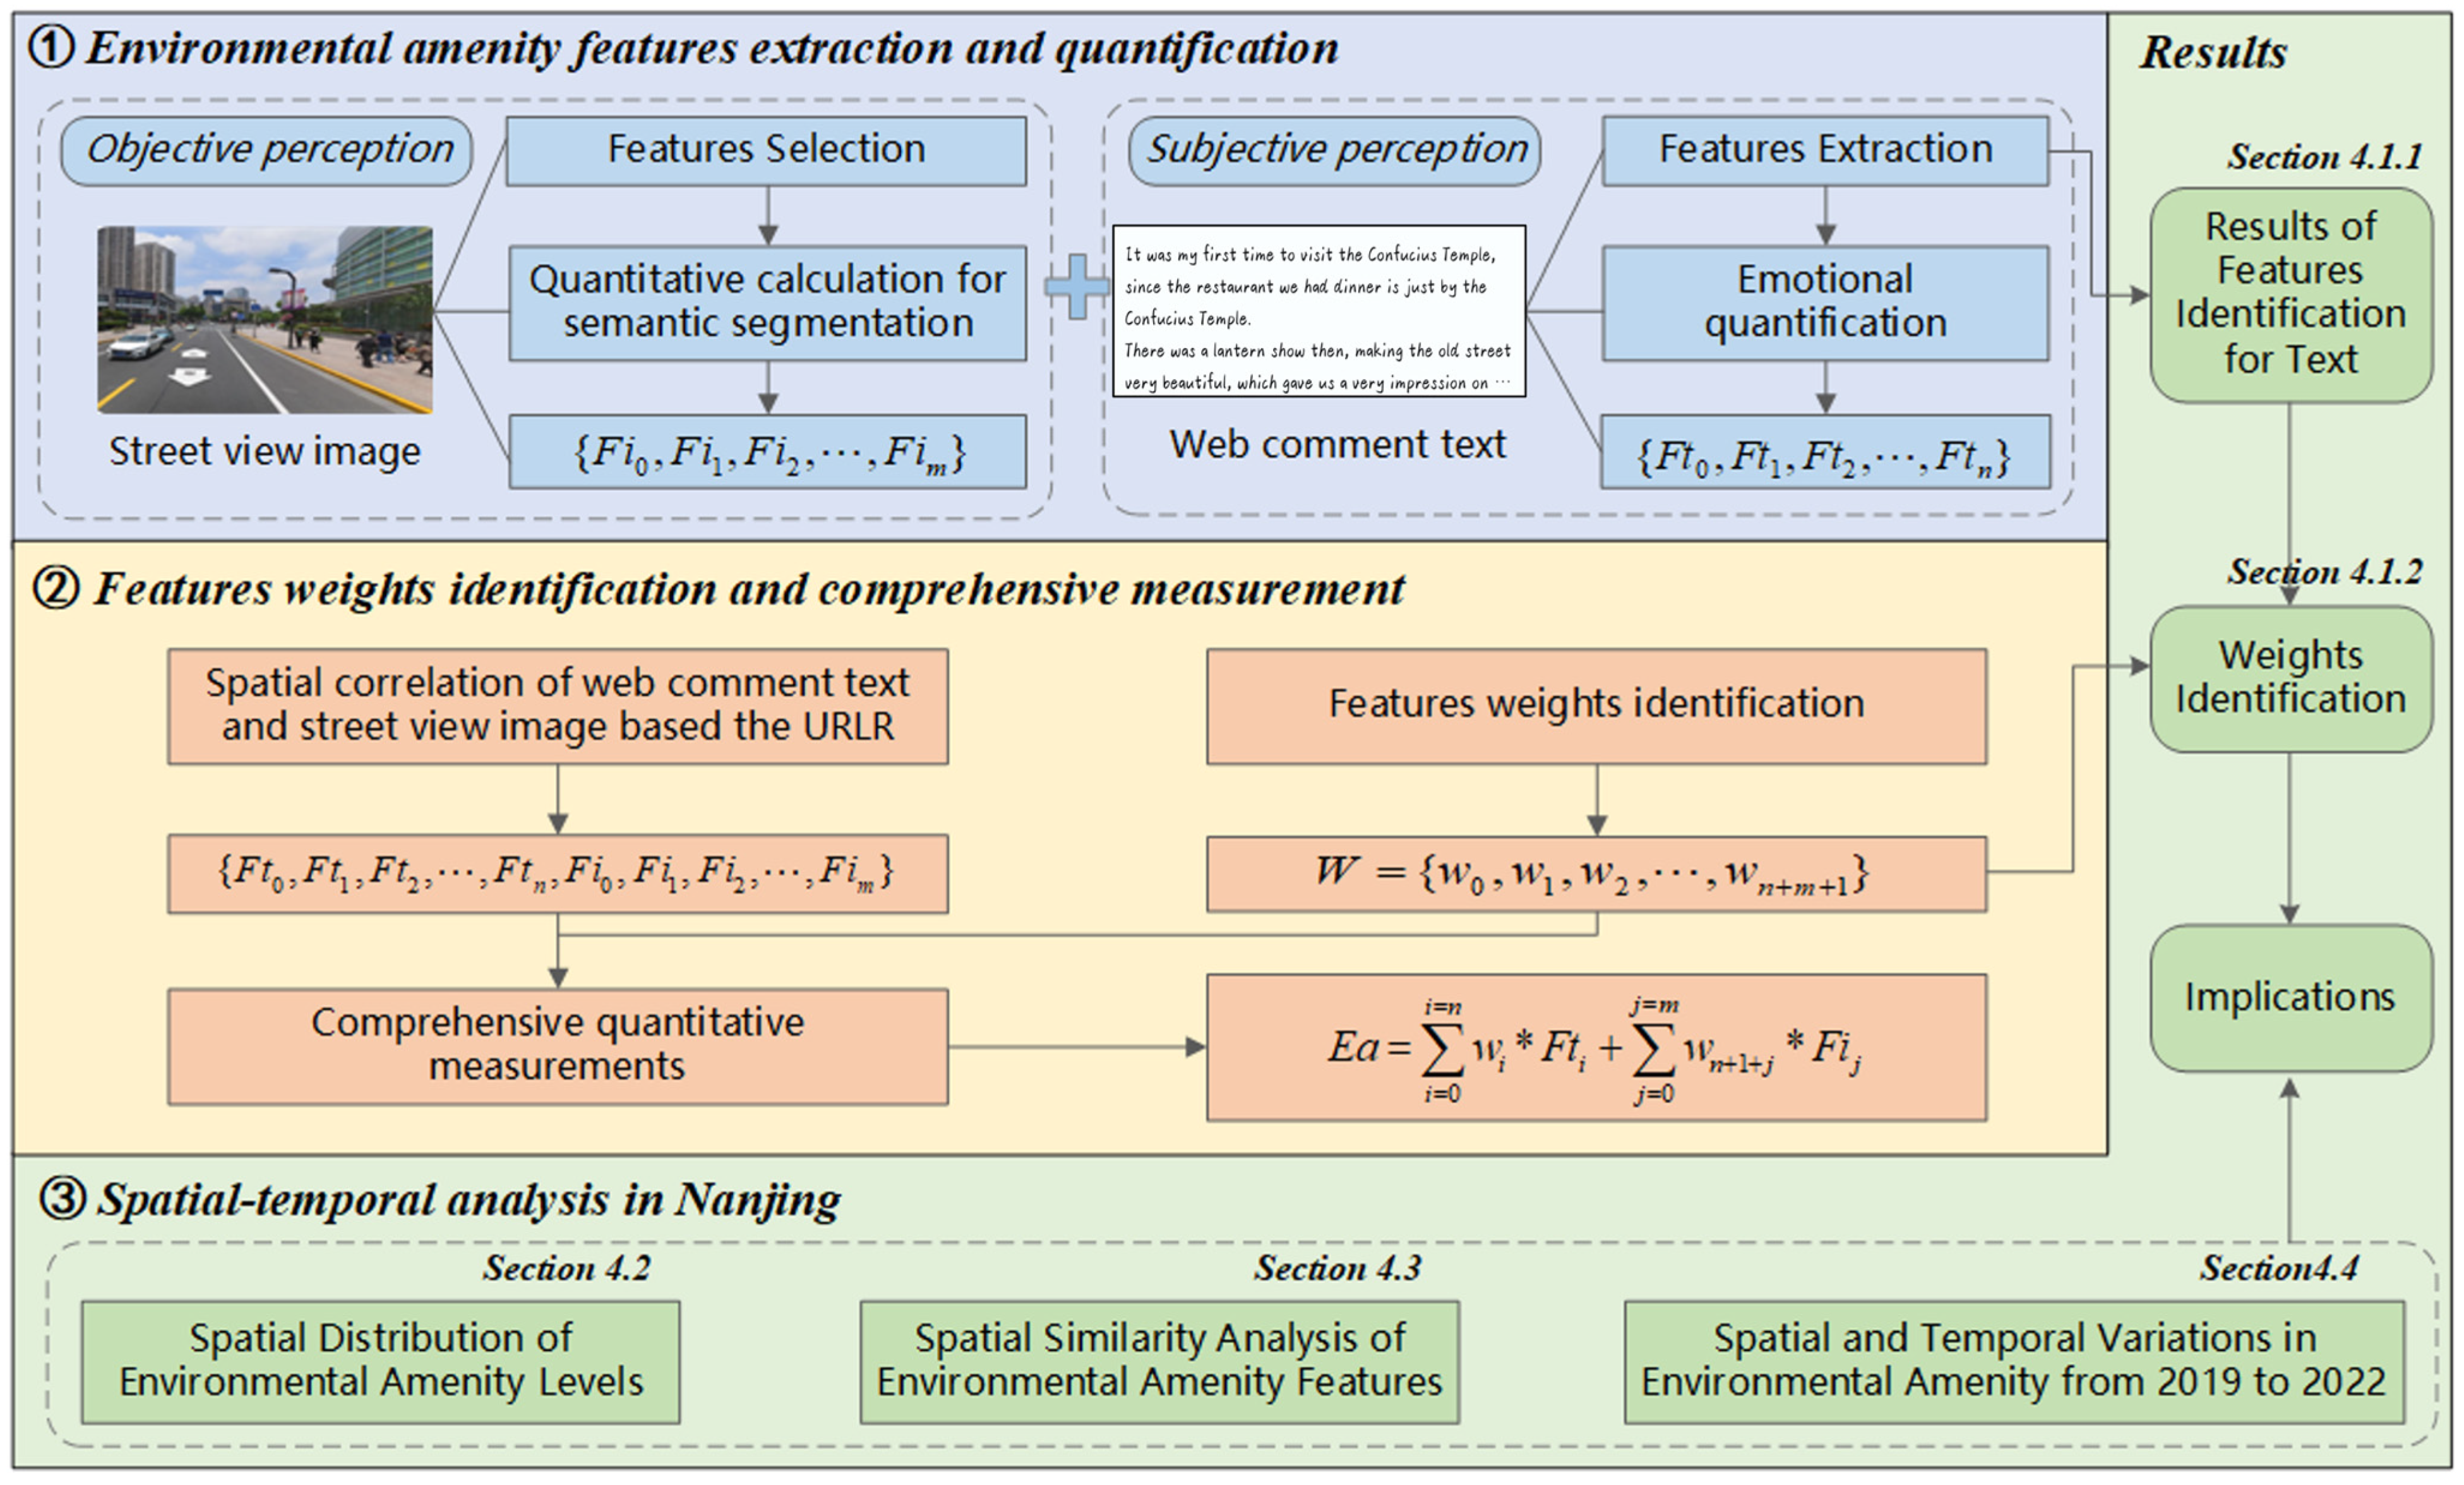
3.1. Overview
- In the first step, street view images and web comment texts about URLRs are used to extract features of EAs through objective and subjective perception, respectively. Then, the obtained features of each URLR are quantified by semantic segmentation and sentiment analysis, respectively.
- In the second step, to fetch the most influential EA features, the analytic hierarchy process (AHP) and entropy evaluation method (EEM) are used to determine the weights of the features. Additionally, a quantitative calculation is conducted to measure EA.
- In the third step, the spatial-temporal analysis is done based on quantitative results to explore the characteristics of the spatial and temporal patterns of EAs for Nanjing’s URLRs. Finally, urban planning and policy implications are proposed based on the results of this study.
3.2. Quantitative Measurement by Subjective Perception
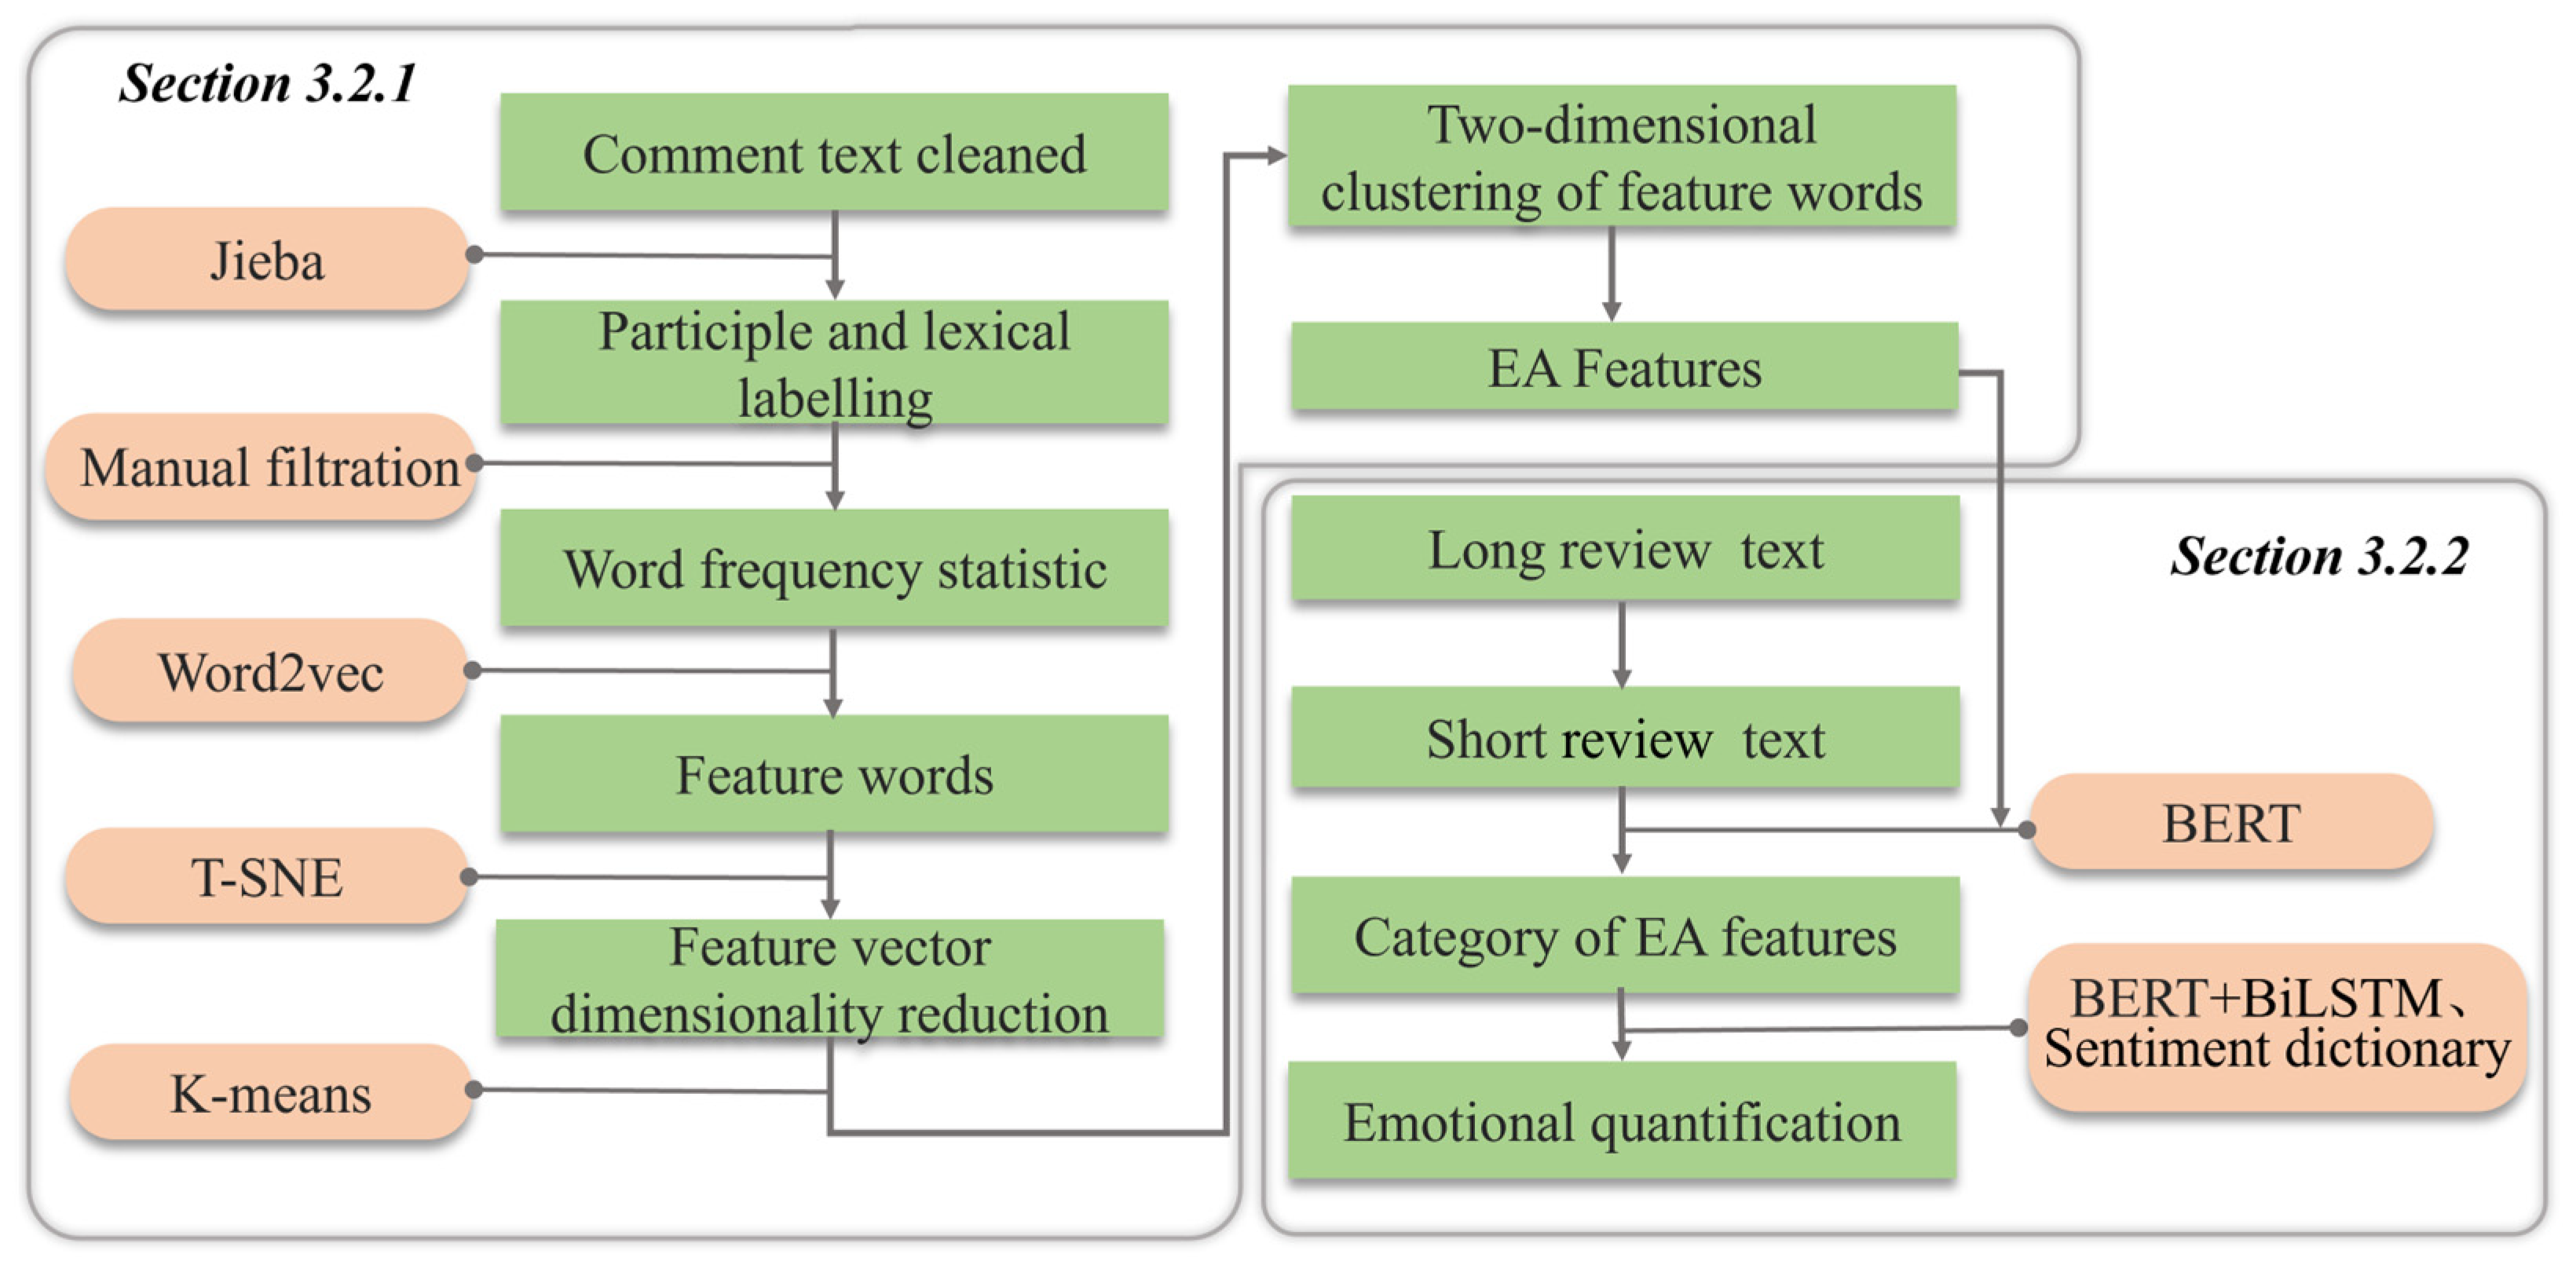
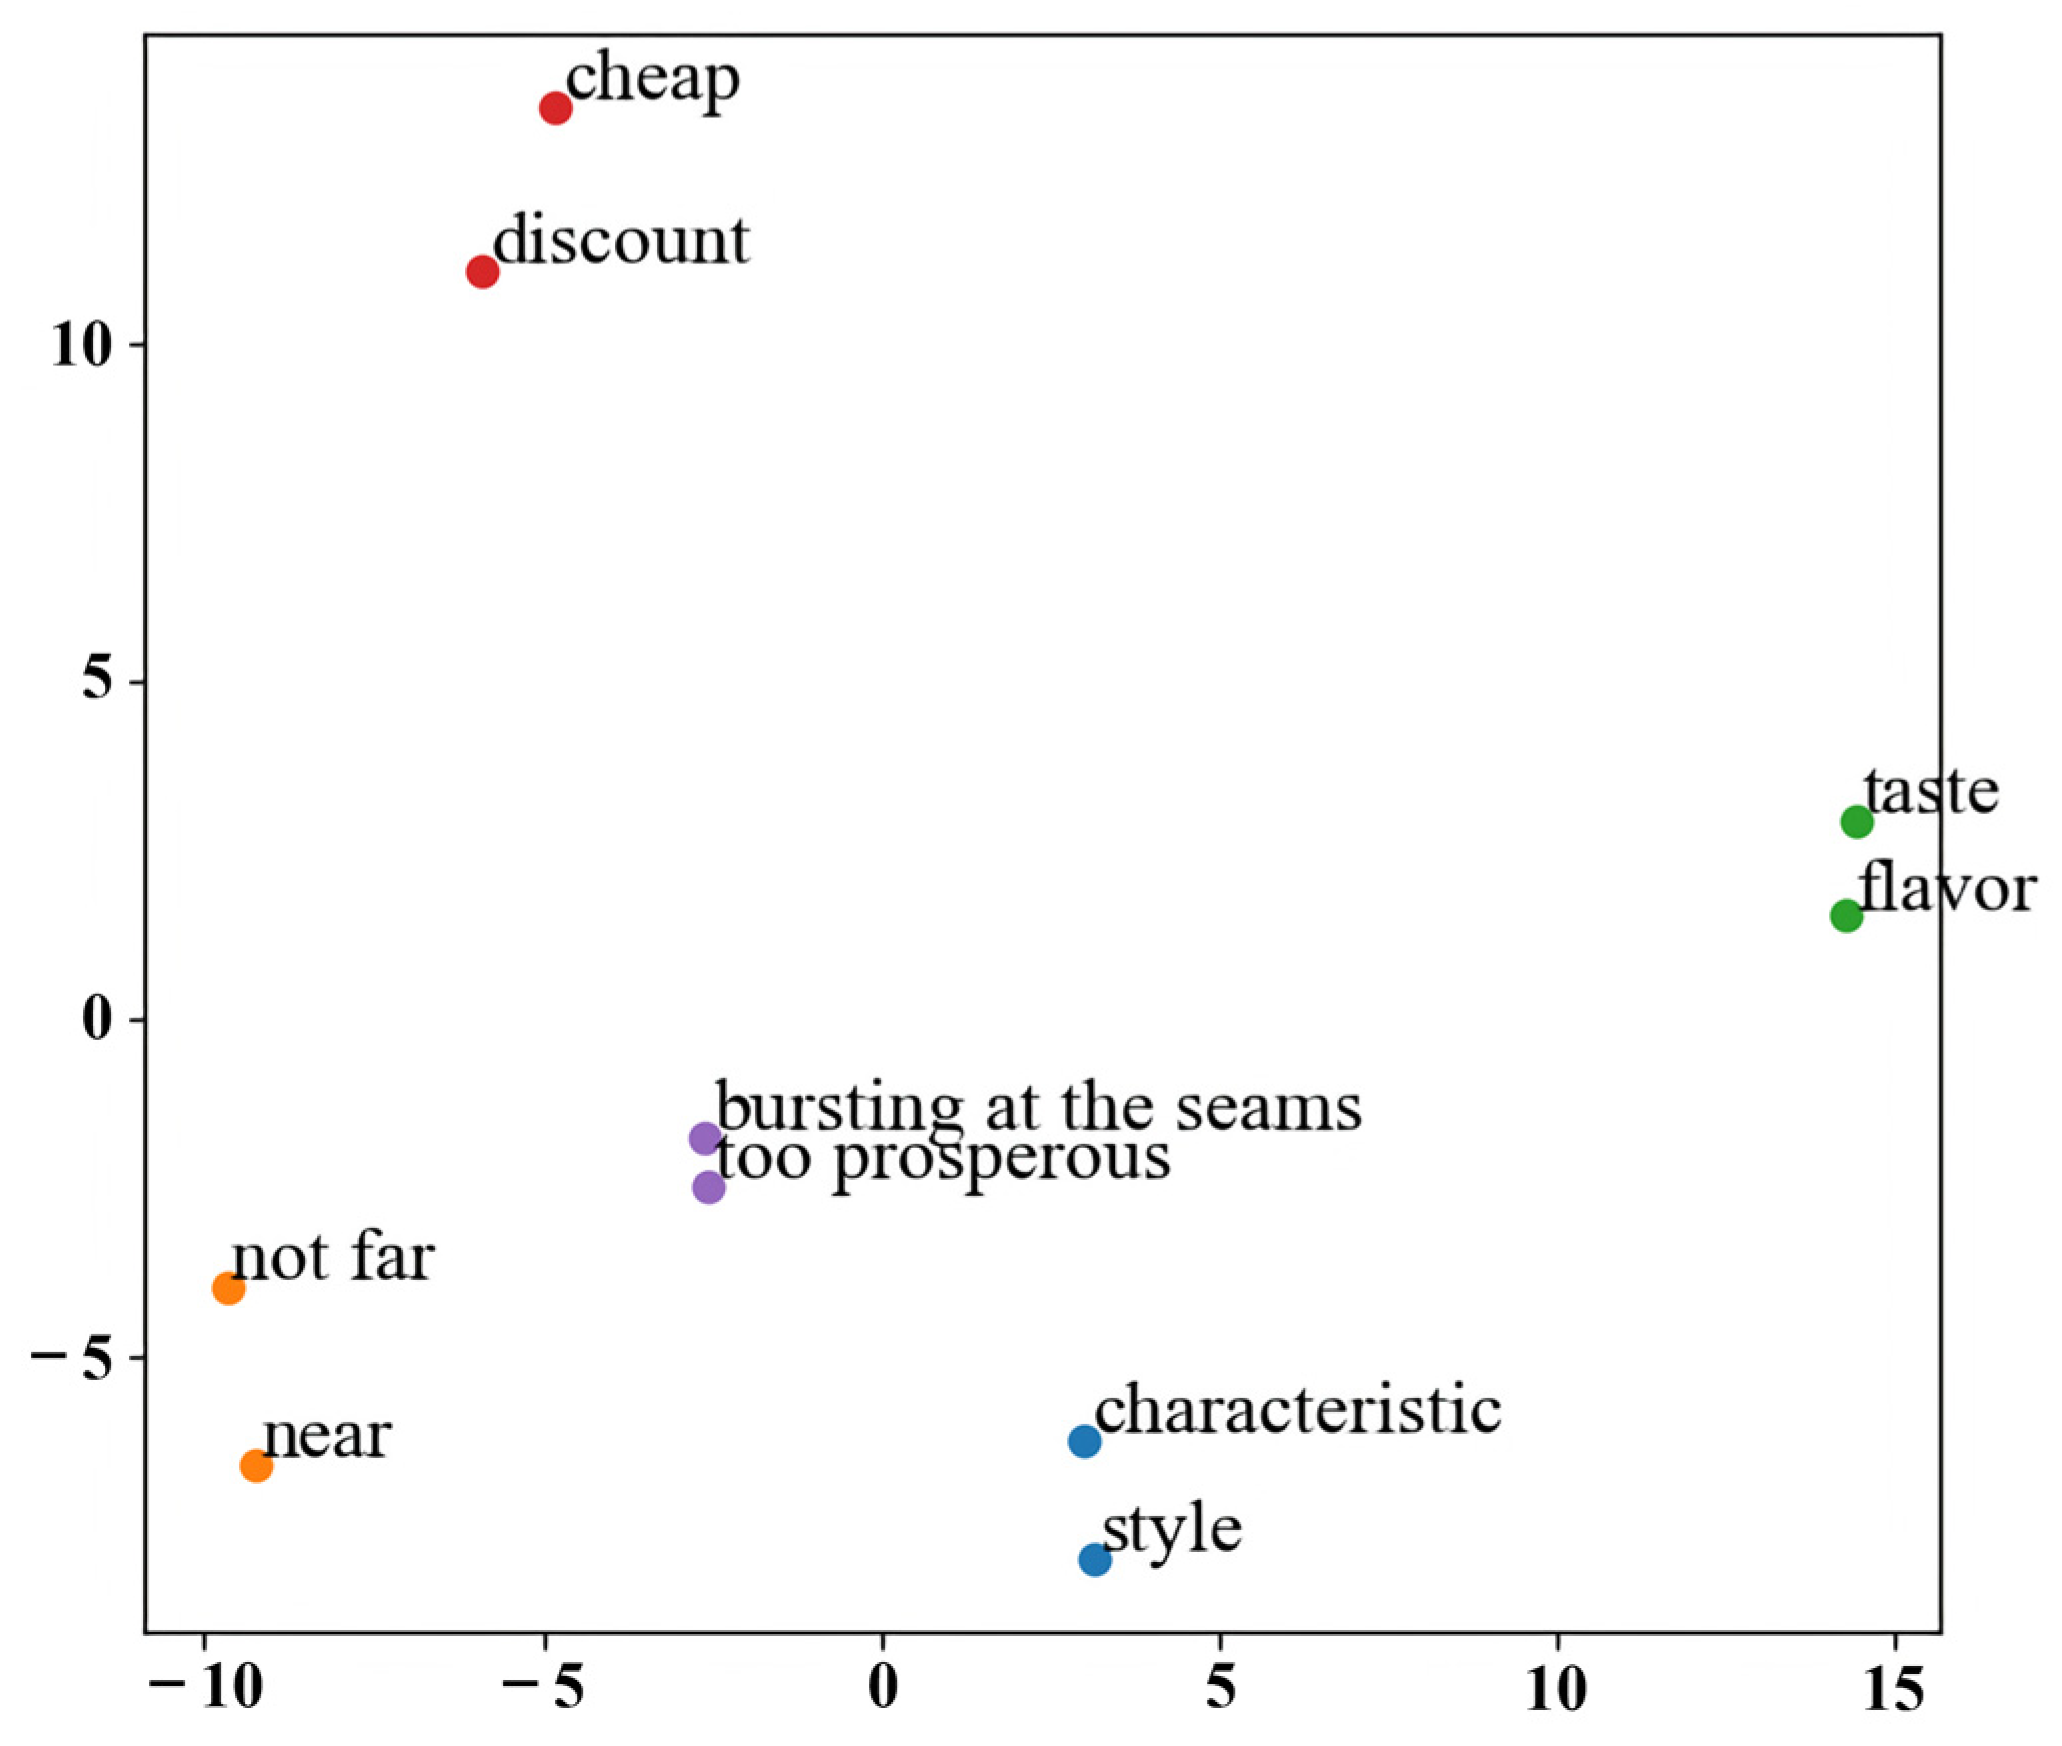
3.2.1. Web Comment-Based EA Features Extraction
3.2.2. Subjective Quantitative Measurement Based on Web Review Text
- In the first step, the review texts are categorized based on the EA feature categories. It is necessary to cut long texts into short texts for fine-grained sentiment measurement. To obtain information on the perceived EAs of the URLRs from a single brief comment text, the BERT model [58] is used to get short texts belonging to the category of EA features.
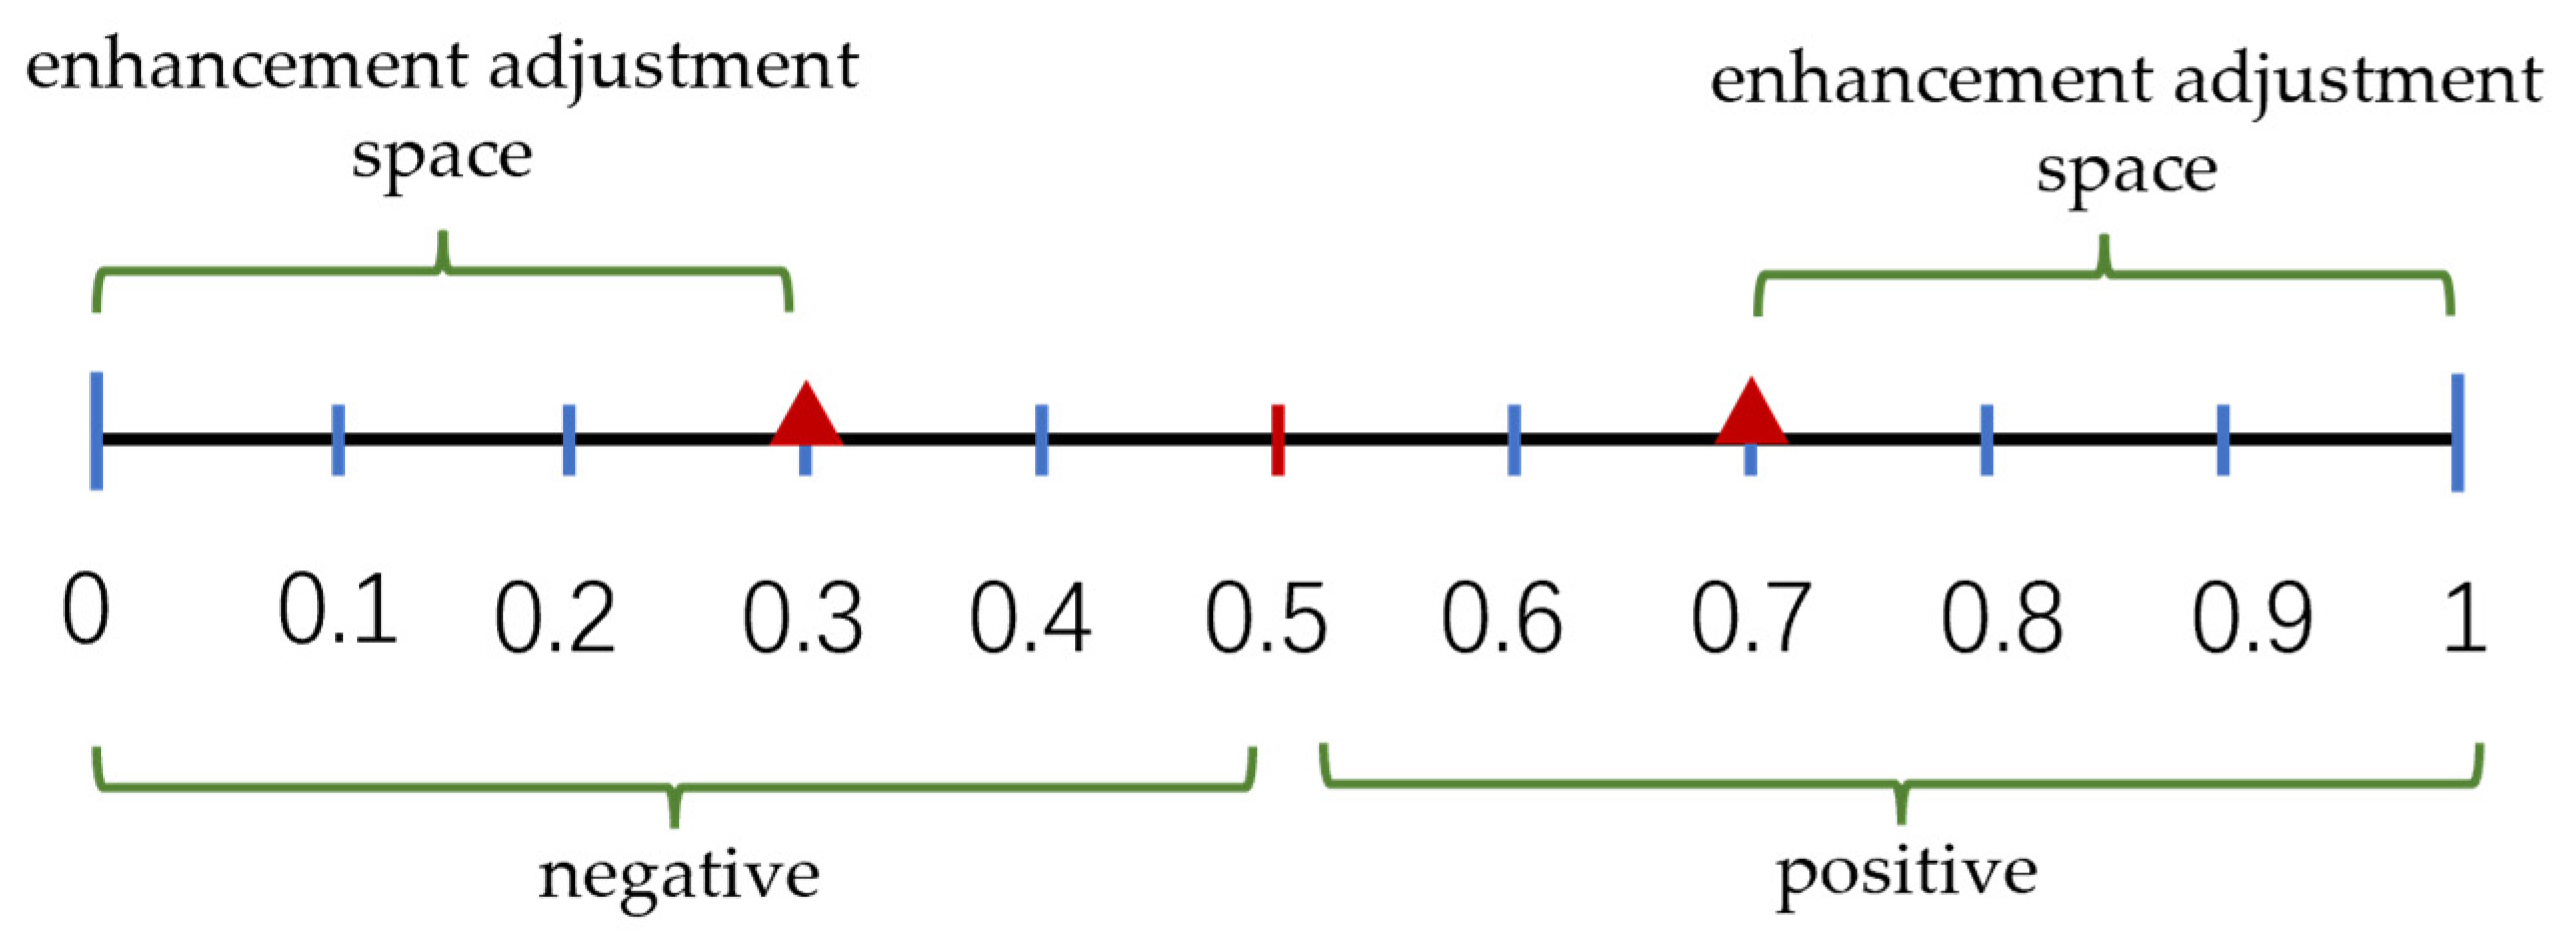
- In the next step, a combination of deep learning and sentiment lexicon-based methods is proposed for the quantitative analysis of sentiment values. Short comment texts may express positive or negative emotions with varying degrees of emotional expression and may not contain any emotional information. Bert+BiLSTM model is used for sentiment polarity classification, reaching 95% accuracy. Sentiment dictionary-based text analysis is used to quantify the value of emotional expression. Different levels of emotion can characterize different levels of EA. Referring to the relevant research [59], adverbs of the degree of emotion are classified into six classes for fine-grained emotional mining, namely “over”, “most/extremely”, “very”, “more”, “slightly”, and “insufficiently”. In addition, the exclamation mark and question mark can also characterize emotions. Different adjusted values are given to different grades of degree adverbs based on initial sentiment values according to emotional polarity. Examples of the adverb dictionaries and their adjusted values are shown in Table 2.
3.3. Quantitative Measurement by the Objective Perception
3.3.1. Street View-Based EA Features Selection
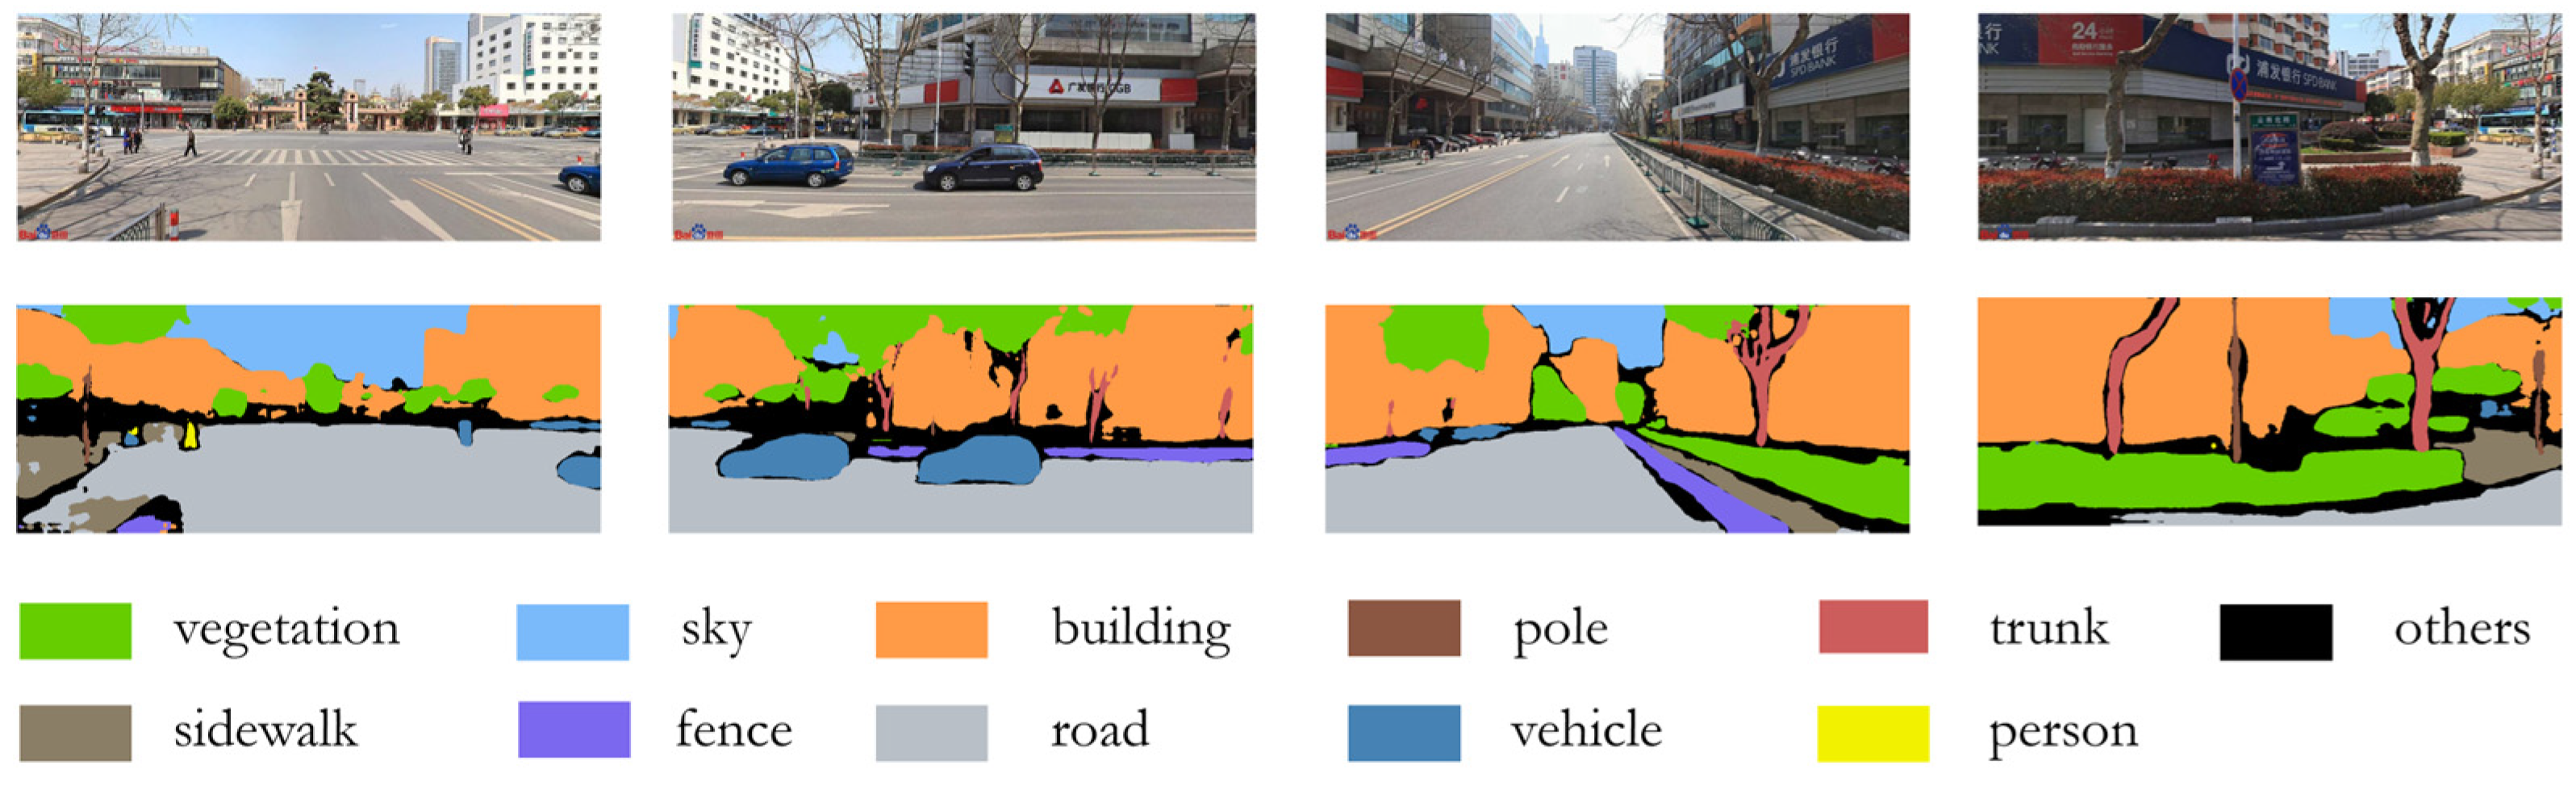
3.3.2. Objective Quantitative Measurement Based on Street View Images
- Spatial connection between URLRs and spots of street view images
- 2.
- Calculation of objective EA features
3.4. Image and Text Feature Fusion and Model Construction
3.4.1. Determination of EA Feature Weights
3.4.2. Feature Modelling of EA
4. Results
4.1. Environmental Amenity Features and Their Weights
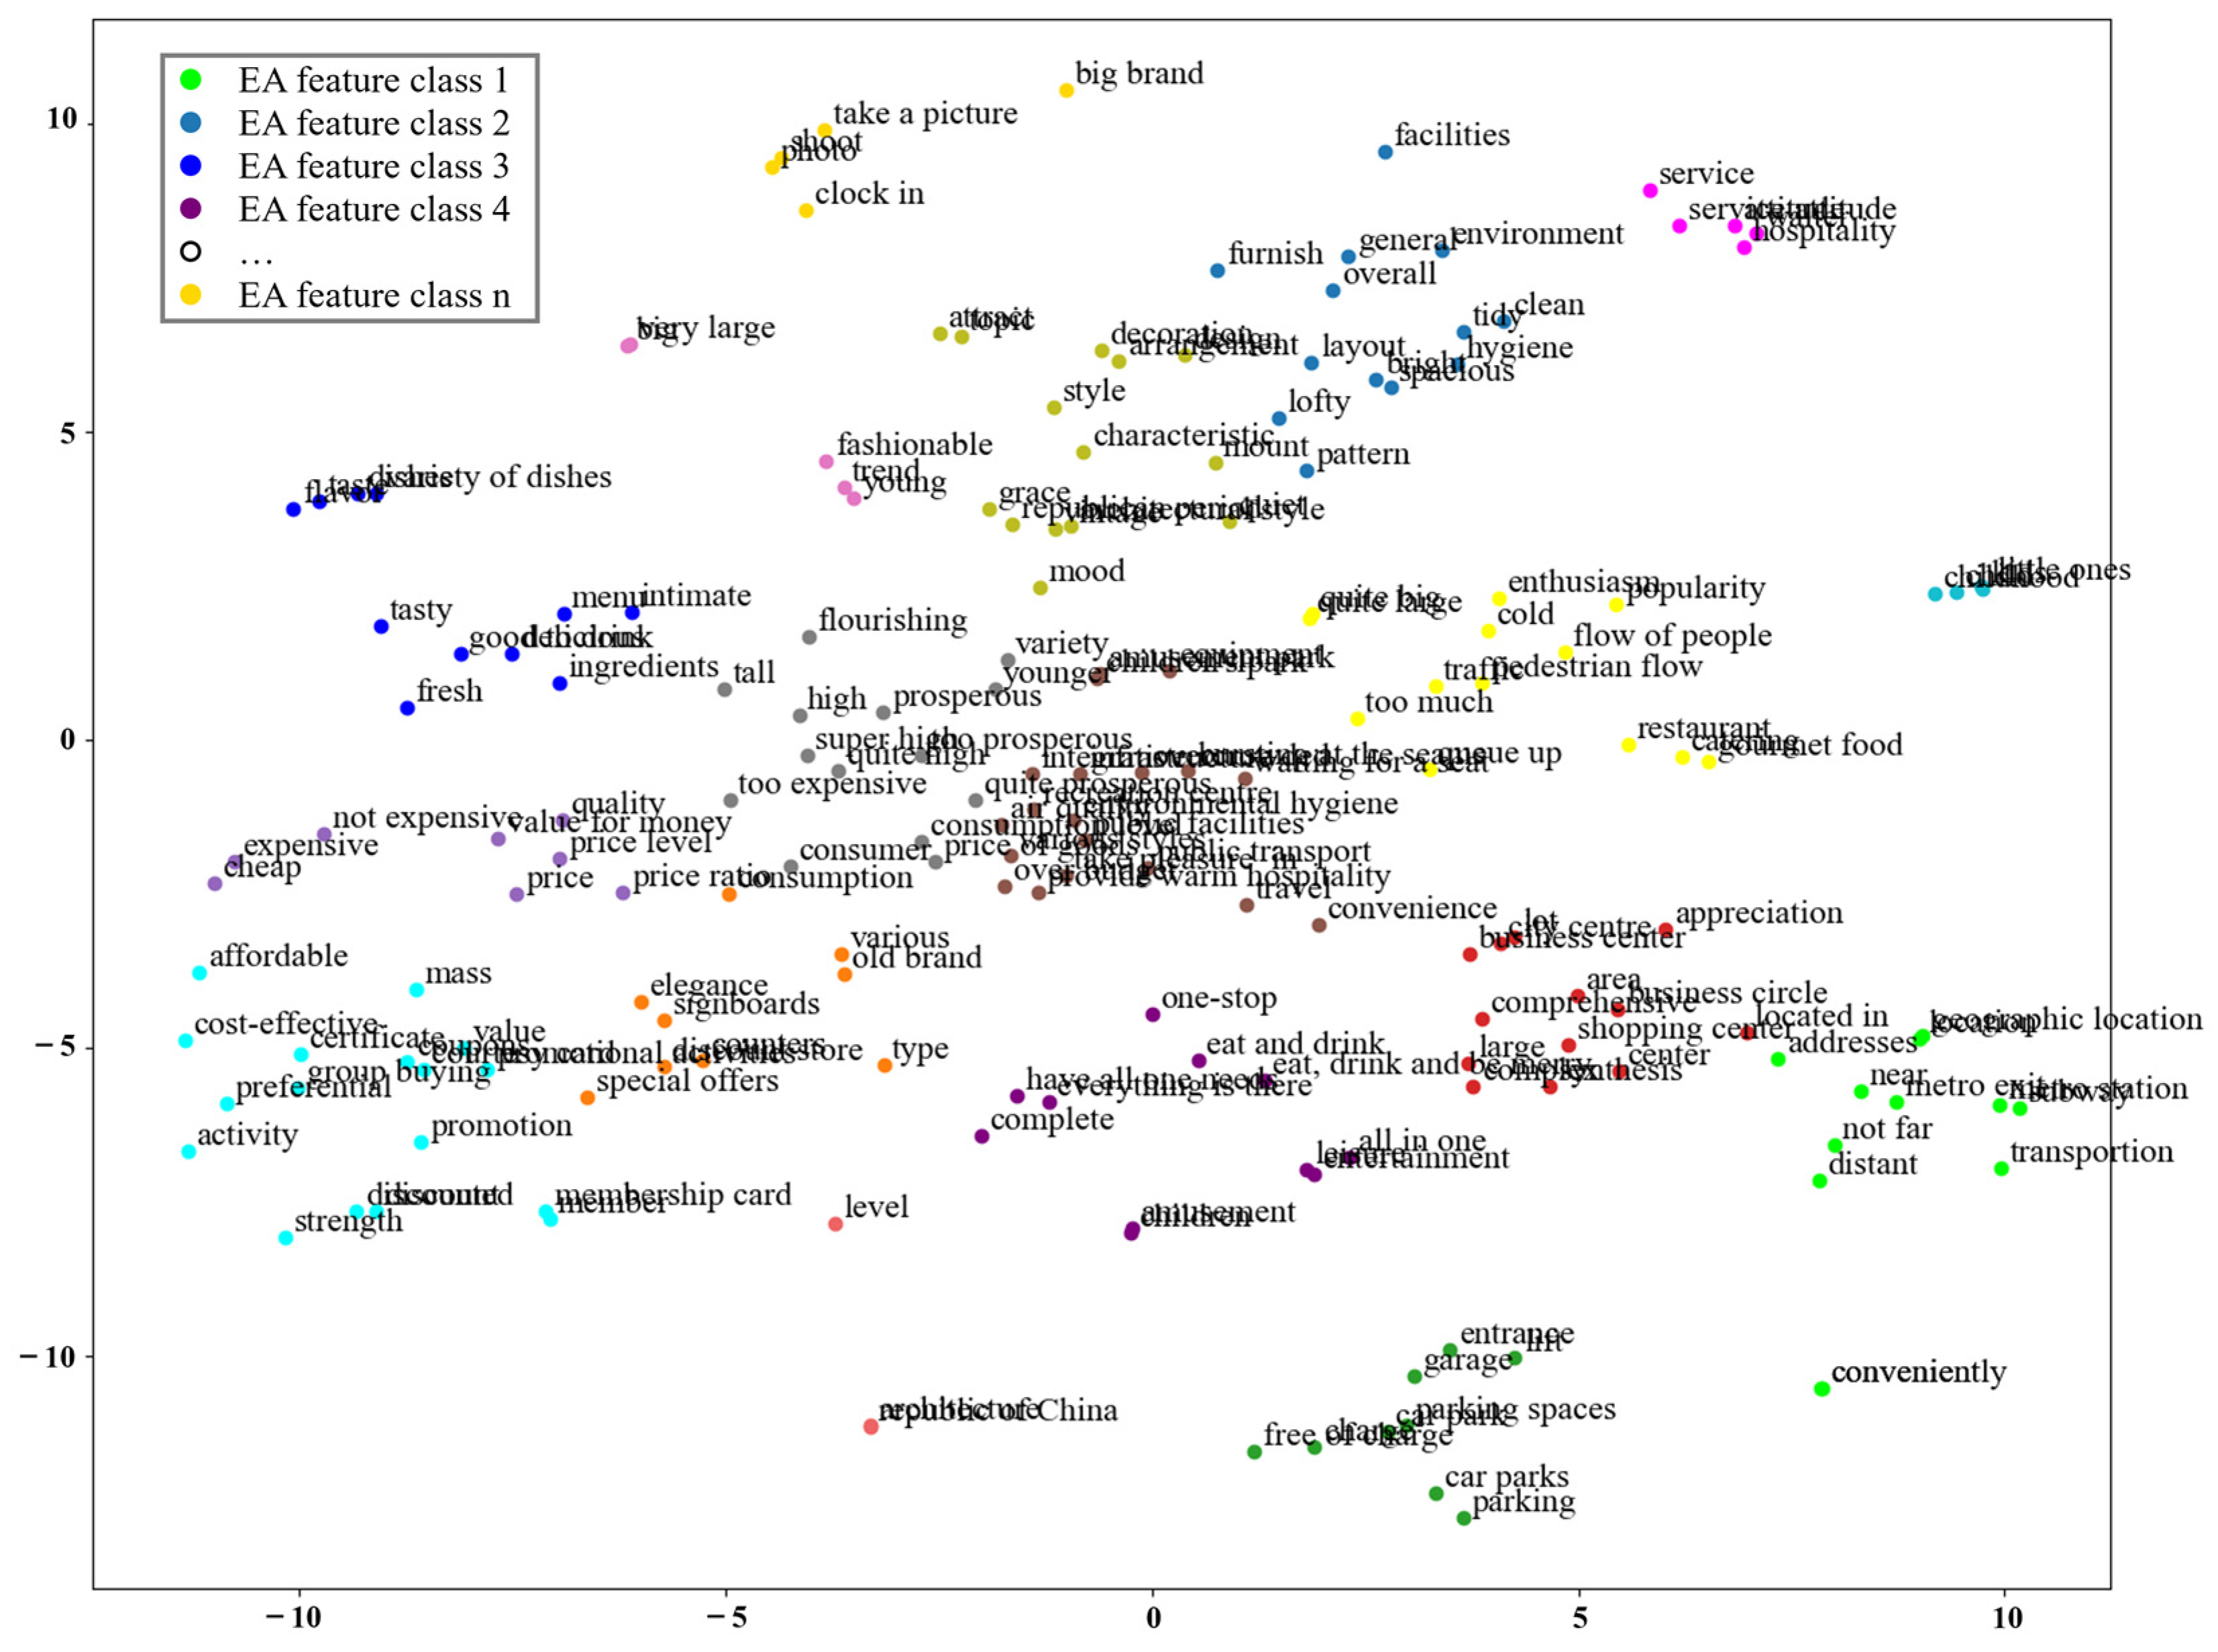
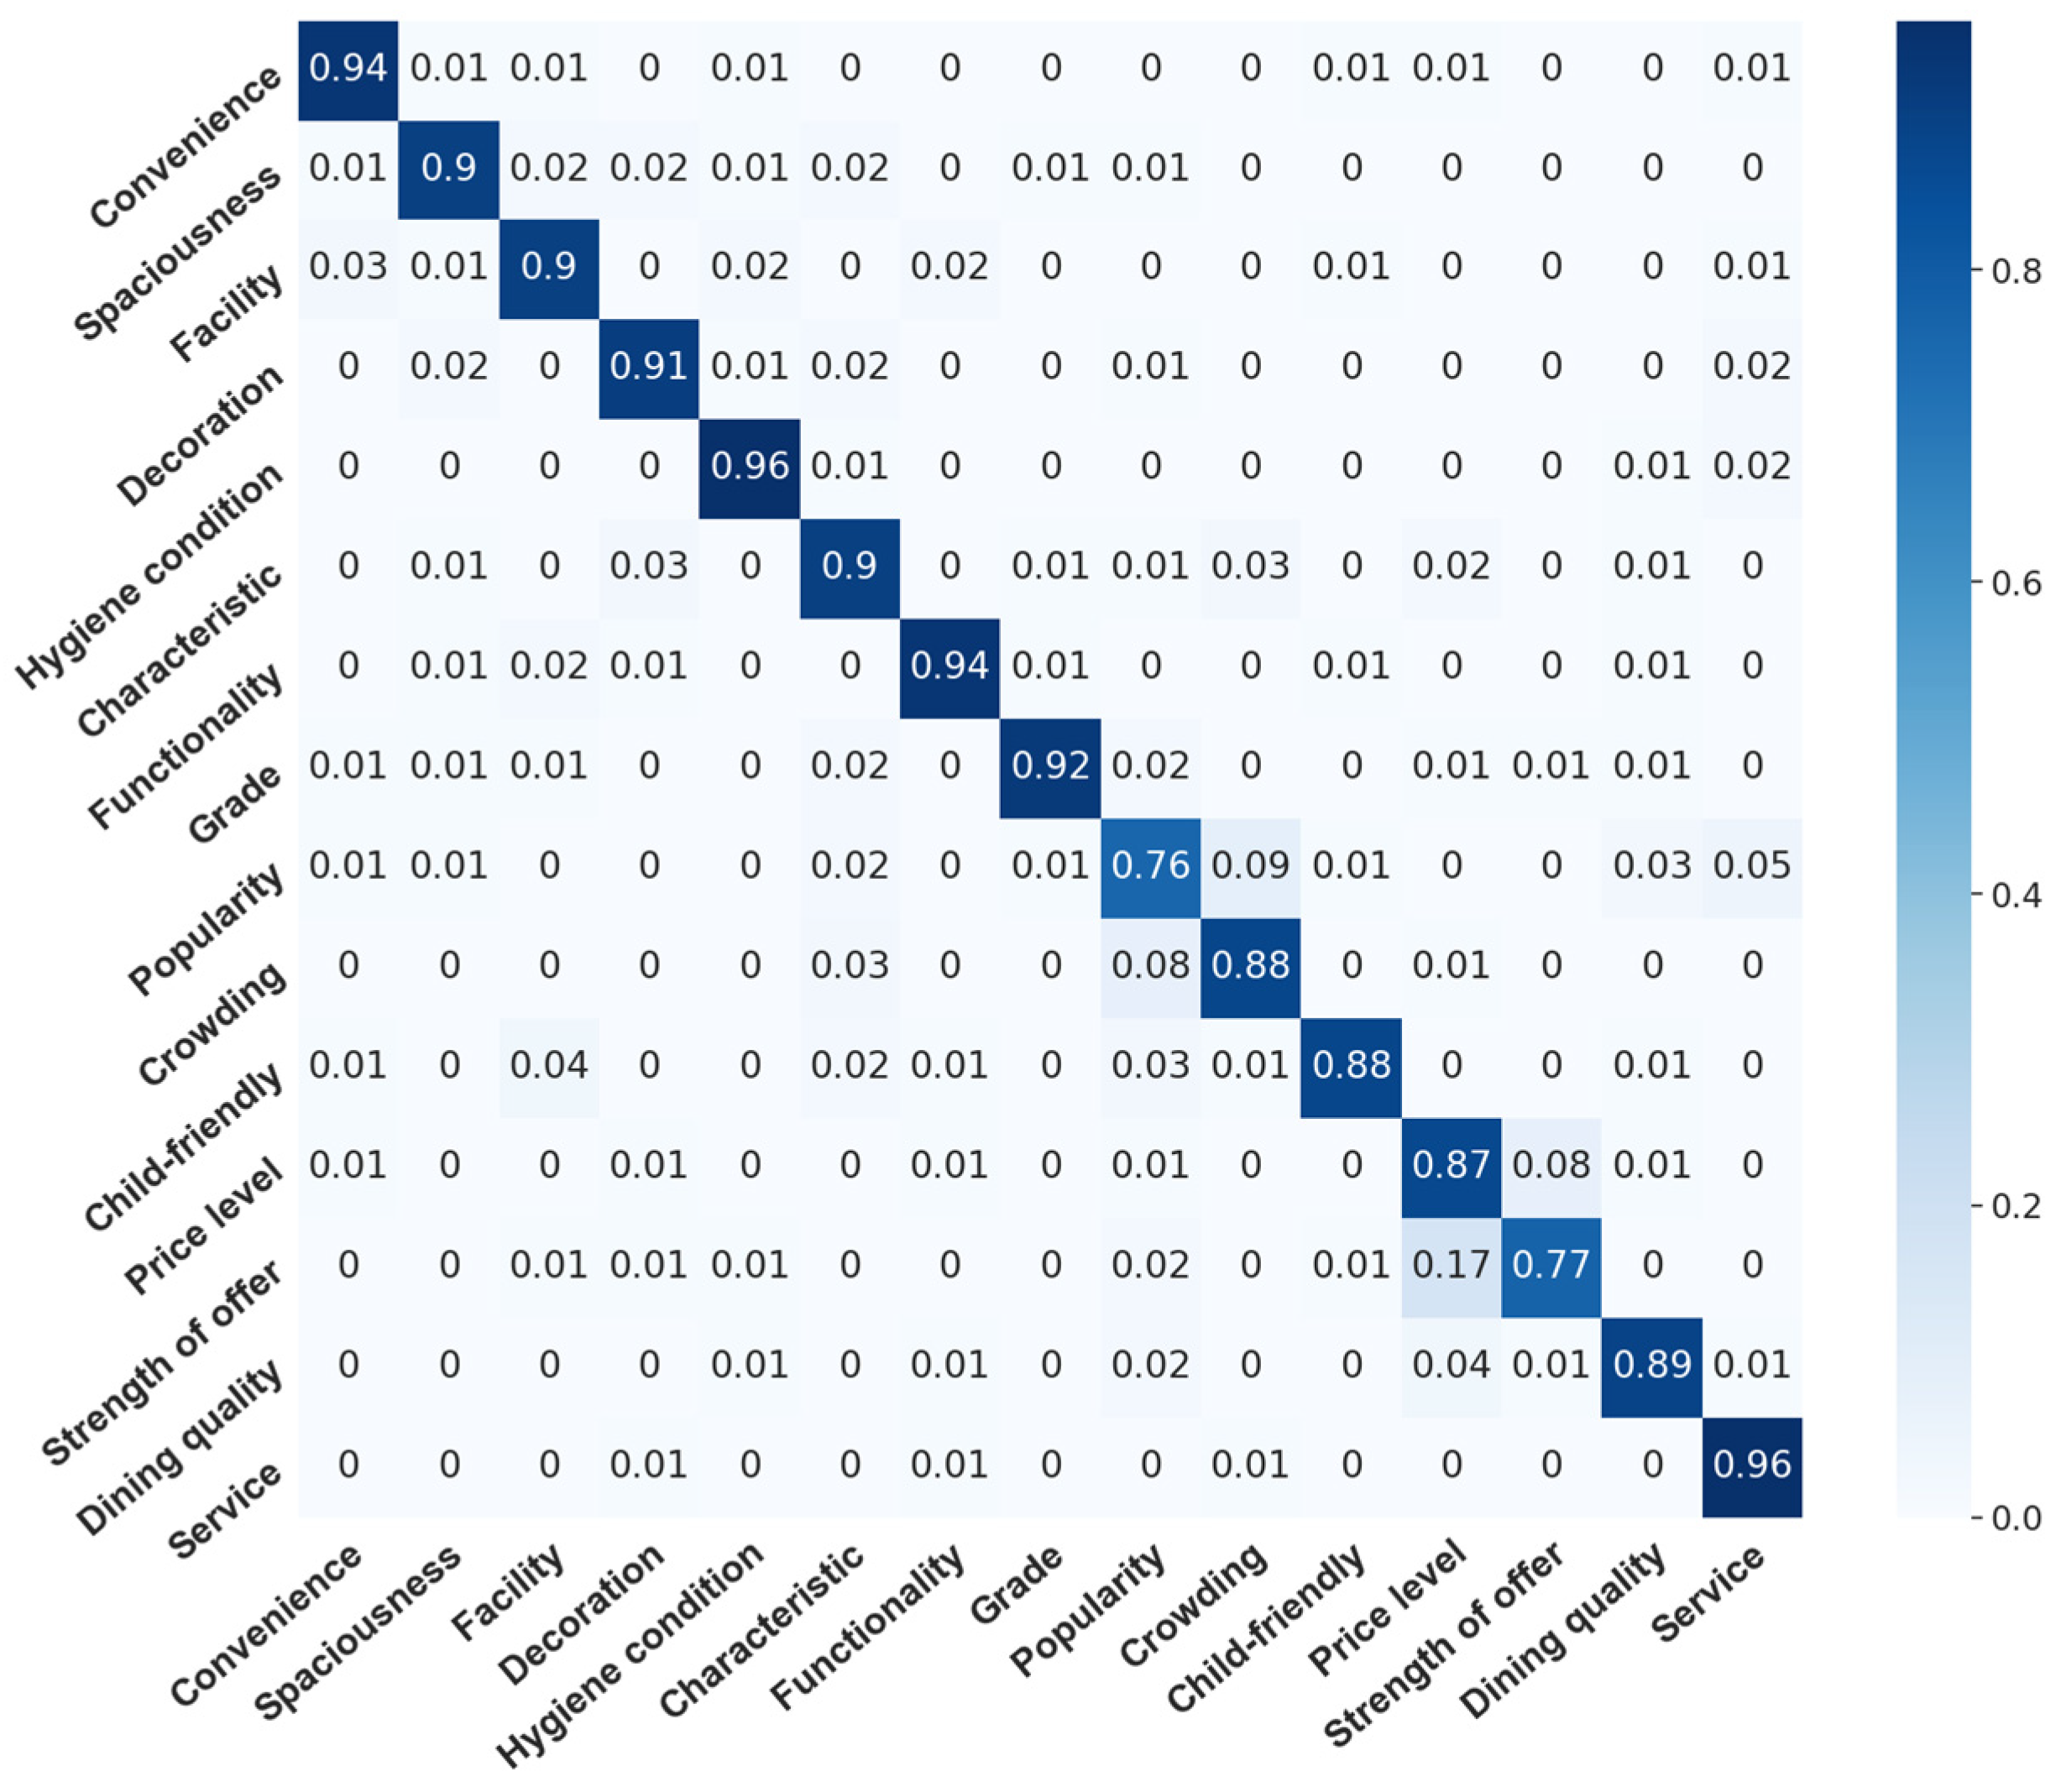
4.1.1. Results of Feature Factors Identification for Text
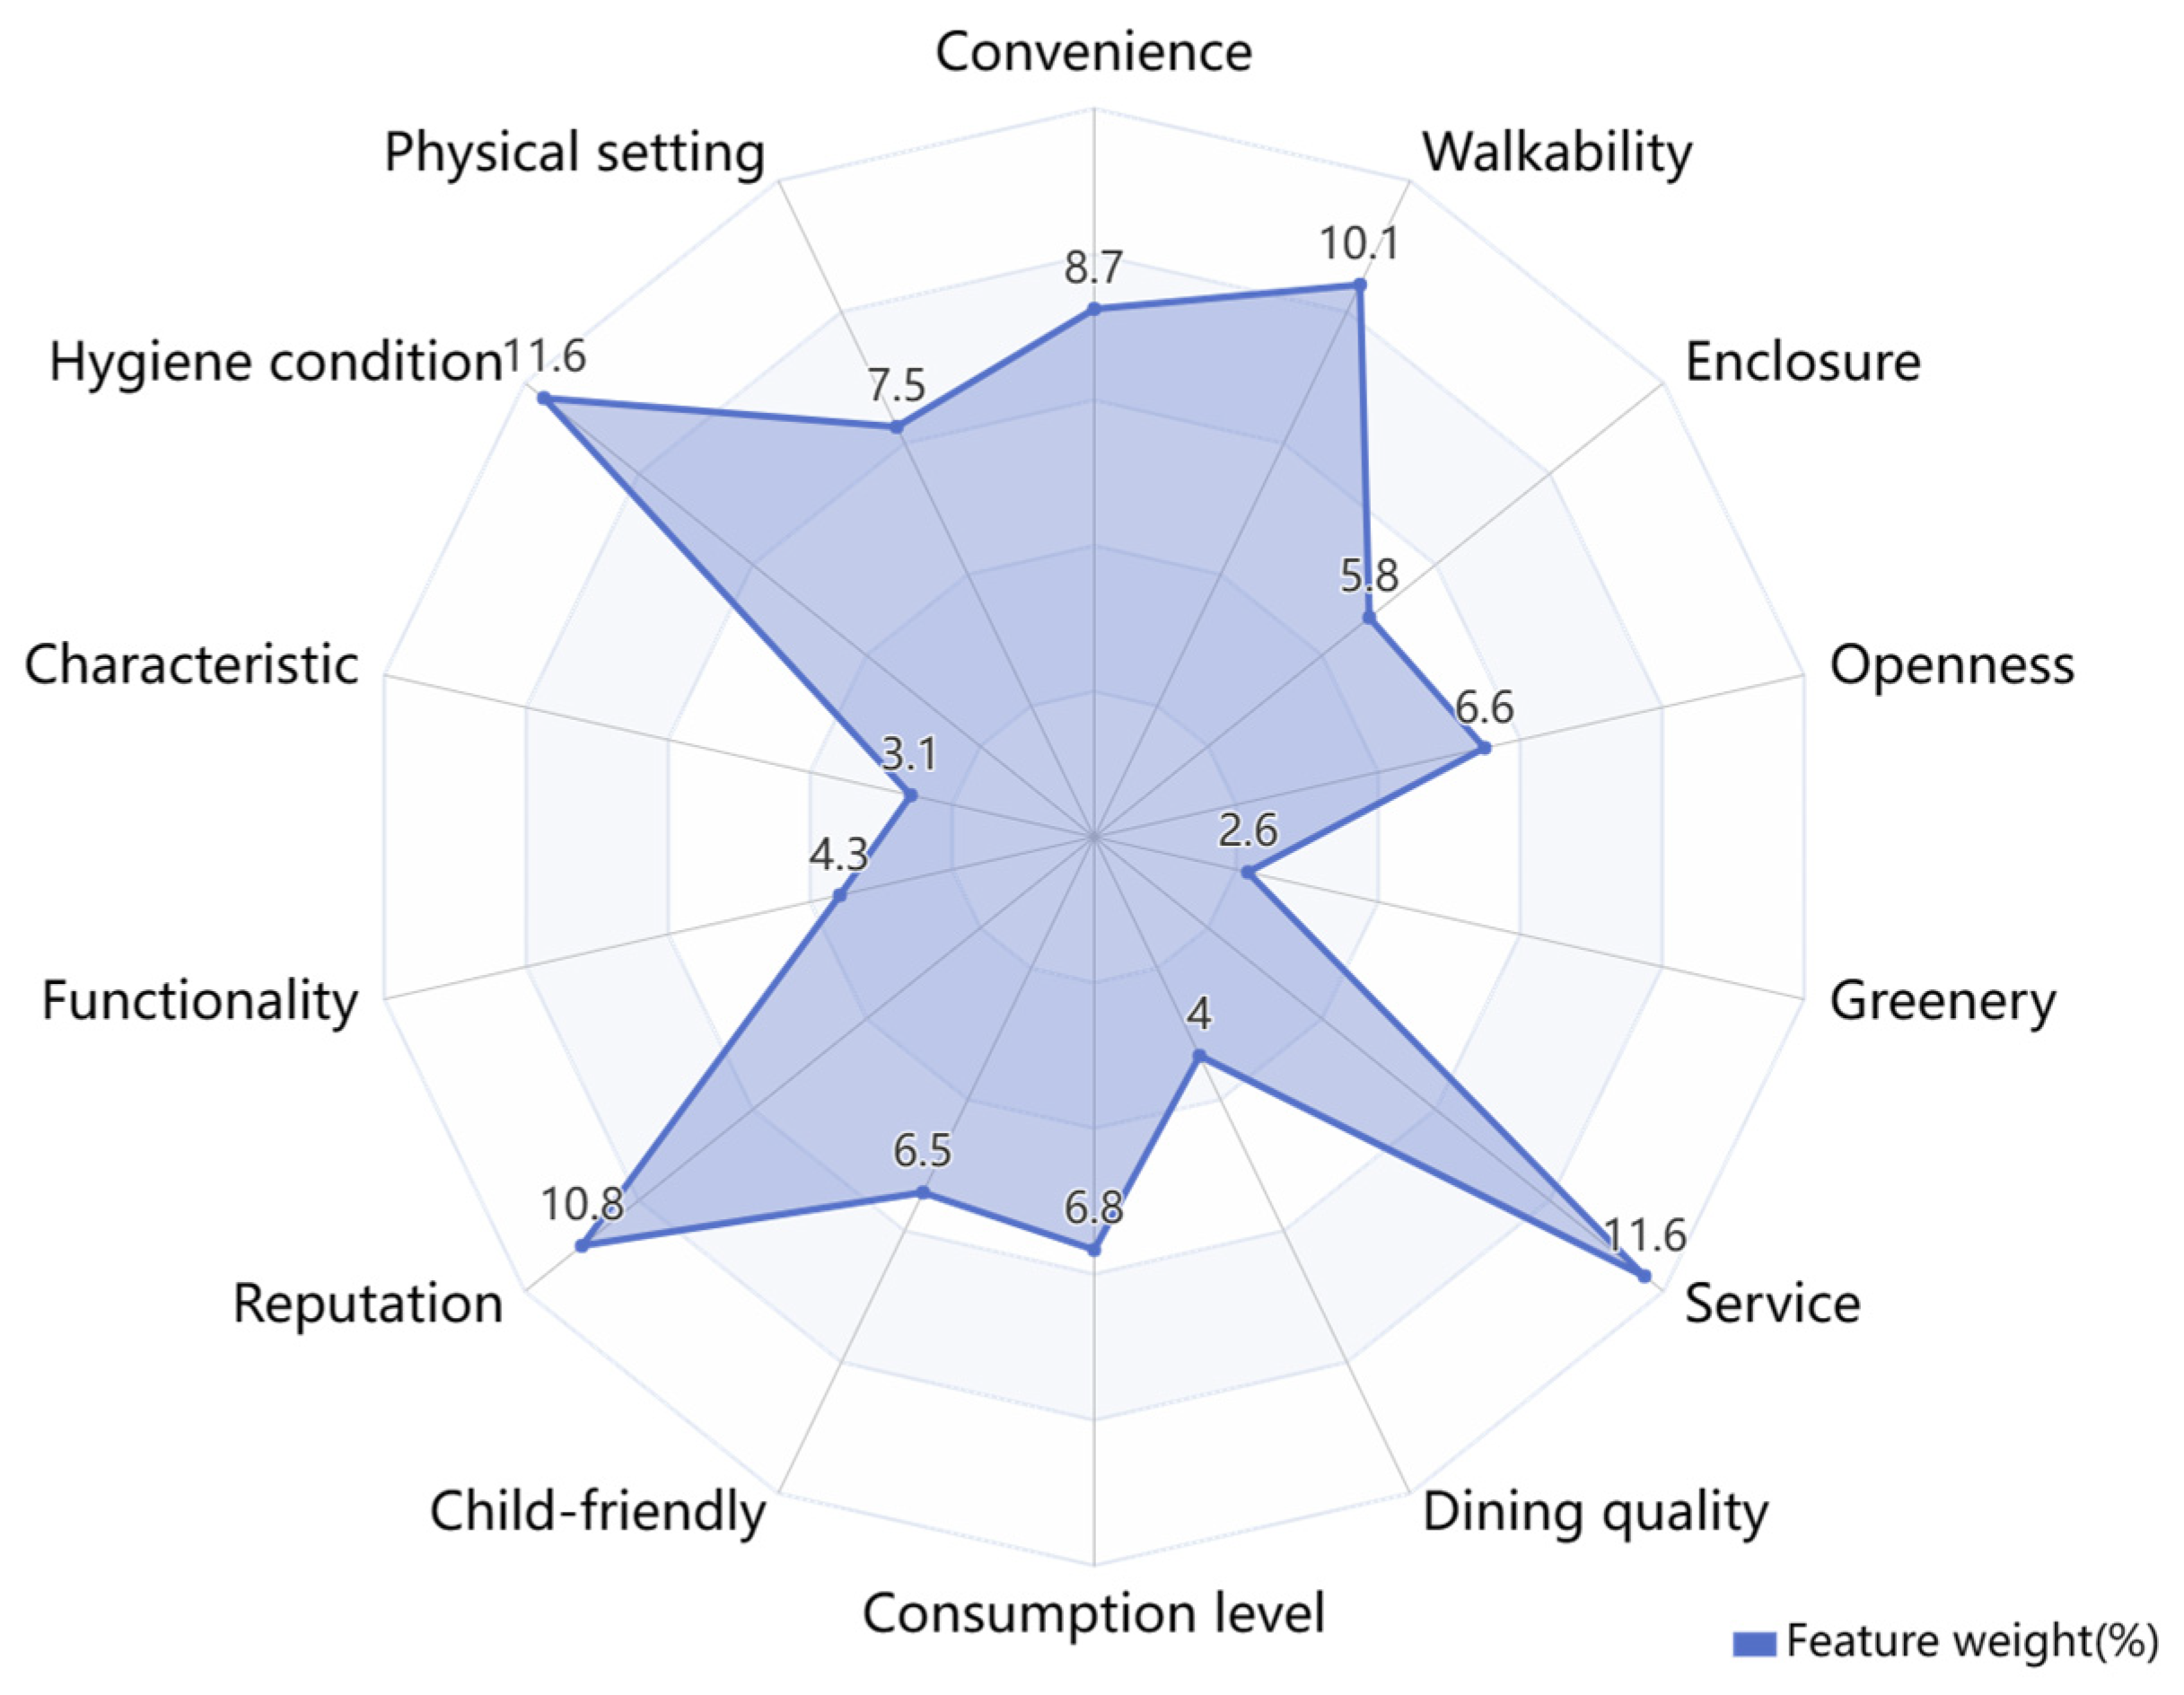
4.1.2. Weights Identification
4.2. Spatial Distribution of Environmental Amenity Levels
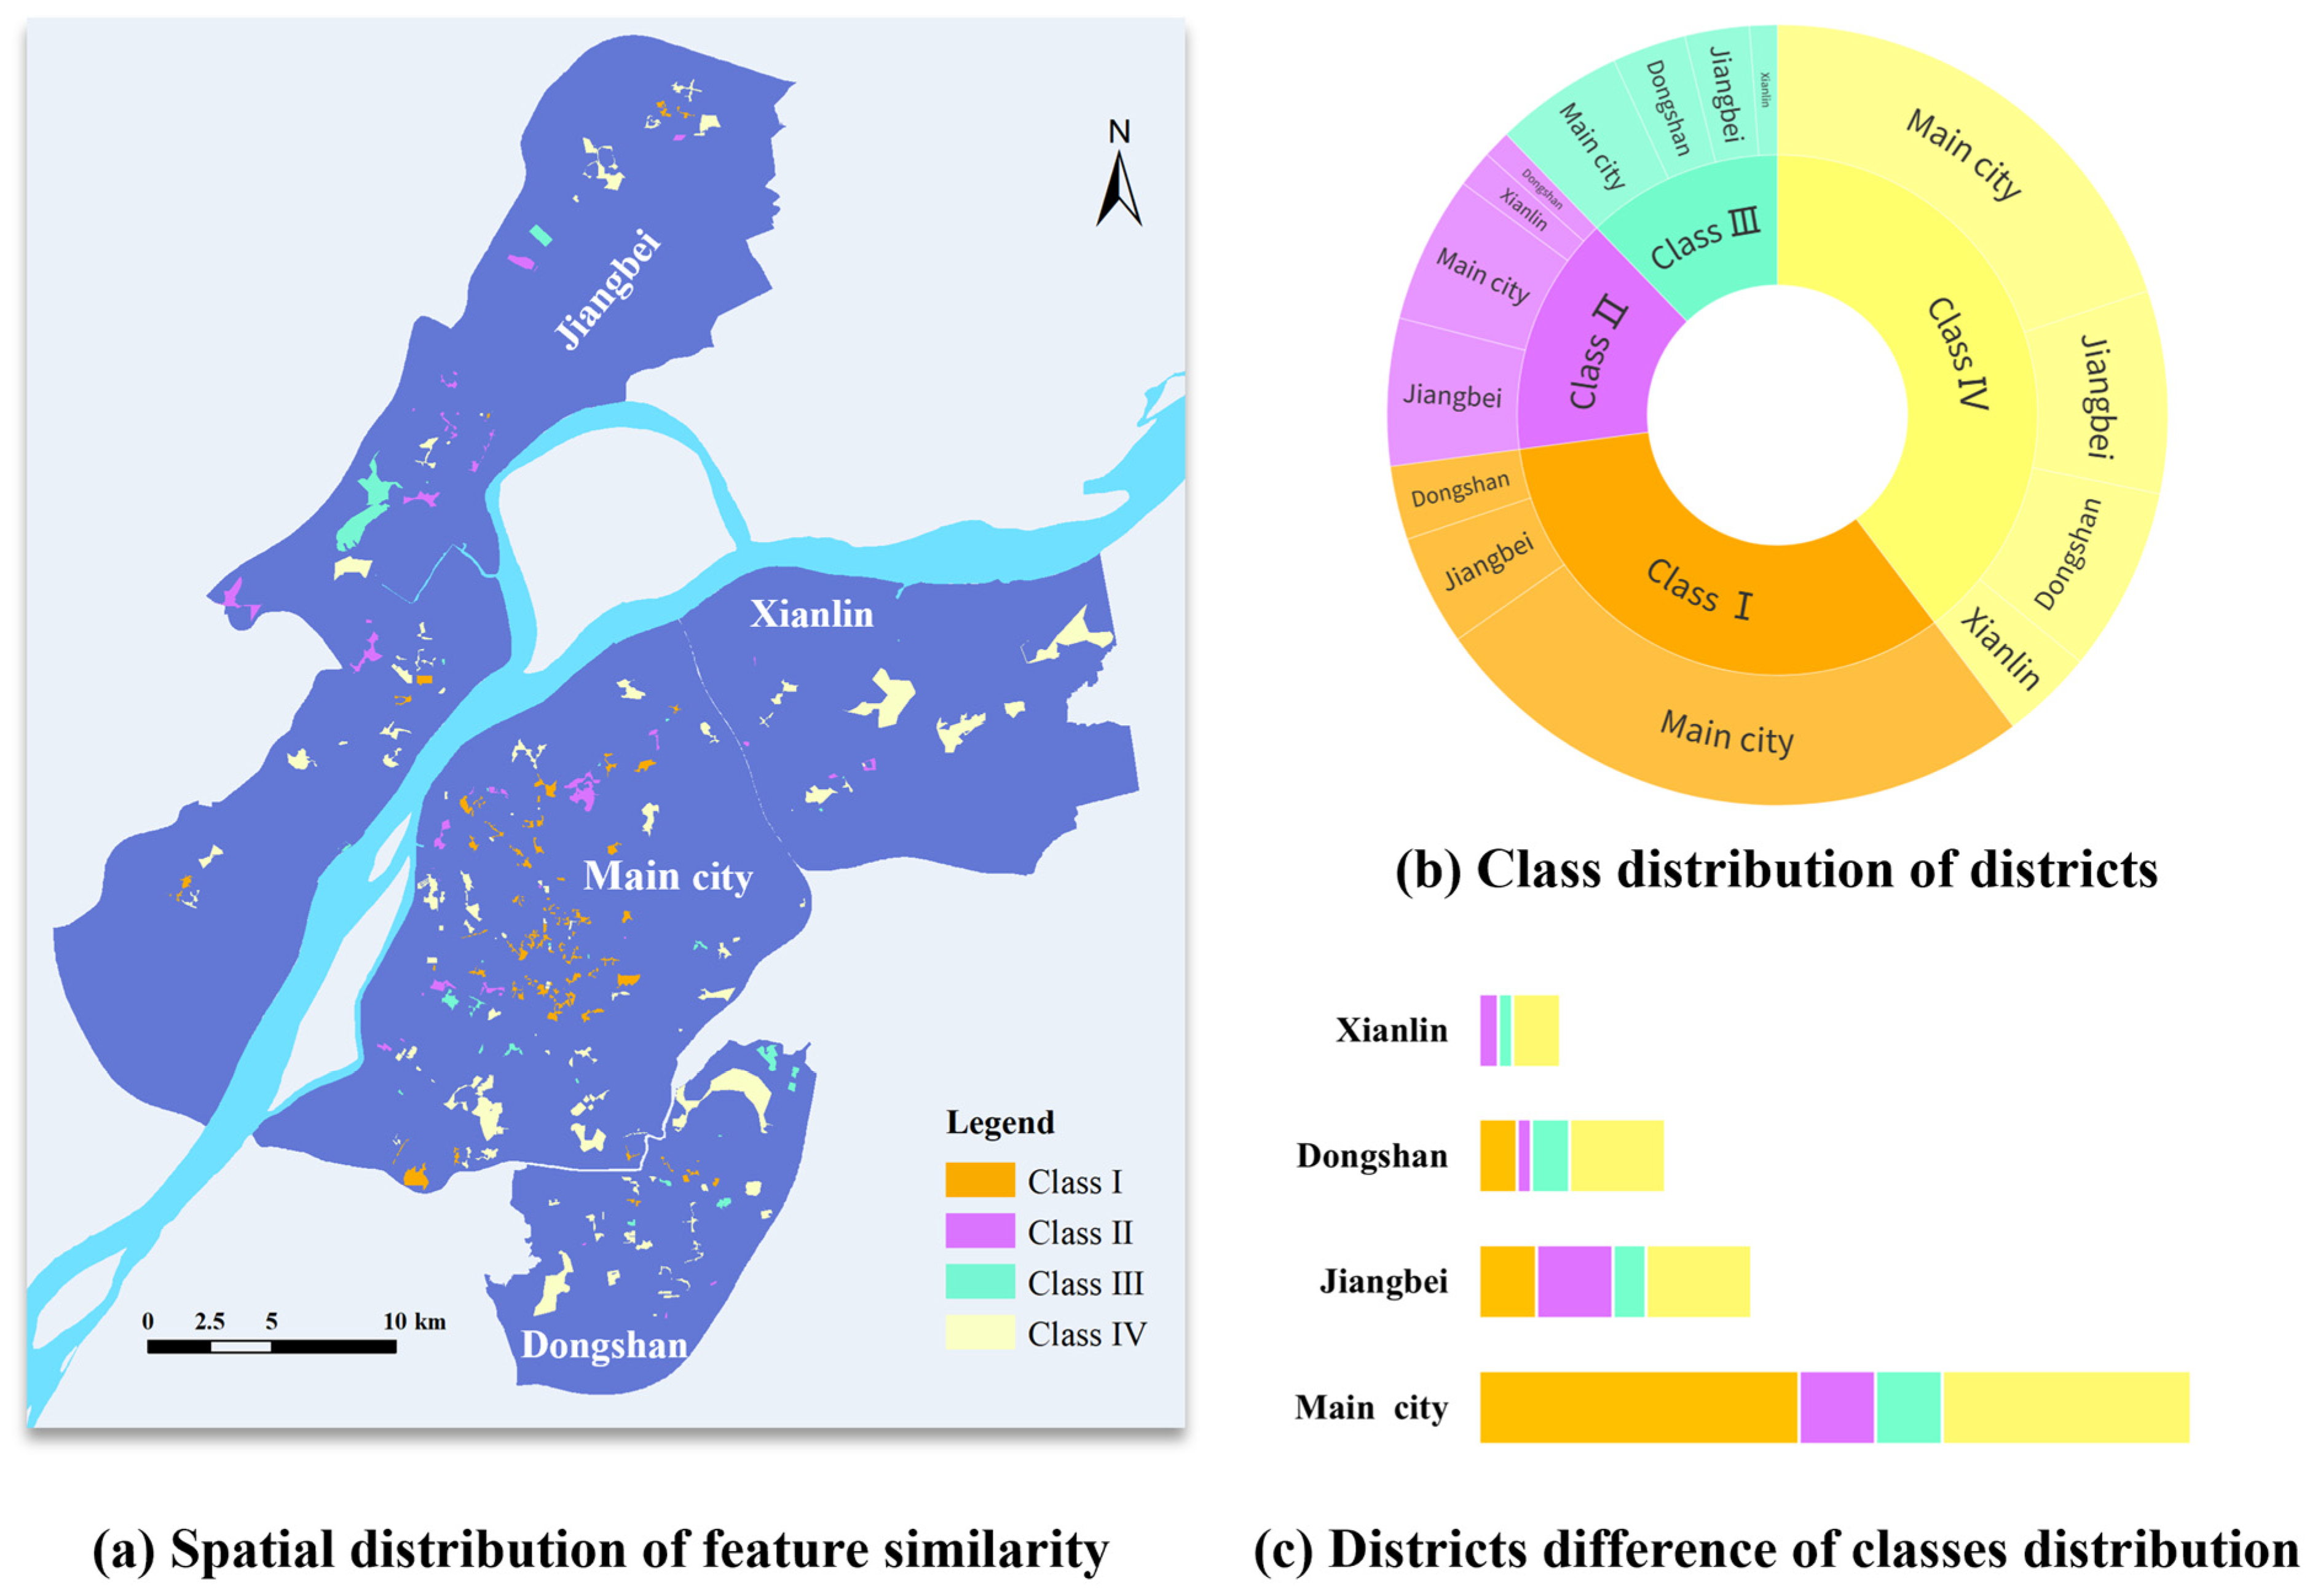
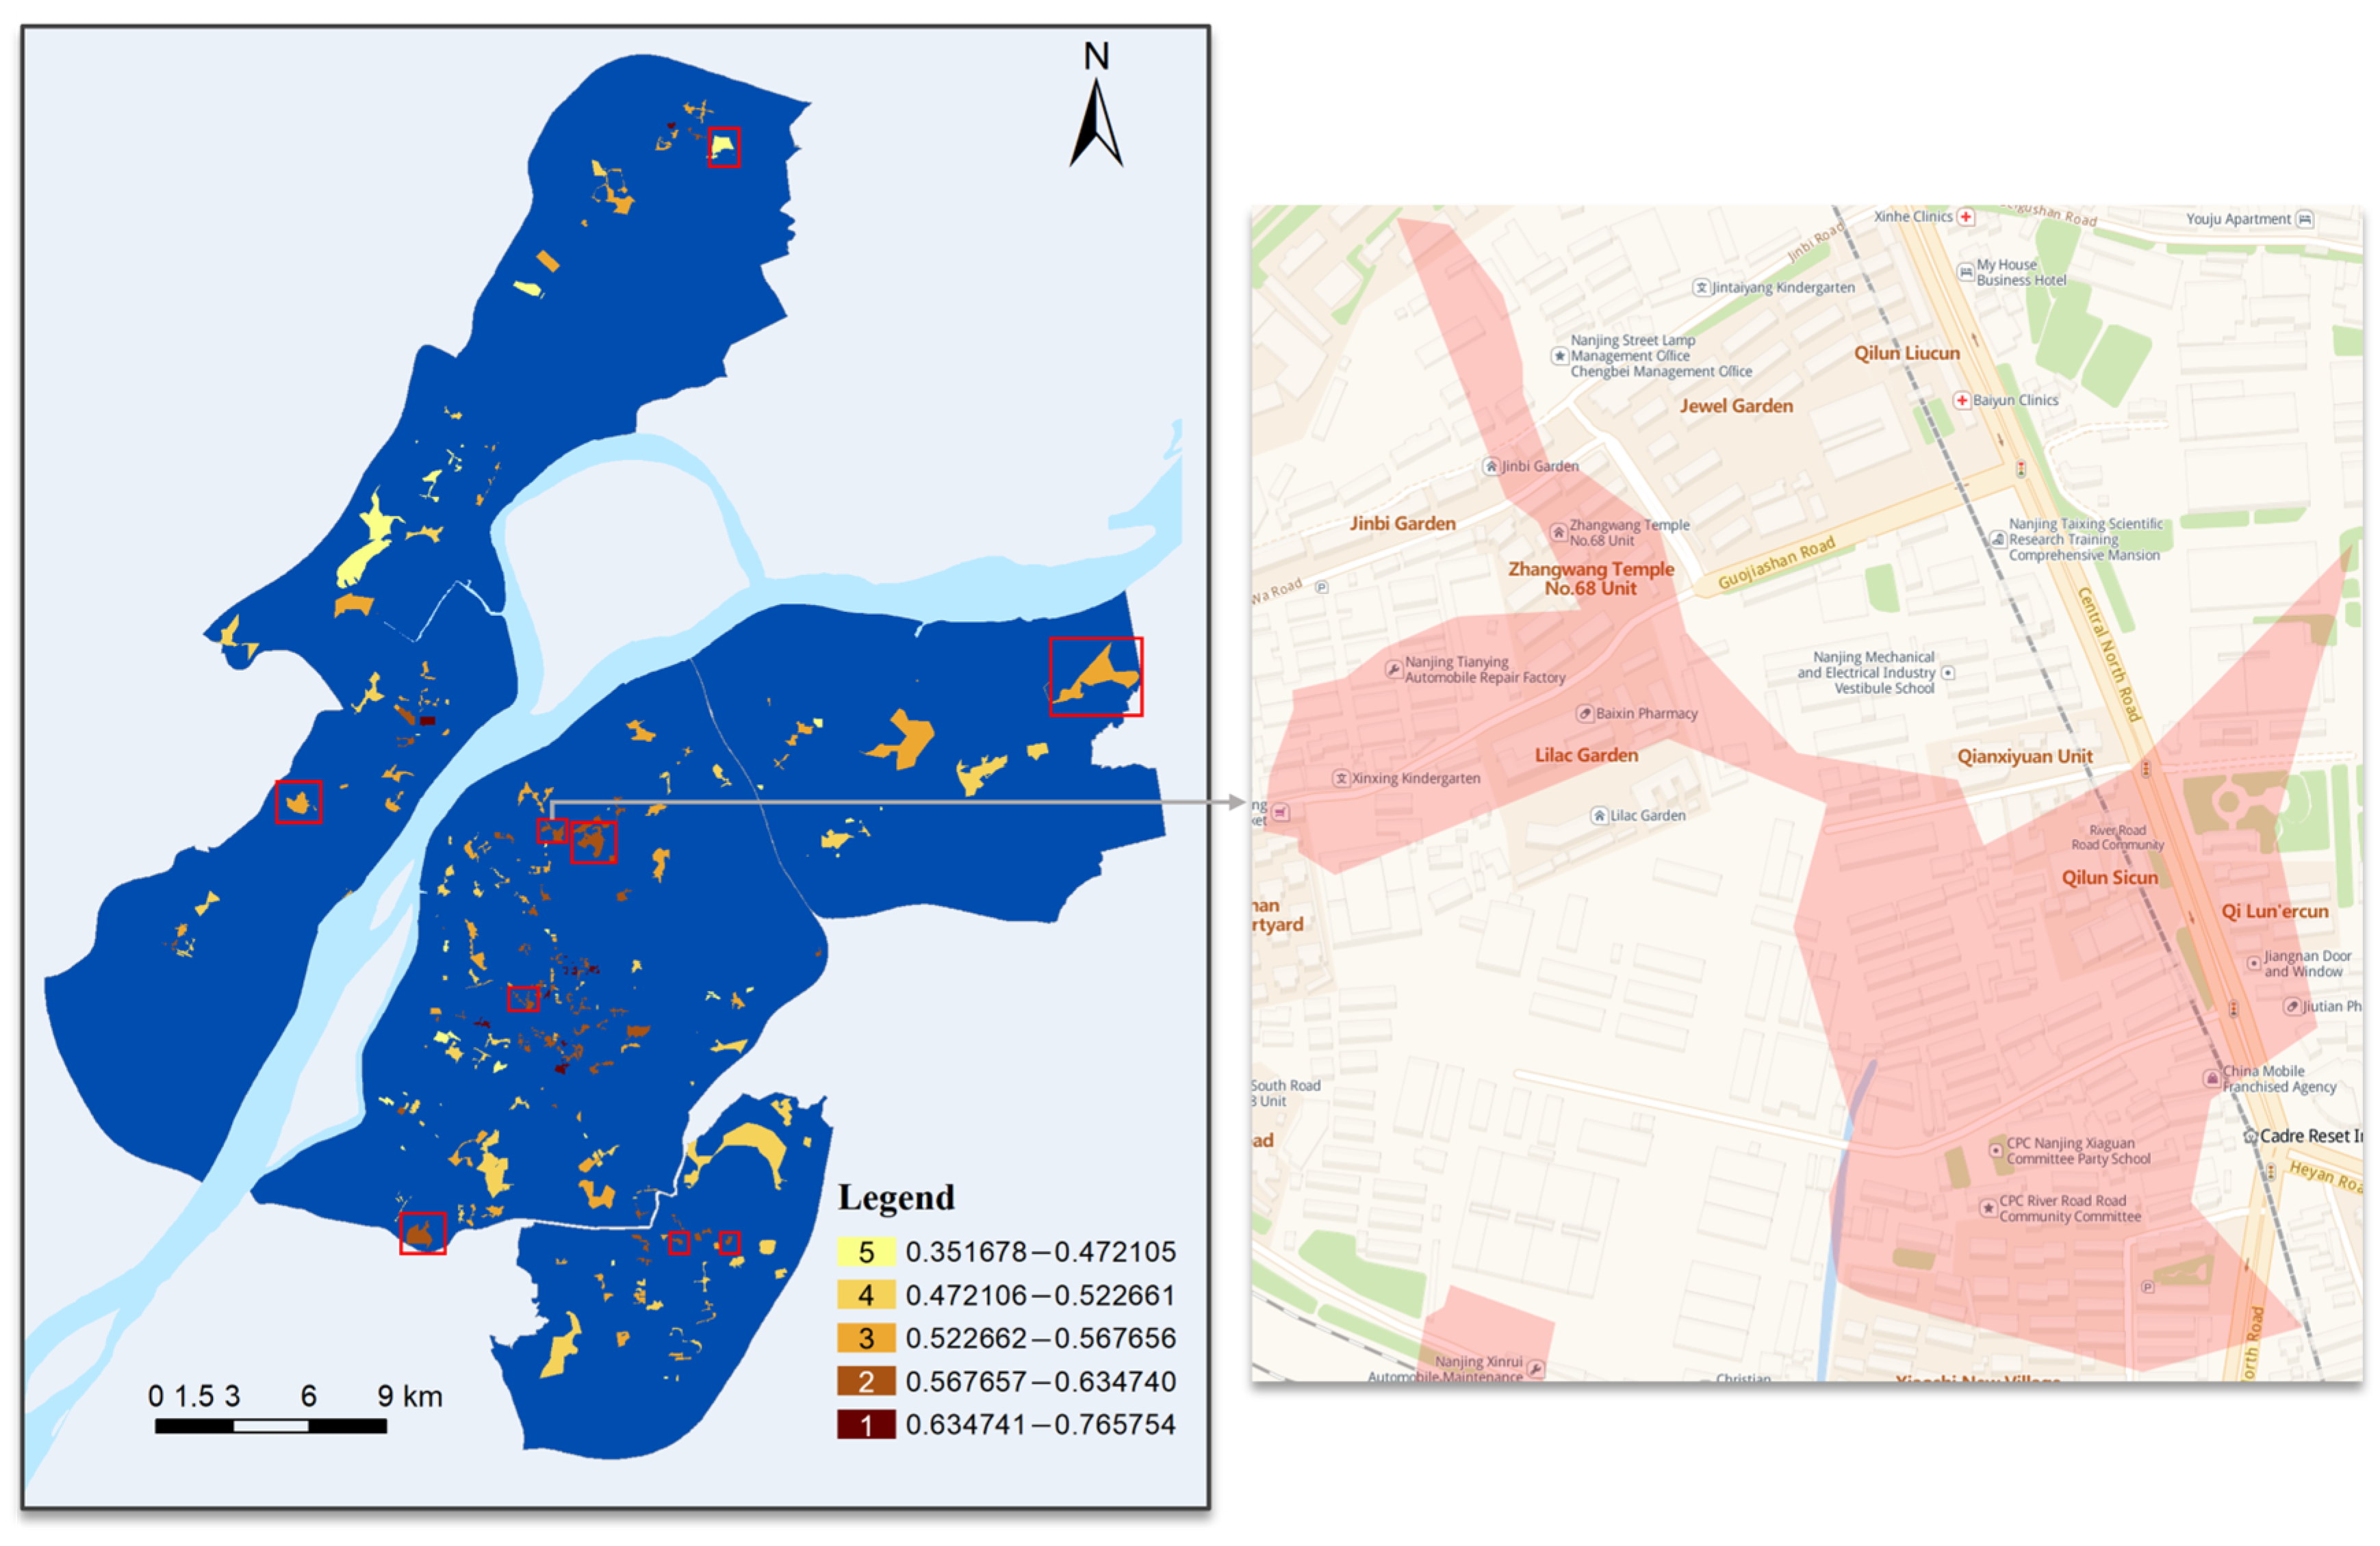
- Levels of EAs are characterized by clustered distribution. From the quantitative results, dark umber patches indicate a high-value range of EA, followed by saddle brown patches, mainly concentrated in the center of the main city district. Conversely, yellow and orange patches are in the low-value range for EA levels, and these patches are mainly found in the fringes of the main city district and the fringes of the suburban districts (Figure 12a). The EAs of URLRs in the Nanjing urban area show a spatial pattern of decreasing from the core to the outer edges, in which the core area presents a high level of spatial aggregation.
- The four urban districts show an uneven distribution of different levels. Comparing the district differences, the average level of EAs in the main city district (0.5613), which has the largest percentage of higher levels, is higher than in the three suburban areas (Figure 12c), with the suburban districts in the order of Dongshan (0.5481), Jiangbei (0.5210), and Xianlin (0.4983). Moreover, the main city has the most densely populated URLR patches. In contrast, Xianlin has the least populated URLR patches (Figure 12a,c), and no higher grades of URLR patches were found in the Xianlin district.
- Overall, the EA value of Nanjing’s URLRs is at a medium-high level (the average value of Nanjing’s URLRs is 0.5465), and the patches above the intermediate level account for 48.9%. From the point of view of the EA level distribution, more than three-fifths of the patches with medium and high EA levels (35% and 33%, respectively) show a pattern of low percentages in the two poles and a high rate in the middle (Figure 12b).
4.3. Spatial Similarity Analysis of Environmental Amenity Features
4.4. Spatial and Temporal Variations of Environmental Amenity
- The EAs of Nanjing’s URLRs have declined overall. Firstly, as reflected in the interval of quantitative values of EA, the value has changed from [0.409060,0.808437] to [0.351678,0.765754]. Secondly, the number of higher levels of the first three has declined, and the number of lower levels of the last two has increased. It can be further seen from Figure 15 that all districts are experiencing a reduction in EAs at higher levels. This could be because the epidemic has reduced the total number of customer visits, there has been a subsequent decrease in comments, and even some leisure venues have closed. However, some URLRs’ EAs at some neighborhoods’ entrances have improved (Figure 16). This is due to the gradual liberalization of the epidemic in 2022; safe recreational activities with short distances satisfy people’s unsealed desires.
- The spatial distribution of grades in 2022 is similar to that in 2019, with a decreasing trend of multiple cores radiating outwards. However, the phenomenon of high-grade clustering in the main urban areas is more concentrated compared to 2019.
5. Discussion
- Firstly, from the perspective of spatial distribution, the EA level of URLRs presents a spatial pattern of generally decreasing from the center to the outside and shows characteristics of regional differentiation.
- Secondly, regarding feature similarity, features of EAs in Nanjing’s URLRs show a spatial pattern of similarity in the center and at the edges of each district, respectively.
- Thirdly, comparing analyses of 2019 and 2022 suggests that the epidemic reduced the overall EA level of URLRs in Nanjing, which confirms the previous effect of hygienic conditions on EA. However, there is an increase in EAs for URLRs in the vicinity of residential neighborhoods.
- It is worth noting that the spatial distribution of EA level is consistent with the urban vibrancy [70,71] in related studies. That is, it has an attenuation characteristic from the city center. The closer URLRs are to the city center, the more accessible they are to the surroundings and the higher their vibrancy. As the result of this study, the center of the region formed by the hotspot URLRs is Xinjiekou Subway Station. To our knowledge, central areas of a city are the focus of government attention, with substantial resources invested in infrastructure development and recreational services. On the other hand, residents tend to be wealthier in central areas [72], which attract a higher concentration of talent [73], and have higher expectations for quality of life and spiritual pursuits. These indirectly lead to differences in the spatial distribution of EAs of URLRs. This study can well explain the cause of spatial heterogeneity of leisure activities [50].
- Firstly, urban planners and decision-makers should prioritize the aspects that are most important to people. This can be achieved practically by focusing on constructing walkways and other facilities or increasing the reputation of urban regional leisure resources through media promotion. For example, TikTok is an up-and-coming online publicity platform through which you can create featured online publicity.
- Secondly, the government should ensure a balanced development of urban areas. They can prioritize the construction of leisure infrastructure and introduce talent policies for non-central regions (such as giving more subsidies for talent) to promote the simultaneous growth of the economy in urban regions.
- Thirdly, it is crucial to leverage the unique features of each urban regional leisure resource. Local businesses and governments should clarify their characteristics and corresponding weaknesses, making the characteristics deeply impressive for people based on complementary advantages and disadvantages. For example, special cultural and creative neighborhoods are a good direction for development.
- Lastly, it is wise to establish comprehensive measures to respond to special public events. Adjusting policies promptly in the face of events and adapting to market changes can minimize adverse effects to the greatest extent possible. Building systematic monitoring and early warning systems and improving early warning capacity is the most effective.
6. Conclusions
- An advanced framework is proposed to evaluate the urban leisure environment. In this study, we proposed an advanced framework for quantifying and characterizing the EAs of URLRs on a fine scale based on image and text fusion perception. This EA estimation method is developed explicitly for URLRs and is more comprehensive and effective than traditional methods. The proposed framework could be extended to measure the quality of other types of leisure space, such as sightseeing and culture.
- The understanding of human perceptions of EAs in a large-scale urban environment is enhanced automatically and efficiently using web comment text and street-level imagery. The subjective and objective perceptions can be combined based on the review text and the associated street images of a single URLR. Using natural language processing and computer vision technology, the EAs of URLRs can be characterized comprehensively. The feature factors of the EAs for the internal and external spaces of URLRs are extracted. The feature factors and influence weights affecting the overall EAs of URLRs are analyzed, enriching the EA system and the connotation of leisure EA. These perception methods help identify which features are more significant for URLRs, providing a clear path for environmental improvement.
- The time and space distribution of EAs in URLRs of a developing country city is analyzed, and its formation mechanism is preliminarily diagnosed. Compared with studies with larger coverage, such as urban amenities, this study focuses on a more fine-grained level, i.e., the humanistic leisure field. It reveals EA’s spatial distribution and spatial-temporal change characteristics in Nanjing’s URLRs. The measurement results of this study can offer understanding of the potential spatial heterogeneity patterns of urban leisure activities. The case study could provide decision-making support for urban planning and management of leisure areas.
Author Contributions
Funding
Data Availability Statement
Acknowledgments
Conflicts of Interest
Appendix A
- Delete useless comment data, such as irrelevant comment, comments that are all numbers or all symbols and comments of not more than ten words.
- Remove spaces, special symbols, dates, and English symbols from comments.
- Correction of misspelled words and simplification of traditional Chinese characters.

| High Frequency Word | Frequency | High Frequency Word | Frequency |
|---|---|---|---|
| Big | 7629 | Whole | 2073 |
| Environment | 7047 | Dishes | 2036 |
| Convenient | 5799 | Subway station | 1988 |
| Activities | 4888 | Kids | 1936 |
| Price | 4194 | Photograph | 1906 |
| Brand | 4011 | Characteristics | 1904 |
| Popularity | 3742 | Total | 1859 |
| Catering | 3573 | Children | 1785 |
| Delicious | 3507 | Facilities | 1774 |
| Service | 3425 | Parking lot | 1739 |
| Large | 3372 | Queue | 1739 |
| Cheap | 3151 | Complete | 1736 |
| Decorating | 2936 | Level | 1731 |
| Subway | 2816 | The Confucius Temple | 1705 |
| Cost-effective | 2782 | Recreation | 1696 |
| Xinjiekou | 2726 | Suning | 1647 |
| Taste | 2646 | Clock in | 1643 |
| New | 2494 | Lively | 1540 |
| Location | 2474 | Leisure | 1524 |
| Parking | 2302 | Free | 1516 |
| Flavour | 2275 | Expensive | 1463 |
| High | 2251 | Entertainment | 1397 |
| Located in | 2251 | Buildings | 1365 |
| Near | 2210 | Fashion | 1327 |
| Transport | 2206 | Discount | 1307 |
| Word | Similarity Word_1 | Similarity_1 | Similarity Word_2 | Similarity_2 | Similarity Word_3 | Similarity_3 |
|---|---|---|---|---|---|---|
| Big | Large | 0.856 | Huge | 0.765 | Enormous | 0.747 |
| Environment | Whole | 0.764 | Tidy | 0.762 | Effect | 0.76 |
| Convenient | Convenience | 0.932 | Handy | 0.769 | Over budget | 0.763 |
| Activities | Promotional activities | 0.790 | Preferential | 0.721 | Free meal | 0.697 |
| Brand | Sign | 0.835 | Merchant | 0,797 | Shop | 0.795 |
| Popularity | Business | 0.747 | Stream of people | 0.724 | Bustling | 0.715 |
| Catering | Restaurants | 0.868 | Diet | 0.826 | Delicacy | 0.804 |
| Delicious | Good-tasting | 0.753 | Yummy | 0.745 | Pickled Cabbage Fish | 0.74 |
| Service | Service attitude | 0.881 | Attitude | 0.806 | Treat people | 0.769 |
| Cheap | Expensive | 0.901 | Affordable | 0.86 | Inexpensive | 0.849 |
| Renovation | Decoration | 0.824 | Integral | 0.742 | Pattern | 0.732 |
| Subway | Subway station | 0.931 | Subway exit | 0.912 | Tianlong | 0.898 |
| Cost-effective | Discount | 0.86 | Preferential | 0.86 | Affordable | 0.846 |
| Xinjiekou | Hunan Road | 0.86 | Zhujiang Road | 0.849 | Golden Eagle | 0.828 |
| Taste | Flavour | 0.911 | Component | 0.825 | Dishes | 0.821 |
Appendix B
References
- Carlino, G.A.; Saiz, A. Beautiful City: Leisure Amenities and Urban Growth. J. Reg. Sci. 2019, 59, 369–408. [Google Scholar] [CrossRef]
- Zheng, S.; Fu, Y.; Liu, H. Demand for Urban Quality of Living in China: Evolution in Compensating Land-Rent and Wage-Rate Differentials. J. Real Estate Financ. Econ. 2009, 38, 194–213. [Google Scholar] [CrossRef]
- Wen, H.; Zhang, Y.; Zhang, L. Assessing Amenity Effects of Urban Landscapes on Housing Price in Hangzhou, China. Urban For. Urban Green. 2015, 14, 1017–1026. [Google Scholar] [CrossRef]
- Ambrey, C.; Fleming, C. Public Greenspace and Life Satisfaction in Urban Australia. Urban Stud. 2014, 51, 1290–1321. [Google Scholar] [CrossRef]
- Hong, Z.; Park, I.K. Is the Well-Being of Neighboring Cities Important to Me? Analysis of the Spatial Effect of Social Capital and Urban Amenities in South Korea. Soc. Indic. Res. 2021, 154, 169–190. [Google Scholar] [CrossRef]
- Brajša-Žganec, A.; Merkaš, M.; Šverko, I. Quality of Life and Leisure Activities: How Do Leisure Activities Contribute to Subjective Well-Being? Soc. Indic. Res. 2011, 102, 81–91. [Google Scholar] [CrossRef]
- Shechter, M. A Comparative Study of Environmental Amenity Valuations. Environ. Resour. Econ. 1991, 1, 129–155. [Google Scholar] [CrossRef]
- Kahn, M.E.; Walsh, R. Cities and the Environment. Handb. Reg. Urban Econ. 2015, 5, 405–465. [Google Scholar]
- Mahmoudi, P.; Hatton MacDonald, D.; Crossman, N.D.; Summers, D.M.; der Hoek, J. Space Matters: The Importance of Amenity in Planning Metropolitan Growth. Aust. J. Agric. Resour. Econ. 2013, 57, 38–59. [Google Scholar] [CrossRef]
- Savageau, D. Places Rated Almanac: The Classic Guide for Finding Your Best Places to Live in America, 7th ed.; Places Rated Books LLC: Washington, DC, USA, 2007. [Google Scholar]
- Yang, Y.K.; Kim, Y.-J. A Study of the Relationships between Leisure and Quality of Life. Indian J. Sci. Technol. 2016, 46. [Google Scholar] [CrossRef]
- Janpavle, I.; Ile, U. The Importance of Active Leisure Areas in the Context of Urban Planning. Archit. Urban Plan. 2022, 18, 120–130. [Google Scholar] [CrossRef]
- Kang, L.; Yang, Z.; Han, F. The Impact of Urban Recreation Environment on Residents’ Happiness—Based on a Case Study in China. Sustainability 2021, 13, 5549. [Google Scholar] [CrossRef]
- Johnson, R.C.A.; Mannell, R.C. The Relationship of Crowd Density and Environmental Amenities to Perceptions of Malls as Leisure and Shopping Environments. Recreat. Res. Rev. 1983, 10, 18–23. [Google Scholar]
- Bayrsaikhan, T.; Lee, J.; Kim, M.H.; Gim, T.-H.T. A Seemingly Unrelated Regression Model of the Impact of COVID-19 Risk Perception on Urban Leisure Place Choices. Int. Rev. Spat. Plan. Sustain. Dev. 2021, 9, 30–40. [Google Scholar]
- Humpel, N.; Owen, N.; Iverson, D.; Leslie, E.; Bauman, A. Perceived Environment Attributes, Residential Location, and Walking for Particular Purposes. Am. J. Prev. Med. 2004, 26, 119–125. [Google Scholar] [CrossRef]
- Cerin, E.; Sit, C.H.P.; Barnett, A.; Cheung, M.C.; Chan, W.M. Walking for Recreation and Perceptions of the Neighborhood Environment in Older Chinese Urban Dwellers. J. Urban Health 2013, 90, 56–66. [Google Scholar] [CrossRef]
- Fraser, S.D.S.; Lock, K. Cycling for Transport and Public Health: A Systematic Review of the Effect of the Environment on Cycling. Eur. J. Public Health 2010, 21, 738–743. [Google Scholar] [CrossRef]
- Floyd, M.F.; Taylor, W.C.; Whitt-Glover, M. Measurement of Park and Recreation Environments That Support Physical Activity in Low-Income Communities of Color. Highlights of Challenges and Recommendations. Am. J. Prev. Med. 2009, 36, S156–S160. [Google Scholar] [CrossRef]
- Hino, A.A.F.; Reis, R.S.; Sarmiento, O.L.; Parra, D.C.; Brownson, R.C. The Built Environment and Recreational Physical Activity among Adults in Curitiba, Brazil. Prev. Med. 2011, 52, 419–422. [Google Scholar] [CrossRef]
- Su, M.; Du, Y.; Liu, Q.; Ren, Y.; Kawachi, I.; Lv, J.; Li, L. Objective Assessment of Urban Built Environment Related to Physical Activity—Development, Reliability and Validity of the China Urban Built Environment Scan Tool (CUBEST). BMC Public Health 2014, 14, 109. [Google Scholar]
- Saelens, B.E.; Frank, L.D.; Auffrey, C.; Whitaker, R.C.; Burdette, H.L.; Colabianchi, N. Measuring Physical Environments of Parks and Playgrounds: EAPRS Instrument Development and Inter-Rater Reliability. J. Phys. Act. Health 2016, 3, S190–S207. [Google Scholar] [CrossRef]
- Chhetri, P.; Stimson, R.J.; Western, J. Modelling the Factors of Neighbourhood Attractiveness Reflected in Residential Location Decision Choices. Stud. Reg. Sci. 2006, 36, 393–417. [Google Scholar]
- Clark, T.N. Urban Amenities: Lakes, Opera, and Juice Bars: Do They Drive Development? Res. Urban Policy 2003, 9, 103–140. [Google Scholar] [CrossRef]
- Streimikiene, D. Environmental Indicators for the Assessment of Quality of Life. Intellect. Econ. 2015, 9, 67–79. [Google Scholar] [CrossRef]
- Wen, T.; Lin, J.; Cai, J.; Yang, Z.S.; Ding, Y. Urban Amenity: A New Perspective and Empirical Testimony on China’s City Competitiveness Assessment. Geogr. Res 2016, 35, 214–226. [Google Scholar]
- Kang, Y.; Zhang, F.; Gao, S.; Lin, H.; Liu, Y. A Review of Urban Physical Environment Sensing Using Street View Imagery in Public Health Studies. Ann. GIS 2020, 26, 261–275. [Google Scholar] [CrossRef]
- Wu, Z.; Shen, Y.; Wang, H. Assessing Urban Areas’ Vulnerability to Flood Disaster Based on Text Data: A Case Study in Zhengzhou City. Sustainability 2019, 11, 4548. [Google Scholar]
- Liu, Y.; Liu, X.; Gao, S.; Gong, L.; Kang, C.; Zhi, Y.; Chi, G.; Shi, L. Social Sensing: A New Approach to Understanding Our Socioeconomic Environments. Ann. Assoc. Am. Geogr. 2015, 105, 512–530. [Google Scholar] [CrossRef]
- Min, W.; Mei, S.; Liu, L.; Wang, Y.; Jiang, S. Multi-Task Deep Relative Attribute Learning for Visual Urban Perception. IEEE Trans. Image Process. 2020, 29, 657–669. [Google Scholar] [CrossRef]
- Biljecki, F.; Ito, K. Street View Imagery in Urban Analytics and GIS: A Review. Landsc. Urban Plan. 2021, 215, 104217. [Google Scholar] [CrossRef]
- Liu, L.; Silva, E.A.; Wu, C.; Wang, H. A Machine Learning-Based Method for the Large-Scale Evaluation of the Qualities of the Urban Environment. Comput. Environ. Urban Syst. 2017, 65, 113–125. [Google Scholar] [CrossRef]
- Zhang, F.; Zhou, B.; Liu, L.; Liu, Y.; Fung, H.H.; Lin, H.; Ratti, C. Measuring Human Perceptions of a Large-Scale Urban Region Using Machine Learning. Landsc. Urban Plan. 2018, 180, 148–160. [Google Scholar] [CrossRef]
- Zhang, D. Research on Online Commentary Characteristics of Xitang Homestay Based on Network Text Analysis. Front. Manag. Res. 2019, 3, 157–164. [Google Scholar] [CrossRef]
- Bail, C.A. The Cultural Environment: Measuring Culture with Big Data. Theory Soc. 2014, 43, 465–482. [Google Scholar]
- Xu, J.; Xu, J.; Gu, Z.; Chen, G.; Li, M.; Wu, Z. Network Text Analysis of Visitors’ Perception of Multi-Sensory Interactive Experience in Urban Forest Parks in China. Forests 2022, 13, 1451. [Google Scholar] [CrossRef]
- Wang, S.; Qian, L.; Zhu, Y.; Song, J.; Lu, F.; Zeng, H.; Chen, P.; Yuan, W.; Li, W.; Geng, W. A Web Text Mining Approach for the Evaluation of Regional Characteristics at the Town Level. Trans. GIS 2021, 25, 2074–2103. [Google Scholar] [CrossRef]
- Yang, S.; Zhang, L.; Xu, L. Analysis of Tourism City Image Based on Big Data of Network Text—Take Guangzhou as an Example. IOP Conf. Ser. Mater. Sci. Eng. 2020, 806, 12048. [Google Scholar] [CrossRef]
- Zhang, F.; Zhang, D.; Liu, Y.; Lin, H. Representing Place Locales Using Scene Elements. Comput. Environ. Urban Syst. 2018, 71, 153–164. [Google Scholar] [CrossRef]
- Zhu, D.; Wang, N.; Wu, L.; Liu, Y. Street as a Big Geo-Data Assembly and Analysis Unit in Urban Studies: A Case Study Using Beijing Taxi Data. Appl. Geogr. 2017, 86, 152–164. [Google Scholar] [CrossRef]
- Algeciras, J.A.R.; Consuegra, L.G.; Matzarakis, A. Spatial-Temporal Study on the Effects of Urban Street Configurations on Human Thermal Comfort in the World Heritage City of Camagüey-Cuba. Build. Environ. 2016, 101, 85–101. [Google Scholar] [CrossRef]
- Gong, Z.; Ma, Q.; Kan, C.; Qi, Q. Classifying Street Spaces with Street View Images for a Spatial Indicator of Urban Functions. Sustainability 2019, 11, 6424. [Google Scholar] [CrossRef]
- Allocated, L.; Core, C. Streets as Public Spaces and Drivers of Urban Prosperity. Urban Prosper. 2013, 108. [Google Scholar]
- Nagata, S.; Nakaya, T.; Hanibuchi, T.; Amagasa, S.; Kikuchi, H.; Inoue, S. Objective Scoring of Streetscape Walkability Related to Leisure Walking: Statistical Modeling Approach with Semantic Segmentation of Google Street View Images. Health Place 2020, 66, 102428. [Google Scholar] [CrossRef]
- Villeneuve, P.J.; Ysseldyk, R.L.; Root, A.; Ambrose, S.; Dimuzio, J.; Kumar, N.; Shehata, M.; Xi, M.; Seed, E.; Li, X.; et al. Comparing the Normalized Difference Vegetation Index with the Google Street View Measure of Vegetation to Assess Associations between Greenness, Walkability, Recreational Physical Activity, and Health in Ottawa, Canada. Int. J. Environ. Res. Public Health 2018, 15, 1719. [Google Scholar] [CrossRef]
- Du, X.; Zhang, Y.; Lv, Z. Investigations and Analysis of Indoor Environment Quality of Green and Conventional Shopping Mall Buildings Based on Customers’ Perception. Build. Environ. 2020, 177, 106851. [Google Scholar] [CrossRef]
- Sant’Anna, D.O.; Dos Santos, P.H.; Vianna, N.S.; Romero, M.A. Indoor Environmental Quality Perception and Users’ Satisfaction of Conventional and Green Buildings in Brazil. Sustain. Cities Soc. 2018, 43, 95–110. [Google Scholar] [CrossRef]
- Liu, J.; Li, T.; Xie, P.; Du, S.; Teng, F.; Yang, X. Urban Big Data Fusion Based on Deep Learning: An Overview. Inf. Fusion 2020, 53, 123–133. [Google Scholar] [CrossRef]
- Cummins, R.A. Objective and Subjective Auality of Life: An Interactive Model. Soc. Indic. Res. 2000, 52, 55–72. [Google Scholar] [CrossRef]
- Liu, S.; Long, Y.; Zhang, L.; Liu, H. Quantifying and Characterizing Urban Leisure Activities by Merging Multiple Sensing Big Data: A Case Study of Nanjing, China. Land 2021, 10, 1214. [Google Scholar] [CrossRef]
- Hu, Y.; Han, Y. Identification of Urban Functional Areas Based on POI Data: A Case Study of the Guangzhou Economic and Technological Development Zone. Sustainability 2019, 11, 1385. [Google Scholar] [CrossRef]
- Li, Y.; Liu, C.; Li, Y. Identification of Urban Functional Areas and Their Mixing Degree Using Point of Interest Analyses. Land 2022, 11, 996. [Google Scholar] [CrossRef]
- Wang, Z.; Ma, D.; Sun, D.; Zhang, J. Identification and Analysis of Urban Functional Area in Hangzhou Based on OSM and POI Data. PLoS ONE 2021, 16, e0251988. [Google Scholar] [CrossRef] [PubMed]
- Rzotkiewicz, A.; Pearson, A.L.; Dougherty, B.V.; Shortridge, A.; Wilson, N. Systematic Review of the Use of Google Street View in Health Research: Major Themes, Strengths, Weaknesses and Possibilities for Future Research. Health Place 2018, 52, 240–246. [Google Scholar] [CrossRef]
- Zhang, Y.; Lu, J.; Liu, F.; Liu, Q.; Porter, A.; Chen, H.; Zhang, G. Does Deep Learning Help Topic Extraction? A Kernel k-Means Clustering Method with Word Embedding. J. Informetr. 2018, 12, 1099–1117. [Google Scholar] [CrossRef]
- Jatnika, D.; Bijaksana, M.A.; Suryani, A.A. Word2vec Model Analysis for Semantic Similarities in English Words. Procedia Comput. Sci. 2019, 157, 160–167. [Google Scholar] [CrossRef]
- Chen, N.; Zhang, Y.; Du, W.; Li, Y.; Chen, M.; Zheng, X. KE-CNN: A New Social Sensing Method for Extracting Geographical Attributes from Text Semantic Features and Its Application in Wuhan, China. Comput. Environ. Urban Syst. 2021, 88, 101629. [Google Scholar] [CrossRef]
- Devlin, J.; Chang, M.-W.; Lee, K.; Toutanova, K. Bert: Pre-Training of Deep Bidirectional Transformers for Language Understanding. arXiv 2018, arXiv:1810.04805. [Google Scholar]
- Zhang, S.; Wei, Z.; Wang, Y.; Liao, T. Sentiment Analysis of Chinese Micro-Blog Text Based on Extended Sentiment Dictionary. Futur. Gener. Comput. Syst. 2018, 81, 395–403. [Google Scholar] [CrossRef]
- Larkin, A.; Gu, X.; Chen, L.; Hystad, P. Predicting Perceptions of the Built Environment Using GIS, Satellite and Street View Image Approaches. Landsc. Urban Plan. 2021, 216, 104257. [Google Scholar] [CrossRef]
- Li, Y.; Peng, L.; Wu, C.; Zhang, J. Street View Imagery (SVI) in the Built Environment: A Theoretical and Systematic Review. Buildings 2022, 12, 1167. [Google Scholar] [CrossRef]
- Cohen-Cline, H.; Turkheimer, E.; Duncan, G.E. Access to Green Space, Physical Activity and Mental Health: A Twin Study. J. Epidemiol. Community Health 2015, 69, 523–529. [Google Scholar] [CrossRef] [PubMed]
- Dai, L.; Zheng, C.; Dong, Z.; Yao, Y.; Wang, R.; Zhang, X.; Ren, S.; Zhang, J.; Song, X.; Guan, Q. Analyzing the Correlation between Visual Space and Residents ’ Psychology in Wuhan, China Using Street-View Images and Deep-Learning Technique. City Environ. Interact. 2021, 11, 100069. [Google Scholar] [CrossRef]
- Zhou, H.; He, S.; Cai, Y.; Wang, M.; Su, S. Social Inequalities in Neighborhood Visual Walkability: Using Street View Imagery and Deep Learning Technologies to Facilitate Healthy City Planning. Sustain. Cities Soc. 2019, 50, 101605. [Google Scholar] [CrossRef]
- Alkhresheh, M.M. Enclosure as a Function of Height-to-Width Ratio and Scale: Its Influence on User’s Sense of Comfort and Safety in Urban Street Space; University of Florida: Gainesville, FL, USA, 2007. [Google Scholar]
- Agampatian, R. Using GIS to Measure Walkability: A Case Study in New York City. Master’s Thesis, School of Architecture and the Built Environment, KTH Royal Institute of Technology, Stockholm, Sweden, 2014. [Google Scholar]
- Liu, R.; He, D. Semantic Segmentation Based on Deeplabv3+ and Attention Mechanism. In Proceedings of the 2021 IEEE 4th Advanced Information Management, Communicates, Electronic and Automation Control Conference (IMCEC), Chongqing, China, 18–20 June 2021; Volume 4, pp. 255–259. [Google Scholar]
- Vaidya, O.S.; Kumar, S. Analytic Hierarchy Process: An Overview of Applications. Eur. J. Oper. Res. 2006, 169, 1–29. [Google Scholar] [CrossRef]
- Fang, Y.; Jin, X.; Huang, C.; Zhang, Z. Entropy-Based Method for Evaluating Contact Strain-Energy Distribution for Assembly Accuracy Prediction. Entropy 2017, 19, 49. [Google Scholar] [CrossRef]
- Liu, S.; Zhang, L.; Long, Y.; Long, Y.; Xu, M. A New Urban Vitality Analysis and Evaluation Framework Based on Human Activity Modeling Using Multi-Source Big Data. ISPRS Int. J. Geo Inf. 2020, 9, 617. [Google Scholar] [CrossRef]
- Gao, F.; Deng, X.; Liao, S.; Liu, Y.; Li, H.; Li, G.; Chen, W. Portraying Business District Vibrancy with Mobile Phone Data and Optimal Parameters-Based Geographical Detector Model. Sustain. Cities Soc. 2023, 96, 104635. [Google Scholar] [CrossRef]
- Waltert, F.; Schläpfer, F. Landscape Amenities and Local Development: A Review of Migration, Regional Economic and Hedonic Pricing Studies. Ecol. Econ. 2010, 70, 141–152. [Google Scholar] [CrossRef]
- Zheng, L. What City Amenities Matter in Attracting Smart People? Pap. Reg. Sci. 2016, 95, 309–327. [Google Scholar] [CrossRef]


| Data | Content | Source | Time |
|---|---|---|---|
| POI | 48,372 points’ coordinates and their attributes | Amap | April 2020 |
| AOI | 267 polygons with different functional attributes | ||
| BMSV images | 82,808 street sampling points along with the transportation network | Baidu Maps | |
| Roads | 1787 urban roads | ||
| Web comment text | 1,800,000 reviews with targets and date-times of 6 years | Dianping website | 1 January 2017~ 31 December 2022 |
| Grade | Word | Number | Adjust Value of Negative | Adjust Value of Positive |
|---|---|---|---|---|
| over | a little over, far more than, unduly… | 25 | 0.25 | 0.25 |
| Most/extremely | completely, unparalleled, extremely… | 64 | 0.20 | 0.20 |
| very | very much, specifically, a lot, too… | 42 | 0.15 | 0.15 |
| more | more and more, fully, all the more… | 36 | 0.10 | 0.10 |
| slightly | a few, not so, mildly… | 34 | −0.10 | −0.05 |
| insufficient | not really, a little less, not too… | 13 | −0.05 | −0.10 |
| exclamation mark | !, ! | 2 | 0.05 | 0.05 |
| question mark | ?, ? | 2 | 1-value 1 | 1-value 1 |
| Features | Quantitative Methods |
|---|---|
| Greenness | |
| Openness | |
| Walkability | |
| Enclosure |
| Feature Words | Sub-Features | Main Features |
|---|---|---|
| not far, distant, transportation, conveniently, parking, car parks… | Convenience | Convenience |
| lofty, spacious, bright… | Spaciousness | Physical setting |
| facilities, equipment… | facility | |
| decoration, arrangement, design, layout… | Decoration | |
| hygiene, tidy, clean… | Hygiene condition | Hygiene condition |
| style, characteristic, grace, architectural style… | Characteristic | Characteristic |
| one-stop, eat and drink, ‘eat, drink and be merry’, have all one needs, everything is there… | Functionality | Functionality |
| signboards, counters, old brand… | Grade | Reputation |
| too prosperous, prosperous, waiting for a seat, queue up… | Popularity | |
| pedestrian flow, overcrowded, traffic… | Crowding | Crowding |
| kids, little ones, childhood… | Child-friendly | Child-friendly |
| expensive, price, cheap, value for money… | Price level | Consumption level |
| special offers, discount, group buying… | Strength of offer | |
| taste, good to drink, menu, fresh… | Dining quality | Dining quality |
| service attitude, service, hospitality… | Service | Service |
| Sources of Perception | Perspective Weight (%) | Features | Weight (%) |
|---|---|---|---|
| Comment text | 75 | Convenience | 11.60 |
| Physical setting | 10.02 | ||
| Hygiene condition | 15.44 | ||
| Characteristic | 4.08 | ||
| Functionality | 5.79 | ||
| Reputation | 14.45 | ||
| Child-friendly | 8.75 | ||
| Consumption level | 9.05 | ||
| Dining quality | 5.35 | ||
| Service | 15.47 | ||
| Street view image | 25 | Greenery | 10.46 |
| Openness | 26.66 | ||
| Enclosure | 23.47 | ||
| Walkability | 40.40 |
| Level | Statistics Interval |
|---|---|
| 1 | 0~0.472105 |
| 2 | 0.472106~0.522661 |
| 3 | 0.522662~0.567656 |
| 4 | 0.567657~0.634740 |
| 5 | 0.634741~1 |
Disclaimer/Publisher’s Note: The statements, opinions and data contained in all publications are solely those of the individual author(s) and contributor(s) and not of MDPI and/or the editor(s). MDPI and/or the editor(s) disclaim responsibility for any injury to people or property resulting from any ideas, methods, instructions or products referred to in the content. |
© 2023 by the authors. Licensee MDPI, Basel, Switzerland. This article is an open access article distributed under the terms and conditions of the Creative Commons Attribution (CC BY) license (https://creativecommons.org/licenses/by/4.0/).
Share and Cite
Chen, X.; Zhang, L.; Zhao, Z.; Zhang, F.; Liu, S.; Long, Y. Characterizing and Measuring the Environmental Amenities of Urban Recreation Leisure Regions Based on Image and Text Fusion Perception: A Case Study of Nanjing, China. Land 2023, 12, 1998. https://doi.org/10.3390/land12111998
Chen X, Zhang L, Zhao Z, Zhang F, Liu S, Long Y. Characterizing and Measuring the Environmental Amenities of Urban Recreation Leisure Regions Based on Image and Text Fusion Perception: A Case Study of Nanjing, China. Land. 2023; 12(11):1998. https://doi.org/10.3390/land12111998
Chicago/Turabian StyleChen, Xiawei, Ling Zhang, Zheyuan Zhao, Fengji Zhang, Shaojun Liu, and Yi Long. 2023. "Characterizing and Measuring the Environmental Amenities of Urban Recreation Leisure Regions Based on Image and Text Fusion Perception: A Case Study of Nanjing, China" Land 12, no. 11: 1998. https://doi.org/10.3390/land12111998